Embed Size (px)
Citation preview
THIRD QUARTER 2016 RESULTS10 NOVEMBER 2016
LUCA BETTONTE, CEO
1
2
DISCLAIMER
This document contains certain forward-looking information that is subject to a number of factors that may influence the accuracy of the statements and the projections upon which the statements are based.There can be non assurance that the projections or forecasts will ultimately prove to be accurate; accordingly, the Company makes no representation or warranty as to the accuracy of such information or the likelihood that the Company will perform as projected.

3
3Q 2016 Highlights✓ Key Figures✓ One Company: a leaner Group Structure
Results Review✓ Business Environment✓ 3Q 2016 Group EBITDA✓ Results by Segments
Key Financials✓ Profit & Loss✓ Investments ✓ Cash Flow Statement
2016 Guidance and ConclusionsAppendix
AGENDA
4
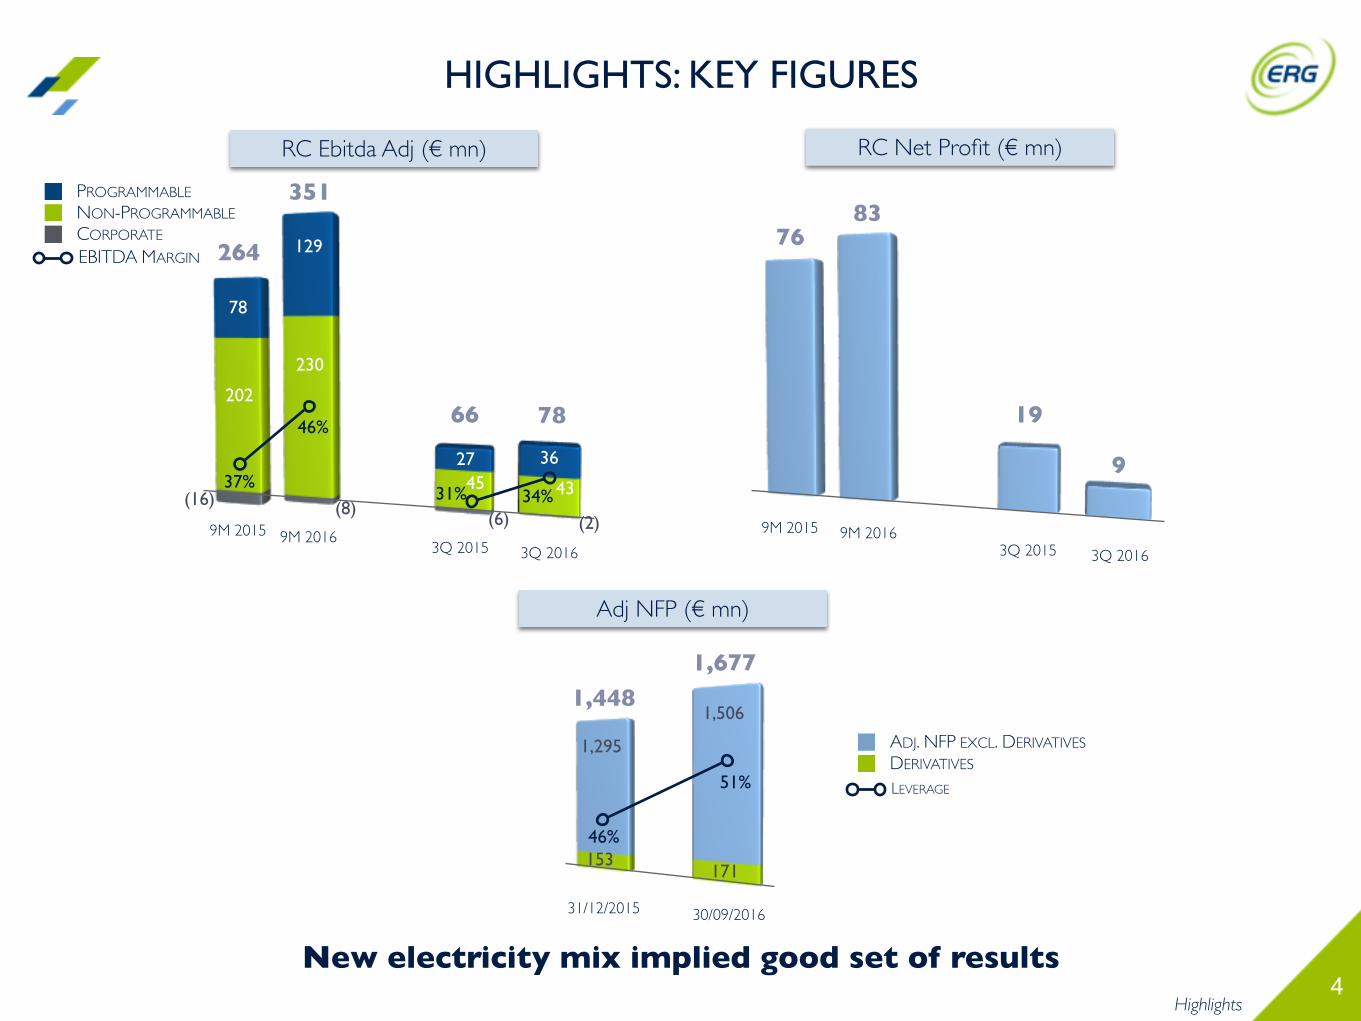
RC Ebitda Adj (€ mn) RC Net Profit (€ mn)
New electricity mix implied good set of resultsHighlights
351
129
230
(8)
CORPORATE
NON-PROGRAMMABLE
PROGRAMMABLE
LEVERAGE
DERIVATIVES
ADJ. NFP EXCL. DERIVATIVES
46%
51%
30/09/2016
1,506
171
1,295
153
Adj NFP (€ mn)
31/12/2015
78
1,677
43
36
3Q 2015
7683
HIGHLIGHTS: KEY FIGURES
9M 2015 (2)9M 20169M 2015
1,448
3Q 20169M 2016
264
78
20266
4527
(6)(16)
3Q 2015 3Q 2016
19
937%
46%
EBITDA MARGIN
34%31%
5Highlights
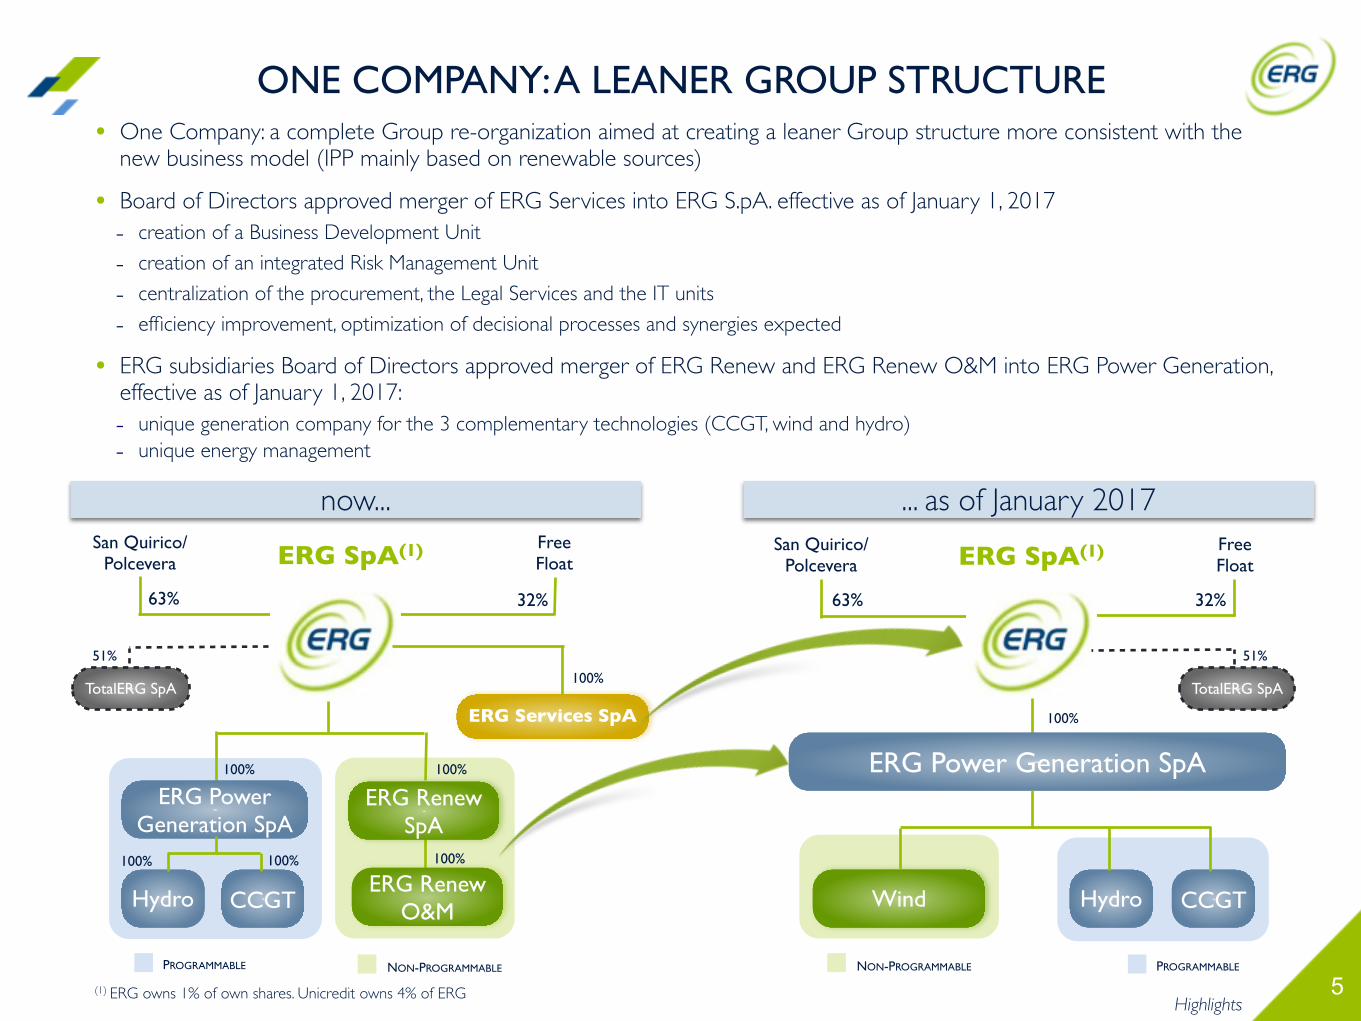
ONE COMPANY: A LEANER GROUP STRUCTURE• One Company: a complete Group re-organization aimed at creating a leaner Group structure more consistent with the
new business model (IPP mainly based on renewable sources)
• Board of Directors approved merger of ERG Services into ERG S.pA. effective as of January 1, 2017- creation of a Business Development Unit
- creation of an integrated Risk Management Unit
- centralization of the procurement, the Legal Services and the IT units
- efficiency improvement, optimization of decisional processes and synergies expected
• ERG subsidiaries Board of Directors approved merger of ERG Renew and ERG Renew O&M into ERG Power Generation, effective as of January 1, 2017:- unique generation company for the 3 complementary technologies (CCGT, wind and hydro)- unique energy management
now... ... as of January 2017
NON-PROGRAMMABLEPROGRAMMABLE
(1) ERG owns 1% of own shares. Unicredit owns 4% of ERG
NON-PROGRAMMABLE PROGRAMMABLE
100%
ERG Services SpA
100%
32%63%
San Quirico/Polcevera
Free FloatERG SpA(1)
100%100%
ERG Power Generation SpA
Hydro CCGTERG Renew
O&M
ERG Renew SpA
100%
100%
51%
TotalERG SpA
100%
32%63%
San Quirico/Polcevera
Free FloatERG SpA(1)
51%
TotalERG SpA
Hydro CCGTWind
ERG Power Generation SpA
6
RESULTS REVIEW
PAOLO MERLI, CFO
63%
4%3%5%
15%
10%
3Q 2015 4Q 2015 1Q 2016 2Q 2016 3Q 2016
7Results Review
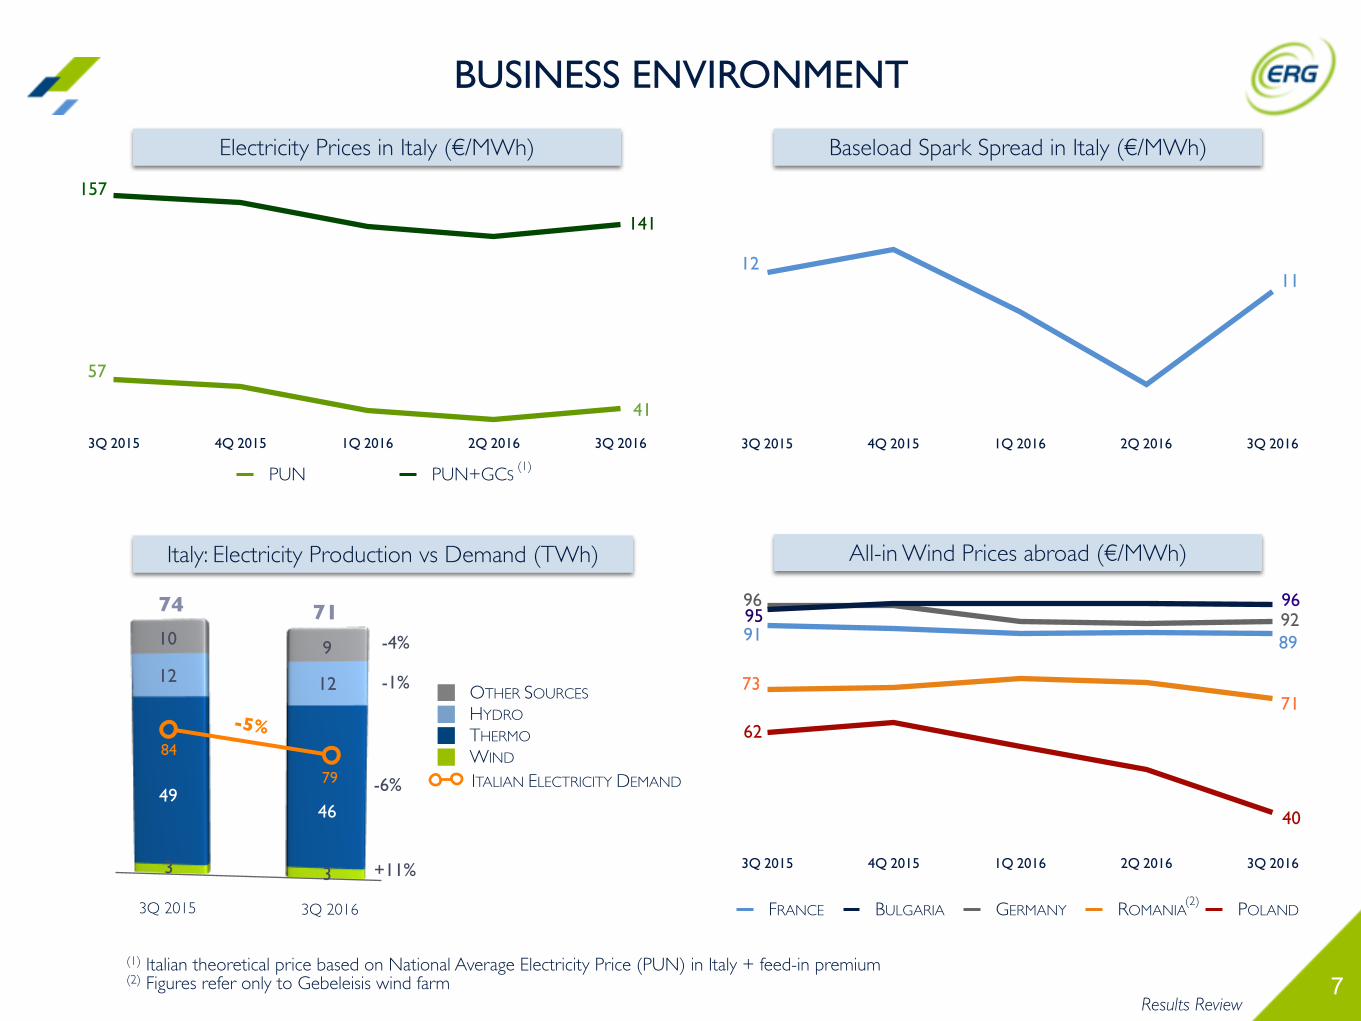
Electricity Prices in Italy (€/MWh)
57
41
(1) Italian theoretical price based on National Average Electricity Price (PUN) in Italy + feed-in premium(2) Figures refer only to Gebeleisis wind farm
3Q 2015 4Q 2015 1Q 2016 2Q 2016 3Q 2016
Baseload Spark Spread in Italy (€/MWh)
12
PUN PUN+GCS
157
141
Italy: Electricity Production vs Demand (TWh)
BUSINESS ENVIRONMENT
WIND
THERMO
HYDRO
OTHER SOURCES
ITALIAN ELECTRICITY DEMAND
(1)
84
79
46
3
49
3
74 71
1212
-5%
3Q 20163Q 2015
-4%
-6%
+11%
910
-1%
FRANCE BULGARIA GERMANY ROMANIA POLAND
3Q 2015 4Q 2015 1Q 2016 2Q 2016 3Q 2016
All-in Wind Prices abroad (€/MWh)
91 89
9695
96
71 73
92
40
62
(2)
11
8
1,292
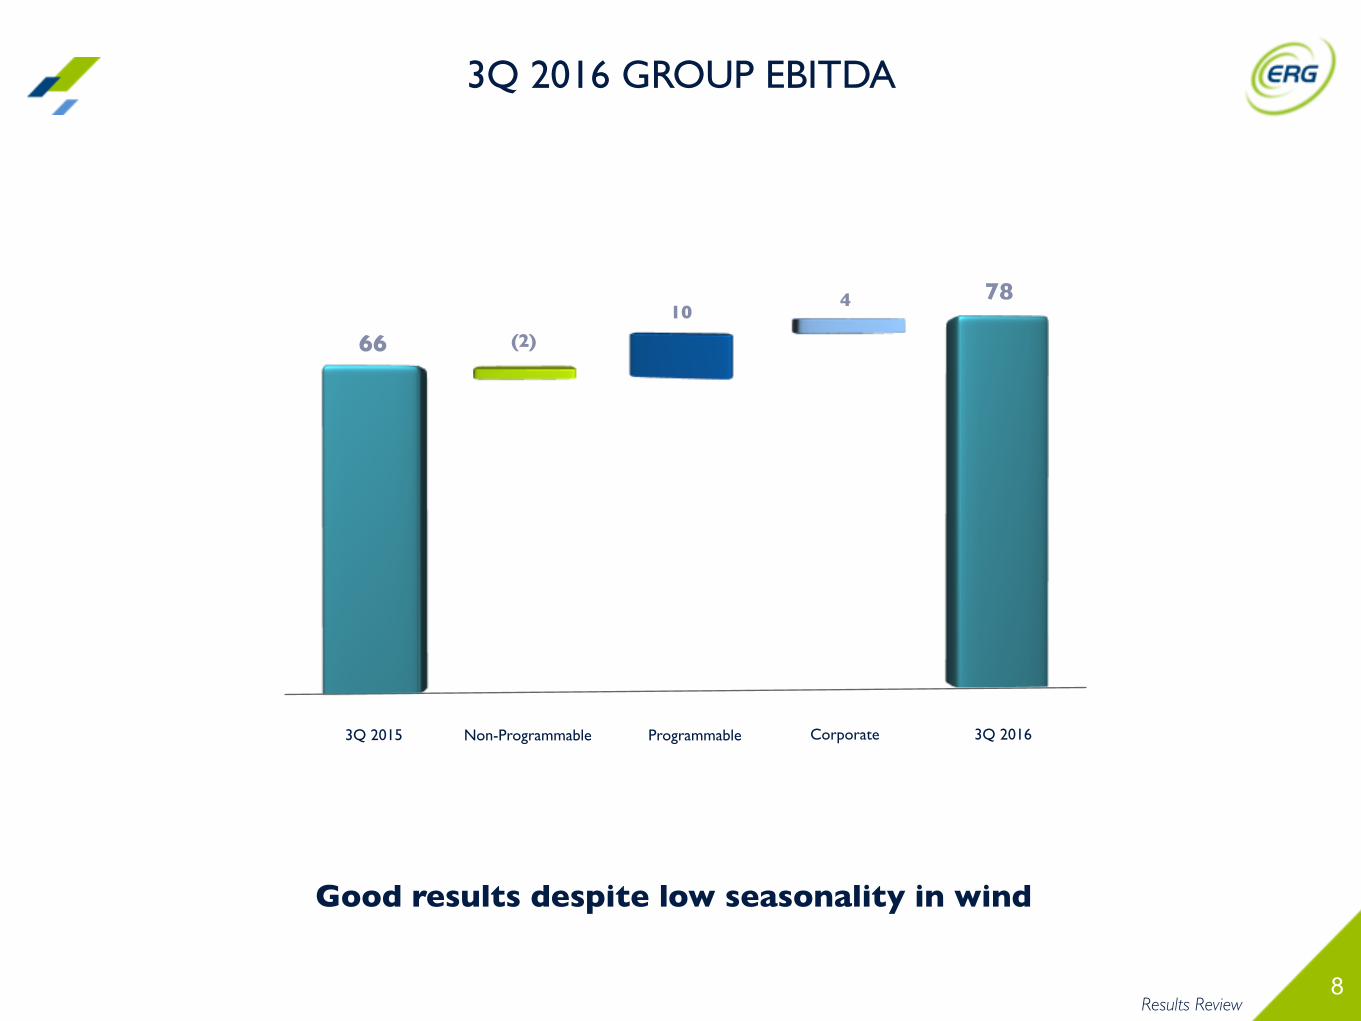
3Q 2015
66 (2)
104
ProgrammableNon-Programmable Corporate 3Q 2016
78
Results Review
3Q 2016 GROUP EBITDA
Good results despite low seasonality in wind
9
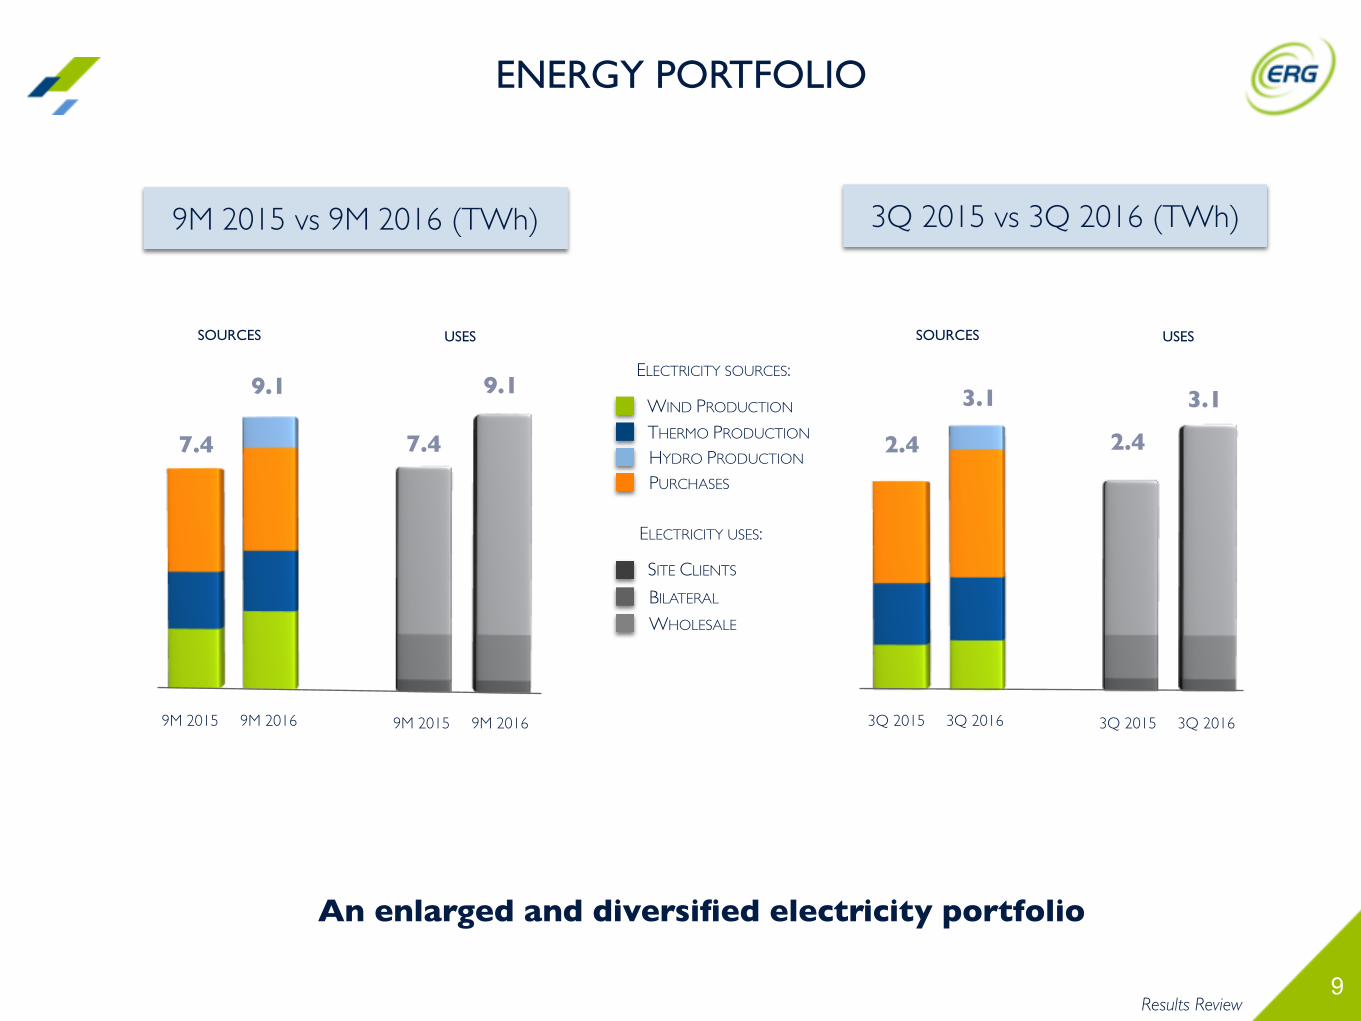
9M 2015 vs 9M 2016 (TWh)
An enlarged and diversified electricity portfolio
Results Review
9.1
7.4
3Q 2015 vs 3Q 2016 (TWh)
3.1
2.4
9M 20169M 2015
SOURCES USES
WIND PRODUCTION
THERMO PRODUCTION
PURCHASES
HYDRO PRODUCTION
ELECTRICITY SOURCES:
SITE CLIENTS
BILATERAL
WHOLESALE
ELECTRICITY USES:
3.1
2.4
ENERGY PORTFOLIO
SOURCES USES
9M 20169M 2015 3Q 20163Q 2015 3Q 20163Q 2015
9.1
7.4
10
RC Ebitda (€ mn)
2,011
Volumes (GWh)
8
174
Results Review
1
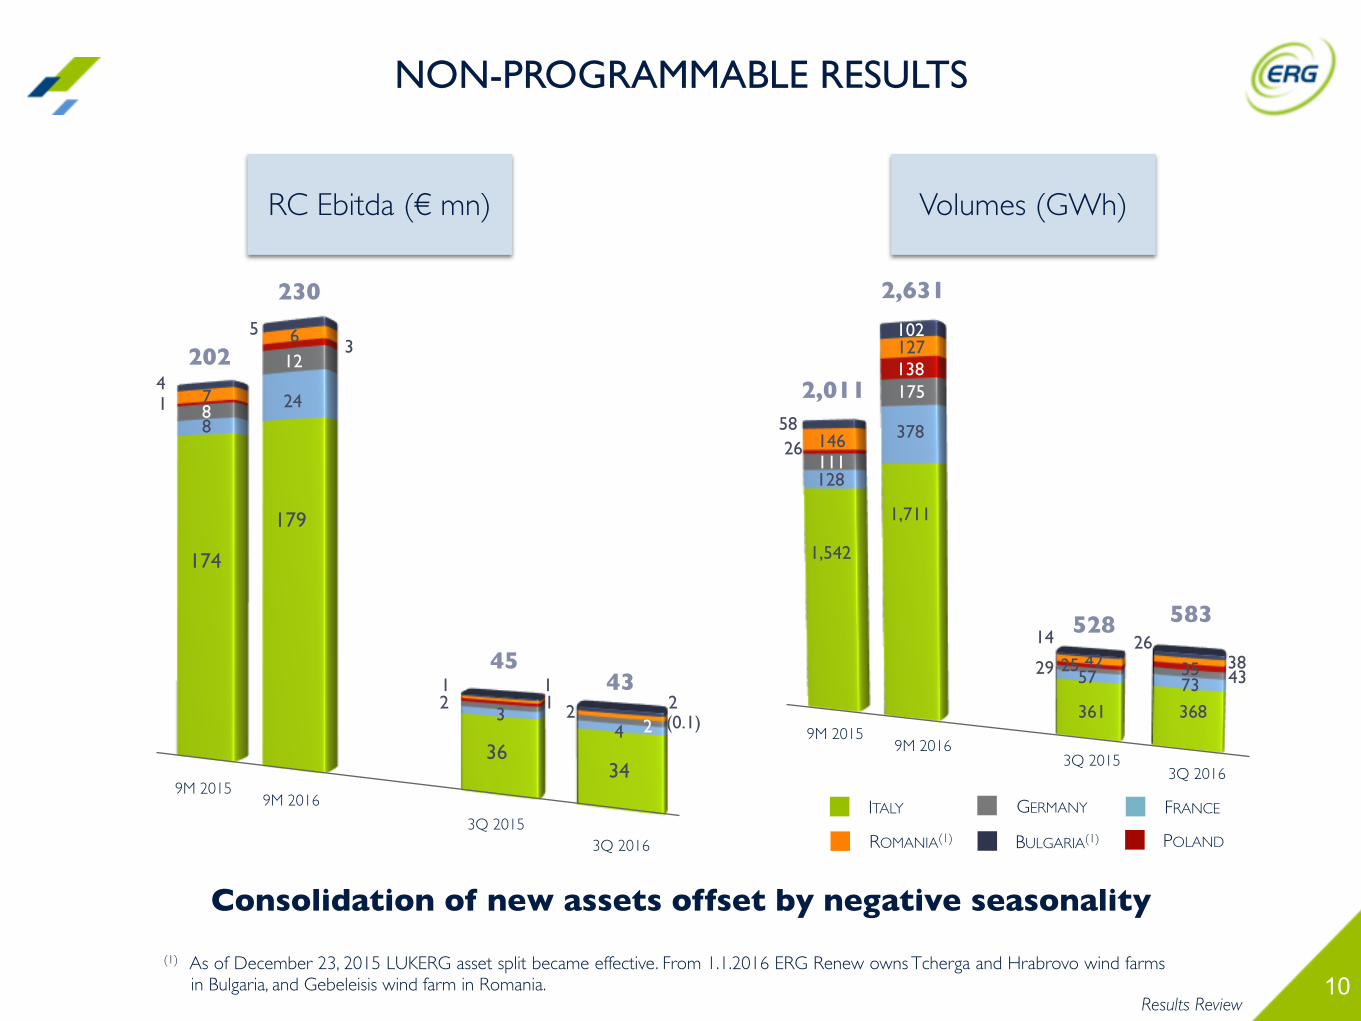
(1) As of December 23, 2015 LUKERG asset split became effective. From 1.1.2016 ERG Renew owns Tcherga and Hrabrovo wind farms in Bulgaria, and Gebeleisis wind farm in Romania.
202
9M 2016
Consolidation of new assets offset by negative seasonality
2,631
1,542
175
378
1,711
230
3
179
12
24
128
58146111
6
138
NON-PROGRAMMABLE RESULTS
7
5
ITALY FRANCE
ROMANIA(1)
GERMANY
POLANDBULGARIA(1)
46
102
9M 20153Q 2016
3Q 2015
3Q 20163Q 2015
45431
36
23
1(0.1)
34
24
12
127
583
3873368
3526
43
52842
57
361
29
14
9M 20169M 2015
4
2
26
25
8
11
RC Ebitda (€ mn)
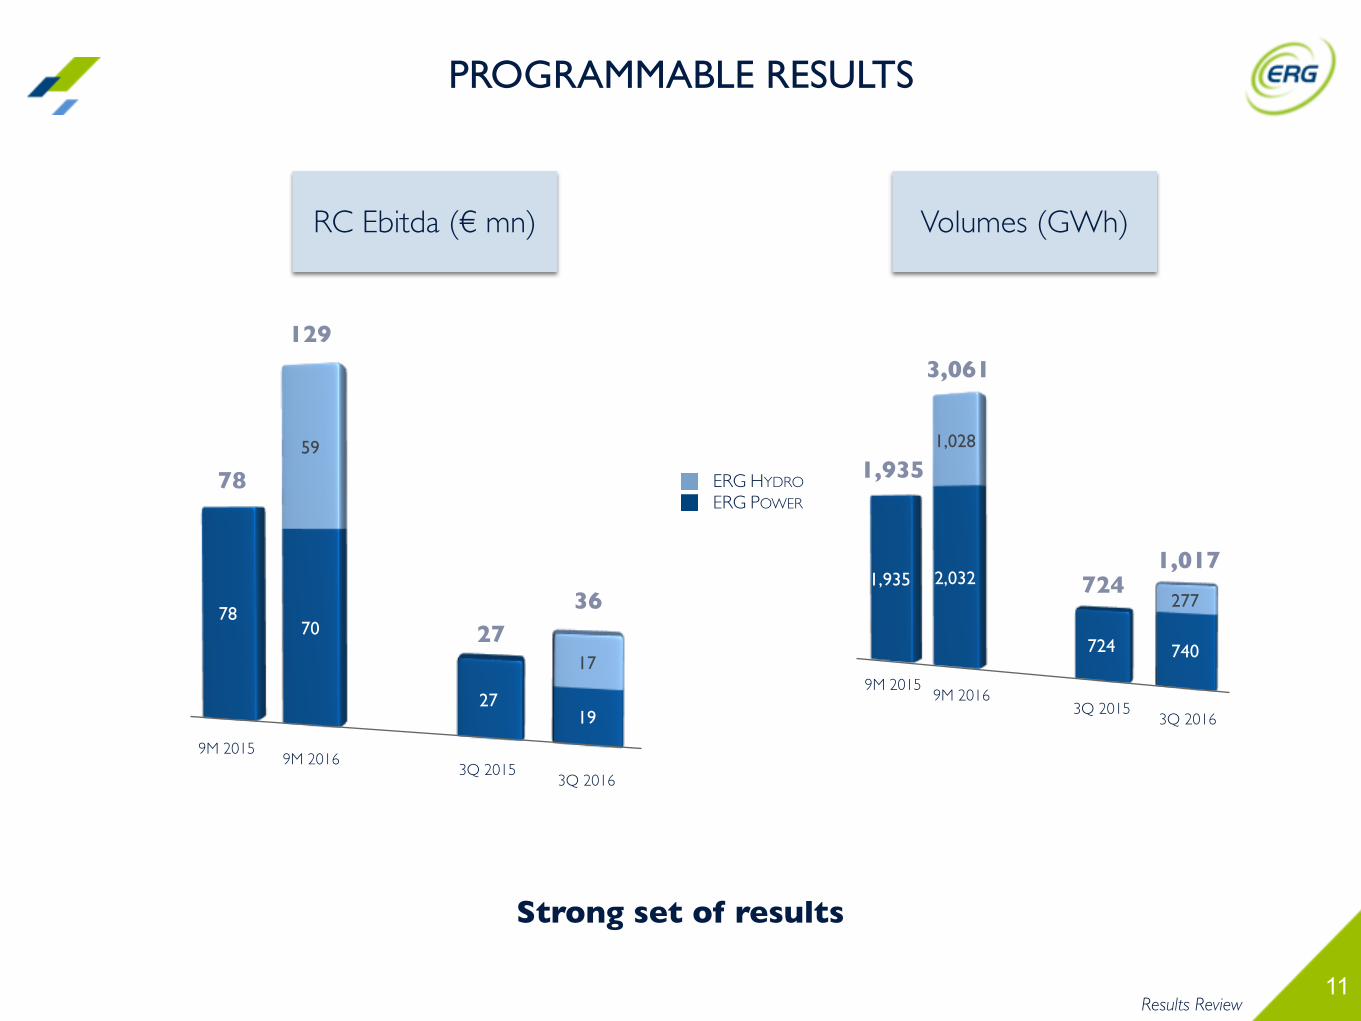
Strong set of results
Results Review
7870
2719
59
17
3Q 20163Q 2015
78
129
ERG POWER
ERG HYDRO
Volumes (GWh)
1,935 2,032
724 740
1,028
277
1,017
1,935
PROGRAMMABLE RESULTS
9M 20169M 2015
2736
3,061
724
3Q 20163Q 2015
9M 20169M 2015
12
(€ mn)
CORPORATE
NON-PROGRAMMABLE
PROGRAMMABLE
HYDRO
146
Results Review
3Q 2016
337
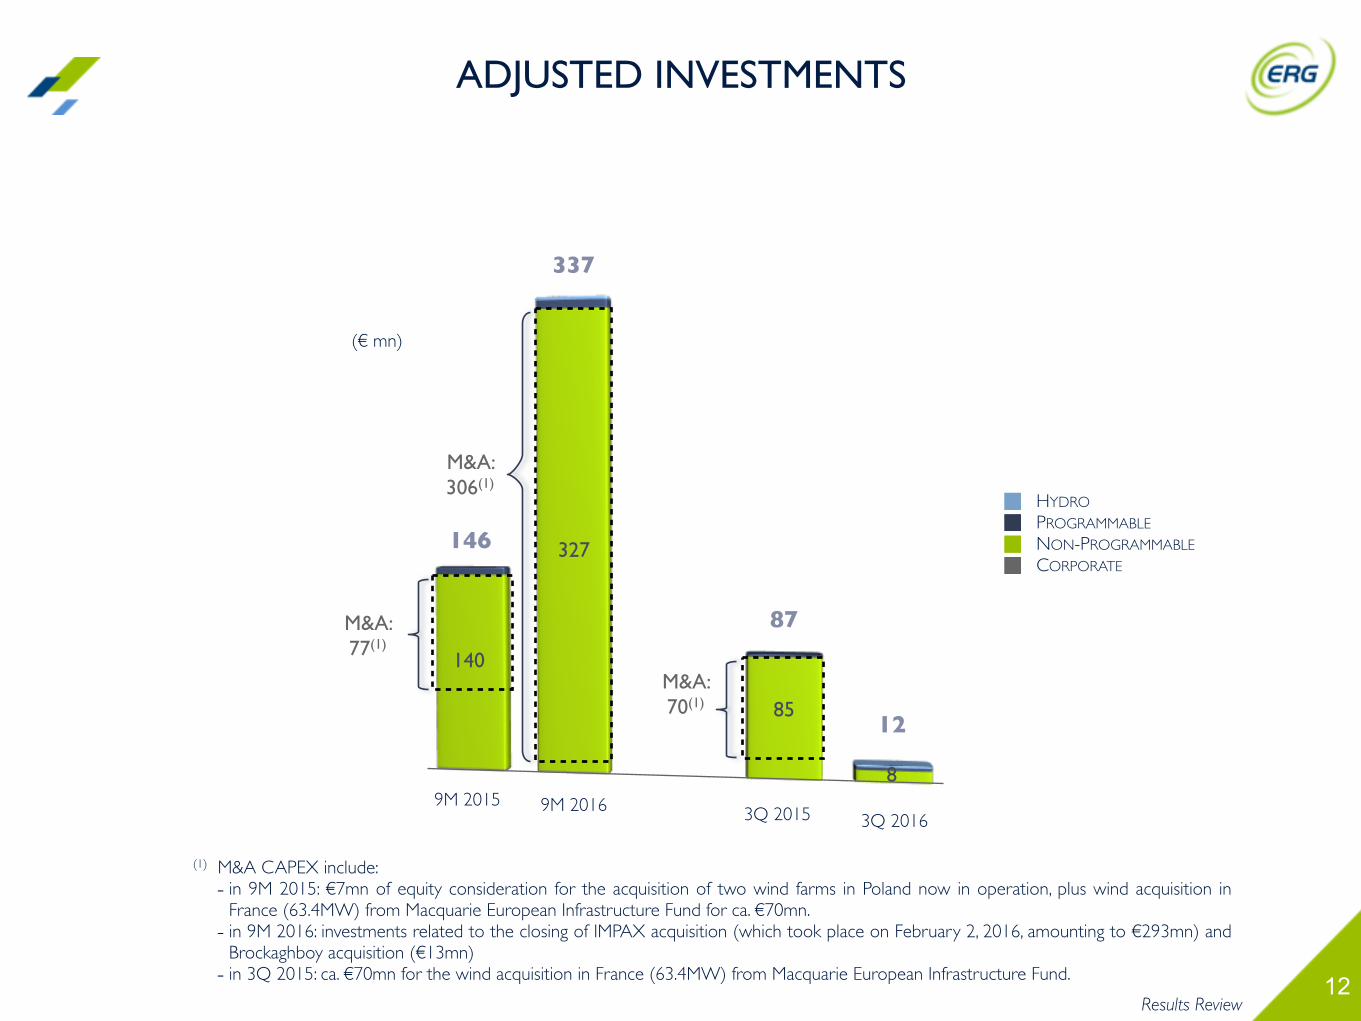
ADJUSTED INVESTMENTS
327
140
9M 2015
M&A: 306(1)
(1) M&A CAPEX include:- in 9M 2015: €7mn of equity consideration for the acquisition of two wind farms in Poland now in operation, plus wind acquisition in
France (63.4MW) from Macquarie European Infrastructure Fund for ca. €70mn.- in 9M 2016: investments related to the closing of IMPAX acquisition (which took place on February 2, 2016, amounting to €293mn) and
Brockaghboy acquisition (€13mn)- in 3Q 2015: ca. €70mn for the wind acquisition in France (63.4MW) from Macquarie European Infrastructure Fund.
3Q 20159M 2016
12
8
85
87M&A: 77(1)
M&A: 70(1)
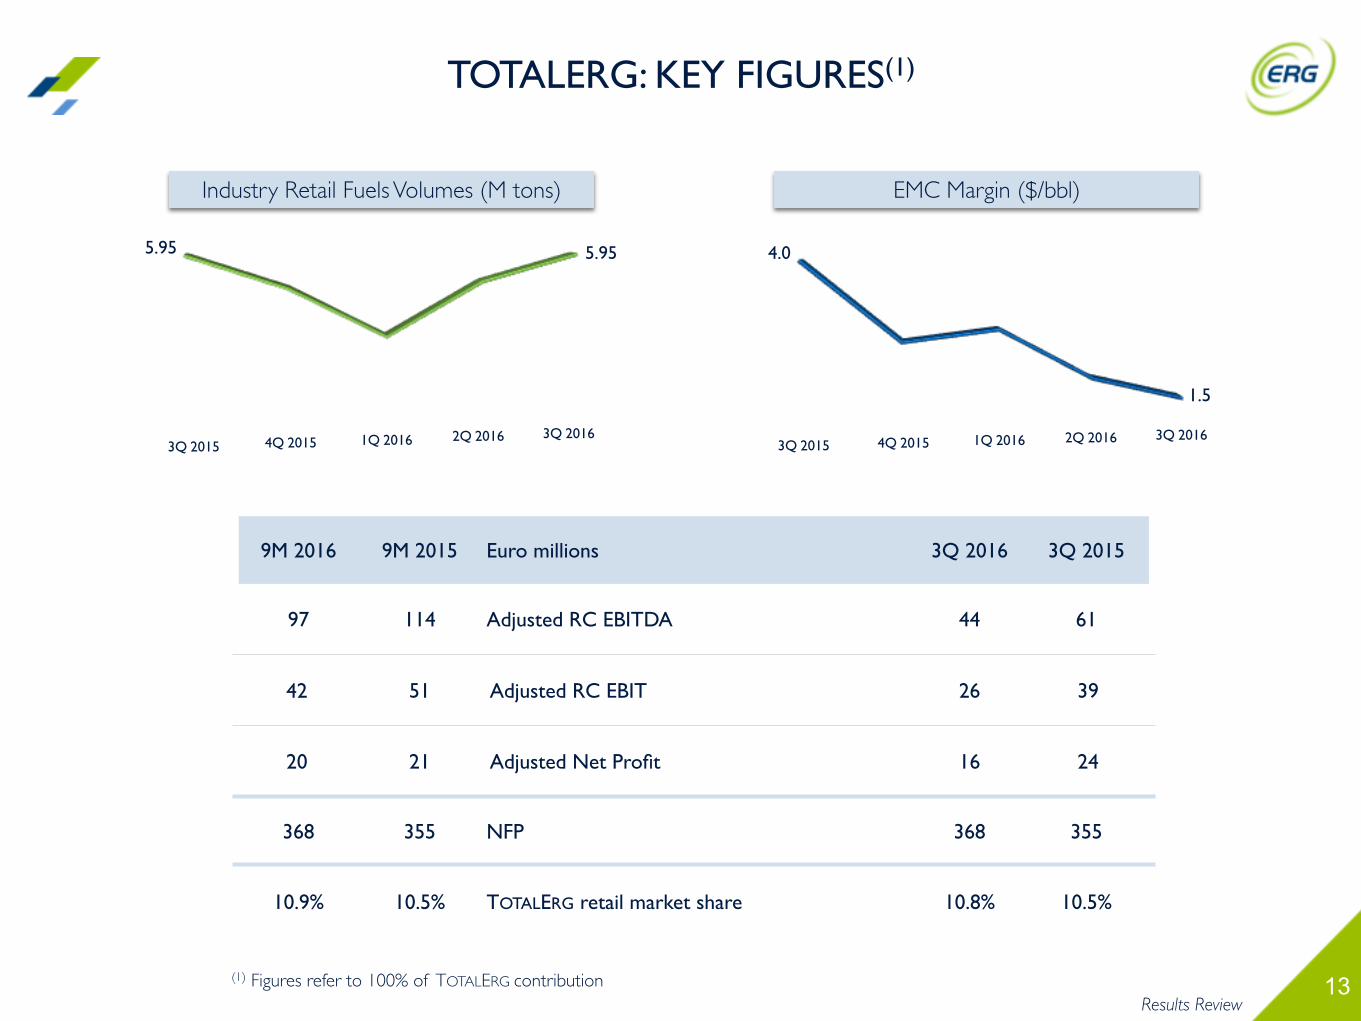
13(1) Figures refer to 100% of TOTALERG contribution
9M 2016 9M 2015 Euro millions 3Q 2016 3Q 2015
97 114 Adjusted RC EBITDA 44 61
42 51 Adjusted RC EBIT 26 39
20 21 Adjusted Net Profit 16 24
368 355 NFP 368 355
10.9% 10.5% TOTALERG retail market share 10.8% 10.5%
3Q 2015 4Q 2015 1Q 2016 2Q 2016 3Q 2016
Industry Retail Fuels Volumes (M tons)
5.95
3Q 2015 4Q 2015 1Q 2016 2Q 2016 3Q 2016
EMC Margin ($/bbl)
4.0
1.5
Results Review
TOTALERG: KEY FIGURES(1)
5.95
14
KEY FINANCIALS
15
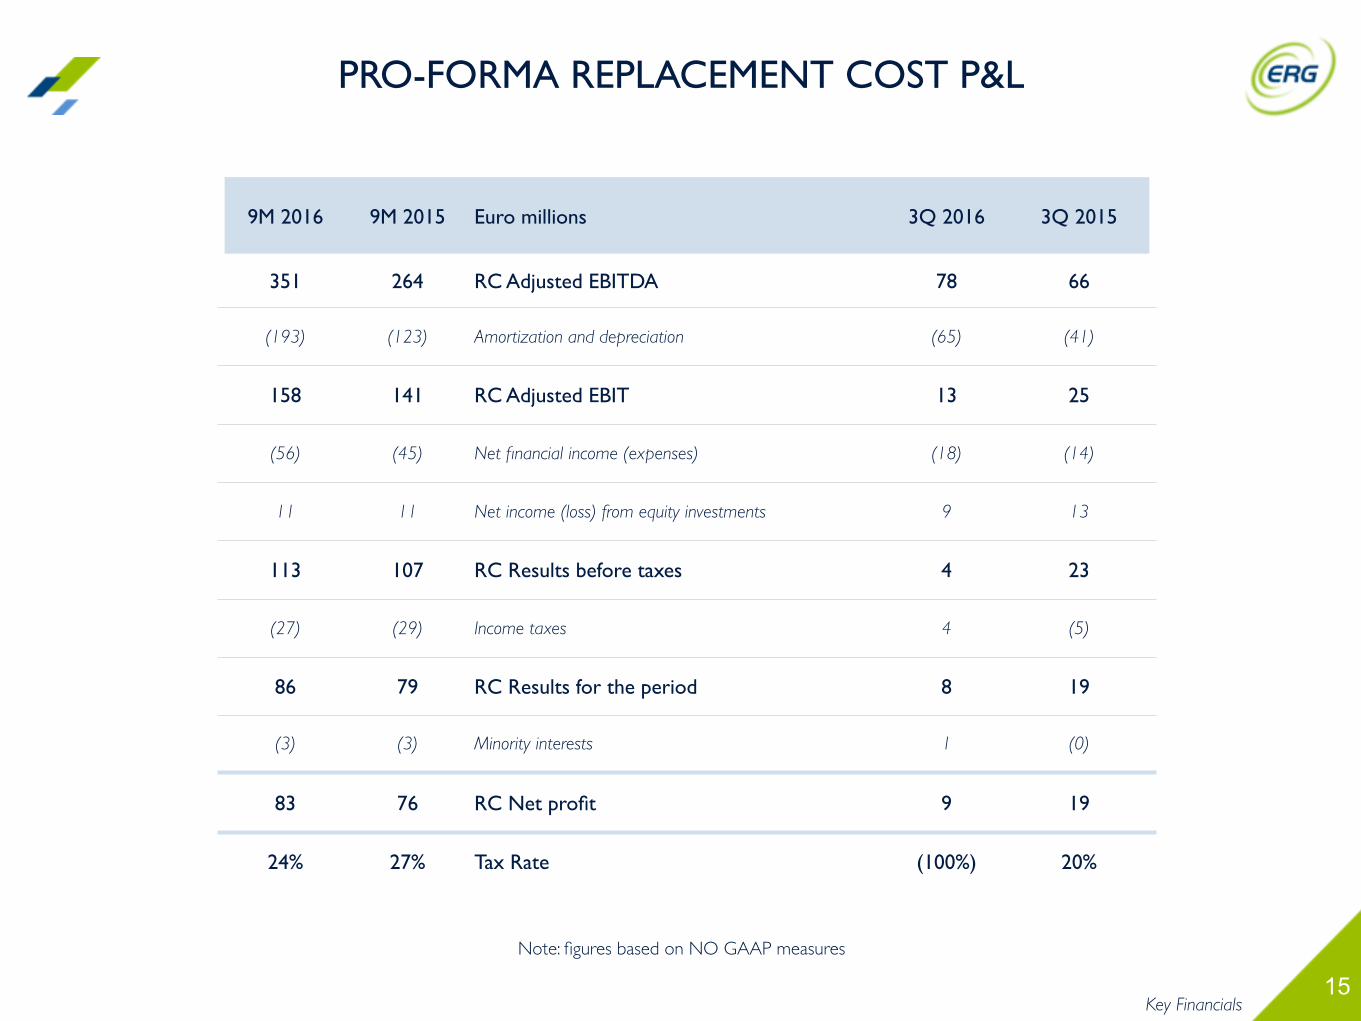
Note: figures based on NO GAAP measures
Key Financials
9M 2016 9M 2015 Euro millions 3Q 2016 3Q 2015
351 264 RC Adjusted EBITDA 78 66
(193) (123) Amortization and depreciation (65) (41)
158 141 RC Adjusted EBIT 13 25
(56) (45) Net financial income (expenses) (18) (14)
11 11 Net income (loss) from equity investments 9 13
113 107 RC Results before taxes 4 23
(27) (29) Income taxes 4 (5)
86 79 RC Results for the period 8 19
(3) (3) Minority interests 1 (0)
83 76 RC Net profit 9 19
24% 27% Tax Rate (100%) 20%
PRO-FORMA REPLACEMENT COST P&L
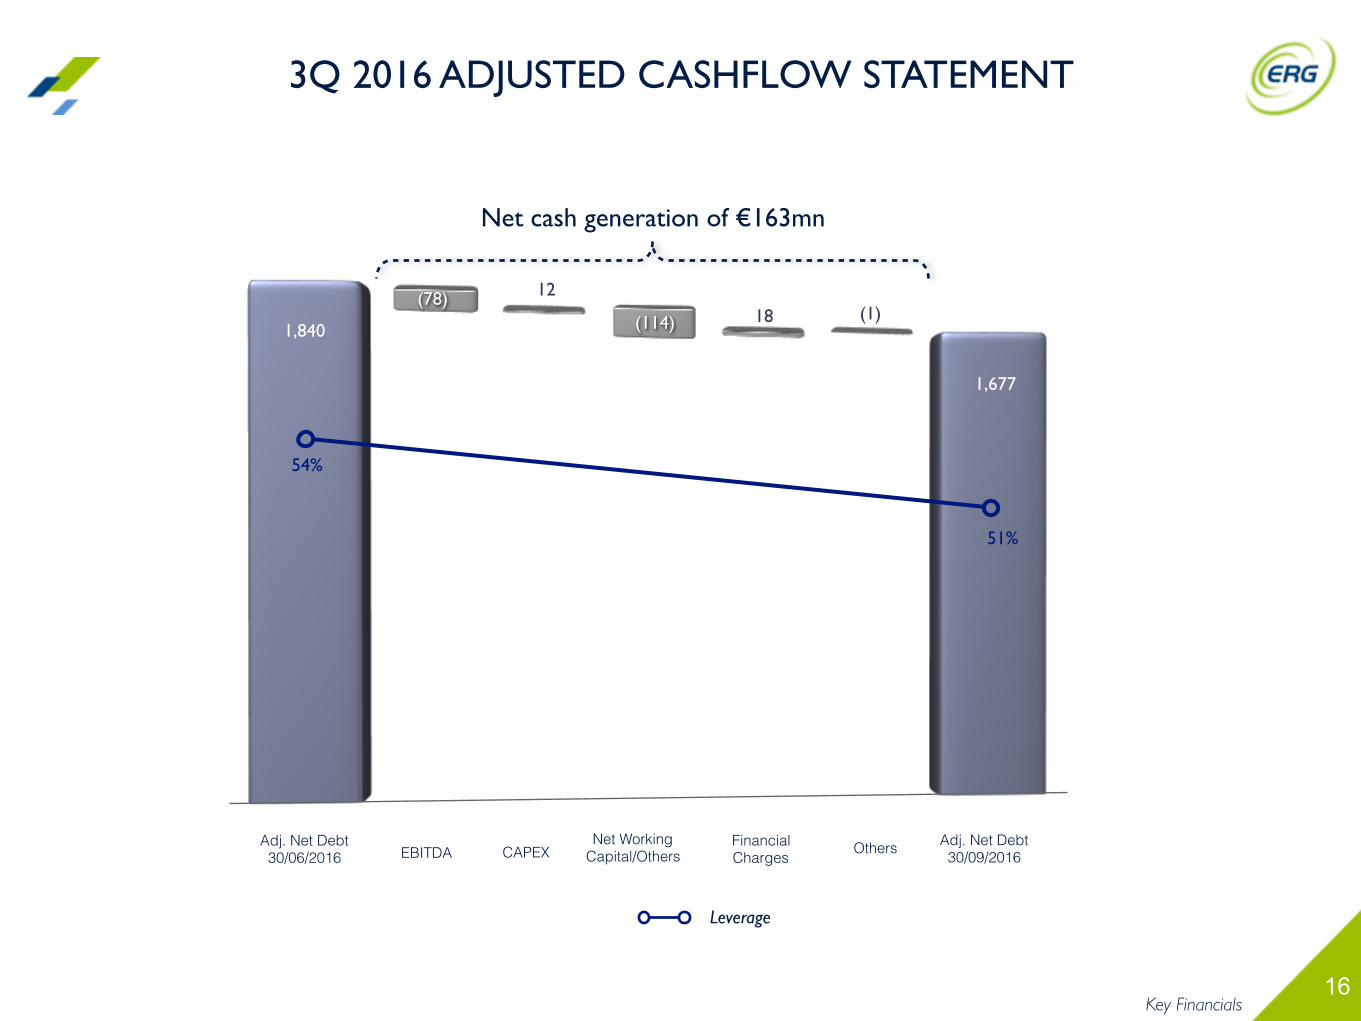
16
1,677
51%
54%
EBITDA CAPEXFinancial Charges
Adj. Net Debt30/09/2016
Leverage
(78)(114) (1)
1218
Others
3Q 2016 ADJUSTED CASHFLOW STATEMENT
1,840
Net WorkingCapital/Others
Net cash generation of €163mn
Adj. Net Debt30/06/2016
Key Financials
17
2016 GUIDANCE AND CONCLUSIONS
LUCA BETTONTE, CEO
18
351
9M 2016 2016 FCST
337(1)
LIQUIDITY PF OTHER AT MLT
1,677
NON-PROGRAMMABLE CORPORATEPROGRAMMABLE
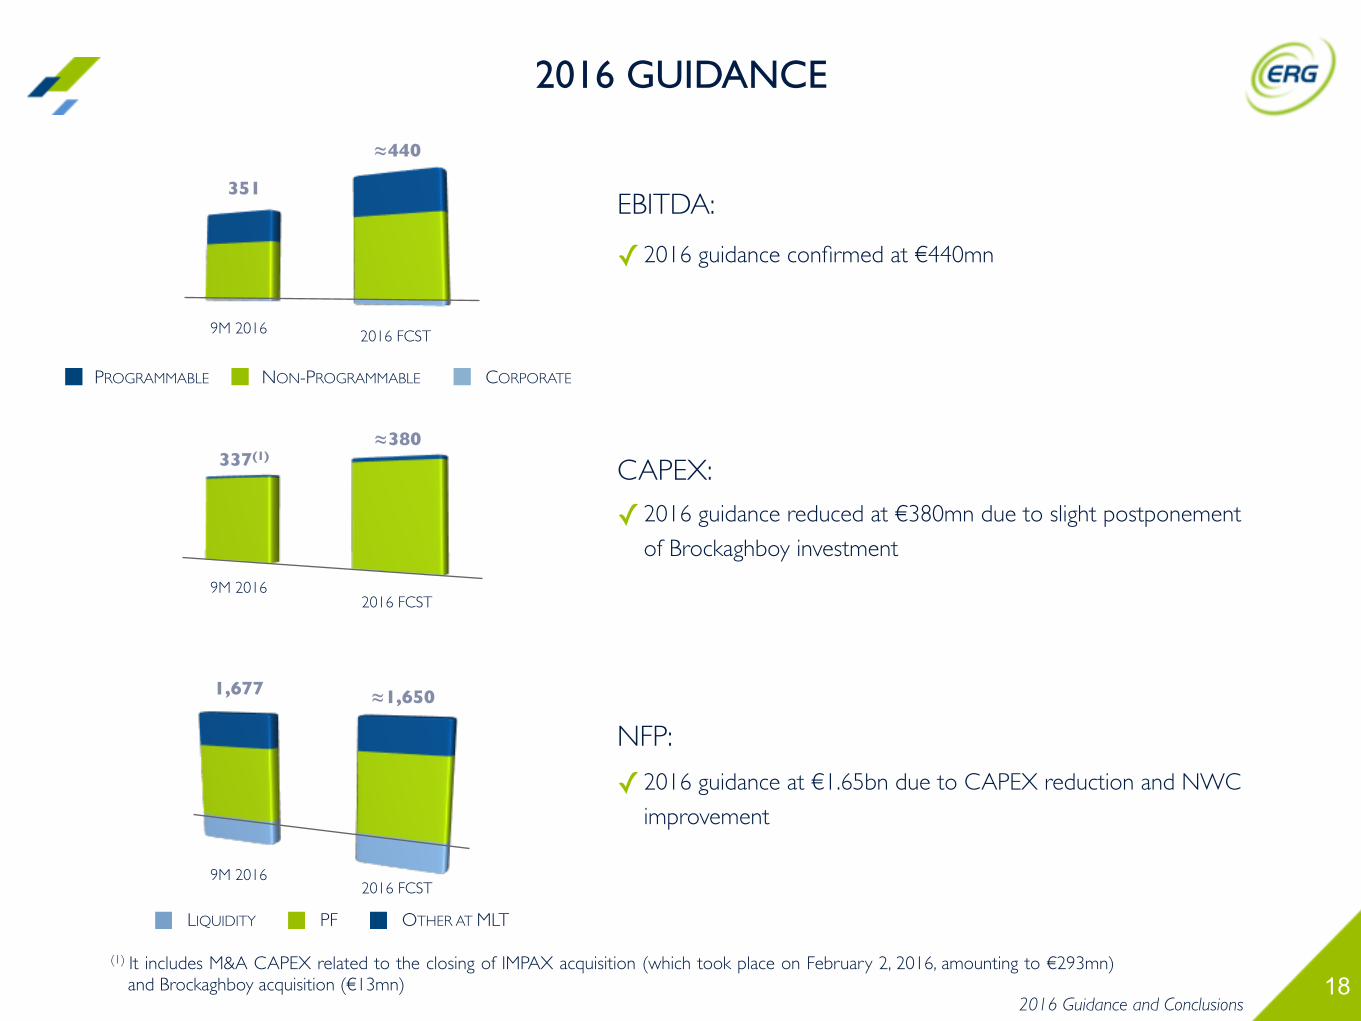
EBITDA:
CAPEX:
NFP:
✓ 2016 guidance reduced at €380mn due to slight postponement
of Brockaghboy investment
≈440
2016 FCST
2016 FCST
✓ 2016 guidance confirmed at €440mn
≈1,650
≈380
2016 Guidance and Conclusions
9M 2016
2016 GUIDANCE
✓ 2016 guidance at €1.65bn due to CAPEX reduction and NWC
improvement
9M 2016
(1) It includes M&A CAPEX related to the closing of IMPAX acquisition (which took place on February 2, 2016, amounting to €293mn) and Brockaghboy acquisition (€13mn)
19
APPENDIX
20
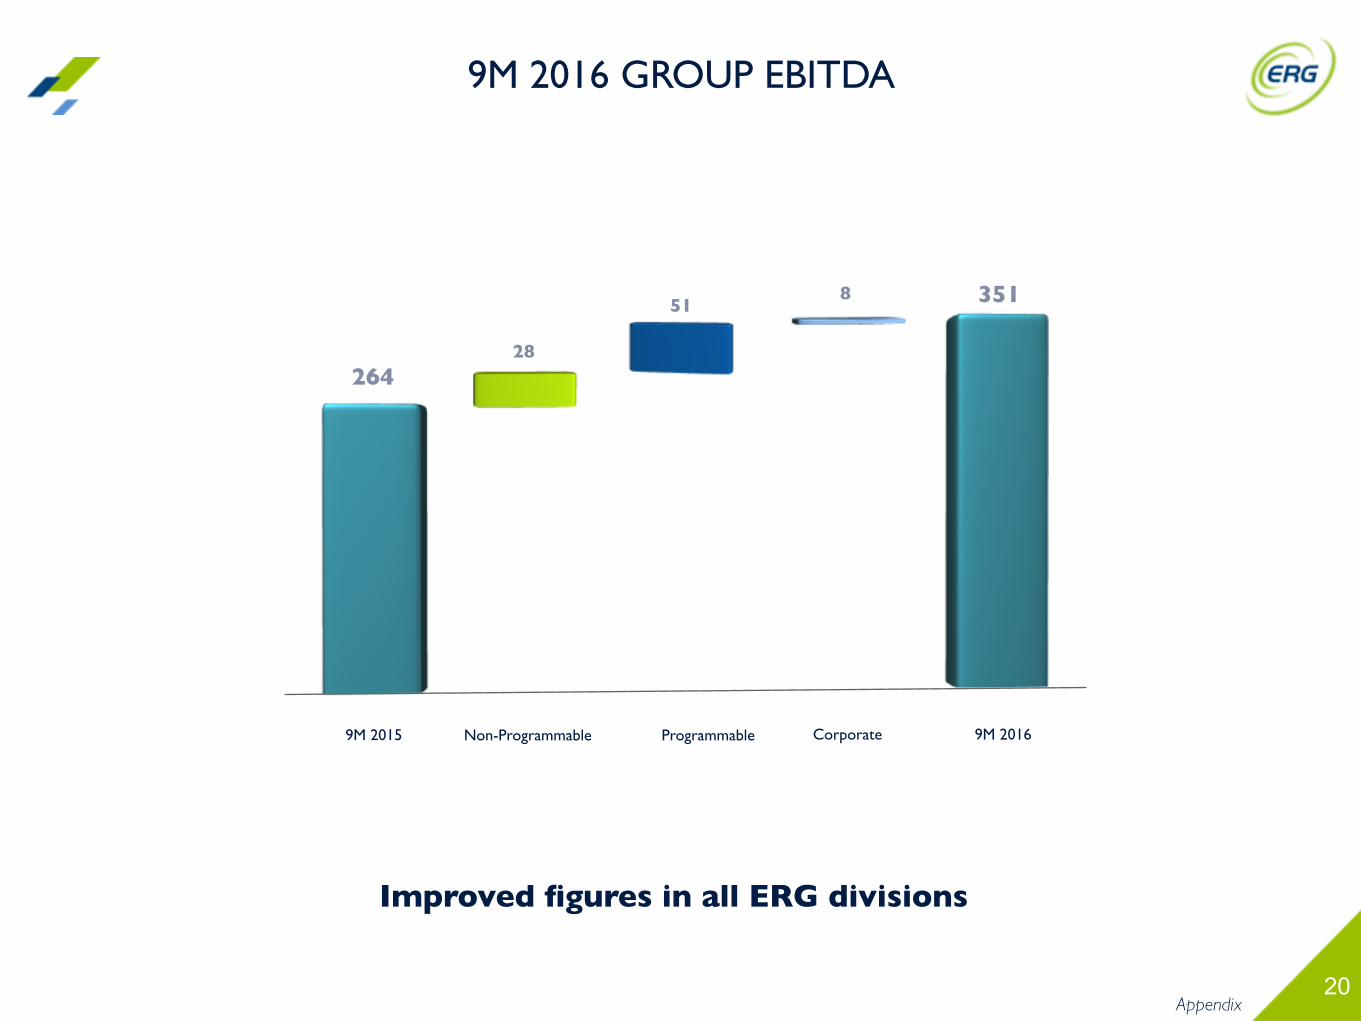
1,292
9M 2015
26428
518
ProgrammableNon-Programmable Corporate 9M 2016
351
9M 2016 GROUP EBITDA
Improved figures in all ERG divisions
Appendix
21
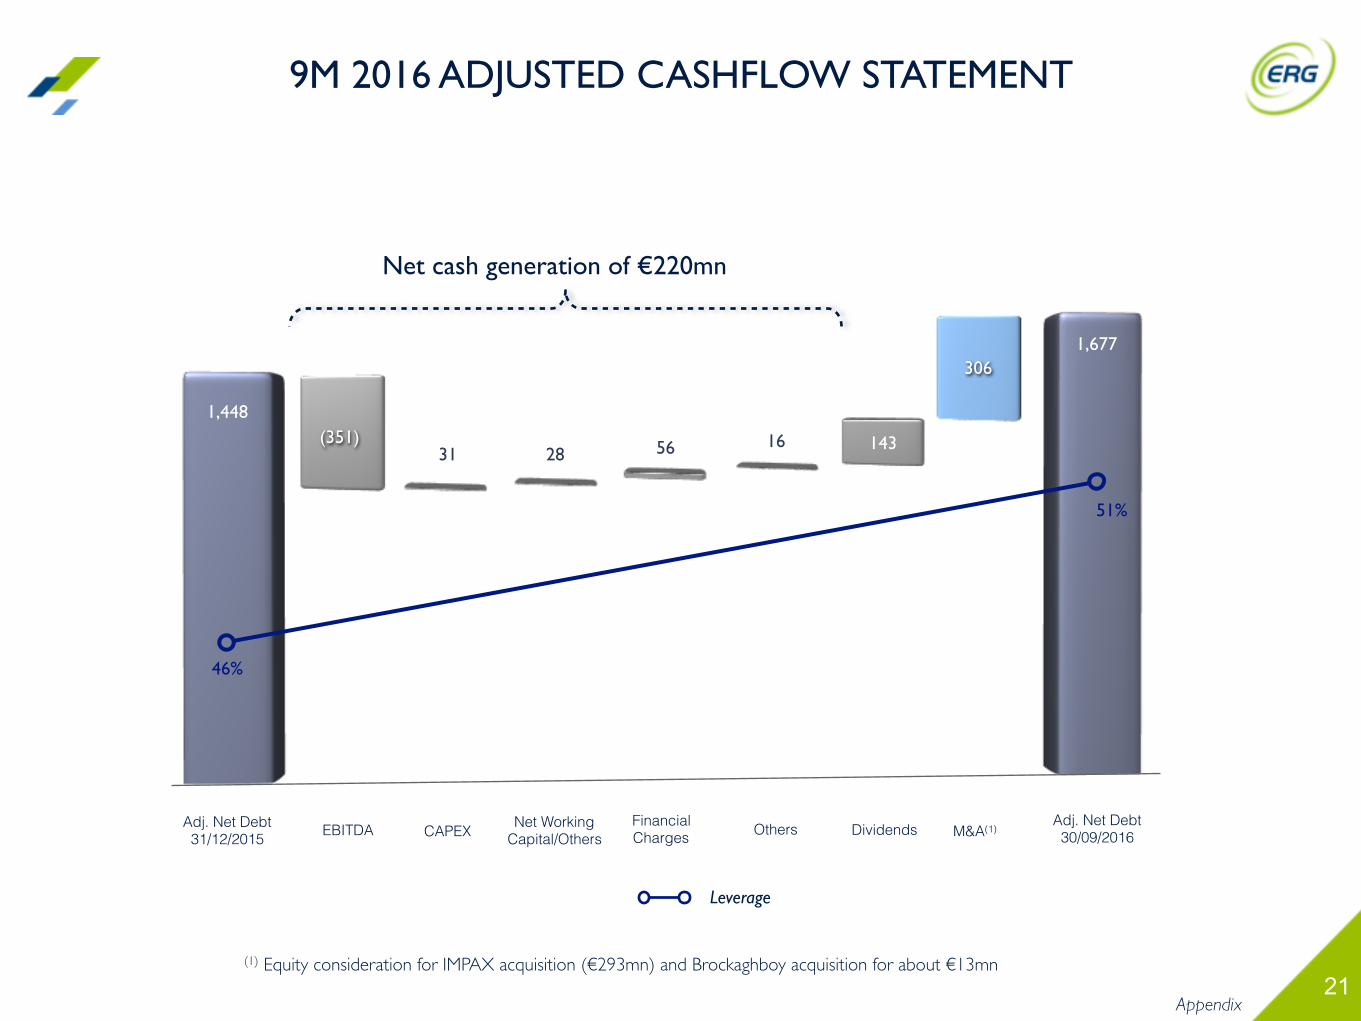
1,677
51%
46%
EBITDA CAPEXFinancial Charges
Adj. Net Debt30/09/2016
Leverage
(351)28
16
306
31 56
M&A(1)Others
9M 2016 ADJUSTED CASHFLOW STATEMENT
1,448
Net WorkingCapital/Others
(1) Equity consideration for IMPAX acquisition (€293mn) and Brockaghboy acquisition for about €13mn
Net cash generation of €220mn
Adj. Net Debt31/12/2015
143
Dividends
Appendix
22Appendix
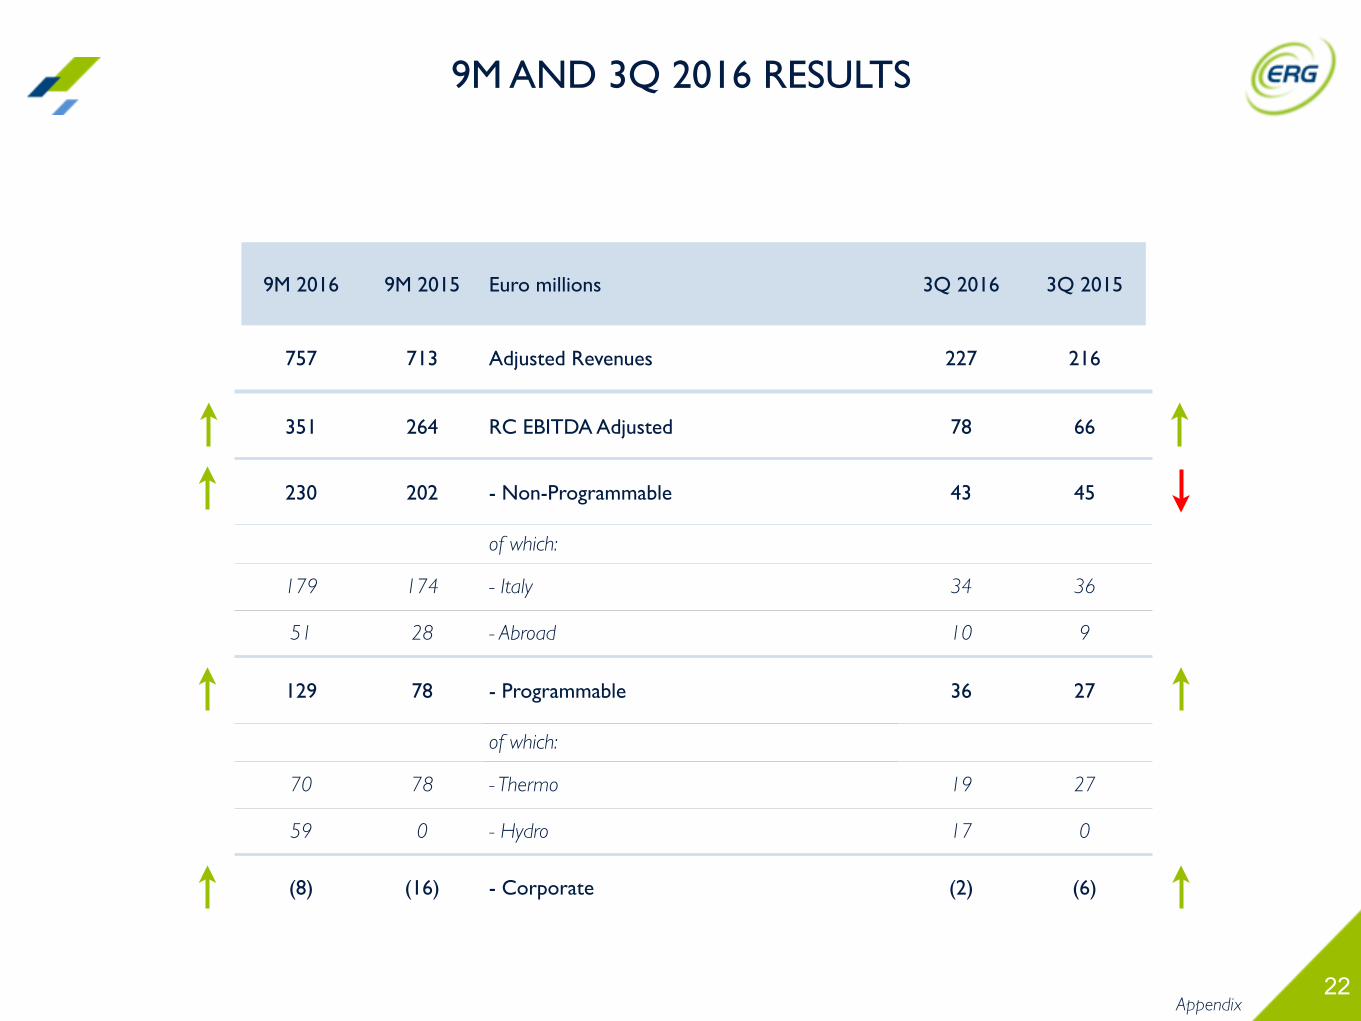
9M 2016 9M 2015 Euro millions 3Q 2016 3Q 2015
757 713 Adjusted Revenues 227 216
351 264 RC EBITDA Adjusted 78 66
230 202 - Non-Programmable 43 45
of which:
179 174 - Italy 34 36
51 28 - Abroad 10 9
129 78 - Programmable 36 27
of which:
70 78 - Thermo 19 27
59 0 - Hydro 17 0
(8) (16) - Corporate (2) (6)
9M AND 3Q 2016 RESULTS
23
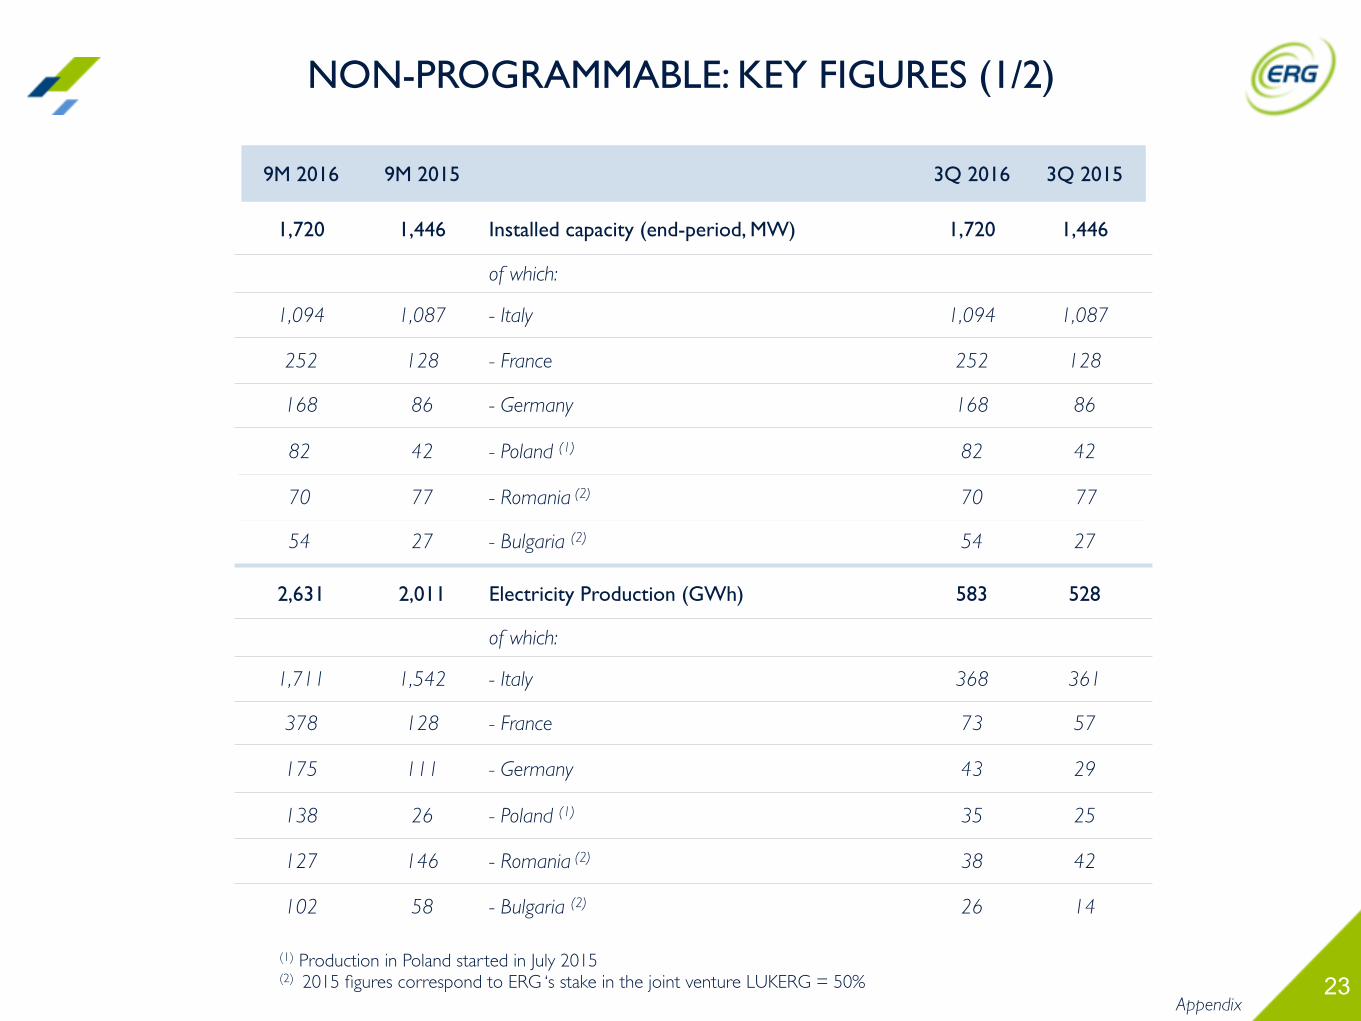
9M 2016 9M 2015 3Q 2016 3Q 2015
1,720 1,446 Installed capacity (end-period, MW) 1,720 1,446
of which:
1,094 1,087 - Italy 1,094 1,087
252 128 - France 252 128
168 86 - Germany 168 86
82 42 - Poland (1) 82 42
70 77 - Romania (2) 70 77
54 27 - Bulgaria (2) 54 27
2,631 2,011 Electricity Production (GWh) 583 528
of which:
1,711 1,542 - Italy 368 361
378 128 - France 73 57
175 111 - Germany 43 29
138 26 - Poland (1) 35 25
127 146 - Romania (2) 38 42
102 58 - Bulgaria (2) 26 14
Appendix
(1) Production in Poland started in July 2015(2) 2015 figures correspond to ERG ‘s stake in the joint venture LUKERG = 50%
NON-PROGRAMMABLE: KEY FIGURES (1/2)
24
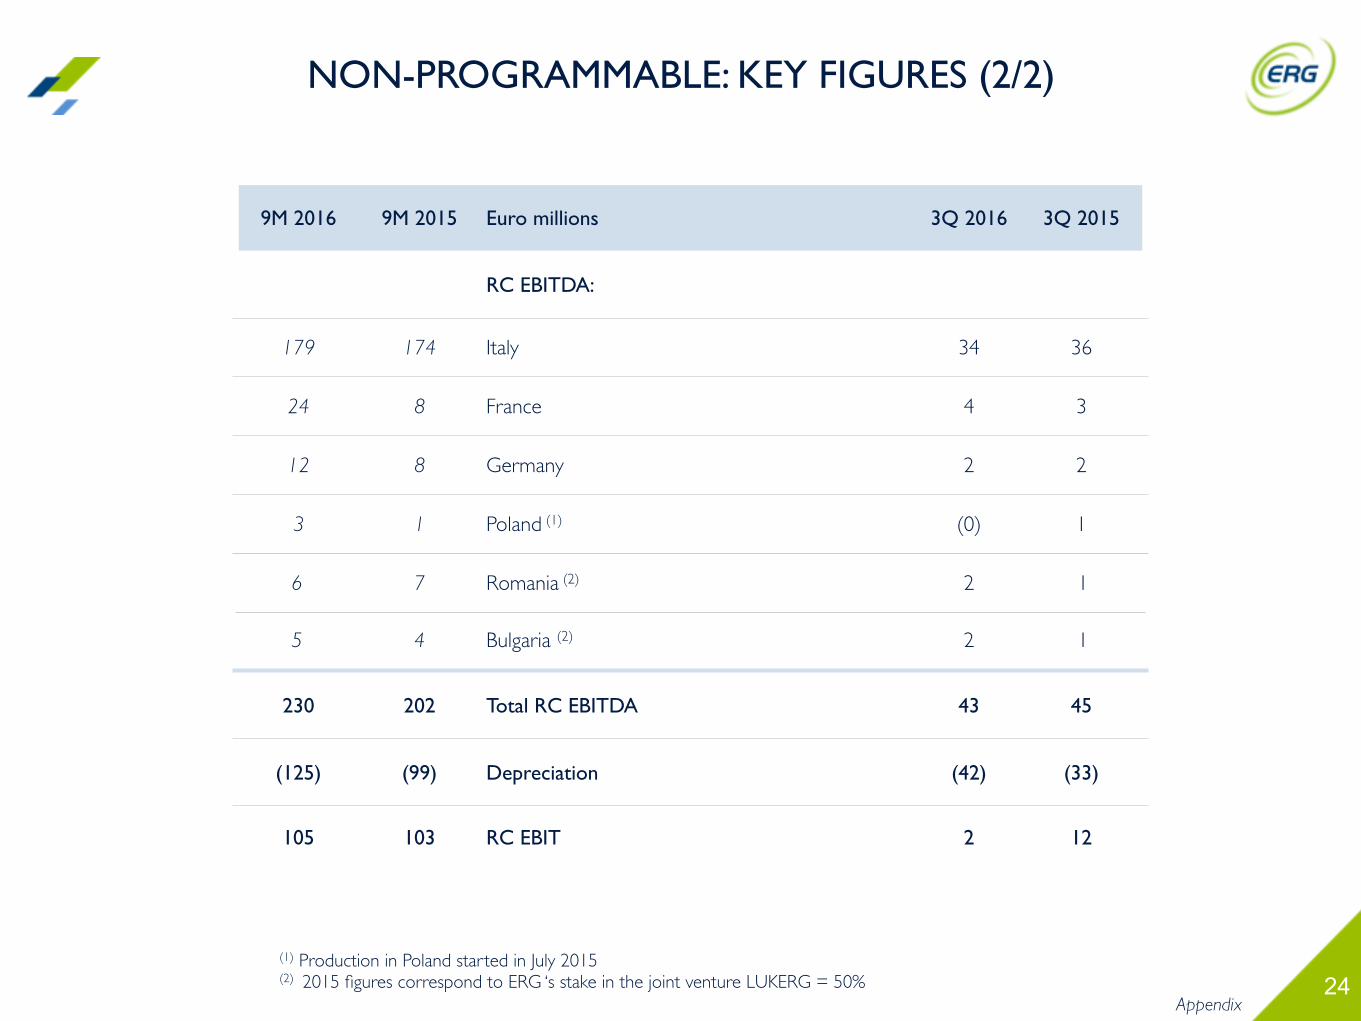
9M 2016 9M 2015 Euro millions 3Q 2016 3Q 2015
RC EBITDA:
179 174 Italy 34 36
24 8 France 4 3
12 8 Germany 2 2
3 1 Poland (1) (0) 1
6 7 Romania (2) 2 1
5 4 Bulgaria (2) 2 1
230 202 Total RC EBITDA 43 45
(125) (99) Depreciation (42) (33)
105 103 RC EBIT 2 12
Appendix
NON-PROGRAMMABLE: KEY FIGURES (2/2)
(1) Production in Poland started in July 2015(2) 2015 figures correspond to ERG ‘s stake in the joint venture LUKERG = 50%

25Appendix
9M 2016 9M 2015 Euro millions 3Q 2016 3Q 2015
2,032 1,935 Electricity Production (GWh) 740 724
70 78 RC EBITDA 19 27
(22) (22) Depreciation (7) (7)
48 56 RC EBIT 11 19
ERG POWER: KEY FIGURES
26Appendix
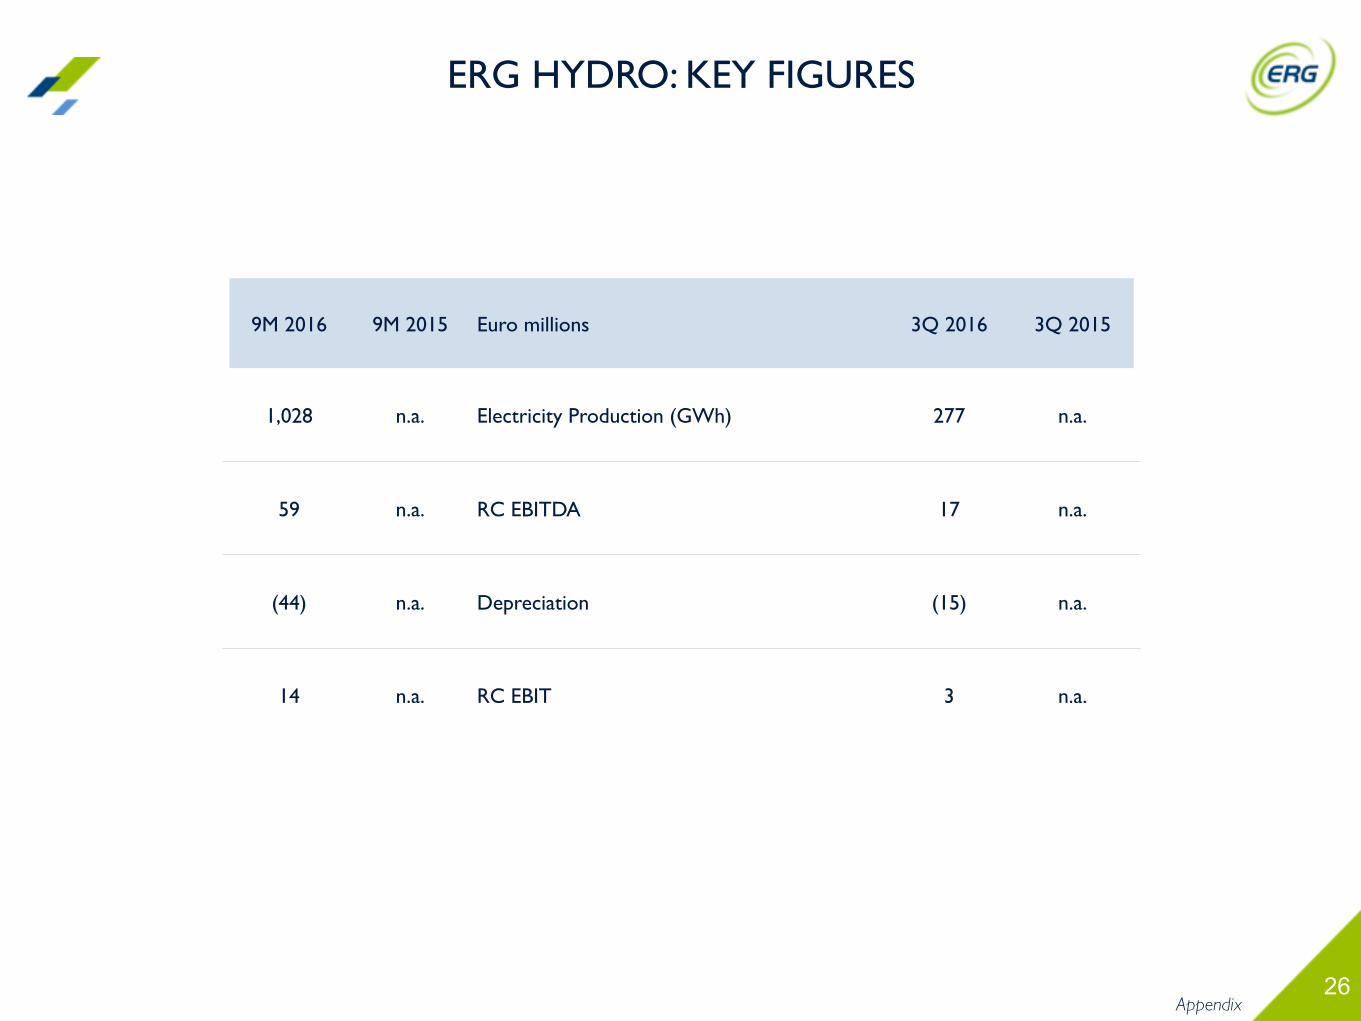
9M 2016 9M 2015 Euro millions 3Q 2016 3Q 2015
1,028 n.a. Electricity Production (GWh) 277 n.a.
59 n.a. RC EBITDA 17 n.a.
(44) n.a. Depreciation (15) n.a.
14 n.a. RC EBIT 3 n.a.
ERG HYDRO: KEY FIGURES
27
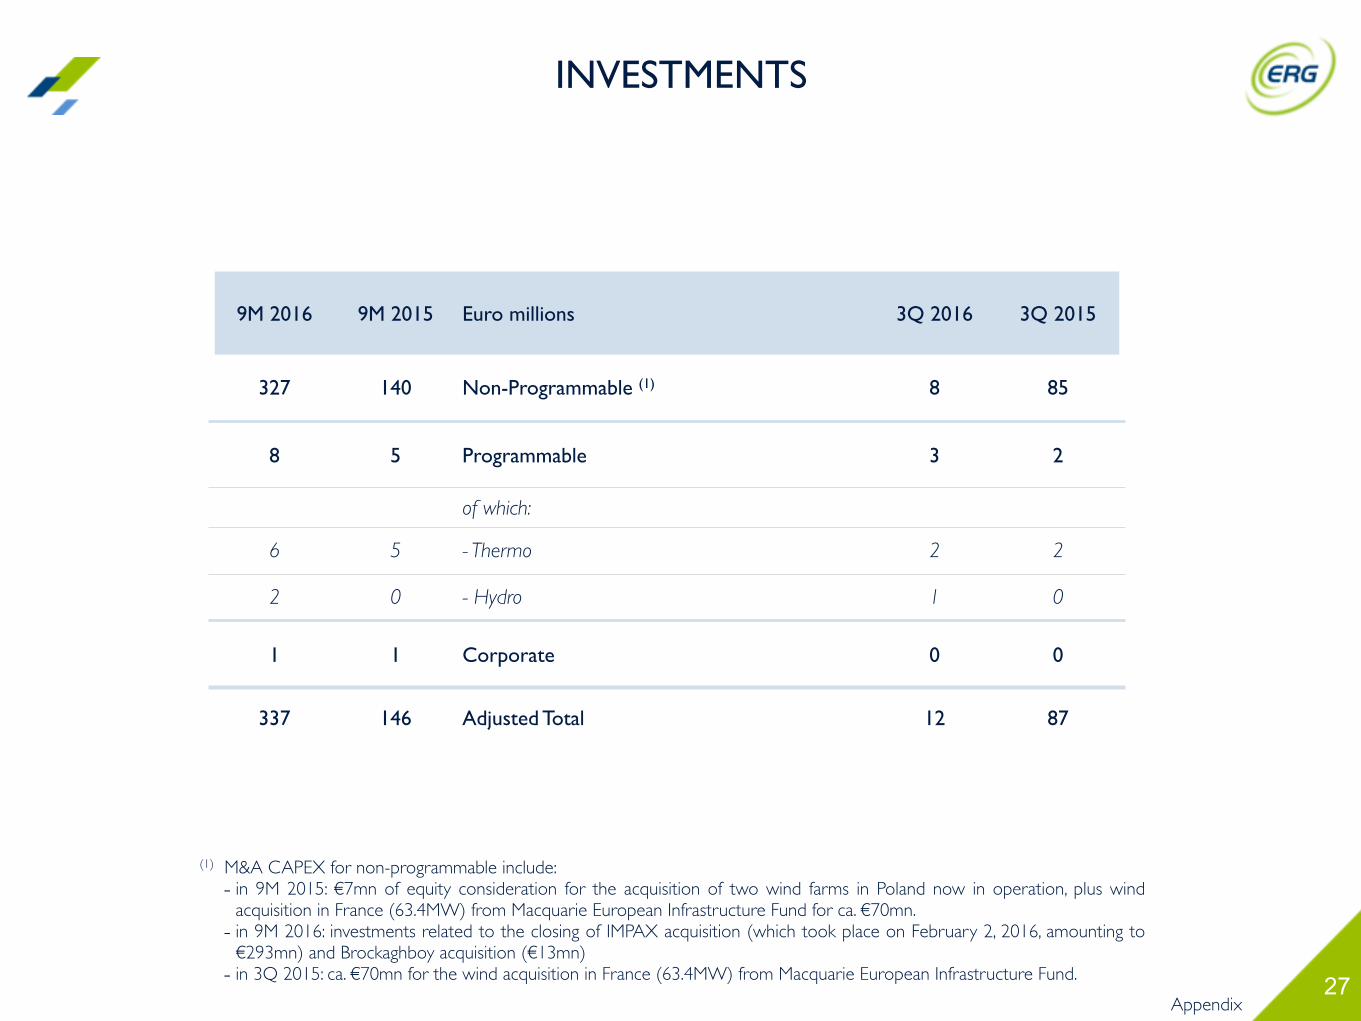
9M 2016 9M 2015 Euro millions 3Q 2016 3Q 2015
327 140 Non-Programmable (1) 8 85
8 5 Programmable 3 2
of which:
6 5 - Thermo 2 2
2 0 - Hydro 1 0
1 1 Corporate 0 0
337 146 Adjusted Total 12 87
Appendix
INVESTMENTS
(1) M&A CAPEX for non-programmable include:- in 9M 2015: €7mn of equity consideration for the acquisition of two wind farms in Poland now in operation, plus wind
acquisition in France (63.4MW) from Macquarie European Infrastructure Fund for ca. €70mn.- in 9M 2016: investments related to the closing of IMPAX acquisition (which took place on February 2, 2016, amounting to €293mn) and Brockaghboy acquisition (€13mn)
- in 3Q 2015: ca. €70mn for the wind acquisition in France (63.4MW) from Macquarie European Infrastructure Fund.