Embed Size (px)
Citation preview
7/31/2019 2006 Pf Me a Presentation
http://slidepdf.com/reader/full/2006-pf-me-a-presentation 1/29
Improving the Quality of
PFMEAs
David J. BenedictSenior Manager
Advance Supplier Quality Planning
Chassis/Electrical/ElectronicsDaimlerChrysler Corporation
7/31/2019 2006 Pf Me a Presentation
http://slidepdf.com/reader/full/2006-pf-me-a-presentation 2/29
Why am I here
today?
7/31/2019 2006 Pf Me a Presentation
http://slidepdf.com/reader/full/2006-pf-me-a-presentation 3/29
Today’s Agenda:1. Introduction
2. Brief Background
3. Common Errors inPFMEAs
4. Supplier PFMEAAudit
5. Questions

7/31/2019 2006 Pf Me a Presentation
http://slidepdf.com/reader/full/2006-pf-me-a-presentation 4/29
Current Paradigm New Paradigm
“Ensures our products and“Ensures our products andprocesses are robust”processes are robust”
Error/MistakeProofing
ProcessControl Plans
– Taken seriously… All critical and new products/processes
… Data driven
… Roll-up RPN values (Green Y philosophy)
– Early… Completed while design is still fluid
… “Living” document
“Paper exercise donewhen pushed”
– Taken lightly… “Selective” products/processes chosen
… Based on opinion
… All “magically” below the RPN cut-off
– Too late… Error/Mistake proofing window long
gone
… Rarely validated with field results
MaintenancePlans
Drives FMEAFMEA

7/31/2019 2006 Pf Me a Presentation
http://slidepdf.com/reader/full/2006-pf-me-a-presentation 5/29
What are some commonerrors?
1. Not started because production equipment notoperational.
2. Looking only at RPNs when prioritizing Recommended
Actions.
3. Not following minimum guidelines for Severity
rankings.
4. RPN below “target level” and no further actionneeded.
5. Filled out using ONLY references to otherdocuments.

7/31/2019 2006 Pf Me a Presentation
http://slidepdf.com/reader/full/2006-pf-me-a-presentation 6/29
What are some commonerrors?
6. Effects of Failure not “Customer” effects.
7. Not distinguishing between types of controls.
8. Inconsistency in Severity or Detection rankings.
9. Detection ranking too low.
10.Insufficient Controls for Severity rankings of 8, 9 or
10.
7/31/2019 2006 Pf Me a Presentation
http://slidepdf.com/reader/full/2006-pf-me-a-presentation 7/29
PFMEA not started becauseproduction equipment not
operational• Minimum documents required to start a
PFMEA:– Process Flow Chart– Risk Assessment
– Work Instructions
• The PFMEA should be updated later withfindings from trial/pilot runs.

7/31/2019 2006 Pf Me a Presentation
http://slidepdf.com/reader/full/2006-pf-me-a-presentation 8/29
Looking only at the RPN’s whenprioritizing Recommended Actions
Gas Porosity toogreat (greater than x
criteria
Potential
Effect(s) of Failure
Surface
contaminants
not completely
removed
Process
Function
Requirements
Se
v
C
la
s
s
Potential Failure
Mode
Hydrogen
Supersaturation
due toexcessiveweight melt
temperature. 2
Automated
TemperatureControls in melt
furnace Strip charting and SPC 6
Current
Process
Controls
Prevention
Current
Process
Controls
Detection
D
e
t
e
c
t
R P
N
PotentialCause(s) /
Mechanism(s) of
Failure
O
cc
u
r
Contamination in
Rinse Water 5
Periodic exchange of DI
water-once per shift
100% visual inspection
at Op. 180 8
Fracture of wheel-does
not meet FMVSS
requirementsUnacceptable
Appearance
noticed by most
customers
10
4
120
160
OP:20
OP:170
• For Severity, OP. 20 is much more critical than OP. 170.
• The RPN number suggests OP. 170 is a higher priority.
• What would be the results of a quality spill for OP. 20 vs.OP. 170?

7/31/2019 2006 Pf Me a Presentation
http://slidepdf.com/reader/full/2006-pf-me-a-presentation 9/29
Not following minimum guidelinesfor Severity rankings
• Misidentifying “Potential Effects of Failure” canmake establishing meaningful Severity rankingsdifficult.
• “Legal” concerns sometimes drive lower rankings.
• Note: If the severity received a ranking of 9 or10, it is important to include a Customer- or
Supplier-specific safety symbol to highlight itssignificance.

7/31/2019 2006 Pf Me a Presentation
http://slidepdf.com/reader/full/2006-pf-me-a-presentation 10/29
RPN below “target level” and no furtheraction needed
• PFMEA is a continuousimprovement tool and
a living document.
• Reducing occurrence
should continue to be agoal long after error-or mistake-proofinghas been implemented.
4 N/R
2
Action
Results
Action Results
S
e
v
O
c
c
D
e
t
R
P
N
N/R
Recommended
Action(s)
Responsibility
& Target
Completion Date
D
e
t
e
c
t
R
P
N
2 N/R
24
36
42
7/31/2019 2006 Pf Me a Presentation
http://slidepdf.com/reader/full/2006-pf-me-a-presentation 11/29
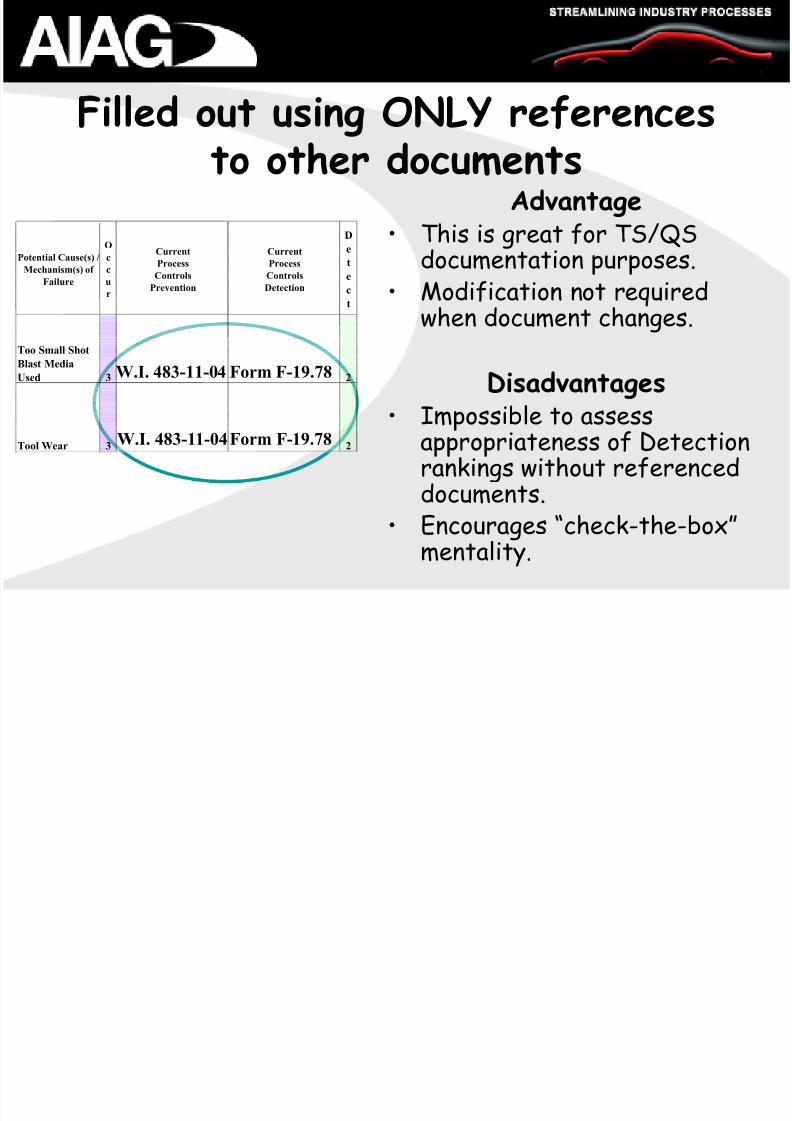
Filled out using ONLY referencesto other documents
Advantage• This is great for TS/QSdocumentation purposes.
• Modification not requiredwhen document changes.
Disadvantages
• Impossible to assessappropriateness of Detectionrankings without referenceddocuments.
• Encourages “check-the-box”mentality.
Too Small Shot
Blast Media
Used 3 W.I. 483-11-04 Form F-19.78 2
Current
Process
Controls
Prevention
Current
Process
Controls
Detection
D
e
t
e
c
t
Potential Cause(s) /
Mechanism(s) of
Failure
O
c
c
u
r
Tool Wear 3 W.I. 483-11-04Form F-19.78 2

7/31/2019 2006 Pf Me a Presentation
http://slidepdf.com/reader/full/2006-pf-me-a-presentation 12/29
Effects of Failure not “Customer”effects
• Consider what wouldhappen if there wereNO CONTROLS!
• “Scrap/downtime” aretrue, but are not whatthe “Customer” would
notice or experience.
• Think of what thecustomer wouldnotice/experience if the“Bolt” was “loose.”
Process
Function
Potential Failure
Mode
Potential
Effect(s) of Failure
S
e
v
Requirements
OP. 210 Valve
Hole Deburr/
Burr Free
Burrs Excessive scrap/
downtime7
OP. 220 Punch
Hole/Hole
Diameter 10.0
mm +/-0.2
Hole Diameter
>10.2 mm.
Bolt loose5

7/31/2019 2006 Pf Me a Presentation
http://slidepdf.com/reader/full/2006-pf-me-a-presentation 13/29
Not distinguishing between types ofcontrols
• Prevention affects ONLY Occurrence rankings.
• Detection affects ONLY Detection rankings.
• Not knowing the difference often leads to incorrectDetection rankings.
• When using 2nd edition FMEA Manual form, Controls mustbe labeled (P) for Prevention and (D) for Detection.
• 3rd
edition form has two separate columns for Preventionand Detection Controls.
7/31/2019 2006 Pf Me a Presentation
http://slidepdf.com/reader/full/2006-pf-me-a-presentation 14/29
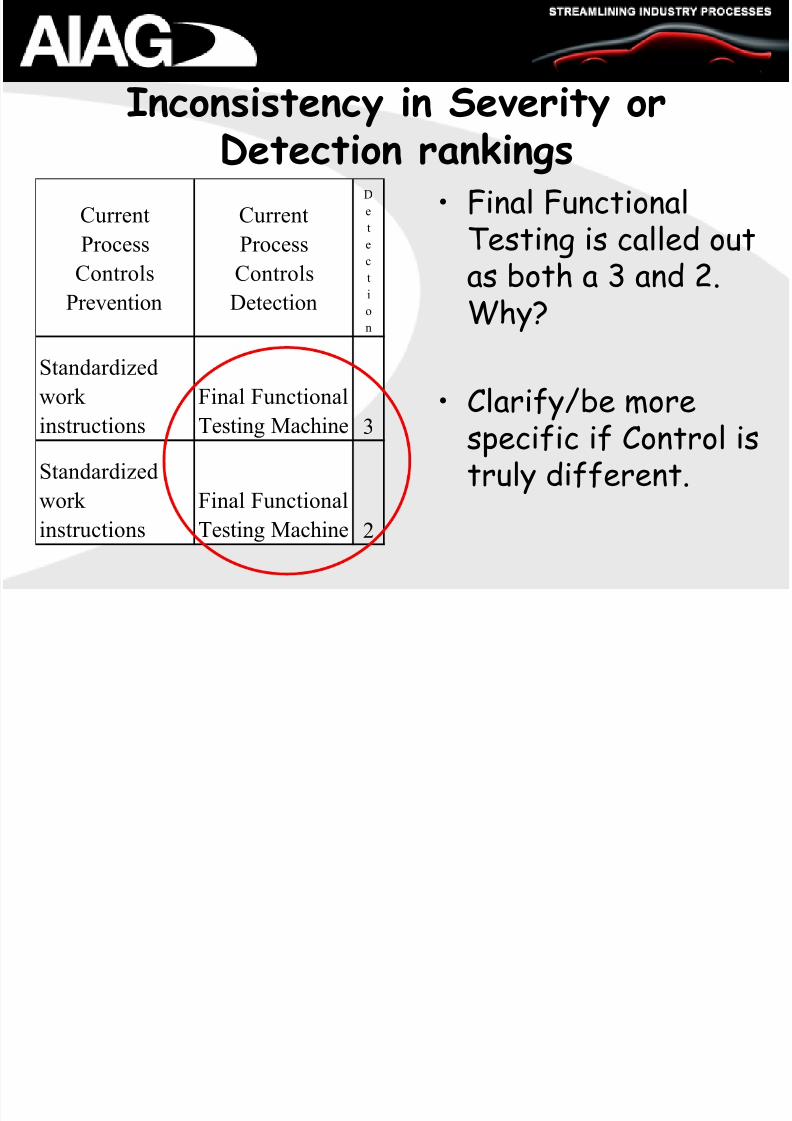
Inconsistency in Severity orDetection rankings
• Final FunctionalTesting is called outas both a 3 and 2.
Why?
• Clarify/be morespecific if Control istruly different.
Current
Process
Controls
Prevention
Current
Process
Controls
Detection
D
et
e
c
t
i
on
Standardized
work
instructions
Final Functional
Testing Machine 3
Standardized
work
instructions
Final Functional
Testing Machine 2

7/31/2019 2006 Pf Me a Presentation
http://slidepdf.com/reader/full/2006-pf-me-a-presentation 15/29
Detection ranking too low
100%VisualInspection
at Op. 220.3
Operator did not
remove allburrs-
insufficient
lighting.4
Standardized
Work Instructions
OP. 210 Valve
Hole deburr/all
burrs removed
Not all burrs
removed.
Flat tire-Value
Stem cut during
tire mounting. 7
Requirements
Current
Process
Controls
Detection
D
e
t
e
c
t
Process
Function
Potential Failure
Mode
Potential
Effect(s) of Failure
S
e
v
Cl
a
s
s
Potential Cause(s) /
Mechanism(s) of
Failure
Oc
c
u
r
Current
Process
Controls
Prevention
• In this example, the Detection Controls are100% visual inspection.
• The Detection ranking should be an 8, not 3.
7/31/2019 2006 Pf Me a Presentation
http://slidepdf.com/reader/full/2006-pf-me-a-presentation 16/29
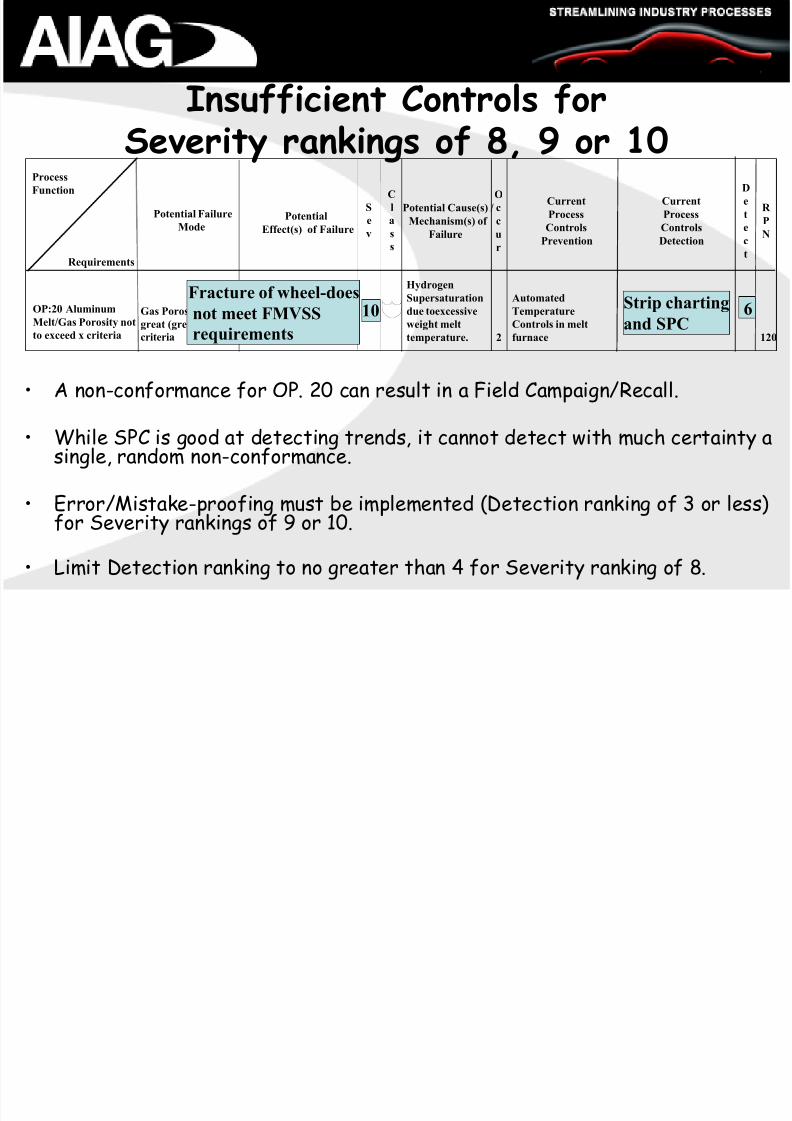
Insufficient Controls forSeverity rankings of 8, 9 or 10
OP:20 AluminumMelt/Gas Porosity not
to exceed x criteria
Gas Porosity toogreat (greater than x
criteria
10
Potential
Effect(s) of Failure
Process
Function
Requirements
Se
v
C
la
s
s
Potential Failure
Mode
Hydrogen
Supersaturation
due toexcessiveweight melt
temperature. 2
Automated
TemperatureControls in melt
furnace
Strip charting
and SPC
Current
Process
Controls
Prevention
Current
Process
Controls
Detection
Potential Cause(s) /Mechanism(s) of
Failure
O
cc
u
r
Fracture of wheel-does
not meet FMVSSrequirements
6120
D
e
t
e
c
t
R P
N
• A non-conformance for OP. 20 can result in a Field Campaign/Recall.
• While SPC is good at detecting trends, it cannot detect with much certainty asingle, random non-conformance.
• Error/Mistake-proofing must be implemented (Detection ranking of 3 or less)for Severity rankings of 9 or 10.
• Limit Detection ranking to no greater than 4 for Severity ranking of 8.

7/31/2019 2006 Pf Me a Presentation
http://slidepdf.com/reader/full/2006-pf-me-a-presentation 17/29
Supplier PFMEA Audit
7/31/2019 2006 Pf Me a Presentation
http://slidepdf.com/reader/full/2006-pf-me-a-presentation 18/29
What is the Audit?
• An objective tool to evaluate the quality ofthe PFMEA

7/31/2019 2006 Pf Me a Presentation
http://slidepdf.com/reader/full/2006-pf-me-a-presentation 19/29
Why was the Audit Form Created?• Previous process involved individuals
applying their own criteria fordetermining what made a “good” vs.“bad” PFMEA (often inconsistent andconfusing).
• PFMEA best practices were not being
shared.• Needed to find a way to acceleratePFMEA improvement.

7/31/2019 2006 Pf Me a Presentation
http://slidepdf.com/reader/full/2006-pf-me-a-presentation 20/29
Who will use the Audit?
• Suppliers (self-assessment)
• Customers (evaluate Supplier PFMEAsubmissions)
7/31/2019 2006 Pf Me a Presentation
http://slidepdf.com/reader/full/2006-pf-me-a-presentation 21/29
What can the audit do?
• The form is really 2-in-1 and has theflexibility to be used:– by those creating or developing the
PFMEA (supplier manufacturing engineer,design engineer, quality engineer, etc.), or
– by those conducting a “3rd party” audit ofthe PFMEA (supplier or customer corporate
quality function, etc.)

7/31/2019 2006 Pf Me a Presentation
http://slidepdf.com/reader/full/2006-pf-me-a-presentation 22/29
What are some of the things theaudit form can help detect?
• It can help detect whether:– a cross-functional team provided input
during the creation of the PFMEA
– the probability of occurrence was createdusing real world data
– previous internal or external rejects wereincluded
– the DFMEA was referenced/used in thecreation of the PFMEA
7/31/2019 2006 Pf Me a Presentation
http://slidepdf.com/reader/full/2006-pf-me-a-presentation 23/29
How do you use the Audit form?• The use of the form is straight
forward:– If you are creating or developing (or wish
to do a "deep dive" into the data behind thePFMEA), answer ALL questions on theform.
– If you are conducting a “3rd party” auditof a PFMEA, answer only those questionsnot shaded/italicized.

7/31/2019 2006 Pf Me a Presentation
http://slidepdf.com/reader/full/2006-pf-me-a-presentation 24/29
Where can I find the Audit form?
•
Go to Covisint and log in.• Go to DaimlerChrysler page.
• Go to bulletin 76738.
7/31/2019 2006 Pf Me a Presentation
http://slidepdf.com/reader/full/2006-pf-me-a-presentation 25/29
7/31/2019 2006 Pf Me a Presentation
http://slidepdf.com/reader/full/2006-pf-me-a-presentation 26/29

7/31/2019 2006 Pf Me a Presentation
http://slidepdf.com/reader/full/2006-pf-me-a-presentation 27/29
7/31/2019 2006 Pf Me a Presentation
http://slidepdf.com/reader/full/2006-pf-me-a-presentation 28/29

7/31/2019 2006 Pf Me a Presentation
http://slidepdf.com/reader/full/2006-pf-me-a-presentation 29/29
Questions?


![Envolventes para Centros de Transformación · 16 Centros de Transformación ... pf hasta 36 kV pf.301 pf.302 pf.303 pf.304 pf.3015 pf.3030 Longitud [mm] ... Combinaciones Posibilidad](https://img.pdfslide.es/doc/110x75/5bb1a96c09d3f2f1188b9734/envolventes-para-centros-de-transformacion-16-centros-de-transformacion-.jpg)