Embed Size (px)
Citation preview
ADVERTIMENT. Lʼaccés als continguts dʼaquesta tesi doctoral i la seva utilització ha de respectar els drets de lapersona autora. Pot ser utilitzada per a consulta o estudi personal, així com en activitats o materials dʼinvestigació idocència en els termes establerts a lʼart. 32 del Text Refós de la Llei de Propietat Intel·lectual (RDL 1/1996). Per altresutilitzacions es requereix lʼautorització prèvia i expressa de la persona autora. En qualsevol cas, en la utilització delsseus continguts caldrà indicar de forma clara el nom i cognoms de la persona autora i el títol de la tesi doctoral. Nosʼautoritza la seva reproducció o altres formes dʼexplotació efectuades amb finalitats de lucre ni la seva comunicaciópública des dʼun lloc aliè al servei TDX. Tampoc sʼautoritza la presentació del seu contingut en una finestra o marc alièa TDX (framing). Aquesta reserva de drets afecta tant als continguts de la tesi com als seus resums i índexs.
ADVERTENCIA. El acceso a los contenidos de esta tesis doctoral y su utilización debe respetar los derechos de lapersona autora. Puede ser utilizada para consulta o estudio personal, así como en actividades o materiales deinvestigación y docencia en los términos establecidos en el art. 32 del Texto Refundido de la Ley de PropiedadIntelectual (RDL 1/1996). Para otros usos se requiere la autorización previa y expresa de la persona autora. Encualquier caso, en la utilización de sus contenidos se deberá indicar de forma clara el nombre y apellidos de la personaautora y el título de la tesis doctoral. No se autoriza su reproducción u otras formas de explotación efectuadas con fineslucrativos ni su comunicación pública desde un sitio ajeno al servicio TDR. Tampoco se autoriza la presentación desu contenido en una ventana o marco ajeno a TDR (framing). Esta reserva de derechos afecta tanto al contenido dela tesis como a sus resúmenes e índices.
WARNING. The access to the contents of this doctoral thesis and its use must respect the rights of the author. It canbe used for reference or private study, as well as research and learning activities or materials in the terms establishedby the 32nd article of the Spanish Consolidated Copyright Act (RDL 1/1996). Express and previous authorization of theauthor is required for any other uses. In any case, when using its content, full name of the author and title of the thesismust be clearly indicated. Reproduction or other forms of for profit use or public communication from outside TDXservice is not allowed. Presentation of its content in a window or frame external to TDX (framing) is not authorized either.These rights affect both the content of the thesis and its abstracts and indexes.
MOLECULAR ALTERATIONS IN METASTATIC BREAST
CANCER AND EFFICACY OFPI3K/AKT/MTOR INHIBITORS
IN EARLY PHASE CLINICAL TRIALS
Ana Mafalda Antunes de Melo e Oliveira
TESIS DOCTORAL
UAB - Facultad de Medicina. Programa Doctorado en Medicina l 2017

TESIS DOCTORAL
MOLECULAR ALTERATIONS IN METASTATIC BREAST CANCER AND EFFICACY OF PI3K/AKT/MTOR INHIBITORS
IN EARLY PHASE CLINICAL TRIALS
Ana Mafalda Antunes de Melo e Oliveira
DirectorJavier Cortés Castán
TutorJordi Giralt de Sagredo
Programa de doctorado de Medicina Facultad de Medicina
Barcelona, 2017

2

3
A mis padres y a mi hermano
A José Miguel, Julián, y a mis amigas de Casa

4

5
Acknowledgements
O meu primeiro agradecimento dirige-se à minha Mãe e ao meu Pai. Obrigada pelo dom da vida,
pelo amor gratuito, inesgotável, imenso que recebo de vocês desde que nasci. Obrigada ao meu
irmão Filipe, és cada vez mais companheiro de caminho. Também aos meus avós, Vitória e
Domingos, Guida e Mário, ao resto da minha família, aos Tios e aos amigos da família, porque
vos devo tanto.
Me gustaría luego dar las gracias a todos mis mentores y compañeros que en las diferentes
etapas de mi vida profesional me han ido guiando y abriendo nuevos horizontes. A Sofia Braga,
Isabel Sargento, Dr. João Oliveira y Dr. José Luis Passos-Coelho, porque desde los años de la
Residencia me habéis transmitido la pasión por la oncología y porque habéis confiado en mí
cuando ni siquiera yo misma estaba muy segura de lo que quería. Un agradecimiento especial al
Dr. José Baselga, que ha decidido apostar por esa oncóloga portuguesa desconocida que
insistentemente un día le llamó a la puerta. No menos especial es el agradecimiento al Dr. Javier
Cortés, porque me acogiste sin reservas en tu Grupo, me has introducido en el mundo de la
Investigación Clínica abriéndome perspectivas inimaginadas, y me has dirigido esta tesis. Al Dr.
Jordi Giralt, tutor de la tesis. Al Dr. Josep Tabernero, por confiar en mi trabajo. A Cristina,
porque me aceptaste a tu lado desde el primer día en Vall d’Hebron y desde entonces cuántos
momentos tan especiales hemos vivido. A todos los compañeros de la Unidad de Mama del
Hospital Vall d'Hebron con quien he compartido los últimos 7 años, especialmente a Judith y
Meritxell: gracias por la seriedad de vuestro trabajo diario y por vuestra paciencia. A Rodrigo y
su equipo, por la ayuda con el análisis de los datos. A Amanda, por la revisión final exprés del
inglés. Al equipo de Patología Molecular y Genómica, especialmente a Paolo y Ana, y a todo el
equipo de enfermería, coordinación, auxiliares, secretarios… Todos sois indispensables.
A José Miguel, a Julián y a don Giussani, por vuestra paternidad. A mis amigas de Casa – Ana,
Marta, Betta, Bea, Virgi – porque la vida con vosotras es la mayor de las aventuras. A mis
amigos de Barcelona – especialmente a Marcos, Lluís, Laura, Leo, Jordi, Silvi, Joan, Clara, César…
– y a los de Lisboa – Maria, Sofia, José Maria, Sara, Susana, Tonico, Catu, Joana, Madredeus,
Margarida, Ana… – porque sin vosotros yo no sería quien soy.
Y a todas las pacientes, que con entereza, coraje y dignidad lucháis cada día para vencer el
cáncer. Sois la inspiración y el motor de nuestro trabajo.

6

7
“The most beautiful experience we can have is the mysterious.
It is the fundamental emotion that stands at the cradle of true art and true science.
Whoever does not know it and can no longer wonder, no longer marvel,
is as good as dead, and his eyes are dimmed”
Albert Einstein, "The World As I See It," 1930

8
9
Contents
1. Introduction and Background .................................................. 13
1.1. Precision medicine in oncology .......................................................... 13
1.2. Metastatic breast cancer: epidemiology and treatment goals .......... 14
1.3. Classification of breast cancer ............................................................ 16
1.3.1. Targeting ER and HER2 ................................................................. 17
1.3.2. The intrinsic subtypes of breast cancer ........................................... 20
1.3.3. Genomic landscape of breast cancer .............................................. 21
1.4. Molecular screening initiatives in breast cancer ............................... 24
1.5. The PAM pathway in human cancer ................................................... 28
1.6. Prevalence of PAM pathway alterations in breast cancer ................. 30
1.6.1. TCGA data ...................................................................................... 31
1.6.1.1. ER+/HER2-negative breast cancer .................................................................... 31
1.6.1.2. Basal like breast cancer ..................................................................................... 31
1.6.1.3. HER2-E breast cancer ....................................................................................... 32
1.6.1.4. ILC and expanded TCGA data........................................................................... 32
1.6.2. The International Cancer Genome Consortium............................... 33
1.6.3. METABRIC Consortium .................................................................. 34
1.6.4. Online resources ............................................................................. 34
1.7. Drug modulation of the PAM pathway in breast cancer .................... 35
1.7.1. mTOR Inhibitors .............................................................................. 35
1.7.1.1. Rapalogs ............................................................................................................ 35
1.7.1.2. mTORC1/2 inhibitors ......................................................................................... 38
1.7.2. Dual PI3K/mTOR inhibitors ............................................................. 40
1.7.3. PI3K inhibitors ................................................................................. 40
1.7.3.1. Pan-PI3K Inhibitors ............................................................................................ 40
1.7.3.1.1. Buparlisib (BKM120) ..................................................................................... 41
1.7.3.1.2. Pictilisib (GDC-0941) .................................................................................... 43
1.7.3.2. p110α-specific PI3K inhibitors ........................................................................... 45
1.7.3.2.1. Alpelisib (BYL719) ........................................................................................ 46
1.7.3.2.2. Taselisib (GDC-0032) ................................................................................... 47
1.7.4. AKT inhibitors.................................................................................. 48
1.7.4.1. MK-2206 ............................................................................................................. 48
1.7.4.2. Ipatasertib (GDC-0068) ...................................................................................... 49
1.7.4.1. AZD5363 ............................................................................................................ 51
10
1.8. Biomarkers of response to PAM pathway inhibitors in MBC ............ 54
1.8.1. Biomarkers of response to everolimus ............................................ 54
1.8.1.1. BOLERO-2 ......................................................................................................... 54
1.8.1.1. TAMRAD ............................................................................................................ 56
1.8.1.2. BOLERO 1 and BOLERO 3 ............................................................................... 58
1.8.2. Biomarkers of response to PI3K inhibitors ...................................... 60
1.8.2.1. Biomarkers of response to buparlisib ................................................................. 60
1.8.2.2. Biomarkers of response to pictilisib ................................................................... 61
1.8.2.3. Biomarkers of response to alpelisib ................................................................... 62
1.8.2.4. Biomarkers of response to taselisib ................................................................... 63
2. Justification ............................................................................... 65
3. Hypothesis ................................................................................ 67
3.1. Primary Hypotheses ............................................................................. 67
3.2. Secondary Hypotheses ........................................................................ 67
4. Objectives .................................................................................. 69
4.1. Primary Objectives ................................................................................ 69
4.2. Secondary Objectives ........................................................................... 69
5. Patients and Methods ............................................................... 71
5.1. Study design ......................................................................................... 71
5.2. Sample selection ................................................................................... 71
5.3. Clinical and pathologic variables ........................................................ 71
5.4. Molecular analysis ................................................................................ 72
5.5. Treatment and patient evaluation ........................................................ 75
5.6. Statistical analysis ................................................................................ 77
6. Results ....................................................................................... 79
6.1. Complete cohort of MBC patients ....................................................... 79
6.1.1. Patients and samples characteristics .............................................. 79
11
6.1.2. Distribution of molecular aberrations ............................................... 81
6.1.2.1. Overview ............................................................................................................ 81
6.1.2.2. Aberrations in genes of the PAM pathway ......................................................... 85
6.1.2.3. Other aberrations ............................................................................................... 87
6.1.2.3.1. FGFR1 amplification ..................................................................................... 87
6.1.2.3.2. Other somatic mutations ............................................................................... 87
6.1.3. Enrollment in genotype-driven clinical trials .................................... 89
6.2. Cohort of patients treated with PAM pathway inhibitors .................. 89
6.2.1. Patients and samples characteristics .............................................. 90
6.2.2. Distribution of molecular aberrations ............................................... 92
6.2.2.1. Overview ............................................................................................................ 92
6.2.2.2. Aberrations in genes of the PAM pathway ......................................................... 93
6.2.3. Efficacy of PAM pathway inhibitors ................................................. 96
6.2.3.1. Clinical benefit .................................................................................................... 96
6.2.3.2. Time to Treatment Failure .................................................................................. 98
7. Discussion ............................................................................... 103
7.1. Molecular alterations in MBC patients .............................................. 104
7.2. Genomic alterations in primary tumors and metastasis ................. 111
7.3. Clonality of PIK3CA and AKT1........................................................... 113
7.4. Rate of enrollment in clinical trials .................................................... 115
7.5. Characteristics of the PAM pathway inhibitor cohort ...................... 116
7.6. Predictive factors of efficacy of PAM pathway inhibitors ............... 118
7.7. Clonality of PIK3CA mutation and efficacy of PAM inhibitors ........ 125
7.8. Summary of findings and future directions ...................................... 129
8. Conclusions ............................................................................. 133
9. References ............................................................................... 135
Index of Tables .............................................................................. 163
Index of Figures ............................................................................. 164
Index of Abbreviations .................................................................. 166

12

1Introduction
and Background

13
1. Introduction and Background
1.1. Precision medicine in oncology
Precision medicine is an evolving field where detailed information on the molecular
characteristics of the disease and its host are used to determine which therapies
will work best for each individual patient. The aspiration of delivering the patient
the most personalized treatment possible has existed since the very birth of
medicine itself. Hippocrates combined an assessment of the four humors – blood,
phlegm, yellow bile, and black bile – to determine the cause and the best
treatment for each patient1. While the first connection between genetic inheritance
and susceptibility to a disease (alkaptonuria) was described in 1902 by Sir
Archibald Garrod2, real momentum toward personalized medicine was marked in
2003 with the complete sequencing of the human genome. Back in the early days,
sequencing was both time consuming and expensive but now, thanks to
tremendous technical progress, massive sequencing has rapidly evolved; today
complete sequencing of a human genome takes between 24-48h with a price tag
of less than $5,000. We are also now moving beyond the genome into the entire
spectrum of molecular medicine, including the proteome, metabolome, and
epigenome. All these data must be interpreted and integrated within the context of
precision medicine.
When applied to cancer, precision medicine involves the use of molecular
characteristics of the tumor and its microenvironment, integrated with patient’s
characteristics, in order to match therapies to the specificities of individual
patients, and treat cancer more effectively and with less toxicity3.
The ultimate goal in identifying biologically important genes and pathways
disrupted in cancer is the generation of clinically relevant diagnostic, prognostic,
and therapeutic data that can serve as the basis of delivering precision medicine.
The aberrations that meet these criteria are often referred to as “actionable”4, and
if they are also potentially targets for therapeutic development, they are known as
“druggable”5.
14
Success stories of matching treatment with targeted drugs and recurrent molecular
alterations in different tumor types include endocrine therapy for hormonal
receptor positive breast cancer6, anti-HER2 drugs (trastuzumab, pertuzumab, T-
DM1) in ERBB2 amplified breast cancer7-9, imatinib for chronic myeloid leukemia
with BCR-ABL fusion gene10 and in KIT-mutant gastrointestinal stromal tumors11,
gefitinib and erlotinib in patients with EGFR-mutant lung cancer12,13, vemurafenib14
and double BRAF and MEK inhibition15 for BRAF V600E mutant melanoma, and
crizotinib16 and ceritinib17 for non-small cell lung cancer (NSCLC) with EML4-ALK
translocation.
1.2. Metastatic breast cancer: epidemiology and treatment goals
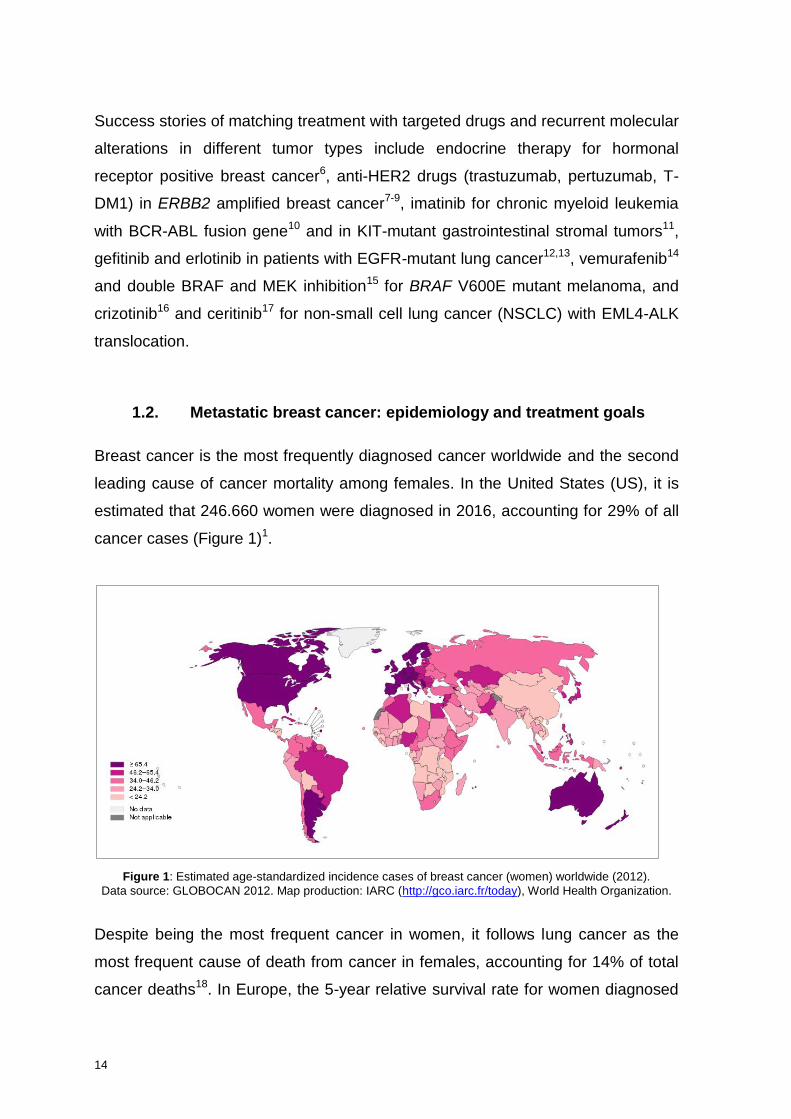
Breast cancer is the most frequently diagnosed cancer worldwide and the second
leading cause of cancer mortality among females. In the United States (US), it is
estimated that 246.660 women were diagnosed in 2016, accounting for 29% of all
cancer cases (Figure 1)1.
Figure 1: Estimated age-standardized incidence cases of breast cancer (women) worldwide (2012).
Data source: GLOBOCAN 2012. Map production: IARC (http://gco.iarc.fr/today), World Health Organization.
Despite being the most frequent cancer in women, it follows lung cancer as the
most frequent cause of death from cancer in females, accounting for 14% of total
cancer deaths18. In Europe, the 5-year relative survival rate for women diagnosed
15
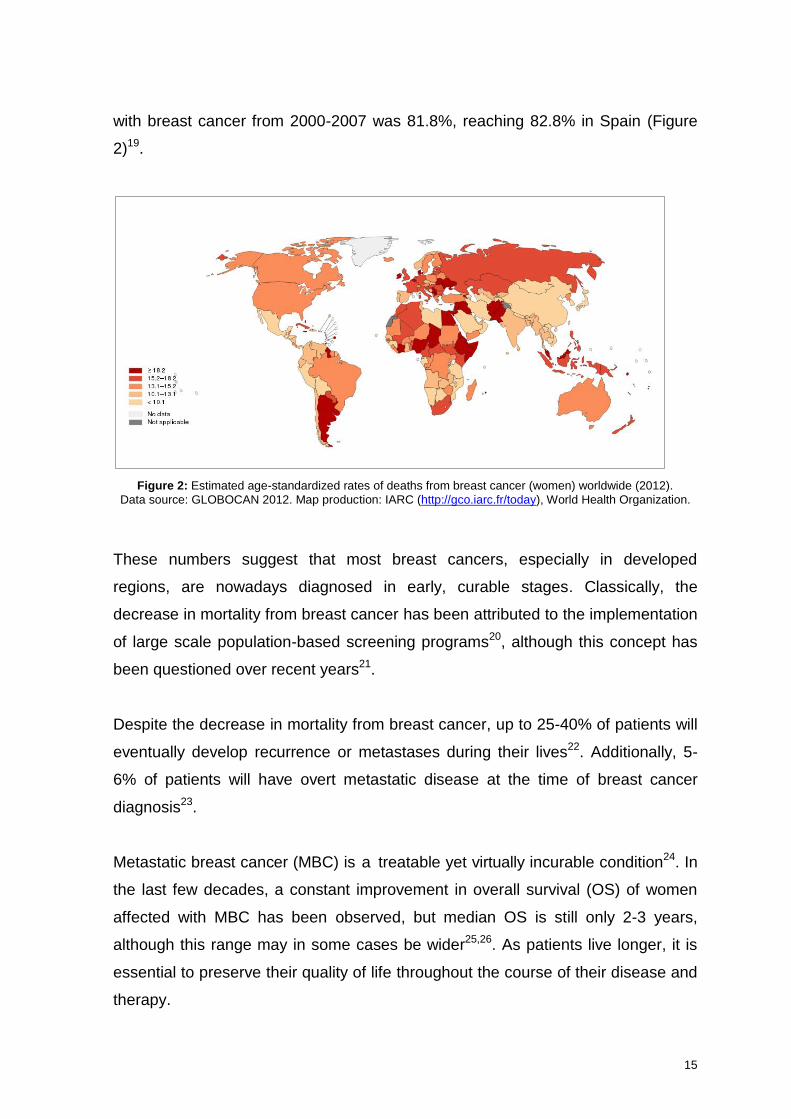
with breast cancer from 2000-2007 was 81.8%, reaching 82.8% in Spain (Figure
2)19.
Figure 2: Estimated age-standardized rates of deaths from breast cancer (women) worldwide (2012).
Data source: GLOBOCAN 2012. Map production: IARC (http://gco.iarc.fr/today), World Health Organization.
These numbers suggest that most breast cancers, especially in developed
regions, are nowadays diagnosed in early, curable stages. Classically, the
decrease in mortality from breast cancer has been attributed to the implementation
of large scale population-based screening programs20, although this concept has
been questioned over recent years21.
Despite the decrease in mortality from breast cancer, up to 25-40% of patients will
eventually develop recurrence or metastases during their lives22. Additionally, 5-
6% of patients will have overt metastatic disease at the time of breast cancer
diagnosis23.
Metastatic breast cancer (MBC) is a treatable yet virtually incurable condition24. In
the last few decades, a constant improvement in overall survival (OS) of women
affected with MBC has been observed, but median OS is still only 2-3 years,
although this range may in some cases be wider25,26. As patients live longer, it is
essential to preserve their quality of life throughout the course of their disease and
therapy.
16
The two main goals of care in MBC are to extend survival and optimize quality of
life26. The management of MBC is complex, and therefore crucially involves all
related specialties working together as multidisciplinary teams (including medical
oncologists, radiation oncologists, surgical oncologists, imaging experts,
pathologists, psychologists, social workers, nurses, palliative care experts, among
others)27.
Benefits in OS in MBC have a multifactorial origin, but key factors behind improved
OS are increased insights into the mechanism that drives the disease, and a better
management of both targeted therapies and cytotoxic agents. Data of HER2+
MBC patients treated with trastuzumab suggest that survival may be higher for
patients treated in specialized institutions28. For this reason, if at all possible,
management of MBC patients by multidisciplinary teams in specialized institutions
should be encouraged26.
Research remains a priority in this setting. Several international guidelines
recommend participation in well-designed, independent, prospective trials as a
treatment option to all eligible patients, whenever possible26,27.
1.3. Classification of breast cancer
Breast cancer is a heterogeneous disease. The discovery of the estrogen receptor
(ER)29 and the human epidermal growth factor receptor-2 (HER2)30 as drivers of
breast carcinogenesis has shed important light on different breast cancer subtypes
and led to the development and use of targeted agents against these receptors. In
2000, Perou and Sørlie described the messenger RNA (mRNA)-based intrinsic
subtypes of breast cancer and this classification has changed the way we
understand the disease31. In recent years, an increasing body of information
regarding the mutational and copy number variation (CNV) landscape of breast
cancer has also emerged.
17
We will now briefly discuss each of these tremendous advances in our
understanding of breast cancer biology.
1.3.1. Targeting ER and HER2
ER is a nuclear protein that acts as a transcription factor. Upon physiological
conditions, and after activation by its ligand, ER binds DNA and promotes gene
transcription. It can also assume additional functions that are independent of DNA-
binding32. The two most common isoforms of ER are ERα and ERβ, codified by
the genes ESR1 (6q25.1) and ESR2 (14q23.2), respectively. Although both ERα
and ERβ are widely expressed in different tissues, ERα is preferentially expressed
in endometrium, breast, ovarian stromal cells, and hypothalamus, while ERβ is
found in ovarian granulosa cells, kidney, brain, bone, heart, lungs, intestinal
mucosa, prostate, and endothelial cells33.
Binding of estrogen to the ER stimulates proliferation of mammary cells, with the
resulting increase in cell division and DNA replication, which may lead to the
development of mutations that can cause disruption of cell cycle, apoptosis and
DNA repair and, eventually, tumor formation34. ER is overexpressed in around
70% of breast cancer cases, referred to as ER-positive (ER+) tumors35.
Tamoxifen, a selective ER modulator with antagonist properties in the breast
tissue, was the first widely used targeted therapy in breast cancer6. Tamoxifen
improves the outcomes of ER+ breast cancer in both the early and metastatic
settings. The meta-analysis reported by the Early Breast Cancer Trialists’
Collaborative Group (EBCTCG) analyzed data from 10.645 women with ER+
breast cancer treated with tamoxifen or with placebo36. In this study, 5 years of
adjuvant tamoxifen reduced the 15-year risk of breast cancer recurrence (relative
risk [RR] 0.53 during years 0-4 and RR 0.68 during years 5-10, both 2P<0.00001)
and death (RR 0.71 during years 0-4 and RR 0.66 during years 5-9, and 0.68
during years 10-14; P<0.0001 for extra mortality reduction during each separate
time period), irrespective of the use of chemotherapy, age, progesterone receptor
(PgR) status, or other tumor characteristics.
18
Aromatase inhibitors (AI), such as letrozole, anastrozole, or exemestane, further
improve these results, resulting in a proportional reduction of recurrence rates and
mortality by about 30% and 15%, respectively, when compared to tamoxifen in the
adjuvant treatment of post-menopausal breast cancer patients37.
HER2 is a transmembrane protein encoded by the ERBB2 gene, located in
chromosome 17q21. HER2 is a member of the human epidermal growth factor
receptor (EGFR/ERBB) family and a well-recognized oncogene in breast cancer38.
Approximately 20-25% of all breast cancers have amplification or overexpression
of HER2, which is a marker of worse prognosis30.
Targeting the HER2 receptor in HER2-positive (HER2+) breast cancer has also
dramatically changed the natural history of this subtype of disease. The pivotal trial
that led to the approval of the first anti-HER2 drug tested the addition of
trastuzumab (a humanized IgG1 monoclonal antibody targeting HER2) to
conventional chemotherapy in 469 women with HER2+ MBC39. In this study,
treatment with trastuzumab associated with a longer time to disease progression
(median, 7.4 vs. 4.6 months; P<0.001), a higher rate of objective response (50%
vs. 32%; P<0.001), and an improved survival (median survival, 25.1 vs. 20.3
months; P=0.01) when compared to placebo.
A further step in improving the prognosis of HER2+ MBC patients came with the
addition of pertuzumab, a humanized monoclonal antibody that binds the
subdomain II of the HER2 extracellular domain, to standard therapy8. The
CLEOPATRA trial enrolled 808 patients to receive pertuzumab plus trastuzumab
plus docetaxel or placebo plus trastuzumab plus docetaxel in the first line
treatment of HER2+ MBC. In the final pre-specified OS results, pertuzumab
significantly improved the median OS to 56.5 months as compared with 40.8
months in the group receiving the placebo combination (hazard ratio [HR] 0.68,
95% confidence interval [CI] 0.56-0.84; P<0.001). Median progression-free
survival (PFS) as assessed by investigators also improved by 6.3 months in the
19
pertuzumab group (HR 0.68, 95%CI 0.58-0.80). These outstanding results led to
the approval of pertuzumab in the first-line treatment of HER2+ MBC.
T-DM1 is another anti-HER2 drug that has improved outcomes of HER2+ MBC
patients. With a different mechanism of action with respect to trastuzumab and
pertuzumab, it is an antibody-drug conjugate that incorporates the HER2-targeted
antitumor properties of trastuzumab with the cytotoxic activity of the microtubule-
inhibitory agent DM1 (a derivative of maytansine); the antibody and the cytotoxic
agent are conjugated by means of a stable linker40. In the EMILIA trial, 991
patients that previously progressed to anthracyclines, taxanes, and trastuzumab,
were randomized to receive T-DM1 or lapatinib plus capecitabine9. Treatment with
T-DM1 significantly reduced the risk of progression or death in this setting: HR for
PFS 0.65 (95%CI 0.55-0.77, P<0.001; 9.6 vs. 6.4 months) and HR for OS 0.68
(95%CI 0.55-0.85, P<0.001; 30.9 vs. 25.1 months). Similar benefits were observed
in the TH3RESA trial that randomly assigned 602 patients who had previously
progressed to two or more HER2-directed regimens in the advanced setting and
taxanes in any setting to receive T-DM1 or treatment of physician's choice
(TPC)41. PFS significantly improved with T-DM1 compared with TPC (median 6.2
months [95%CI 5.59-6.87] vs. 3.3 months [2.89-4.14]; stratified HR 0.53, 95%CI
0.42-0.66; P<0.0001). The trial also showed positive results in terms of OS in the
final results presented at the San Antonio Breast Cancer Symposium in 2015
(median OS 22.7 vs. 15.8 months; HR 0.68, 95%CI 0.54-0.85; P=0.0007)42. These
results led to the approval of T-DM1 in patients with HER2+ MBC who previously
received trastuzumab and a taxane, separately or in combination.
Regarding early stage disease, trastuzumab is routinely used in the adjuvant
setting since the publication of several trials consistently showing an improvement
of PFS and OS with the addition of trastuzumab to standard adjuvant
chemotherapy7,43-45. Pertuzumab and T-DM1 are also being tested in the adjuvant
setting, but results from these clinical trials are not yet available.
20
1.3.2. The intrinsic subtypes of breast cancer
In their seminal work published initially in Nature in 2000, Perou and Sørlie
analyzed 65 surgical samples from 42 patients using cDNA microarrays that
represented 8102 human genes, and identified four different subtypes of breast
cancer, based on their gene expression pattern: luminal, normal-like, basal, and
HER2-enriched (HER2-E)31. They further refined this classification by analyzing an
additional 78 samples, as well as three mammary fibroadenomas and four
samples of normal breast tissue. This new analysis subdivided the luminal type
(characterized by the high expression of genes associated with luminal cells from
normal breast tissue) into at least two additional subtypes – Luminal A and
Luminal B – according to the low or high expression of proliferation-associated
genes46.
This classification provides important prognostic information: basal and HER2-E
subtypes have consistently shown to have a worse prognosis than luminal B
(intermediate prognosis) and the good-prognosis luminal A tumors46,47. A
commercially available test (PAM50 Prosigna®, Nanostring) was developed to
assess the intrinsic subtypes of breast cancer, and is used together with other
gene platforms such as OncotypeDX® (Genomic Health / Palex), Mammaprint®
(Ferrer in Code) or Endopredict® (Myriad Genetics) to evaluate prognosis of early
stage breast cancer and the potential benefit of adjuvant chemotherapy.
Surrogate immunohistochemistry (IHC) profiles from the intrinsic subtypes of
breast cancer are usually applied in clinical practice to classify breast cancer.
Different cut-offs for Ki67, as well as different classification of tumors according to
grade or PgR status, have been used in the literature. To harmonize such
classification, the St. Gallen consensus in 2013 issued various recommendations
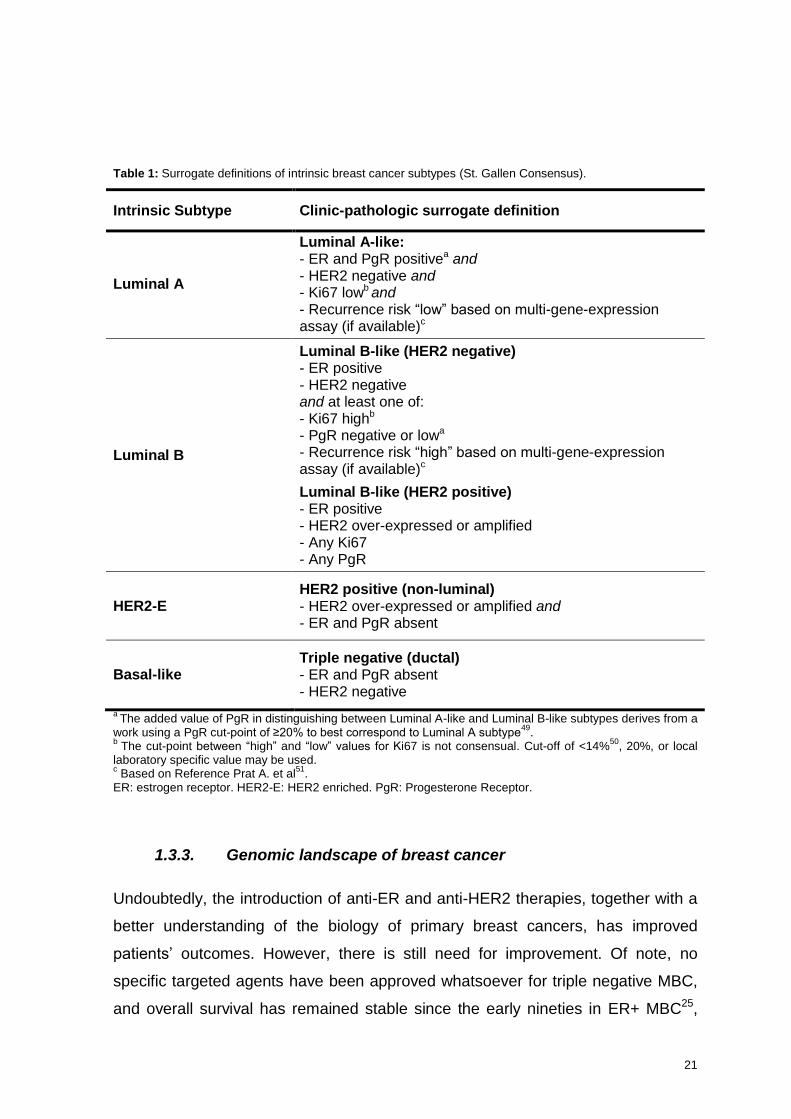
that are now widely adopted (Table 1)48. Although the correlation with the intrinsic
subtypes is not perfect, this classification is a useful tool to routinely assess
prognosis and better tailor therapy to the individual patients.
21
Table 1: Surrogate definitions of intrinsic breast cancer subtypes (St. Gallen Consensus).
Intrinsic Subtype Clinic-pathologic surrogate definition
Luminal A
Luminal A-like: - ER and PgR positivea and - HER2 negative and - Ki67 lowb and - Recurrence risk “low” based on multi-gene-expression assay (if available)c
Luminal B
Luminal B-like (HER2 negative) - ER positive - HER2 negative and at least one of: - Ki67 highb - PgR negative or lowa - Recurrence risk “high” based on multi-gene-expression assay (if available)c
Luminal B-like (HER2 positive) - ER positive - HER2 over-expressed or amplified - Any Ki67 - Any PgR
HER2-E HER2 positive (non-luminal) - HER2 over-expressed or amplified and - ER and PgR absent
Basal-like Triple negative (ductal) - ER and PgR absent - HER2 negative
a The added value of PgR in distinguishing between Luminal A-like and Luminal B-like subtypes derives from a
work using a PgR cut-point of ≥20% to best correspond to Luminal A subtype49
. b
The cut-point between “high” and “low” values for Ki67 is not consensual. Cut-off of <14%50
, 20%, or local laboratory specific value may be used. c Based on Reference Prat A. et al
51.
ER: estrogen receptor. HER2-E: HER2 enriched. PgR: Progesterone Receptor.
1.3.3. Genomic landscape of breast cancer
Undoubtedly, the introduction of anti-ER and anti-HER2 therapies, together with a
better understanding of the biology of primary breast cancers, has improved
patients’ outcomes. However, there is still need for improvement. Of note, no
specific targeted agents have been approved whatsoever for triple negative MBC,
and overall survival has remained stable since the early nineties in ER+ MBC25,
22
suggesting that a deeper understanding of breast cancer biology is needed in
order to optimize therapy.
Cancer genomics refers to the study of tumor genomes at different levels,
including changes in the DNA sequence (copy number alterations, mutations, and
rearrangements), epigenome (DNA methylation and histone modification patterns),
and transcriptome (gene or microRNA expression)52. Tumor development may
occur as a consequence of several genomic dysregulations, such as gene
inactivation (by mutations, deletions, or gene promoter silencing), changes in gene
expression (by methylation or copy number changes), and mutations or gene
rearrangements that result in gene activation52,53.
Recent advances in massively parallel sequencing technologies allow faster, more
sensitive, and more precise analyses of cancer genomes, including breast
cancer4. Several international initiatives including The Cancer Genome Atlas
(TCGA) and the International Cancer Genome Consortium (ICGC) have helped to
characterize the genomic alterations and the mutational processes that occur in
early breast cancer (EBC)54-56.
Using DNA copy number arrays, DNA methylation, whole-exome sequencing,
mRNA arrays, microRNA sequencing, and reverse-phase protein arrays (RPPA),
these studies have shown that the most frequent alterations overall in breast
cancer (independently of intrinsic subtype) are TP53 and PIK3CA mutations
(around 28% for both genes), amplifications in ERBB2, FGFR1, and CCND1 (10-
20%), phosphatase and tensin homolog deleted on chromosome 10 (PTEN)
mutations and deletions (leading to PTEN loss of expression), and AKT1, RB1,
BRCA1 and BRCA2 mutations (Figure 3). Other less commonly mutated genes
are KRAS, APC, NF1, NF2, SKT11, MAP2K4, MAP3K1, and AKT255,56. A high
proportion of mutations in noncoding regions of the genome, such as PLEKHS1,
TBC1D12, and WDR74 promoters, as well as in the MALAT1 and NEAT1 long
non-coding RNAs have also been identified, but the clinical significance of this
finding has yet to be established.
23
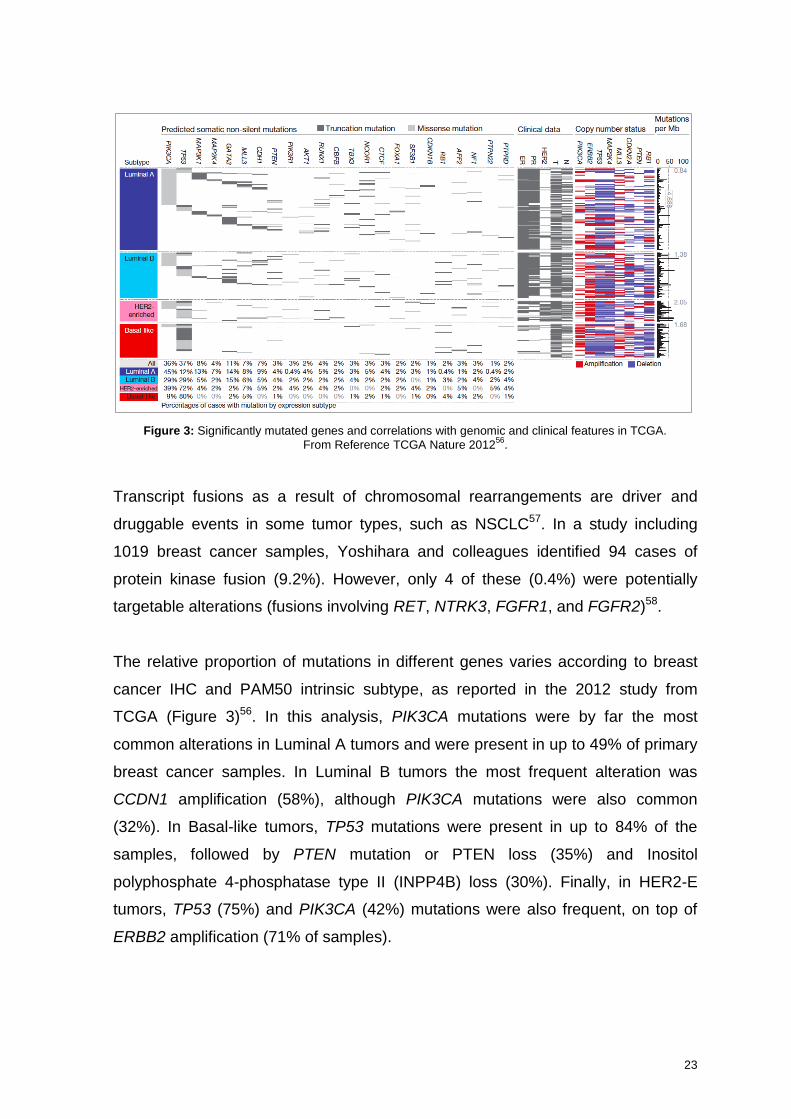
Figure 3: Significantly mutated genes and correlations with genomic and clinical features in TCGA.
From Reference TCGA Nature 201256
.
Transcript fusions as a result of chromosomal rearrangements are driver and
druggable events in some tumor types, such as NSCLC57. In a study including
1019 breast cancer samples, Yoshihara and colleagues identified 94 cases of
protein kinase fusion (9.2%). However, only 4 of these (0.4%) were potentially
targetable alterations (fusions involving RET, NTRK3, FGFR1, and FGFR2)58.
The relative proportion of mutations in different genes varies according to breast
cancer IHC and PAM50 intrinsic subtype, as reported in the 2012 study from
TCGA (Figure 3)56. In this analysis, PIK3CA mutations were by far the most
common alterations in Luminal A tumors and were present in up to 49% of primary
breast cancer samples. In Luminal B tumors the most frequent alteration was
CCDN1 amplification (58%), although PIK3CA mutations were also common
(32%). In Basal-like tumors, TP53 mutations were present in up to 84% of the
samples, followed by PTEN mutation or PTEN loss (35%) and Inositol
polyphosphate 4-phosphatase type II (INPP4B) loss (30%). Finally, in HER2-E
tumors, TP53 (75%) and PIK3CA (42%) mutations were also frequent, on top of
ERBB2 amplification (71% of samples).
24
Interestingly, the genetic landscape of breast tumors also varies according to
histological subtype. The comprehensive profiling of 817 breast tumors, including
127 invasive lobular cancers (ILC), 490 invasive ductal cancers (IDC), and 88
mixed IDC/ILC, showed that besides E-cadherin loss (that defines ILC), ILC is
enriched in PTEN mutations (leading to increased AKT phosphorylation when
compared to IDC samples), TBX3 mutations, and FOXA1 mutations. Conversely,
GATA3 mutations and GATA3 high expression characterized luminal A IDC54.
In a second study that also assessed the specific genetic alterations in ILC, it was
reported that, besides the expected high mutation frequency of CDH1 (65%), half
of the tumors were mutated in at least one of the three key genes of the
PI3K/AKT/mTOR (PAM) pathway, namely PIK3CA (43.3%), PTEN (3.9%), or
AKT1 (4.1%)59. Other relevant gene alterations were mutations in ERBB2 (5.1%),
ERBB3 (3.6%), and in several transcriptional regulators such as TBX3 (13.3%),
FOXA1 (9%), KMT2C (8%), GATA3 (7.3%), and ARID1A (6.3%).
1.4. Molecular screening initiatives in breast cancer
To keep abreast of all the aforementioned developments as well as translate
genomic data into improved patient care, several Institutions across the globe
have strategically planned to integrate precision medicine in daily clinical
practice60-62. These so-called “pre-screening programs” aim at sequencing tumor
samples of patients that are potential candidates for early-phase clinical trials.
Genomic information can then help guide treatment decisions and the inclusion of
patients who can potentially derive most benefit from targeted treatments. There
are some challenges in establishing these programs, including: (1) selection of the
most suitable screening platforms; (2) the somatic variant calling strategy; (3) the
availability of a clinically adequate clinical trials portfolio within a given Institution;
and (4) the availability of patients that make such a strategy cost-effective.
Comprehensive reviews on these issues can be found elsewhere52,60.
In recent years, multicenter and/or international prospective trials have been
launched to better understand the molecular alterations associated with MBC. We
25
can divide these into first generation studies aimed at a better understanding of
cancer biology, and prospective randomized clinical trials that test the hypothesis
that the matching of molecular alterations to specific targeted drugs improves MBC
outcomes.
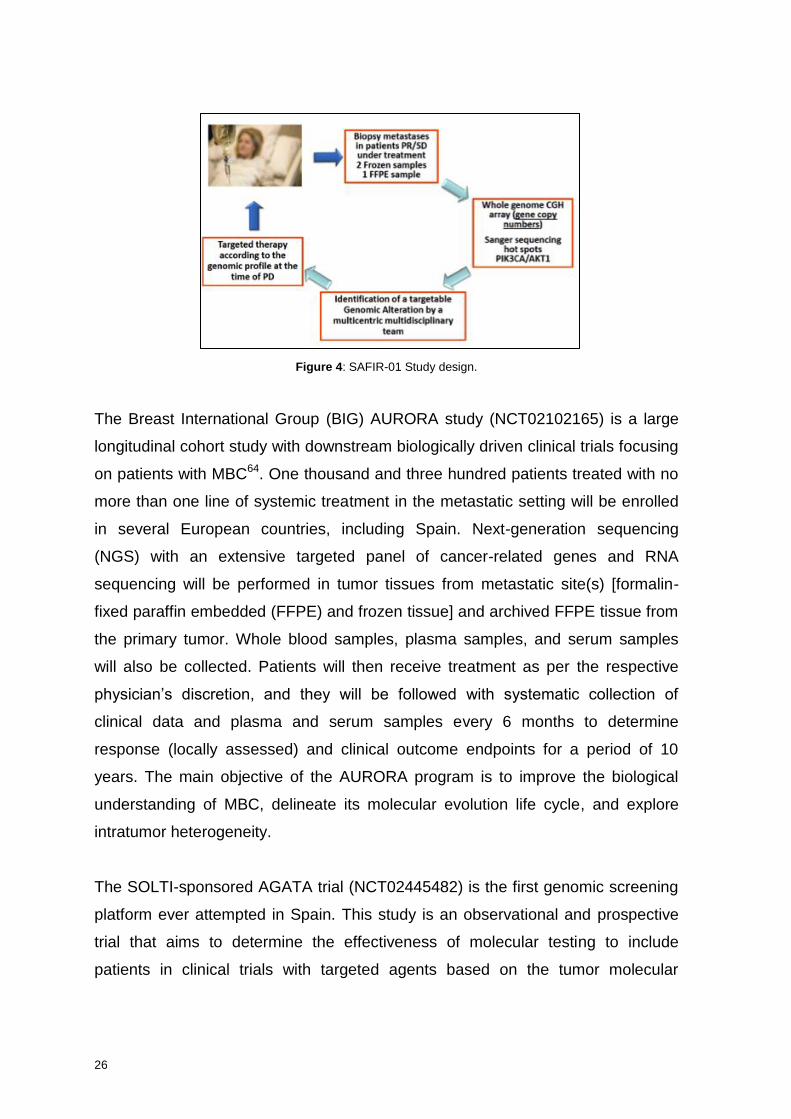
One of the first reported initiatives was the French SAFIR-01 trial (Figure 4)63. This
multicenter molecular screening study was designed to identify molecular
abnormalities in individual patients in order to provide targeted therapy matched to
the individuals’ genomic alterations. Comparative genomic hybridization (CGH)
array and Sanger sequencing on PIK3CA (exon 9 and 20) and AKT1 (exon 4)
were performed in 407 fresh metastatic samples obtained from 423 patients with
MBC. A targetable genomic alteration was identified in 195 (46%) patients, most
frequently PIK3CA mutation (25%), CCND1 amplification (19%), and FGFR1
amplification (13%). Of note, 39% of patients had rare genomic alterations
(defined as occurring in less than 5% of the general population), including AKT1
mutations, and EGFR, MDM2, FGFR2, AKT2, IGF1R, and MET high-level
amplifications. Therapy could be personalized in only 13% of the patients, either
due to issues related with the sample (low percentage of tumor cells to perform the
test, no confirmation of metastatic tumor, failure of CGH or sequencing), or to the
lack of access to the matched drug once the genotyping result was available.
Notably, response rate among those patients that received matched targeted
therapies (85% as single agent) was generally higher than 30%. While the authors
concluded that performing such a molecular screening in MBC is feasible, the low
yield of such an effort should be considered.
26
Figure 4: SAFIR-01 Study design.
The Breast International Group (BIG) AURORA study (NCT02102165) is a large
longitudinal cohort study with downstream biologically driven clinical trials focusing
on patients with MBC64. One thousand and three hundred patients treated with no
more than one line of systemic treatment in the metastatic setting will be enrolled
in several European countries, including Spain. Next-generation sequencing
(NGS) with an extensive targeted panel of cancer-related genes and RNA
sequencing will be performed in tumor tissues from metastatic site(s) [formalin-
fixed paraffin embedded (FFPE) and frozen tissue] and archived FFPE tissue from
the primary tumor. Whole blood samples, plasma samples, and serum samples
will also be collected. Patients will then receive treatment as per the respective
physician’s discretion, and they will be followed with systematic collection of
clinical data and plasma and serum samples every 6 months to determine
response (locally assessed) and clinical outcome endpoints for a period of 10
years. The main objective of the AURORA program is to improve the biological
understanding of MBC, delineate its molecular evolution life cycle, and explore
intratumor heterogeneity.
The SOLTI-sponsored AGATA trial (NCT02445482) is the first genomic screening
platform ever attempted in Spain. This study is an observational and prospective
trial that aims to determine the effectiveness of molecular testing to include
patients in clinical trials with targeted agents based on the tumor molecular
27
profiling. It will enroll 260 patients across eight Spanish sites, and it is expected to
conclude in 2017.
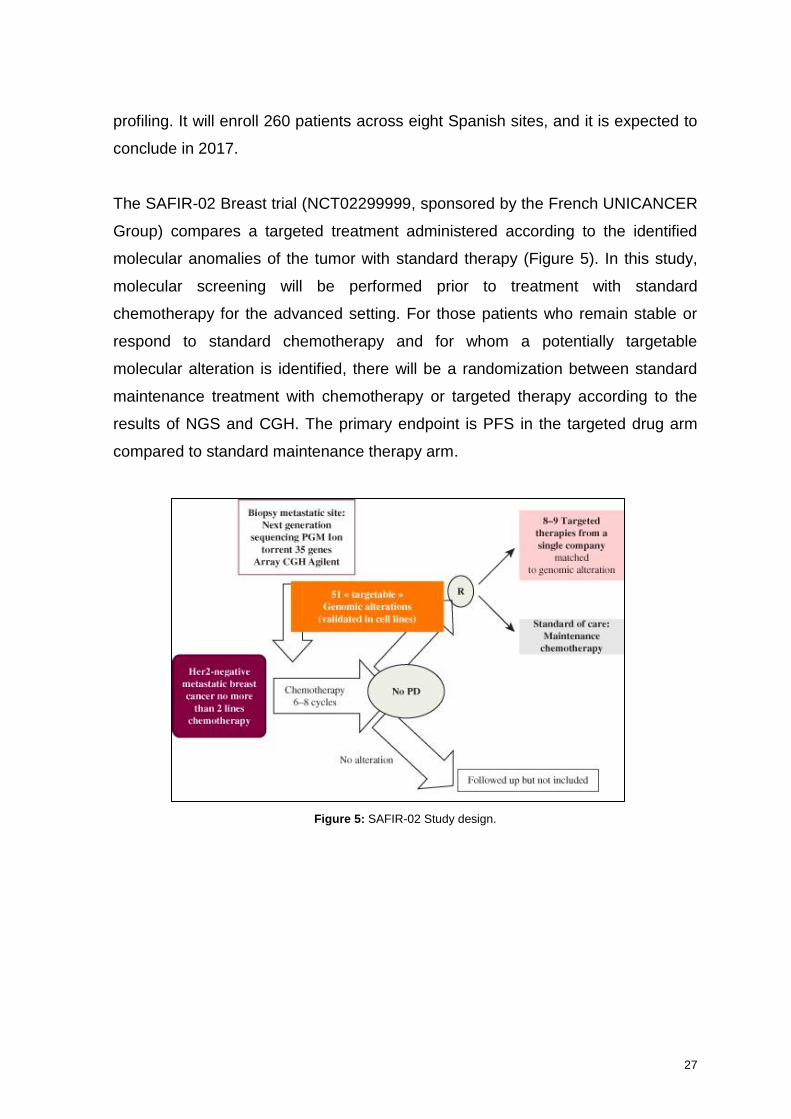
The SAFIR-02 Breast trial (NCT02299999, sponsored by the French UNICANCER
Group) compares a targeted treatment administered according to the identified
molecular anomalies of the tumor with standard therapy (Figure 5). In this study,
molecular screening will be performed prior to treatment with standard
chemotherapy for the advanced setting. For those patients who remain stable or
respond to standard chemotherapy and for whom a potentially targetable
molecular alteration is identified, there will be a randomization between standard
maintenance treatment with chemotherapy or targeted therapy according to the
results of NGS and CGH. The primary endpoint is PFS in the targeted drug arm
compared to standard maintenance therapy arm.
Figure 5: SAFIR-02 Study design.
28
1.5. The PAM pathway in human cancer
The phosphatidylinositol 3-kinases (PI3Ks) are a family of lipid kinases that
mediate a cascade of intracellular signal transduction that ultimately regulates
several key cellular functions, such as protein synthesis, cell cycle control, and
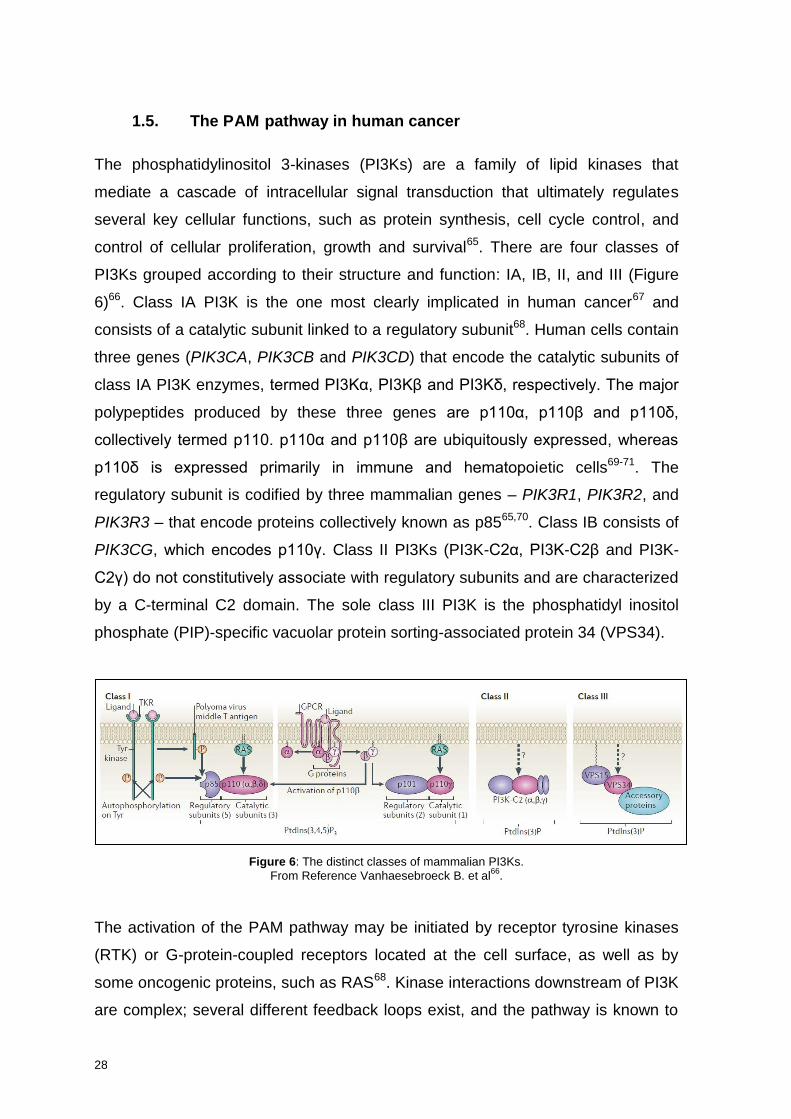
control of cellular proliferation, growth and survival65. There are four classes of
PI3Ks grouped according to their structure and function: IA, IB, II, and III (Figure
6)66. Class IA PI3K is the one most clearly implicated in human cancer67 and
consists of a catalytic subunit linked to a regulatory subunit68. Human cells contain
three genes (PIK3CA, PIK3CB and PIK3CD) that encode the catalytic subunits of
class IA PI3K enzymes, termed PI3Kα, PI3Kβ and PI3Kδ, respectively. The major
polypeptides produced by these three genes are p110α, p110β and p110δ,
collectively termed p110. p110α and p110β are ubiquitously expressed, whereas
p110δ is expressed primarily in immune and hematopoietic cells69-71. The
regulatory subunit is codified by three mammalian genes – PIK3R1, PIK3R2, and
PIK3R3 – that encode proteins collectively known as p8565,70. Class IB consists of
PIK3CG, which encodes p110γ. Class II PI3Ks (PI3K-C2α, PI3K-C2β and PI3K-
C2γ) do not constitutively associate with regulatory subunits and are characterized
by a C-terminal C2 domain. The sole class III PI3K is the phosphatidyl inositol
phosphate (PIP)-specific vacuolar protein sorting-associated protein 34 (VPS34).
Figure 6: The distinct classes of mammalian PI3Ks.
From Reference Vanhaesebroeck B. et al66
.
The activation of the PAM pathway may be initiated by receptor tyrosine kinases
(RTK) or G-protein-coupled receptors located at the cell surface, as well as by
some oncogenic proteins, such as RAS68. Kinase interactions downstream of PI3K
are complex; several different feedback loops exist, and the pathway is known to
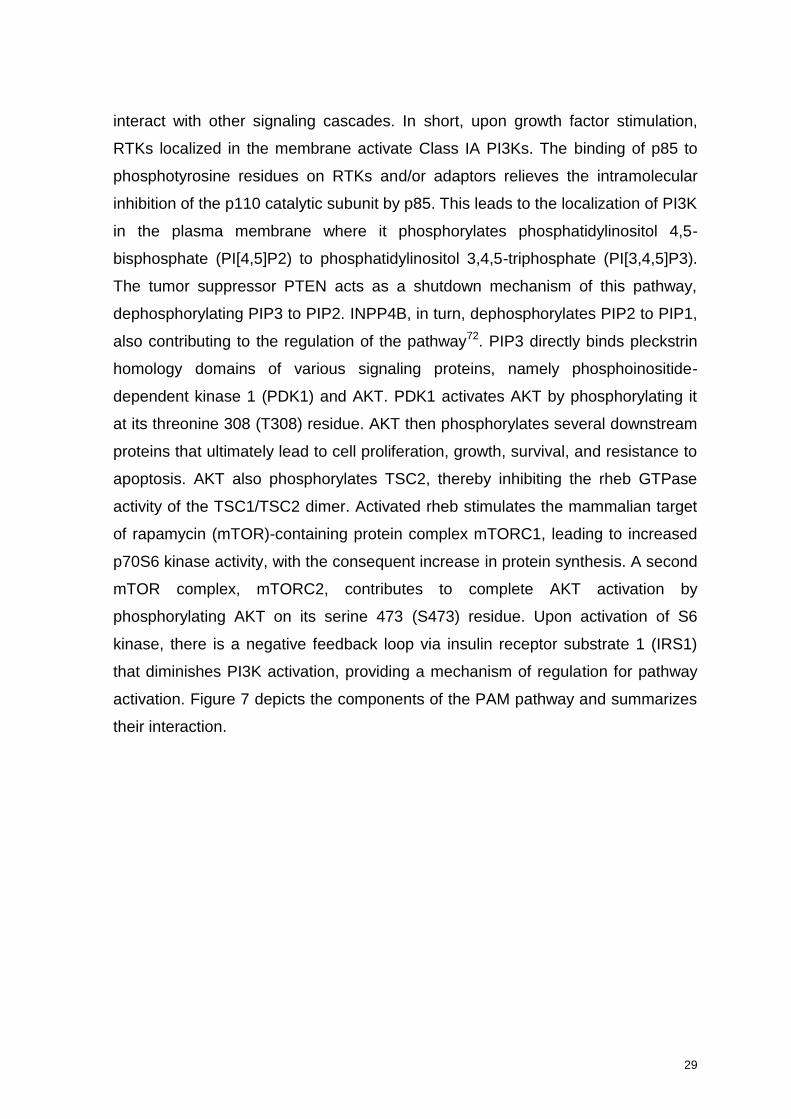
29
interact with other signaling cascades. In short, upon growth factor stimulation,
RTKs localized in the membrane activate Class IA PI3Ks. The binding of p85 to
phosphotyrosine residues on RTKs and/or adaptors relieves the intramolecular
inhibition of the p110 catalytic subunit by p85. This leads to the localization of PI3K
in the plasma membrane where it phosphorylates phosphatidylinositol 4,5-
bisphosphate (PI[4,5]P2) to phosphatidylinositol 3,4,5-triphosphate (PI[3,4,5]P3).
The tumor suppressor PTEN acts as a shutdown mechanism of this pathway,
dephosphorylating PIP3 to PIP2. INPP4B, in turn, dephosphorylates PIP2 to PIP1,
also contributing to the regulation of the pathway72. PIP3 directly binds pleckstrin
homology domains of various signaling proteins, namely phosphoinositide-
dependent kinase 1 (PDK1) and AKT. PDK1 activates AKT by phosphorylating it
at its threonine 308 (T308) residue. AKT then phosphorylates several downstream
proteins that ultimately lead to cell proliferation, growth, survival, and resistance to
apoptosis. AKT also phosphorylates TSC2, thereby inhibiting the rheb GTPase
activity of the TSC1/TSC2 dimer. Activated rheb stimulates the mammalian target
of rapamycin (mTOR)-containing protein complex mTORC1, leading to increased
p70S6 kinase activity, with the consequent increase in protein synthesis. A second
mTOR complex, mTORC2, contributes to complete AKT activation by
phosphorylating AKT on its serine 473 (S473) residue. Upon activation of S6
kinase, there is a negative feedback loop via insulin receptor substrate 1 (IRS1)
that diminishes PI3K activation, providing a mechanism of regulation for pathway
activation. Figure 7 depicts the components of the PAM pathway and summarizes
their interaction.
30
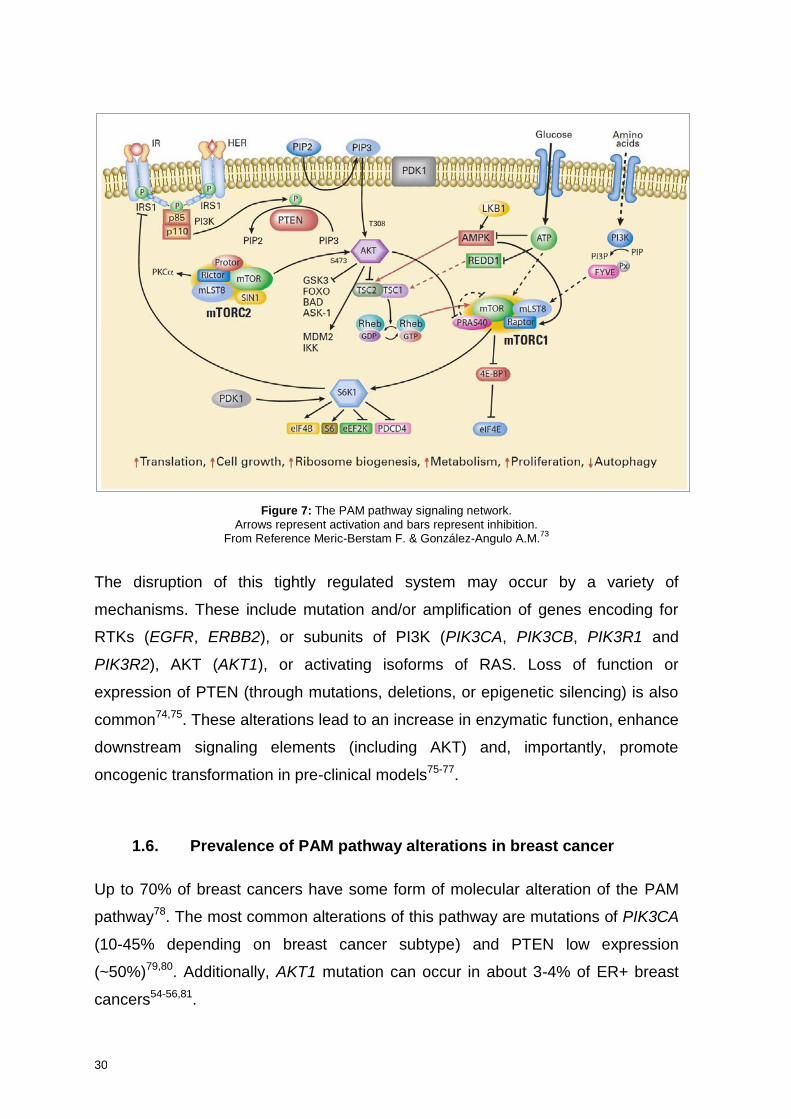
Figure 7: The PAM pathway signaling network.
Arrows represent activation and bars represent inhibition. From Reference Meric-Berstam F. & González-Angulo A.M.
73
The disruption of this tightly regulated system may occur by a variety of
mechanisms. These include mutation and/or amplification of genes encoding for
RTKs (EGFR, ERBB2), or subunits of PI3K (PIK3CA, PIK3CB, PIK3R1 and
PIK3R2), AKT (AKT1), or activating isoforms of RAS. Loss of function or
expression of PTEN (through mutations, deletions, or epigenetic silencing) is also
common74,75. These alterations lead to an increase in enzymatic function, enhance
downstream signaling elements (including AKT) and, importantly, promote
oncogenic transformation in pre-clinical models75-77.
1.6. Prevalence of PAM pathway alterations in breast cancer
Up to 70% of breast cancers have some form of molecular alteration of the PAM
pathway78. The most common alterations of this pathway are mutations of PIK3CA
(10-45% depending on breast cancer subtype) and PTEN low expression
(~50%)79,80. Additionally, AKT1 mutation can occur in about 3-4% of ER+ breast
cancers54-56,81.
31
There are many studies describing the prevalence and prognostic implications of
PAM pathway alterations in breast cancer. In the following paragraphs, we will
briefly discuss the most important findings from three seminal analyses: the TCGA
data, the ICGC study, and the recently published data from the METABRIC
Consortium.
1.6.1. TCGA data
Alterations in the PAM pathway were analyzed in detail in 357 primary breast
cancer samples from the TCGA consortium56. This analysis was further extended
to 817 samples, with a special focus on ILC (N=127)54.
1.6.1.1. ER+/HER2-negative breast cancer
Within ER+/HER2-negative breast tumors, the proportion of PAM pathway
alterations varies according to the different intrinsic subtypes56. In ER+/HER2-
negative Luminal A tumors, PIK3CA mutations occurred in 49%, PTEN mutations
or loss in 13%, and INPP4B loss in 9% of the samples; in ER+/HER2-negative
Luminal B tumors, the proportions were 32%, 24%, and 16%, respectively. AKT1
mutations were also present in 4% of Luminal A and 2% of Luminal B tumors.
Interestingly, RPPA data did not show a correlation between PIK3CA mutations in
Luminal A samples and downstream markers of PAM pathway activation, such as
increased pAKT, pS6 and p4EBP1, in contrast to what was observed in basal-like
and HER2-E subtypes (the latter having frequent PIK3CA mutations). This had
been previously reported82, and may explain the lack of correlation between
PIK3CA mutations and worse prognosis in ER+/HER2-negative breast cancer83.
1.6.1.2. Basal like breast cancer
In basal-like tumors, PIK3CA mutations were less frequent (7%) than in luminal or
HER2-E tumors. Interestingly, basal-like breast tumors showed the highest levels
32
of PAM pathway activation, as measured by protein readouts. This activation was
secondary to either mutation/loss of PTEN (35%) and INPP4B (30%), and/or
amplification of PIK3CA (49%).
1.6.1.3. HER2-E breast cancer
In the TCGA dataset, not all clinically HER2+ tumors were of the HER2-E subtype.
Conversely, not all HER2-E tumors were clinically HER2+. These observations are
similar to other published studies84-86. The most frequent alterations in the PAM
pathway in HER2-E subtype were PIK3CA mutations (42%), PTEN mutation or
loss (19%), and INPP4B loss (30%).
1.6.1.4. ILC and expanded TCGA data
The updated TCGA analysis published in 2015 included 817 samples, with a focus
on 127 ILC samples54. Regarding PAM pathway alterations, PIK3CA mutations
were more frequent in ILC than in IDC (48% vs. 33%). Luminal A ILC (81% of ILC
cases) had the highest proportion of PIK3CA mutations (51%), followed by
Luminal A IDC (47%) and Luminal B IDC (35%). In this analysis, PIK3CA mutation
frequency in HER2-E and Basal-like tumors was 37.3% and 6.5%, respectively.
Although the percentage of PIK3CA mutations did not significantly differ between
Luminal A ILC and Luminal A IDC, PTEN inactivation did emerge as a discriminant
feature between these two subtypes. Collectively, PTEN inactivating alterations
were identified in 14% of Luminal A ILC versus 3% of Luminal A IDC (P=109E-4).
PTEN genetic alterations across all ILC cases included homozygous deletions
(6%) and somatic mutations (7%), and were largely mutually exclusive with
PIK3CA mutations (48%). PTEN mutations in HER2-E and Basal-like tumors
represented 7.8% and 5.6% of the cases, respectively.
Interestingly, ILC tumors showed significantly increased AKT phosphorylation at
both S473 (P=0.004) and T308 (P=107E-5) when compared to Luminal A IDC,
33
which is consistent with the higher proportion of PTEN inactivation in ILC. In fact,
ILC pAKT levels were comparable with those typically observed in the more
aggressive HER2+ and ER-negative/basal-like breast tumors. AKT1 mutations
were infrequent events, accounting for 2% of ILC (3% in Luminal A ILC) and 3% of
IDC (5% in Luminal A IDC). The percentage of AKT1 mutations in Luminal B IDC,
and HER2-E IDC was 2.6% and 2%, respectively. No AKT1 mutations were
detected in Basal-like tumors.
1.6.2. The International Cancer Genome Consortium
The ICGC is a global initiative aimed at comprehensively elucidating the genomic
changes – somatic mutations, abnormal expression of genes, epigenetic
modifications – present in many forms of cancers. In a recent study, Nik-Zeinal et
al. reported data from whole-genome sequencing of 560 primary breast cancer
samples55. Compared to targeted gene and exome sequencing, whole-genome
sequencing yields information about the mutational landscape of untranslated,
intronic and intergenic regions in a cancer genome. This may provide important
insights into activating driver rearrangements87 forming chimeric (fusion)
genes/proteins or relocating genes adjacent to new regulatory regions, or the role
of driver substitutions and indels in non-coding regions of the genome, originating
for instance long non-coding RNAs that may influence gene transcription
(epigenetic modulation)88.
Analysis of the whole genomes of 560 breast cancers and non-neoplastic tissue
from each individual (556 female and 4 male) detected 3,479,652 somatic base
substitutions, 371,993 small indels and 77,695 rearrangements, with substantial
variation in the number of each between individual samples. Prevalence of
mutations in PAM pathway-associated genes in ER+ and ER-negative samples,
respectively, were as follows: PIK3CA 38% and 20%, AKT1 4% and 1%, and
PTEN 8% and 30%.
34
1.6.3. METABRIC Consortium
In this study published in 2016, the authors provided information on 2433 primary
breast tumors regarding sequencing of 173 genes, copy number aberration (CNA),
and gene expression, together with long-term clinical follow-up data81. In this
dataset, PIK3CA was the most frequently mutated gene (40.1%). Other PAM
pathway genes frequently mutated were AKT1 (4%) and PTEN (4%). Again, the
rate of PIK3CA mutations differed according to intrinsic subtype: Luminal A 61%,
Luminal B 38%, HER2-E 37%, Basal-like 10%.
Interestingly, the authors found that PIK3CA mutations have distinct prognostic
associations in ER+ tumors stratified into the previously described Integrative
Clusters (IntClust)89*. Significant interactions between the presence of PIK3CA
mutations and a worse breast cancer specific survival were identified in IntClust
1+, 2+ and 9+, but not in IntClust 3+, 4+, 7+ and 8+. These results may suggest
that integration of IntClust information to PIK3CA mutational status could be
important to establish prognostic and also potentially predictive information beyond
the presence of PIK3CA mutation alone.
1.6.4. Online resources
Several online resources are available to easily check the frequency of genomic
alterations within a particular subset of breast cancer. They constitute user-friendly
tools for data mining and biology learning, and can be consulted at any time.
cBioportal, for instance, integrates updated information from the TCGA, as well as
other databases, such as METABRIC79,80.
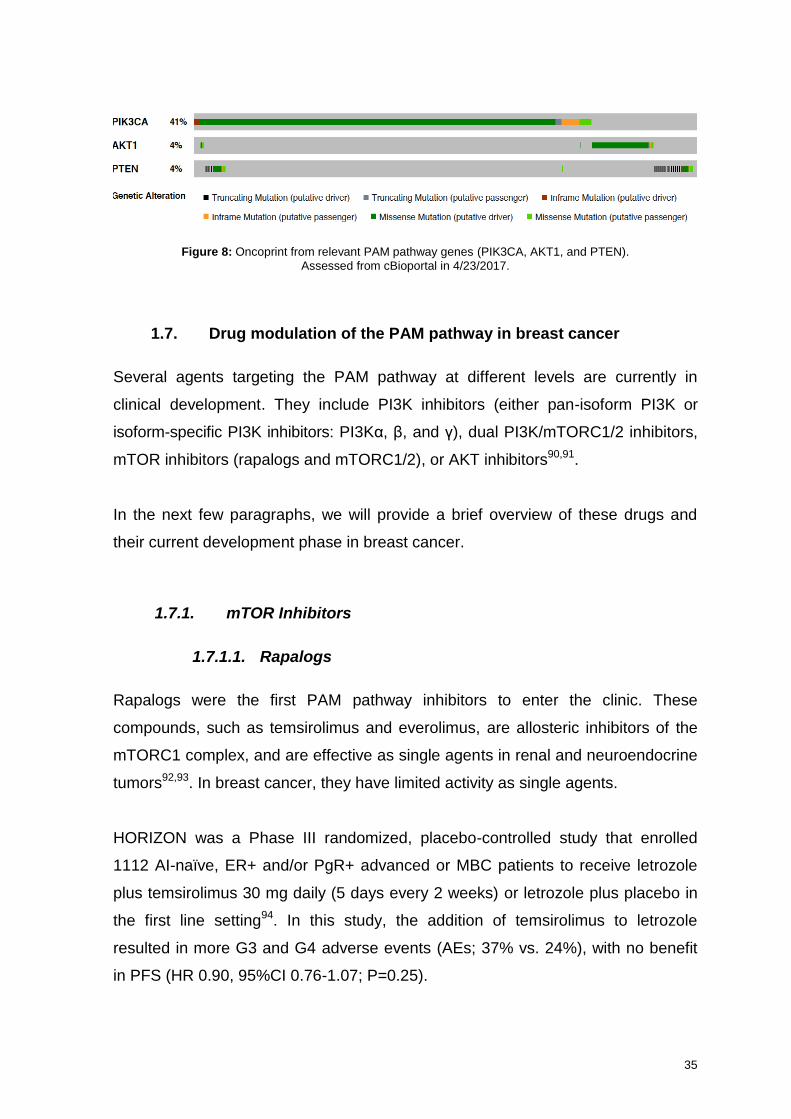
Figure 8 summarizes the output data from querying the cBioportal database with
relevant PAM pathway genes in breast cancer (PIK3CA, AKT1, and PTEN).
* In brief, this study performed a joint clustering of copy number and gene expression data from over 2000 primary breast cancers, and classified breast tumors in 10 different groups (IntClust) with distinct clinical outcomes. See Reference Curtis C. et al
87 for more information.
35
Figure 8: Oncoprint from relevant PAM pathway genes (PIK3CA, AKT1, and PTEN).
Assessed from cBioportal in 4/23/2017.
1.7. Drug modulation of the PAM pathway in breast cancer
Several agents targeting the PAM pathway at different levels are currently in
clinical development. They include PI3K inhibitors (either pan-isoform PI3K or
isoform-specific PI3K inhibitors: PI3Kα, β, and γ), dual PI3K/mTORC1/2 inhibitors,
mTOR inhibitors (rapalogs and mTORC1/2), or AKT inhibitors90,91.
In the next few paragraphs, we will provide a brief overview of these drugs and
their current development phase in breast cancer.
1.7.1. mTOR Inhibitors
1.7.1.1. Rapalogs
Rapalogs were the first PAM pathway inhibitors to enter the clinic. These
compounds, such as temsirolimus and everolimus, are allosteric inhibitors of the
mTORC1 complex, and are effective as single agents in renal and neuroendocrine
tumors92,93. In breast cancer, they have limited activity as single agents.
HORIZON was a Phase III randomized, placebo-controlled study that enrolled
1112 AI-naïve, ER+ and/or PgR+ advanced or MBC patients to receive letrozole
plus temsirolimus 30 mg daily (5 days every 2 weeks) or letrozole plus placebo in
the first line setting94. In this study, the addition of temsirolimus to letrozole
resulted in more G3 and G4 adverse events (AEs; 37% vs. 24%), with no benefit
in PFS (HR 0.90, 95%CI 0.76-1.07; P=0.25).
36
BOLERO-4 tested the efficacy and safety of first line everolimus plus letrozole in
202 postmenopausal patients with ER+/HER2-negative MBC95. After progression,
patients were allowed to continue with everolimus and switch endocrine therapy to
exemestane until further progression or unacceptable toxicity. Data that were
presented at the ESMO Congress in 2016 were not mature. With a median follow-
up of 17.5 months, PFS was not reached at data cutoff, and the estimated PFS at
12 months was 71.4% (95%CI 64.0%-77.5%). Overall response rate (ORR) and
clinical benefit rate (CBR) were 42.6% (95%CI 35.7%-49.7%) and 74.3% (67.7%-
80.1%), respectively. The most common AEs with the combination therapy were
stomatitis (67.8%), weight loss (42.6%), and diarrhea (36.1%)95.
The BOLERO-2 trial included patients with ER+/HER2-negative advanced or MBC
that had progressed to prior non-steroidal AI to receive exemestane in
combination with everolimus or placebo. Treatment with everolimus reduced the
risk of progression or death from any cause in 57% when compared to placebo
(HR 0.43, 95%CI 0.35-0.54; P<0.0001; median PFS 6.9 vs. 2.8 months)96. The
final PFS analysis reported later on confirmed these results (HR 0.45, 95%CI 0.38-
0.54; P<0.0001; median PFS 7.8 vs. 3.2 months)97. This PFS advantage did not
translate to OS advantage: median OS in patients receiving everolimus plus
exemestane was 31.0 months (95%CI 28.0-34.6 months) compared with 26.6
months (95%CI 22.6-33.1 months) in patients receiving placebo (HR 0.89, 95%CI
0.73-1.10; P= 0.14)98. However, the study was not powered to show OS
superiority with its sample size, and for that reason these results must be
interpreted with caution. The PFS results of the BOLERO-2 trial led to the approval
of everolimus in ER+/HER2-negative, AI-resistant, advanced or MBC, both in the
US and in Europe.
TAMRAD is a Phase II study that randomized 111 postmenopausal women with
ER+/HER2-negative, AI-resistant, MBC to receive tamoxifen plus everolimus or
tamoxifen alone99. Randomization was stratified by type of hormone resistance
(primary versus secondary). Primary resistance was defined as relapse during or
within 6 months of stopping adjuvant AI treatment or progressing within 6 months
of starting AI treatment in the metastatic setting. Secondary resistance was
37
defined as relapse after 6 months of stopping adjuvant AIs or responding for more
than 6 months to AIs in the metastatic setting. CBR (defined as the presence of
complete response [CR], partial response [PR], or stable disease [SD] at 6
months) was 61% (95%CI 47-74) with tamoxifen plus everolimus and 42% (95%CI
29-56) with tamoxifen alone. Time to progression (TTP) was 8.6 months with
tamoxifen plus everolimus and 4.5 months with tamoxifen alone (HR 0.54, 95%CI
0.36-0.81). The toxicity profile was expected and manageable, with fatigue (72%),
stomatitis (56%), rash (44%), anorexia (43%), and diarrhea (39%) as most
common AEs. Interestingly, the benefit of everolimus in terms of TTP was larger in
the group of patients with secondary endocrine resistance (median TTP 14.8 vs.
5.5 months; HR 0.46, 95%CI 0.26-0.83, exploratory log-rank P=0.009) than in
those with primary endocrine resistance (5.4 vs. 3.8 months; HR 0.70, 95%CI
0.40-1.21, exploratory log-rank P=NS). The authors concluded that treatment with
everolimus plus tamoxifen might revert endocrine resistance in ER+/HER2-
negative MBC, especially in the presence of secondary resistance99.
The BOLERO-1 trial tested the combination of paclitaxel, trastuzumab, and
everolimus in the first line treatment of patients with advanced HER2+ breast
cancer100. In this trial, the addition of everolimus did not improve PFS when
compared to trastuzumab plus paclitaxel. Median PFS in the paclitaxel plus
trastuzumab plus everolimus arm was 15 months and in the placebo arm 14.5
months (HR 0.89, 95%CI 0.73-1.08; P=0.117).
The BOLERO-3 trial tested the combination of everolimus with trastuzumab and
vinorelbine in patients with advanced HER2+ breast cancer after progression to
trastuzumab and a taxane. The triple combination statistically improved PFS over
trastuzumab and vinorelbine alone (HR 0.78, 95%CI 0.65-0.95; P=0.0067)101.
However, the small absolute PFS improvement of 1.2 months (7 vs. 5.8 months)
was not enough to establish this treatment as a new standard of care.
Collectively, these differences according to the setting in which rapalogs are used,
either in combination with endocrine therapy (HORIZON and BOLERO-4 vs.
BOLERO-2 and TAMRAD) and in combination with chemotherapy and HER2-
38
blockade (BOLERO-1 vs. BOLERO-3), may suggest that targeting mTOR in breast
cancer has a role in reverting acquired, but not primary, resistance to standard
therapies.
1.7.1.2. mTORC1/2 inhibitors
ATP-competitive mTOR inhibitors or mTORC1/2 inhibitors, inhibit both mTORC1
and mTORC2. By also blocking mTORC2, these compounds prevent the feedback
activation of AKT seen with rapalogs102. Some examples are AZD2014
(AstraZeneca) and MLN0128 (Millennium Pharmaceuticals, Inc.). Both drugs are
being tested in early-phase clinical trials in breast cancer, in combination to
standard endocrine and chemotherapy. Currently, we have only limited data from
phase I trials.
The Phase I trial of combination of AZD2014 with fulvestrant was presented at
ASCO 2016103. This trial enrolled 99 ER+ MBC patients in several dose escalating
cohorts of AZD2014 given twice a day (BID) either in a continuous schedule
(N=43) or in an intermittent schedule (N=56), in combination with fulvestrant. The
recommended Phase II dose (RP2D) was AZD2014 50mg BID continuous and
125mg BID on days 1 and 2 weekly. Dose limiting toxicities (DLTs) in the
continuous schedule included stomatitis, rash, and hyperglycemia. No DLTs were
observed in the intermittent schedule. Most common G3/4 AEs in the continuous
and intermittent schedule were hyperglycemia (12% and 14%, respectively), rash
(12% and 0%), fatigue (9% and 7%), stomatitis (5% and 4%), diarrhea (2% and
5%), and vomiting (2% and 5%). ORR was 17% in the continuous schedule and
13% in the intermittent schedule. CBR at 6 months was 33% and 25%,
respectively.
The MANTA trial (NCT02216786) is an open-label, multicentric, 4-arm randomized
Phase II trial of fulvestrant + AZD2014 (continuous and intermittent schedule)
versus fulvestrant + everolimus versus fulvestrant alone in patients with AI-
resistant, ER+/HER2-negative advanced or MBC. Approximately 300 patients are
randomized (2:3:3:2) to one of the four treatment arms: (1) fulvestrant; (2)
39
fulvestrant + AZD2014 (continuous daily schedule); (3) fulvestrant + AZD2014
(intermittent schedule 2 days on, 5 days off); (4) fulvestrant + everolimus. The
primary endpoint is PFS.
AZD2014 has also been tested in combination with paclitaxel in a Phase I trial,
results of which were presented at the ASCO Annual Meeting in 2014104. In this
study, patients with advanced solid tumors where treatment with paclitaxel was
appropriate were enrolled in several dose escalating cohorts of AZD2014 given
BID either in a 3/7 (3 days on, 4 days off) schedule (N=12) or in a 2/7 (2 days on, 5
days off) schedule (N=8), in combination with weekly paclitaxel 80mg/m2. In the
3/7 schedule, three patients had DLTs of G3 fatigue and/or mucositis at 75 mg of
AZD2014. G3 diarrhea was seen at 50mg BID, but this did not require treatment
discontinuation, and was short-lived when managed with antidiarrheals. In the 2/7
schedule two patients had DLT of G3 rash at 100 mg of AZD2014. Maximum
tolerated dose (MTD) for the 3/7 schedule is 80 mg/m2/week of paclitaxel and 50
mg BID of AZD2014. DLTs were G3 fatigue and mucositis. The 2/7 schedule of
AZD2014 at 100 mg BID in combination with weekly paclitaxel was declared as
non-tolerable due to two patients with G3 skin rash. At MTD of the 3/7 schedule,
the combination was well-tolerated with rates of neutropenia not exceeding single
agent paclitaxel in a heavily pre-treated population. Regarding efficacy, 3/5
patients with ovarian cancer had PR by Gynecologic Cancer Intergroup (GCIG)
and Response Evaluation Criteria In Solid Tumors (RECIST) criteria. Additionally,
2/2 patients with squamous cell lung cancer, and 1/3 patient with lung
adenocarcinoma showed tumor necrosis and RECIST radiological response.
MLN128 is being tested in a randomized Phase II trial in ER+/HER2-negative MBC
(NCT02756364). This study evaluates the efficacy and safety of the combination
of fulvestrant + daily MLN0128 and fulvestrant + weekly MLN0128 compared with
fulvestrant alone in approximately 153 patients. The primary endpoint is PFS.
40
1.7.2. Dual PI3K/mTOR inhibitors
Dual inhibitors of PI3K and mTOR target the active sites of both holoenzymes,
resulting in pathway inhibition both upstream and downstream AKT. Although the
rationale to use such drugs is compelling – especially in tumors with alterations
downstream of PI3K but upstream of mTOR (e.g., PTEN or TSC1/2) – their use in
the clinical setting has been limited by their challenging toxicity profile90. Examples
of these compounds that are or have been investigated in breast cancer are GDC-
0980 (Genentech)105,106, BEZ-235 (Novartis), XL-765 (Sanofi/Exelixis)107, PF-
05212384 (Pfizer), and PQR309 (PIQUR Pharmaceuticals). The development of
the first three has been discontinued. The Pfizer compound is being tested in
combination with chemotherapy (NCT01920061 and NCT02069158) and with
endocrine therapy plus palbociclib (NCT03065062 and NCT02626507). The
PIQUR compound is being tested as a single agent in all solid tumors
(NCT02483858) and in combination with eribulin, a chemotherapeutic compound,
in HER2-negative MBC (NCT02723877).
1.7.3. PI3K inhibitors
There are mainly two classes of PI3K inhibitors: pan-PIK3K inhibitors, and isoform-
specific PI3K inhibitors. The first ones inhibit at a similar half maximal inhibitory
concentration (IC50) the 4 isoforms of PI3K, while compounds in the second group
have more affinity for one of the isoforms (α, β, γ, or δ) compared to the others.
1.7.3.1. Pan-PI3K Inhibitors
Examples of pan-PI3K inhibitors tested in breast cancer are BAY80-6946 (Bayer,
NCT02705859), buparlisib (BKM120, Novartis)108-112, Pictilisib (GDC-0941,
Genentech)106,113,114, and SAR245408 (XL-147; Sanofi/Exelixis)115. For their
relevance in breast cancer, we will briefly discuss the results of the trials with
buparlisib and pictilisib.
41
1.7.3.1.1. Buparlisib (BKM120)
Buparlisib (BKM120, Novartis) was one of the first pan-PI3K inhibitors entering
clinical trials, and was tested in multiple tumors types. The MTD of buparlisib in the
Phase I escalation trial was 100 mg once a day (QD)112. Frequent treatment-
related AEs included rash, hyperglycemia, diarrhea, anorexia, mood alteration
(37% each), nausea (31%), fatigue (26%), pruritus (23%), and stomatitis (23%). In
terms of efficacy, a partial response was observed in a triple negative breast
cancer patient with a KRAS mutation. Following these results, several trials of
buparlisib were launched in breast cancer. The most relevant results presented
thus far are summarized in the next paragraphs.
The BELLE-2 trial (NCT01610284) enrolled 1147 postmenopausal women with
ER+/HER2-negative locally advanced or MBC that progressed on or after AI
therapy to receive either buparlisib or placebo in combination with fulvestrant116.
Randomization was stratified by PI3K pathway status (as per central assessment)
and presence of visceral metastasis. PI3K pathway activation was assessed in
archival tumor tissue provided at screening. It was defined as activated in the
presence of a PIK3CA mutation by Sanger sequencing (any mutations in exons 1,
7, 9, or 20) and/or loss of PTEN expression by IHC (1+ expression in <10% of
cells). PFS according to circulating tumor DNA (ctDNA) PIK3CA status (assessed
by BEAMing) was an exploratory endpoint, and could be determined in 587
patients. The trial met its primary endpoint of increasing PFS in the buparlisib-
treated group in the full population (6.9 vs. 5.0 months; HR 0.78, 95%CI 0.67-0.89;
P<0.001). However, in the PI3K-activated population, the difference in PFS
between arms did not reach statistical significance: 6.8 vs. 4.0 months; HR 0.76,
95%CI 0.60-0.97; P=0.014 (one-sided α=0.01 level of significance). Interestingly
enough, detection of a PIK3CA mutation in ctDNA just prior to the randomization
predicted for better outcome, with larger differences in PFS in the buparlisib-
treated patients than in the full population (7.0 vs. 3.2 months; HR 0.56, 95%CI
0.39-0.80; P<0.001). Toxicity led to dose reductions and discontinuation of
treatment in 46.4% and 13.2% of patients in the buparlisib and placebo arms,
respectively. Most common toxicities in the buparlisib arm were hyperglycemia
42
(43.1%, G3-4 15.4%), ALT elevation (40.1%, G3-4 25.5%), AST elevation (37.3%,
G3-4 18%), rash (32.1%, G3-4 7.9%), fatigue (31.9%, G3-4 4.9%), anxiety (22.3%,
G3-4 5.4%), and depression (26.2%, G3-4 4.4%). Authors concluded that the trial
met its primary endpoint of improving PFS when combining buparlisib and
fulvestrant in postmenopausal women with ER+/HER2-negative advanced breast
cancer that had progressed after prior AI therapy. However, frequent dose
reductions and discontinuations due to AEs reduced treatment duration in the
buparlisib arm, potentially limiting the efficacy of combination therapy. Additionally,
the PFS results of patients with a PIK3CA mutation detected in ctDNA suggest
that assessment of PIK3CA mutations in ctDNA may help select patients who
would most likely benefit from adding a PI3K inhibitor to endocrine therapy.
The BELLE-3 trial (NCT01633060) randomly assigned (2:1) 432 MBC patients
previously treated with an AI and who had progressed to endocrine therapy plus
everolimus to receive the combination of daily buparlisib plus fulvestrant or
placebo plus fulvestrant117. The rationale behind this trial was that a pan-PI3K
inhibitor, such as buparlisib, could revert resistance to an mTOR inhibitor, like
everolimus, as suggested by some pre-clinical data118. The trial met its primary
endpoint of increasing PFS in the buparlisib arm, with a median PFS of 3.9
months, versus 1.8 months in the placebo arm (HR 0.67, 95%CI 0.53-0.84;
P<0.001). The 6-month PFS rates were 30.6% and 20.1%, respectively. Among
patients with PIK3CA mutations detected in ctDNA (39% of the trial population),
PFS was 4.2 months in the buparlisib arm, versus 1.6 months in the placebo arm
(HR 0.46, 95%CI 0.29-0.73; P<0.001). Similarly to BELLE-2, patients receiving
buparlisib in BELLE-3 had a higher incidence of G3/4 AEs (62% vs. 34%), dose
reductions (31% vs. 18%) and dose discontinuations (21% vs. 8%) related to
treatment or patient/physician decision. Most common AEs in the buparlisib arm
were ALT elevation (39%, G3/4 22%), AST elevation (37%, G3/4 18%),
hyperglycemia (36%, G3/4 12%), nausea (36%, G3/4 1%), diarrhea (26%, G3/4
3%), fatigue (23%, G3/4 4%), depression (21%, G3/4 1%), and anxiety (18%, G3/4
1%). Despite the positive results, the PFS benefit is modest, and toxicity may be
an important limitation to introduce this treatment as a standard option to
ER+/HER2-negative MBC patients who progress after an AI and everolimus.
43
The BELLE-4 trial (NCT01572727) was a randomized, double-blind, Phase II/III
study of buparlisib plus paclitaxel in women treated in the first line setting for
HER2-negative locally advanced or MBC119. Three hundred thirty-eight patients
(73% with ER+ tumors) were randomized (1:1) to receive buparlisib (100 mg QD)
or placebo with weekly paclitaxel (80 mg/m2). The trial failed to meet its primary
endpoint of improved PFS in the buparlisib-treated group (HR 1.18, 95%CI 0.82-
1.68; median PFS in the buparlisib arm 8.0 months vs. 9.2 months in the placebo
arm) and was stopped due to futility. The most frequent AEs (≥35% of patients) in
the buparlisib arm were diarrhea (55% vs. 34% in the placebo arm), alopecia (49%
vs. 52%), nausea (45% vs. 27%), hyperglycemia (45% vs. 11%), rash (40% vs.
24%), fatigue (37% vs. 34%), and neutropenia (35% vs. 30%). The authors
concluded that no PFS benefit was conferred by the addition of buparlisib to
paclitaxel, and that the PI3K pathway may not drive paclitaxel resistance in
untreated HER2-negative MBC.
Buparlisib has also been tested in HER2+ tumors in combination with trastuzumab
and/or capecitabine111 and in triple negative MBC either as single agent
(NCT01629615) or in combination with olaparib120. However, mainly due to its
unfavorable side effects profile, Novartis decided to discontinue its development,
and all the trials testing buparlisib will be stopped during 2017.
1.7.3.1.2. Pictilisib (GDC-0941)
Pictilisib (GDC-0941, Genentech) is a pan-PI3K inhibitor that has been tested as a
single agent and in combination with anti-HER2, endocrine and chemotherapy in
breast cancer. In the Phase I dose-finding trial, 60 patients with solid tumors
received pictilisib at 14 dose levels from 15 to 450 mg QD, initially on days 1 to 21
every 28 days, and later using continuous dosing for selected dose levels113. The
most common toxicities were G1-2 nausea, rash, and fatigue. The DLT was G3
maculopapular rash at 450mg. A patient with V600E BRAF–mutant melanoma and
another with platinum-refractory epithelial ovarian cancer exhibiting PTEN loss and
44
PIK3CA amplification demonstrated partial response by RECIST and GCIG-
CA125 criteria, respectively. The RP2D was continuous dosing at 330 mg QD.
FERGI was a two-part, randomized, double-blind, placebo-controlled, Phase II
study, that enrolled postmenopausal women with ER+/HER2-negative breast
cancer resistant to treatment with an AI in the adjuvant or metastatic setting, to
receive pictilisib (340mg QD in part 1 and 260mg QD in part 2) plus fulvestrant vs.
placebo plus fulvestrant106. Part 1 included 168 patients and randomized them 1:1
according to the presence of PIK3CA mutation; part 2 included 61 patients with
known PIK3CA mutations, and randomized them 2:1 to receive pictilisib or
placebo. In part 1, there was no difference in median PFS between the pictilisib
and the placebo arms (HR 0.74, 95%CI 0.52-1.06; P=0.096). Median PFS for the
pictilisib and the placebo arms were 6.6 months (95%CI 3.9-9.8) and 5.1 months
(95%CI 3.6-7.3) respectively. No differences were observed according to the
presence of PIK3CA mutation. In part 2, there was also no difference in PFS
between groups (5.4 vs. 10.0 months; HR 1.07, 95%CI 0.53-2.18; P=0.84). Most
common G3-4 AEs were rash (9%), diarrhea (8%), fatigue (8%), ALT elevation
(5%), and hyperglycemia (7%).
Pictilisib was also tested in combination with chemotherapy, in the PEGGY trial
(NCT01740336)121. In this randomized Phase II, placebo-controlled study, 183
ER+/HER2-negative patients were assigned (1:1) to receive paclitaxel (90 mg/m2
weekly for 3 weeks in every 28-day cycle) with either 260mg pictilisib or placebo
(QD on days 1-5 every week). The primary endpoint was PFS in the intention-to-
treat (ITT) population and in patients with PIK3CA-mutant tumors. In the ITT
population, median PFS was 8.2 months with pictilisib (N=91) versus 7.8 months
with placebo (N=92); HR 0.95, 95%CI 0.62-1.46; P=0.83. In patients with PIK3CA-
mutant tumors, median PFS was 7.3 months for pictilisib (N=32) versus 5.8
months with placebo (N=30); HR 1.06, 95% CI 0.52-2.12; P=0.88. In the pictilisib
arm, there were more AEs leading to dose interruption (58.2% vs. 48.9% in the
placebo arm), dose reduction (49.5% vs. 22.8%), and dose discontinuation (25.3%
v. 15.2%). The authors suggested that this compromise in drug exposure might
explain the lack of efficacy of the combination respect to paclitaxel alone. Rash
45
was the main AE observed in the pictilisib arm (48.4%, vs. 33.7% in placebo arm).
Grade 3 rash was observed in 5.5% of the patients. Other common G3 or higher
AEs related to pictilisib were neutropenia (15.4%), hyperglycemia (5.5%), and
diarrhea (6.6%). The authors concluded that PEGGY did not meet its primary
endpoint, revealing no significant benefit from adding pictilisib to paclitaxel for
patients with ER+/HER2-negative locally recurrent or MBC.
Due to the observed toxicities and the modest efficacy results across trials,
Genentech has stopped the clinical development of pictilisib.
1.7.3.2. p110α-specific PI3K inhibitors
Isoform-specific PI3K inhibitors have been developed with the aim of selectively
targeting specific alterations in the PI3K pathway (PIK3CA mutations, PTEN
alterations), while avoiding the cumulative toxicity of inhibiting multiple isoforms of
PI3K. There are three groups of isoform-specific inhibitors in clinical development:
p110α, p110β, and p110δ inhibitors. p110α inhibitors target preferentially tumors
with PIK3CA mutations; p110β inhibitors target those with PTEN alterations; and
p110δ inhibitors are mainly used in hematological malignancies, since leukocytes
and lymphocytes are particularly enriched in this isoform of PI3K. p110β inhibitors,
such as AZD8186, are just beginning to be explored in triple negative breast
cancer (TNBC) with or without PTEN deficiencies, and no clinical data are
available as of yet (NCT01884285).
Selective p110α-specific inhibitors were designed to target tumors harboring
PIK3CA mutations122. Examples of p110α-specific inhibitors that are being
developed in breast cancer are alpelisib (BYL719, Novartis), taselisib (GDC-0032,
Genentech), and MLN1117 (Millennium / Takeda). To be more accurate, taselisib
is actually a PI3K β-sparing inhibitor (meaning that it inhibits the β isoform 30x less
than the α isoform) that also displays differential activity in tumors with PIK3CA
mutations. It will be therefore discussed in this section. Genentech is developing a
new p110α selective inhibitor in breast cancer, GDC-0077, but the Phase I trial
has just started, and no clinical data are presently available (NCT03006172).
46
We will now focus in the discussion of two promising compounds in breast cancer,
alpelisib and taselisib.
1.7.3.2.1. Alpelisib (BYL719)
Alpelisib (BYL719) was tested in a Phase I trial that enrolled 132 patients with
PIK3CA-altered advanced solid tumors, or PIK3CA-altered or wild type (WT) ER+
MBC, to receive different doses and schedules of treatment123. DLTs were
reported in: 4 patients at 450mg QD (hyperglycemia N=2, nausea N=2), 4 patients
at 200mg BID (hyperglycemia N=4), and one patient at 150mg BID (hyperglycemia
and hypophosphatemia). BYL719 QD and BID MTDs were declared at 400mg
(used for dose expansion) and 150mg, respectively. Most common AEs at 400mg
were hyperglycemia (51%), nausea (48%), diarrhea (41%), decreased appetite
(38%), fatigue (32%), vomiting (30%), and rash (20%). Most common AEs at
150mg BID were hyperglycemia and nausea (both 53%), diarrhea, decreased
appetite, fatigue, and stomatitis (33% each). Overall response rate for alpelisib as
a single agent was 11%.
A Phase Ib trial combined alpelisib with letrozole in 26 patients with ER+/HER2-
negative MBC124. In this study, MTD of alpelisib in combination with letrozole was
300 mg QD. Common drug-related AEs at the MTD included hyperglycemia (55%,
G3 10%), nausea (60%, all G1-2), fatigue (45%, all G1-2), diarrhea (80%, G3
10%), and rash (45%, all G1-2). The CBR, defined as lack of progression ≥6
months, was 35% (44% in patients with PIK3CA mutant and 20% in PIK3CA WT
tumors), including five objective responses. The authors concluded that the
combination of letrozole and alpelisib was safe, with reversible toxicities, and
active. Clinical activity was observed independently of PIK3CA mutation status,
although clinical benefit was higher in patients with PIK3CA-mutant tumors.
Phase II and III trials of alpelisib and endocrine therapy or chemotherapy in
patients with ER+ breast cancer, either in the metastatic (NCT02437318,
47
NCT02379247, NCT01872260) or neoadjuvant settings (NCT01923168) are
ongoing.
1.7.3.2.2. Taselisib (GDC-0032)
Taselisib (GDC-0032, Genentech) is an orally bioavailable, potent, and selective
inhibitor of Class I PI3Kα, δ, and γ isoforms, with 30-fold less inhibition of the PI3K
β isoform relative to the PI3Kα isoform125. As a single agent, taselisib RP2D was
established at 9mg QD in capsule formulation, equivalent to 6mg QD in its tablet
formulation126. Most common Grade ≥3 AEs that occurred at a frequency greater
than 5% included hyperglycemia (15%), rash (12%), diarrhea (6%), fatigue (6%),
and pruritus (6%). Responses were observed in PIK3CA mutant breast cancer
patients.
Within the Phase I trial (NCT01296555), several expansion cohorts combining
taselisib with endocrine treatment have been enrolled and/or are completed.
Twenty-eight patients were enrolled in the dose escalation part of taselisib plus
letrozole127. Most common G3-4 AEs were diarrhea (14%), hyperglycemia (7%),
and mucosal inflammation (7%). Other relevant AEs included nausea, fatigue,
rash, and muscle spasms. Overall response rate was 38% in patients with PIK3CA
mutant breast cancer and 9% in patients with PIK3CA WT breast cancer.
Results from a Phase II trial combining taselisib with fulvestrant were presented at
the ASCO 2016 Annual Meeting128. In this trial, 60 post-menopausal ER+/HER2-
negative locally advanced or MBC patients who had progression or no response to
≥ 1 prior endocrine therapy in adjuvant or MBC settings were enrolled. Seventeen
of them had PIK3CA mutations detected in archival tumor tissue, 27 had WT
PIK3CA and 16 had unknown PIK3CA mutation status. Among patients with
baseline measurable disease, confirmed response rates were higher in patients
with a PIK3CA mutation (41.7% vs. 14.3% in WT). Common G≥3 AEs were colitis
(13.3%), diarrhea (11.7%), hyperglycemia (6.7%), and pneumonia (5%). These
results have prompted a registration randomized Phase III study of taselisib or

48
placebo plus fulvestrant in PIK3CA mutant and WT ER+/HER2-negative MBC
patients (SANDPIPER, NCT02340221), which is currently enrolling.
Taselisib is also being tested in the following trials: a Phase Ib/randomized Phase
II trial in combination with tamoxifen (POSEIDON, NCT02285179), a Phase I trial
in combination with palbociclib (NCT02389842), a Phase I trial in combination with
anti-HER2 therapies (NCT02390427), and in a neoadjuvant trial in combination
with letrozole (LORELEI, NCT02273973).
1.7.4. AKT inhibitors
The PAM pathway can also be inhibited at the AKT level. There are 2 main
classes of AKT inhibitors: allosteric (such as MK-2206) and ATP-competitive (such
as GDC-0068 and AZD5363). Allosteric inhibitors lock AKT in a closed
conformation, with its phospholipid binding site blocked by the kinase domain129. In
contrast, cells treated with ATP-competitive inhibitors display increased binding of
AKT to PIP2 and PIP3 and increased localization of AKT at the plasma
membrane, resulting in its hyperphosphorylation at both T308 (PDK1 site) and
S473 (mTORC2 site)130. For this reason, phospho-AKT levels are increased upon
treatment with ATP-competitive AKT inhibitors.
Importantly, some data suggest that the presence of AKT1 mutations (such as
E17K), frequent in cancer, associate with reduced sensitivity to allosteric inhibitors
compared with ATP-competitive inhibitors131.
1.7.4.1. MK-2206
MK-2206 (Merck) is an allosteric AKT-inhibitor that has been tested in breast
cancer in combination with endocrine therapy132, chemotherapy133,134, and anti-
HER2 therapy135,136.
In a Phase Ib trial that enrolled 31 ER+/HER2-negative breast cancer patients to
receive MK-2206 with anastrozole or fulvestrant, main toxicity was rash (33.3%,
49
G3 in 23.3%)132. Rash was dose limiting and required the amendment of the
protocol after the first three patients were treated to include prophylaxis with
prednisone. The RP2D was then defined as MK-2206 150 mg orally weekly with
prednisone prophylaxis for each endocrine combination. In addition to rash, the
most common AEs were hyperglycemia (20%), hypophosphatemia (16.7%), and
fatigue (10%). The CBR was 36.7% (95%CI 20%-56%), including 2 patients with
partial response and 9 patients with SD for more than 6 months. In this study,
PIK3CA mutation did not associate with response to MK-2206. The combination of
MK-2206 and anastrozole is being further evaluated in a Phase II neoadjuvant trial
for newly diagnosed ER+/HER2-negative breast cancer (NCT01776008).
MK-2206 was also evaluated as part of the I-SPY 2 trial, a multicenter, adaptive
Phase II trial of neoadjuvant therapy for high-risk clinical stage II or III breast
cancer137. The results of this part of I-SPY2 were presented at the ASCO 2015
Annual Meeting138. Ninety-three patients received MK-2206 135 mg orally QD with
weekly paclitaxel (and trastuzumab if HER2+), followed by AC. In the I-SPY2 trial,
a given drug graduates to further study if the probability of success (calculated by
a Bayesian predictive probability model) in a 2-arm, N=300, Phase III randomized
1:1 trial with pathological complete response as an endpoint, is ≥85%. MK-2206
graduated in the signatures of ER-negative/HER2+, ER-negative, and HER2+.
Most common AEs included mucositis (55%), rash (88%, G3/4 24%), and
neutropenia (G3/4 21%).
1.7.4.2. Ipatasertib (GDC-0068)
Ipatasertib (GDC-0068, Genentech) is a highly selective, orally bioavailable AKT
kinase inhibitor that shows pharmacodynamic inhibition of AKT signaling and
antitumor activity in human cancer cells in vitro and in vivo139 and in tumor
biopsies from patients140. The combination of ipatasertib with chemotherapy
(including paclitaxel) shows increased efficacy when compared to ipatasertib alone
in breast cancer cell lines and xenografts141.
50
In the Phase I study as single agent (NCT01090960), 52 patients were enrolled in
three stages: 30 patients in dose-escalation (Stage 1), and 22 patients in the two
dose-expansion cohorts of tumor-specific indications (Stage 2: MBC n=11,
metastatic castration-resistant prostate cancer n=5) or all solid tumors (Stage 3,
n=6)142. Overall, 16 patients with MBC were enrolled. Two patients at the 800 mg
dose experienced two DLTs (G3 asthenia, and G3 nausea). The MTD for
ipatasertib (and the dose that was used for expansion) was 600 mg orally QD on a
21/7 dosing schedule. The majority of AEs were Grade 1-2 in severity and could
be managed with supportive care and/or dose holds so that patients could
continue with ipatasertib. The most frequently reported Grade ≥2 AEs related to
ipatasertib were diarrhea (35%), nausea (27%), asthenia (25%), hyperglycemia
(10%), decreased appetite (6%), rash (6%), and vomiting (6%). Of note, a heavily
pre-treated 68 year-old female patient with AKT1 mutant (E17K), ER+/HER2-
negative MBC had a complete metabolic PET response in Cycle 1 of treatment.
Her CA15-3 tumor marker declined by more than 50%, and she remained on the
study for 235 days.
Activation of AKT signaling has been associated with chemotherapy resistance in
preclinical models143. For this reason, it was hypothesized that ipatasertib could
overcome resistance to chemotherapy. In a pre-clinical study the combination of
docetaxel and ipatasertib resulted in significantly increased inhibition of cell
viability and tumor regression in xenograft models in both PIK3CA WT and
H1047R mutants compared with each single agent alone141. Synergistic effects
were also observed in the OVCAR3 ovarian cancer xenograft model when
ipatasertib was combined with carboplatin.
These results prompted the launching of a Phase I study (NCT01362374) testing
ipatasertib in combination with docetaxel (Arm A), FOLFOX6 (Arm B), paclitaxel
(Arm C), and enzalutamide (Arm D). Nineteen patients with MBC were included in
the taxane combination arms: 5 patients received docetaxel 75 mg/m2 on Day 1
with escalating doses of ipatasertib QD on Days 2-15 every 21 days; and 14
patients received paclitaxel 90 mg/m2 on Days 1, 8, and 15 with escalating doses
of ipatasertib QD on Days 1-21, every 28 days. This study included an expansion
51
cohort of paclitaxel plus ipatasertib in HER2-negative MBC patients. Common G≥2
AEs related to ipatasertib in combination with docetaxel were diarrhea (80%),
nausea (60%), and vomiting (40%). In the paclitaxel arm, common AEs were
diarrhea (43%), fatigue (29%), and hyperglycemia (14%). Partial responses by
RECIST v.1.1 were seen in 5 patients: 3 patients with ER+/HER2-negative tumors,
and 3 patients with TNBC. Interestingly, among these 5 patients with PR, four had
previously progressed to paclitaxel and two to PI3K inhibitors. Furthermore, four
patients had an alteration in the PAM pathway (retrospectively determined in
archival tissue): one patient had PTEN loss, two had a PIK3CA mutation, and one
had an AKT1 mutation144.
Currently, there are two “twin” ongoing studies testing ipatasertib with paclitaxel in
triple negative breast cancer, either in the metastatic (LOTUS, NCT02162719) or
in the neoadjuvant setting (FAIRLANE, NCT02301988).
1.7.4.1. AZD5363
AZD5363 (AstraZeneca) is a potent, catalytic inhibitor of all three AKT isoforms
(AKT1, AKT2 and AKT3). Preclinical data demonstrate inhibition of
phosphorylation of AKT substrates (PRAS40 and GSK3β), tumor cell proliferation,
and tumor growth in xenograft models145.
In the Phase I study in Japanese patients with advanced solid tumors
(NCT01353781), AZD5363 was administered orally QD, and the dose was then
escalated to BID in separate continuous (every day) and intermittent (4 days on, 3
days off [4/3] or 2 days on, 5 days off [2/5]) dosing schedules146. Forty-one
patients were treated, and DLTs were only experienced with continuous dosing.
Most common AEs included diarrhea (78%), hyperglycemia (68.3%), nausea
(56.1%), and maculopapular rash (56.1%). Confirmed partial responses were
observed in two patients: an ovarian cancer patient in the 480mg BID 4/3
schedule, who experienced a 55% reduction in target lesions and was on study for
more than 2 years, and a ER+/HER2-negative heavily pre-treated MBC patient
who experienced a 61% reduction in target lesions for 12 months. Interestingly, in
52
both patients an AKT1 E17K mutation was retrospectively identified in archival
tumor tissue.
A parallel Phase I dose finding study in non-Japanese patients also escalated
AZD5363 in both continuous and intermittent schedules (NCT01226316)147. In this
study, 90 heavily pre-treated metastatic patients were enrolled to receive
AZD5363 in escalating doses and different continuous and intermittent (4/3 and
2/5) schedules. The RP2D was AZD5363 480mg BID 4/3. At this dose, no DLTs
were observed, and pharmacodynamics data were consistent with robust blockade
of the PI3K pathway. Most common G3 or above toxicities in all patients and at the
RP2D were, respectively: hyperglycemia (20% and 36.4%), diarrhea (10% and
9.1%), rash (10%, none at RP2D), and nausea (3.3% and 9.1%). In the escalation
part of the trial, a cervical cancer patient with a PIK3CA mutation experienced a
confirmed PR. Two expansion cohorts for breast and gynecological cancers with
PIK3CA mutations were subsequently opened. Among 20 MBC patients with
PIK3CA mutations, ORR was 10% (one ER+/HER2-negative and one ER+/HER2+
patient). Among 17 patients with gynecological cancers and a PIK3CA mutation, a
PR was observed in an endometrial cancer patient with a PIK3CA mutation in the
p85 adaptor binding domain.
Given the encouraging results in AKT1 mutant tumors, a new expansion “basket”
cohort started to enroll patients with breast cancer, gynecological cancer, or all
solid tumors harboring an AKT1 mutation to receive AZD5363 at a 480 mg BID on
a 4/3 schedule (NCT01226316). In this part of the trial, serial plasma samples
were collected for detection and tracking of AKT1 E17K mutation (expressed as
the mutant allele fraction [MAF]) in ctDNA by droplet digital PCR (ddPCR).
Preliminary results were presented at the 2015 AACR-NCI-EORTC International
Conference on Molecular Targets and Cancer Therapeutics148. Besides AKT1
mutation, key inclusion criteria included absence of known RAS/RAF mutations,
and presence of measurable disease as per RECIST v.1.1. AKT1 E17K mutation
status was identified through local screening and confirmed retrospectively by
central assay. Forty-five patients were enrolled: ER+/HER2-negative MBC 20
(44.4%), TNBC 4 (8.9%), gynecological 13 (28.9%), and other tumor types 8
53
(17.8%). Among the 18 ER+/HER2-negative MBC patients with available RECIST
v.1.1 data, 14 demonstrated target lesion shrinkage, including 3 with confirmed PR
(ORR 16.7%) and 2 with unconfirmed PR. All patients with TNBC had tumor
shrinkage, and one of them had a confirmed PR. In this study, ctDNA enabled
prediction of clinical and radiological response and eventual progression. Another
study was recently reported using serial NGS of ctDNA from patients with AKT1
mutations enrolled in the Phase I basket AZD5363 study149. In this exploratory
study, serial NGS of ctDNA with a large gene panel demonstrated to be feasible
and highly concordant with ddPCR approaches, capturing disease heterogeneity
and permitting the monitoring of tumor clone dynamics. NCT01226316 continues
to accrue patients with ER+/HER2-negative AKT1-mutant tumors to receive
AZD5363 in combination with fulvestrant.
AZD5363 has also been combined with chemotherapy in the Beech Study: a
Phase I/II study of AZD5363 combined with paclitaxel in patients with advanced or
metastatic breast cancer150. In the part A of this trial, 36 MBC cancer patients were
enrolled to receive AZD5363 BID in escalating doses intermittent 4/3 and 2/5
schedules. MTD for both schedules were 400mg BID and 560mg BID,
respectively, combined with weekly paclitaxel 90mg/m2 3 out of 4 weeks. The
recommended dose for part B was 400mg BID combined with weekly paclitaxel
90mg/m2 3 out of 4 weeks. Consistently with the Phase I single agent results, the
most common AEs probably related to AZD5363 were diarrhea (63.9%, G≥3
16.7%), rash (52.8%, G≥3 11.1%), hyperglycemia (19.4%, no G≥3), and nausea
(19.4%, no G≥3). Overall median PFS (as per RECIST v.1.1 criteria) was 8.2
months, despite 69% of patients had received previous taxane and 53% had been
exposed to at least 1 prior line of chemotherapy in the metastatic setting. Part B of
this trial subsequently randomized ER+/HER2-negative MBC patients that
received no prior chemotherapy for advanced disease (including a cohort of
prospectively identified PIK3CA mutant breast cancer patients) to receive weekly
paclitaxel 90mg/m2 3 out of 4 weeks plus AZD5363 400mg BID 4/3 or placebo.
The same combination is being tested in TNBC in the PAKT trial (NCT02423603).
54
1.8. Biomarkers of response to PAM pathway inhibitors in MBC
The success of precision medicine depends on the development of accurate and
reliable predictive biomarkers. A genomic biomarker is defined by the FDA as “a
measurable DNA and/or RNA characteristic that is an indicator of normal biologic
processes, pathogenic processes, and/or response to therapeutic or other
interventions”151. A prognostic biomarker informs about a likely cancer outcome
(e.g., disease recurrence, disease progression, death) independently of treatment
received. A predictive biomarker, in turn, can discriminate response to a given
therapy (experimental compared with control) in biomarker-positive patients
compared with biomarker-negative patients152.
In the early-phase trials of PAM pathway inhibitors, some predictive biomarker
hypotheses have been tested, such as the presence of PIK3CA mutations, PTEN
dysregulation, or AKT1 mutations. In the following sections, we will provide an
overview of available results.
1.8.1. Biomarkers of response to everolimus
1.8.1.1. BOLERO-2
The first systematic effort to find predictive biomarkers of efficacy to a PAM
pathway inhibitor in a prospective randomized clinical trial came from the
BOLERO-2 study153. In this exploratory study, exons of cancer-related genes were
sequenced using NGS technology in archival tumor specimens from a subset of
patients, and potential associations between PFS benefit from everolimus and
genetic alterations in PAM and FGFR pathway genes were explored. The authors
also developed an estimation metric for chromosomal instability using NGS data
from a target gene panel and explored its correlation with everolimus PFS benefit.
Tumor samples from 302 patients had NGS data available (41.7% of the whole
trial population). The NGS subgroup was representative of the BOLERO-2 trial
population in terms of patients’ characteristics and randomization arm. The most
frequently altered genes were PIK3CA (47.6%), CCND1 (31.3%), TP53 (23.3%),
and FGFR1 (18.1%).
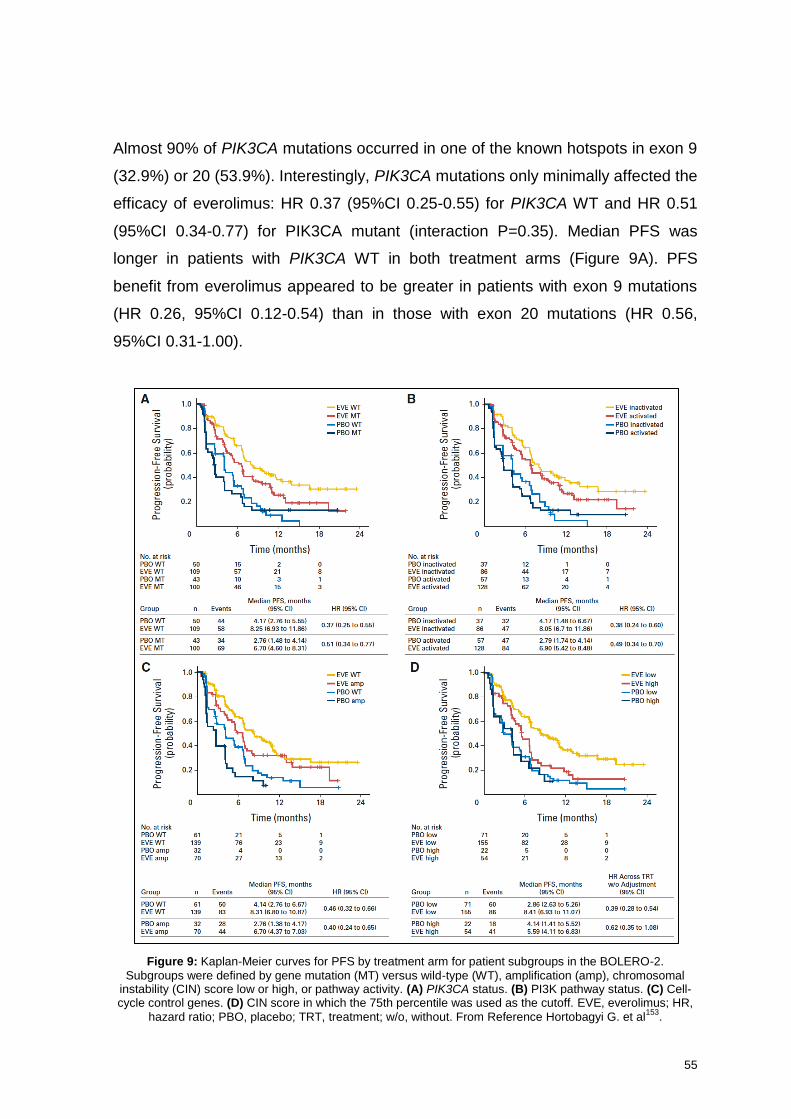
55
Almost 90% of PIK3CA mutations occurred in one of the known hotspots in exon 9
(32.9%) or 20 (53.9%). Interestingly, PIK3CA mutations only minimally affected the
efficacy of everolimus: HR 0.37 (95%CI 0.25-0.55) for PIK3CA WT and HR 0.51
(95%CI 0.34-0.77) for PIK3CA mutant (interaction P=0.35). Median PFS was
longer in patients with PIK3CA WT in both treatment arms (Figure 9A). PFS
benefit from everolimus appeared to be greater in patients with exon 9 mutations
(HR 0.26, 95%CI 0.12-0.54) than in those with exon 20 mutations (HR 0.56,
95%CI 0.31-1.00).
Figure 9: Kaplan-Meier curves for PFS by treatment arm for patient subgroups in the BOLERO-2.
Subgroups were defined by gene mutation (MT) versus wild-type (WT), amplification (amp), chromosomal instability (CIN) score low or high, or pathway activity. (A) PIK3CA status. (B) PI3K pathway status. (C) Cell-cycle control genes. (D) CIN score in which the 75th percentile was used as the cutoff. EVE, everolimus; HR,
hazard ratio; PBO, placebo; TRT, treatment; w/o, without. From Reference Hortobagyi G. et al153
.
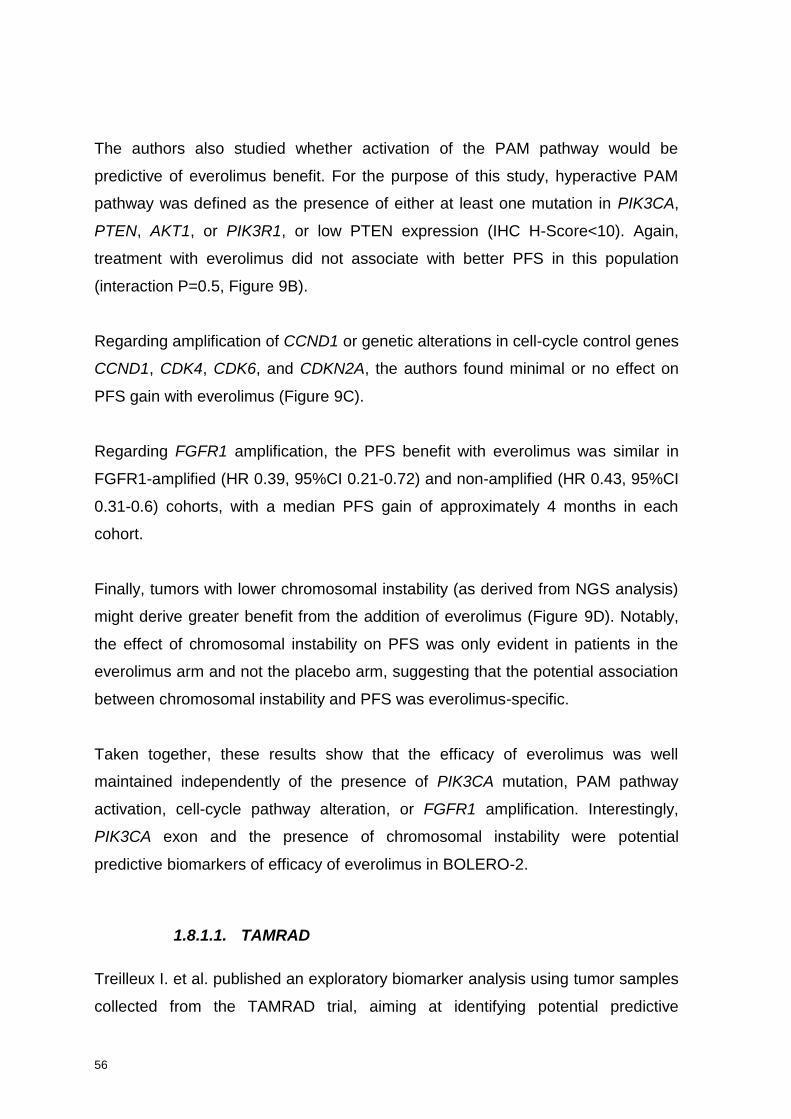
56
The authors also studied whether activation of the PAM pathway would be
predictive of everolimus benefit. For the purpose of this study, hyperactive PAM
pathway was defined as the presence of either at least one mutation in PIK3CA,
PTEN, AKT1, or PIK3R1, or low PTEN expression (IHC H-Score<10). Again,
treatment with everolimus did not associate with better PFS in this population
(interaction P=0.5, Figure 9B).
Regarding amplification of CCND1 or genetic alterations in cell-cycle control genes
CCND1, CDK4, CDK6, and CDKN2A, the authors found minimal or no effect on
PFS gain with everolimus (Figure 9C).
Regarding FGFR1 amplification, the PFS benefit with everolimus was similar in
FGFR1-amplified (HR 0.39, 95%CI 0.21-0.72) and non-amplified (HR 0.43, 95%CI
0.31-0.6) cohorts, with a median PFS gain of approximately 4 months in each
cohort.
Finally, tumors with lower chromosomal instability (as derived from NGS analysis)
might derive greater benefit from the addition of everolimus (Figure 9D). Notably,
the effect of chromosomal instability on PFS was only evident in patients in the
everolimus arm and not the placebo arm, suggesting that the potential association
between chromosomal instability and PFS was everolimus-specific.
Taken together, these results show that the efficacy of everolimus was well
maintained independently of the presence of PIK3CA mutation, PAM pathway
activation, cell-cycle pathway alteration, or FGFR1 amplification. Interestingly,
PIK3CA exon and the presence of chromosomal instability were potential
predictive biomarkers of efficacy of everolimus in BOLERO-2.
1.8.1.1. TAMRAD
Treilleux I. et al. published an exploratory biomarker analysis using tumor samples
collected from the TAMRAD trial, aiming at identifying potential predictive
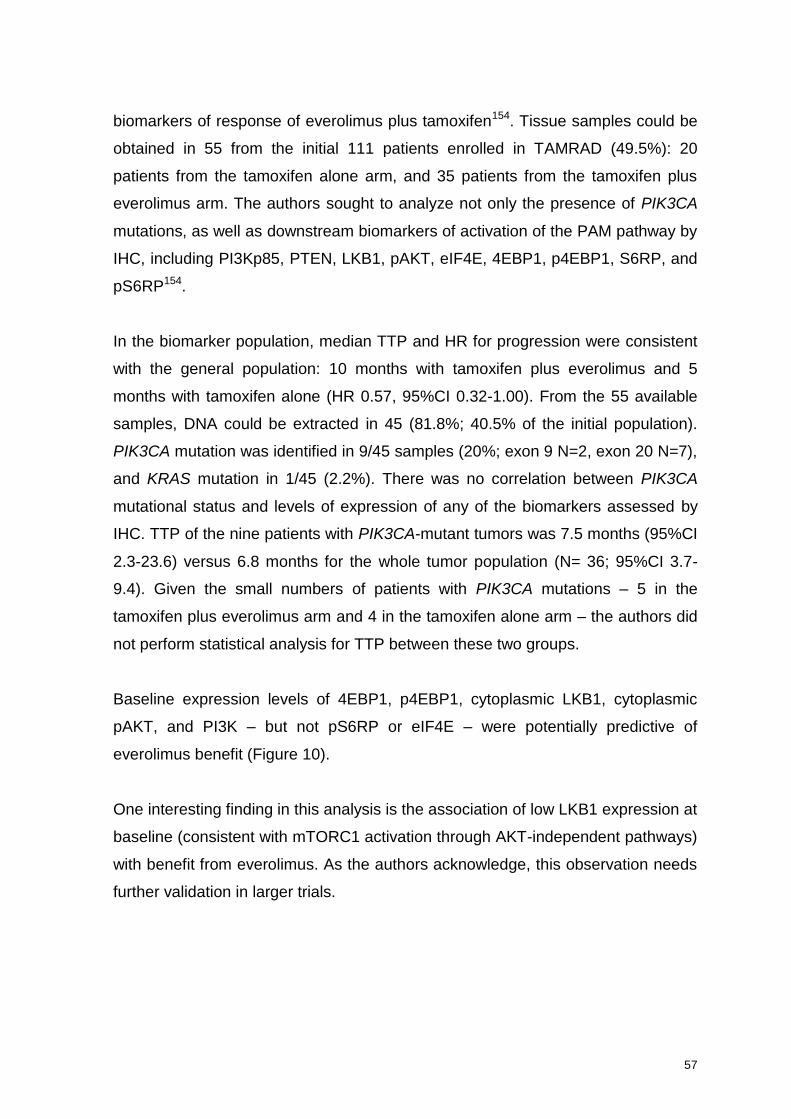
57
biomarkers of response of everolimus plus tamoxifen154. Tissue samples could be
obtained in 55 from the initial 111 patients enrolled in TAMRAD (49.5%): 20
patients from the tamoxifen alone arm, and 35 patients from the tamoxifen plus
everolimus arm. The authors sought to analyze not only the presence of PIK3CA
mutations, as well as downstream biomarkers of activation of the PAM pathway by
IHC, including PI3Kp85, PTEN, LKB1, pAKT, eIF4E, 4EBP1, p4EBP1, S6RP, and
pS6RP154.
In the biomarker population, median TTP and HR for progression were consistent
with the general population: 10 months with tamoxifen plus everolimus and 5
months with tamoxifen alone (HR 0.57, 95%CI 0.32-1.00). From the 55 available
samples, DNA could be extracted in 45 (81.8%; 40.5% of the initial population).
PIK3CA mutation was identified in 9/45 samples (20%; exon 9 N=2, exon 20 N=7),
and KRAS mutation in 1/45 (2.2%). There was no correlation between PIK3CA
mutational status and levels of expression of any of the biomarkers assessed by
IHC. TTP of the nine patients with PIK3CA-mutant tumors was 7.5 months (95%CI
2.3-23.6) versus 6.8 months for the whole tumor population (N= 36; 95%CI 3.7-
9.4). Given the small numbers of patients with PIK3CA mutations – 5 in the
tamoxifen plus everolimus arm and 4 in the tamoxifen alone arm – the authors did
not perform statistical analysis for TTP between these two groups.
Baseline expression levels of 4EBP1, p4EBP1, cytoplasmic LKB1, cytoplasmic
pAKT, and PI3K – but not pS6RP or eIF4E – were potentially predictive of
everolimus benefit (Figure 10).
One interesting finding in this analysis is the association of low LKB1 expression at
baseline (consistent with mTORC1 activation through AKT-independent pathways)
with benefit from everolimus. As the authors acknowledge, this observation needs
further validation in larger trials.
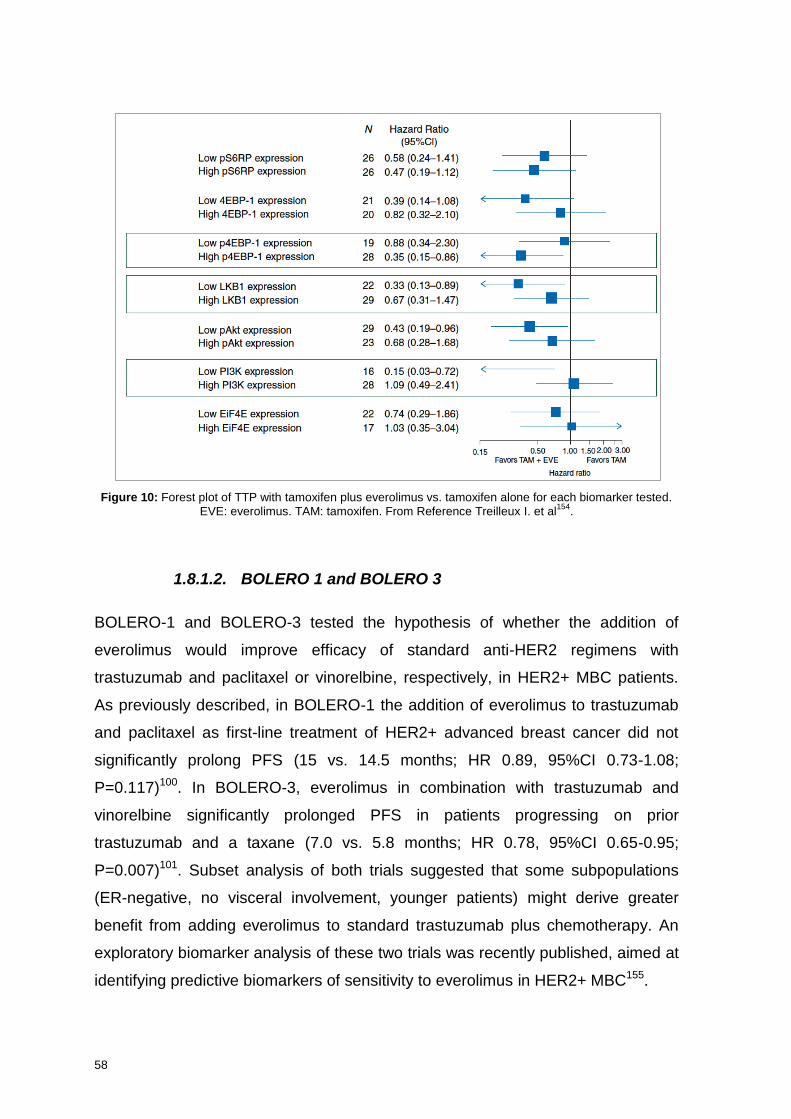
58
Figure 10: Forest plot of TTP with tamoxifen plus everolimus vs. tamoxifen alone for each biomarker tested.
EVE: everolimus. TAM: tamoxifen. From Reference Treilleux I. et al154
.
1.8.1.2. BOLERO 1 and BOLERO 3
BOLERO-1 and BOLERO-3 tested the hypothesis of whether the addition of
everolimus would improve efficacy of standard anti-HER2 regimens with
trastuzumab and paclitaxel or vinorelbine, respectively, in HER2+ MBC patients.
As previously described, in BOLERO-1 the addition of everolimus to trastuzumab
and paclitaxel as first-line treatment of HER2+ advanced breast cancer did not
significantly prolong PFS (15 vs. 14.5 months; HR 0.89, 95%CI 0.73-1.08;
P=0.117)100. In BOLERO-3, everolimus in combination with trastuzumab and
vinorelbine significantly prolonged PFS in patients progressing on prior
trastuzumab and a taxane (7.0 vs. 5.8 months; HR 0.78, 95%CI 0.65-0.95;
P=0.007)101. Subset analysis of both trials suggested that some subpopulations
(ER-negative, no visceral involvement, younger patients) might derive greater
benefit from adding everolimus to standard trastuzumab plus chemotherapy. An
exploratory biomarker analysis of these two trials was recently published, aimed at
identifying predictive biomarkers of sensitivity to everolimus in HER2+ MBC155.
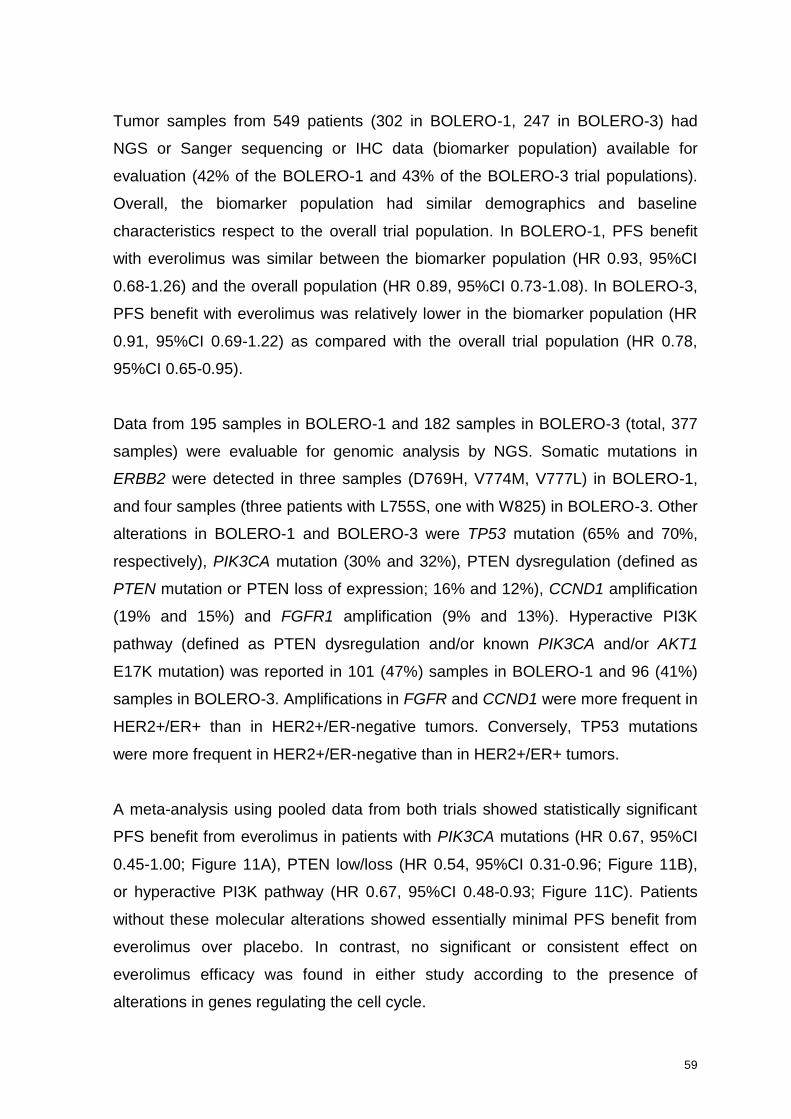
59
Tumor samples from 549 patients (302 in BOLERO-1, 247 in BOLERO-3) had
NGS or Sanger sequencing or IHC data (biomarker population) available for
evaluation (42% of the BOLERO-1 and 43% of the BOLERO-3 trial populations).
Overall, the biomarker population had similar demographics and baseline
characteristics respect to the overall trial population. In BOLERO-1, PFS benefit
with everolimus was similar between the biomarker population (HR 0.93, 95%CI
0.68-1.26) and the overall population (HR 0.89, 95%CI 0.73-1.08). In BOLERO-3,
PFS benefit with everolimus was relatively lower in the biomarker population (HR
0.91, 95%CI 0.69-1.22) as compared with the overall trial population (HR 0.78,
95%CI 0.65-0.95).
Data from 195 samples in BOLERO-1 and 182 samples in BOLERO-3 (total, 377
samples) were evaluable for genomic analysis by NGS. Somatic mutations in
ERBB2 were detected in three samples (D769H, V774M, V777L) in BOLERO-1,
and four samples (three patients with L755S, one with W825) in BOLERO-3. Other
alterations in BOLERO-1 and BOLERO-3 were TP53 mutation (65% and 70%,
respectively), PIK3CA mutation (30% and 32%), PTEN dysregulation (defined as
PTEN mutation or PTEN loss of expression; 16% and 12%), CCND1 amplification
(19% and 15%) and FGFR1 amplification (9% and 13%). Hyperactive PI3K
pathway (defined as PTEN dysregulation and/or known PIK3CA and/or AKT1
E17K mutation) was reported in 101 (47%) samples in BOLERO-1 and 96 (41%)
samples in BOLERO-3. Amplifications in FGFR and CCND1 were more frequent in
HER2+/ER+ than in HER2+/ER-negative tumors. Conversely, TP53 mutations
were more frequent in HER2+/ER-negative than in HER2+/ER+ tumors.
A meta-analysis using pooled data from both trials showed statistically significant
PFS benefit from everolimus in patients with PIK3CA mutations (HR 0.67, 95%CI
0.45-1.00; Figure 11A), PTEN low/loss (HR 0.54, 95%CI 0.31-0.96; Figure 11B),
or hyperactive PI3K pathway (HR 0.67, 95%CI 0.48-0.93; Figure 11C). Patients
without these molecular alterations showed essentially minimal PFS benefit from
everolimus over placebo. In contrast, no significant or consistent effect on
everolimus efficacy was found in either study according to the presence of
alterations in genes regulating the cell cycle.
60
Figure 11: Kaplan-Meier curves for PFS by biomarker status in BOLERO-1 and BOLERO-3 (pooled data). (A) PIK3CA wild type (WT) versus mutant (MT). (B) PTEN normal versus low/loss. (C) PI3K pathway activity
normal versus hyperactive. EVE, everolimus; PBO, placebo. From Reference Andre F. et al155
.
1.8.2. Biomarkers of response to PI3K inhibitors
1.8.2.1. Biomarkers of response to buparlisib
The presence of PIK3CA mutation and/or PTEN dysregulation has been
postulated to be predictive of response to PAM pathway inhibitors, especially PI3K
inhibitors. For this reason, one of the co-primary objectives of the previously
described Belle-2 trial was to assess whether the combination of fulvestrant plus
buparlisib was superior than fulvestrant plus placebo in the subset of patients
which tumors had a PI3K pathway activation (defined as the presence of a
PIK3CA mutation and/or PTEN loss, as assessed by a Central laboratory in
archival tissue). This issue was also studied in the Belle-3 trial.
In the Belle-2 trial, among the 372 patients with PI3K pathway activation assessed
in archival tumor tissue, the addition of buparlisib to fulvestrant did not significantly
increased PFS with respect to fulvestrant alone116. Median PFS in the buparlisib
arm was 6.8 months, compared with 4.0 months in the placebo arm (HR 0.76,
95%CI 0.60-0.97; P=0.014, for one-sided α=0.01 level of significance).
Interestingly enough, detection of a PIK3CA mutation in ctDNA just prior to the
randomization did predict for better outcome, with larger differences in PFS in the
buparlisib-treated patients than in the full population (7.0 vs. 3.2 months; HR 0.56,
95%CI 0.39-0.80; P<0.001).
61
In the Belle-3 trial, among the 109 patients with PIK3CA mutation detected in
archival tumor tissue, the addition of buparlisib to fulvestrant significantly
increased PFS with respect to fulvestrant alone (median PFS 4.7 vs. 1.4 months;
HR 0.39, 95%CI 0.23-0.65; P<0.001)117. Conversely, among the 212 patients with
no PIK3CA mutation detected in archival tumor, no difference was observed
between treatment arms (2.8 vs. 2.7 months; HR 0.83, 95%CI 0.6-1.14, P=0.117).
Similarly to Belle-2, detection of a PIK3CA mutation in ctDNA just prior to the
randomization (N=136) also predicted for better outcome with buparlisib vs.
placebo (median PFS 4.2 vs. 1.6 months; HR 0.46, 95%CI 0.29-0.73; P<0.001).
Taken together, these results suggest that the presence of a PIK3CA mutation,
especially if detected in ctDNA just prior to the beginning of treatment, may be
predictive of response to buparlisib plus fulvestrant in ER+/HER2-negative MBC
patients whose disease progressed after AI or AI plus everolimus.
1.8.2.2. Biomarkers of response to pictilisib
The FERGI and PEGGY trials also tested the hypothesis of PIK3CA mutation as a
predictive biomarker of response to pictilisib, as described above106,121. In these
trials, patients with PIK3CA mutation detected in archival tissue did not benefit
more from pictilisib plus fulvestrant or paclitaxel than those without PIK3CA
mutation.
Pre-operative or window-of-opportunity trials are a validated strategy for evaluating
the impact of targeted therapies and assess biomarkers of response to those
therapies156. The OPPORTUNE trial randomized (2:1) 75 ER+/HER2-negative
EBC patients to receive pictilisib plus anastrozole or anastrozole alone during 14
days before surgery114. The study had two primary endpoints: to detect an
increase in Ki67 suppression with pictilisib, and to assess the treatment effects in
subgroups defined by PIK3CA mutations, luminal A/B subtypes, and baseline Ki67
scores. When compared to anastrozole alone, the combination of pictilisib with
anastrozole led to a higher mean percentage suppression of Ki67 (83.8% vs.
66.0%, P=0.004), a higher percentage of tumors with >50% fall in Ki67 expression
62
between baseline and day 15 (86.4% vs. 53.9%, P=0.003), and a higher end-of-
treatment Ki67 expression suppression (2.9% vs. 6.1%, P=0.005). When looking
at the association between Ki67 and PIK3CA mutations, the authors found that
baseline Ki67 expression was comparable between WT and mutant samples (WT
23.3% vs. helical domain mutation 20.7% vs. kinase domain mutation 25.5%).
Further, no association was found between PIK3CA mutation and antiproliferative
response to anastrozole or anastrozole plus pictilisib. However, tumors with helical
or kinase domain mutations appeared to respond differently to anastrozole plus
pictilisib (Ki67 suppression ratio: helical 0.32 [95%CI, ≤0.73] vs. kinase 0.76
[95%CI, ≤1.63]). Subgroup analysis showed that patients with PAM50 luminal B
tumors had a significantly higher antiproliferative response with anastrozole plus
pictilisib compared to anastrozole alone (mean Ki67 suppression 86.5% vs.
63.6%, P=0.008), whereas adding pictilisib had no apparent benefit for luminal A
tumors. Multivariable analysis confirmed significant interaction between treatment
effect and molecular subtype (P=0.03), supporting the hypothesis that Ki67
suppression (measured as mean Ki-67 decrease at day 15) is higher with
anastrozole plus pictilisib than with anastrozole alone for patients with luminal B
tumors irrespective of PgR status or baseline Ki67 expression. Further genomic
and transcriptomic analysis of these paired samples will be important to better
characterize biomarkers of response to this drug.
1.8.2.3. Biomarkers of response to alpelisib
An exploratory NGS analysis of predictive markers of sensitivity to alpelisib on
baseline tumor samples was presented at the AACR 2013 Annual Meeting157.
Analysis of 94 tumor samples from 79 patients enrolled in the first-in-human Phase
I trial was conducted at Foundation Medicine and The Broad Institute, to
characterize the genetic landscape of the tumors and investigate the potential
association of genetic alterations with clinical efficacy as assessed by PFS (per
RECIST v.1.0). In this study, preliminary clinical activity of alpelisib was mainly
observed in patients with ER+ PIK3CA mutant MBC and in PIK3CA mutant head
and neck cancer. Duration of treatment with alpelisib was shorter for patients with
colorectal cancer (CRC). Mutations frequently found in CRC, such as APC and
63
TP53, associated with lack of clinical benefit to alpelisib, and there was a trend for
a negative association for KRAS mutations and alpelisib efficacy. Interestingly, this
finding supports the results from preclinical studies, where KRAS/PIK3CA double
mutant cell lines are resistant to PAM pathway blockade158.
1.8.2.4. Biomarkers of response to taselisib
Biomarker analysis from the escalation part Phase I study of taselisib were
presented at the AACR 2014 Annual Meeting159. Among the 34 patients enrolled,
metabolic partial responses via FDG-PET were observed in 6 out of 13 patients
assessed, and clinical partial responses were observed in 6 patients, 5 of them
with PIK3CA mutation. Tumor tissue was obtained from 30 out of the 34 patients
enrolled. The proportion of PAM pathway alterations was as follows: PIK3CA
mutation 41%, PTEN null 10% (with additional 10% with reduced PTEN
expression based on an H-score assessment). PIK3CA mutations were largely
mutually exclusive with mutations in the RAS pathway. However, three out of the
14 PIK3CA mutant patients had a coexisting mutation within KRAS. Interestingly,
and similar to the findings with alpelisib, preliminary analysis showed lack of
benefit in patients with KRAS mutations treated with taselisib single agent.
Collectively, these results suggest that taselisib demonstrates single agent activity
in patients with tumors harboring PIK3CA mutations and with unaltered PTEN or
MAP-kinase pathways.
In the neoadjuvant LORELEI study (NCT02273973), a comprehensive analysis of
biomarkers of response (and resistance) to taselisib plus letrozole is planned.
Results are expected in 2017.

64

2Justification

65
2. Justification
Breast cancer is a heterogeneous disease, and adequate treatment of each tumor
implies a thorough knowledge of its drivers and natural history. Identification of
biologically important genes and pathways frequently disrupted in samples from
MBC patients can generate clinically relevant diagnostic, prognostic, and
therapeutic information. Routine molecular screening of primary or metastatic
tumors is now a reality in several Centers around the world3,61,160. The major
objective of this tremendous effort is to identify clinically relevant genes in order to
deliver optimal cancer care for patients. In 2009, we initiated a prospective study
aimed at determining genetic alterations present in samples from MBC patients, in
order to enroll them in clinical trials with drugs targeting those alterations.
Establishing the molecular portrait of our MBC patients is helpful to better match
them to “rational” clinical trials as well as design and project next generation trials
and combinations. One of the aims of this work was therefore to describe the
molecular alterations present in a cohort of MBC patients treated at the Vall
d’Hebron University Hospital / Vall d’Hebron Institute of Oncology (VHUH/VHIO).
Together with CDK4/6 inhibitors and anti-HER2 therapies, PAM pathway inhibitors
are perhaps among the most studied drugs in breast cancer over the last decade.
PAM pathway alterations are very frequent in breast cancer, and are also
oncogenic. From the very outset, PAM pathway inhibitors have been one of the
main areas of research led by our Early Clinical Drug Development Group at
VHIO. For this reason, we have perhaps one of the most extensive populations of
MBC patients treated with these drugs within the same Institution. We wanted to
analyze the characteristics of these patients and the treatment they received,
which is key to take advantage of this therapeutic expertise.
One relevant question when performing genotyping is whether this strategy
improves patients’ outcomes. Most of the studies suggest that matching molecular
alterations with targeted agents is better than giving targeted agents to unselected
populations161-163, although logistic hurdles may jeopardize inclusion rates in
matched trials63. Another aim of this work is to establish the potential benefit of
66
PAM pathway inhibitors in MBC patients treated in the same Institution, where
logistic problems related to genotyping efforts across different Institutions are
minimized, and in a place where the drug portfolio in PAM pathway inhibitors is
constantly updated.
The identification of predictive biomarkers to targeted therapies is an area of
intense investigation and a clear clinical need. The main objective of selecting the
right patients to offer them targeted drugs is to maximize treatment benefit while
sparing them from unnecessary adverse events. PIK3CA mutations seem to
predict efficacy for some PAM pathway inhibitors, but not all patients derive equal
benefit106,116. One of the main purposes of this study is therefore to perform a
comprehensive analysis of the potential predictive biomarkers of response to PAM
pathway inhibitors. Specifically, we will focus on the presence of PAM pathway
alterations, including PIK3CA mutations, PTEN dysregulation, and AKT1
mutations. Furthermore, we will explore the clonality of PIK3CA mutations as a
predictive factor of response to PAM pathway inhibitors.

3Hypothesis

67
3. Hypothesis
3.1. Primary Hypotheses
1. The presence of molecular alterations – especially those leading to PAM
pathway dysregulation, including PIK3CA mutation, PTEN dysregulation,
and AKT1 mutation – is frequent in MBC patients.
2. The presence of PAM pathway alterations is predictive of efficacy to PAM
pathway inhibitors.
3.2. Secondary Hypotheses
1. The prevalence of actionable molecular alterations in MBC, especially those
in the PAM pathway, differs according to the breast cancer subtype.
2. Frequency of molecular alterations varies depending on the site of the
sample used for genotyping.
3. PIK3CA and AKT1 mutations are clonal events in MBC.
4. Multiple molecular alterations may co-occur in MBC.
5. The detection of an actionable molecular alteration increases the probability
of a MBC patient entering a clinical trial.
6. The presence of a PAM pathway alteration increases the probability of a
MBC patient receiving a PAM pathway inhibitor.
7. The presence of PIK3CA mutations is predictive of benefit to PI3Kα-specific
inhibitors.

68

4Objectives

69
4. Objectives
4.1. Primary Objectives
1. Characterize the prevalence of molecular alterations in a cohort of MBC
patients treated at VHUH/VHIO, with a special focus on PAM pathway
alterations like PIK3CA mutation, PTEN dysregulation, and AKT1 mutation.
2. Assess predictive factors of efficacy (measured as clinical benefit rate and
time to treatment failure) of PAM pathway inhibitors in this population.
4.2. Secondary Objectives
1. Characterize the prevalence of actionable alterations and PAM pathway
alterations, overall and according to breast cancer subtype.
2. Describe the differences in the molecular alterations according to the site of
the sample used for genotyping.
3. Assess the clonality of PIK3CA, AKT1, and other somatic mutations.
4. Describe the co-occurrence of molecular alterations in this cohort of MBC
patients.
5. Assess the rate of enrollment in clinical trials in this population according to
the presence of an actionable alteration.
6. Evaluate whether the presence of PAM pathway alterations increases the
probability of receiving PAM pathway inhibitors.
7. Analyze predictive factors of efficacy to PI3Kα-specific inhibitors.

70

5Patients
and Methods

71
5. Patients and Methods
5.1. Study design
This is a retrospective cohort study using prospectively acquired data from several
research projects and clinical trials.
5.2. Sample selection
Consecutive MBC patients screened for gene mutation by Sequenom® or
AmpliconSeq within the VHUH/VHIO molecular screening program from January
2010 until December 2015 were identified from our Database. Data on FGFR1
amplification and PTEN IHC were also collected if available. All patients provided
signed informed consent to the molecular determinations as part of routine
molecular testing at our Institution. Patients were only included in the analysis if
tumor tissue was available for mutation testing.
5.3. Clinical and pathologic variables
Registration of the patients in the database, pathology assessments, molecular
determinations, and treatment were all performed at VHUH/VHIO. Medical charts
of all patients were reviewed to confirm the accuracy of the variables recorded in
the database.
Patients’ demographics (age, sex), tumor characteristics (histologic type, grade,
ER, PgR, HER2, Ki67), characteristics of metastatic disease at the time of
initiating treatment with PI3K pathway inhibitor (number and type of metastatic
sites, number of prior lines for MBC), outcome of the treatment (best response and
reason for treatment discontinuation), and vital status (including date of death or
last follow-up) were collected and recorded for each patient.
We used the following surrogate definitions for the breast cancer subtypes:
72
Luminal (LUM): ER and/or PgR+ and HER2-negative, independently of
Ki67;
HER2+: HER2+ as per ASCO/CAP guidelines164, independently of ER or
PgR;
Triple negative (TN): ER negative and PgR negative and HER2-negative.
Saint Gallen definitions48 were not used because of missing data on grade and/or
Ki67, which would have excluded many patients from the analysis.
Patients were classified as having a PAM pathway dysregulation in the presence
of at least one of the following alterations: PIK3CA mutation, AKT1 mutation, NF2
mutation, and PTEN dysregulation (mutation or null/low expression). Otherwise,
they were classified as having no pathway dysregulation.
5.4. Molecular analysis
Molecular analysis was performed according to the standards of the pre-screening
program of VHUH/VHIO, briefly described below.
Upon signing the appropriate Ethics Committee approved informed consent form,
a tumor sample was collected for each patient and underwent a quality check by
an experienced pathologist. If more than 20% of tumor cells were present, the
appropriate number of slides was cut for DNA extraction, IHC, and/or FISH
analysis, depending on the clinician request.
The following targeted panels were used for the DNA mutation analysis:
MassARRAY system (Sequenom®) until June 2014, and AmpliconSeq afterwards.
Sequenom® was performed using two assay panels: OncoCartaTM v1.0 and CLIA
v2.2. This panel performs somatic mutation profiling of 273 mutations in 21
oncogenes (Table 2). The panel is based on the use of IPlex chemistry
(Sequenom®). In brief, DNA was extracted from 5x10μm slices of FFPE tumor
samples using the RecoverAll Total Nucleic Acid Isolation Kit (Ambion). Six-
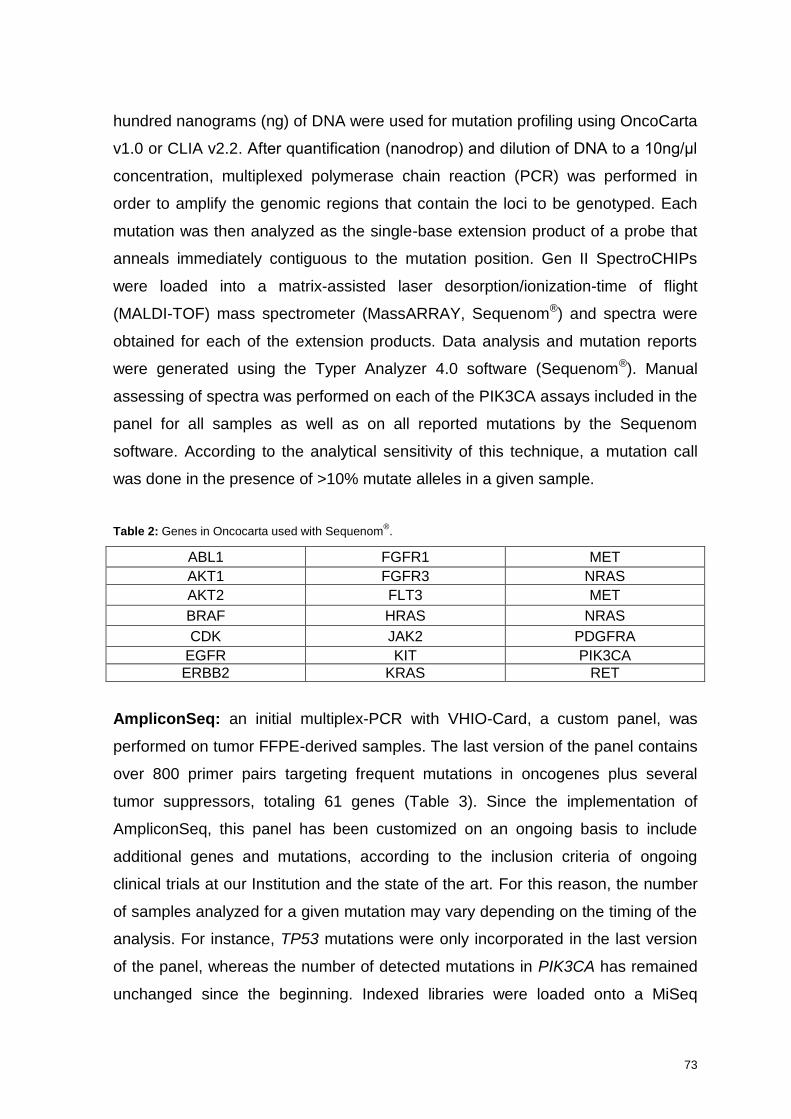
73
hundred nanograms (ng) of DNA were used for mutation profiling using OncoCarta
v1.0 or CLIA v2.2. After quantification (nanodrop) and dilution of DNA to a 10ng/μl
concentration, multiplexed polymerase chain reaction (PCR) was performed in
order to amplify the genomic regions that contain the loci to be genotyped. Each
mutation was then analyzed as the single-base extension product of a probe that
anneals immediately contiguous to the mutation position. Gen II SpectroCHIPs
were loaded into a matrix-assisted laser desorption/ionization-time of flight
(MALDI-TOF) mass spectrometer (MassARRAY, Sequenom®) and spectra were
obtained for each of the extension products. Data analysis and mutation reports
were generated using the Typer Analyzer 4.0 software (Sequenom®). Manual
assessing of spectra was performed on each of the PIK3CA assays included in the
panel for all samples as well as on all reported mutations by the Sequenom
software. According to the analytical sensitivity of this technique, a mutation call
was done in the presence of >10% mutate alleles in a given sample.
Table 2: Genes in Oncocarta used with Sequenom®.
ABL1 FGFR1 MET
AKT1 FGFR3 NRAS
AKT2 FLT3 MET
BRAF HRAS NRAS
CDK JAK2 PDGFRA
EGFR KIT PIK3CA
ERBB2 KRAS RET
AmpliconSeq: an initial multiplex-PCR with VHIO-Card, a custom panel, was
performed on tumor FFPE-derived samples. The last version of the panel contains
over 800 primer pairs targeting frequent mutations in oncogenes plus several
tumor suppressors, totaling 61 genes (Table 3). Since the implementation of
AmpliconSeq, this panel has been customized on an ongoing basis to include
additional genes and mutations, according to the inclusion criteria of ongoing
clinical trials at our Institution and the state of the art. For this reason, the number
of samples analyzed for a given mutation may vary depending on the timing of the
analysis. For instance, TP53 mutations were only incorporated in the last version
of the panel, whereas the number of detected mutations in PIK3CA has remained
unchanged since the beginning. Indexed libraries were loaded onto a MiSeq
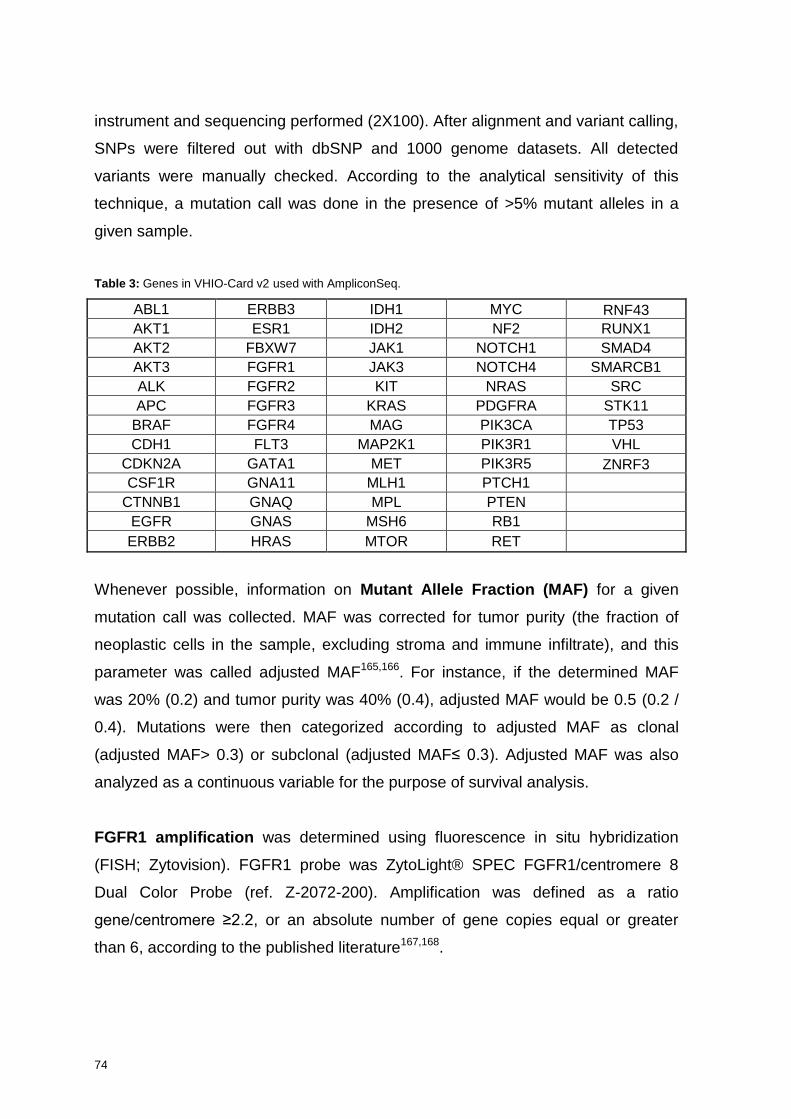
74
instrument and sequencing performed (2X100). After alignment and variant calling,
SNPs were filtered out with dbSNP and 1000 genome datasets. All detected
variants were manually checked. According to the analytical sensitivity of this
technique, a mutation call was done in the presence of >5% mutant alleles in a
given sample.
Table 3: Genes in VHIO-Card v2 used with AmpliconSeq.
ABL1 ERBB3 IDH1 MYC RNF43
AKT1 ESR1 IDH2 NF2 RUNX1
AKT2 FBXW7 JAK1 NOTCH1 SMAD4
AKT3 FGFR1 JAK3 NOTCH4 SMARCB1
ALK FGFR2 KIT NRAS SRC
APC FGFR3 KRAS PDGFRA STK11
BRAF FGFR4 MAG PIK3CA TP53
CDH1 FLT3 MAP2K1 PIK3R1 VHL
CDKN2A GATA1 MET PIK3R5 ZNRF3
CSF1R GNA11 MLH1 PTCH1
CTNNB1 GNAQ MPL PTEN
EGFR GNAS MSH6 RB1
ERBB2 HRAS MTOR RET
Whenever possible, information on Mutant Allele Fraction (MAF) for a given
mutation call was collected. MAF was corrected for tumor purity (the fraction of
neoplastic cells in the sample, excluding stroma and immune infiltrate), and this
parameter was called adjusted MAF165,166. For instance, if the determined MAF
was 20% (0.2) and tumor purity was 40% (0.4), adjusted MAF would be 0.5 (0.2 /
0.4). Mutations were then categorized according to adjusted MAF as clonal
(adjusted MAF> 0.3) or subclonal (adjusted MAF≤ 0.3). Adjusted MAF was also
analyzed as a continuous variable for the purpose of survival analysis.
FGFR1 amplification was determined using fluorescence in situ hybridization
(FISH; Zytovision). FGFR1 probe was ZytoLight® SPEC FGFR1/centromere 8
Dual Color Probe (ref. Z-2072-200). Amplification was defined as a ratio
gene/centromere ≥2.2, or an absolute number of gene copies equal or greater
than 6, according to the published literature167,168.
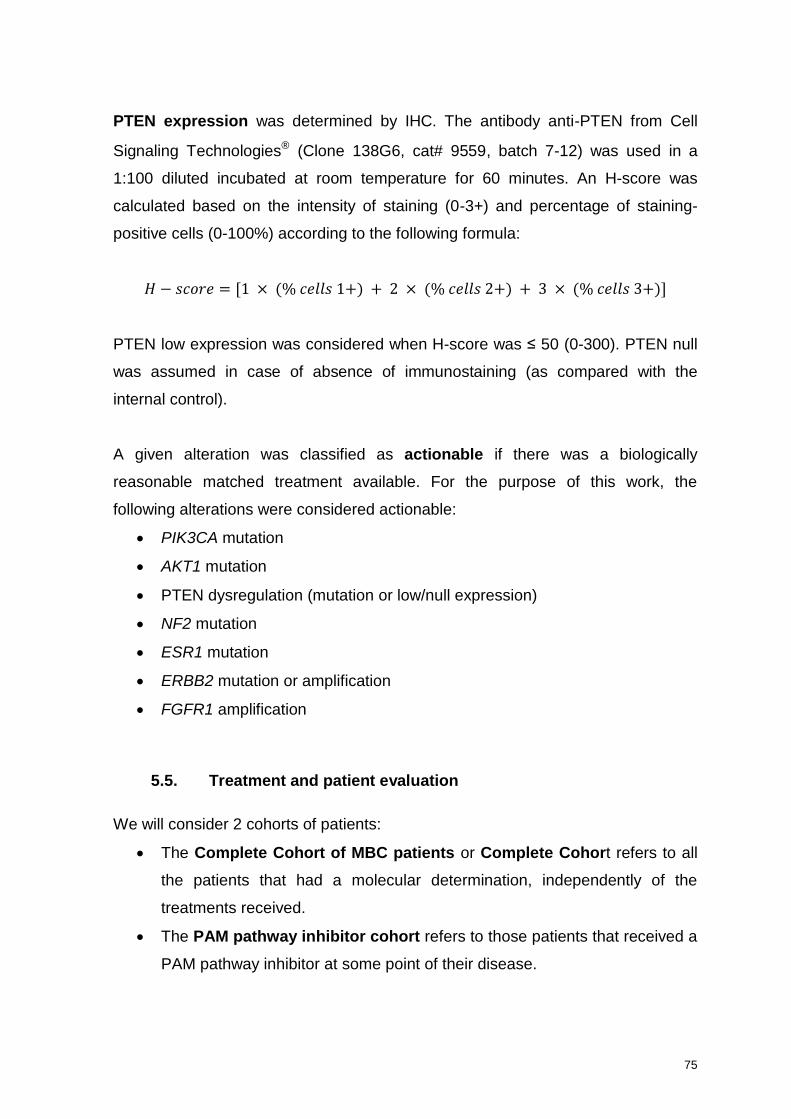
75
PTEN expression was determined by IHC. The antibody anti-PTEN from Cell
Signaling Technologies® (Clone 138G6, cat# 9559, batch 7-12) was used in a
1:100 diluted incubated at room temperature for 60 minutes. An H-score was
calculated based on the intensity of staining (0-3+) and percentage of staining-
positive cells (0-100%) according to the following formula:
PTEN low expression was considered when H-score was ≤ 50 (0-300). PTEN null
was assumed in case of absence of immunostaining (as compared with the
internal control).
A given alteration was classified as actionable if there was a biologically
reasonable matched treatment available. For the purpose of this work, the
following alterations were considered actionable:
PIK3CA mutation
AKT1 mutation
PTEN dysregulation (mutation or low/null expression)
NF2 mutation
ESR1 mutation
ERBB2 mutation or amplification
FGFR1 amplification
5.5. Treatment and patient evaluation
We will consider 2 cohorts of patients:
The Complete Cohort of MBC patients or Complete Cohort refers to all
the patients that had a molecular determination, independently of the
treatments received.
The PAM pathway inhibitor cohort refers to those patients that received a
PAM pathway inhibitor at some point of their disease.
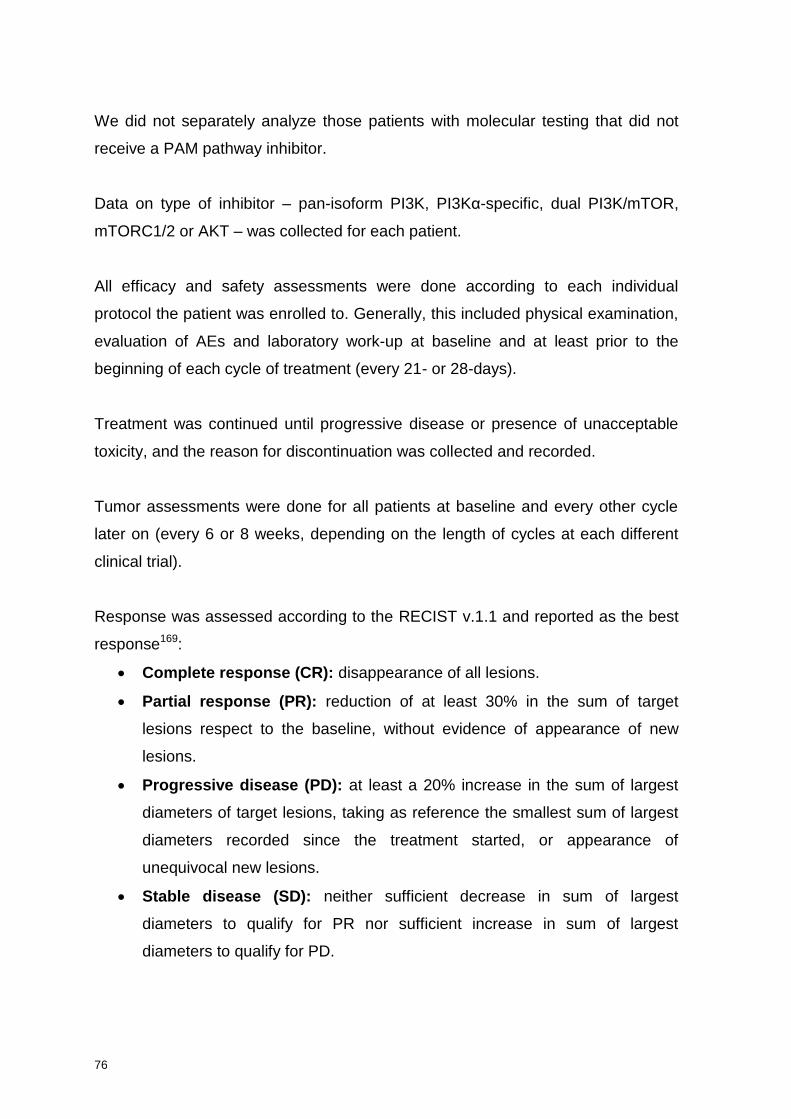
76
We did not separately analyze those patients with molecular testing that did not
receive a PAM pathway inhibitor.
Data on type of inhibitor – pan-isoform PI3K, PI3Kα-specific, dual PI3K/mTOR,
mTORC1/2 or AKT – was collected for each patient.
All efficacy and safety assessments were done according to each individual
protocol the patient was enrolled to. Generally, this included physical examination,
evaluation of AEs and laboratory work-up at baseline and at least prior to the
beginning of each cycle of treatment (every 21- or 28-days).
Treatment was continued until progressive disease or presence of unacceptable
toxicity, and the reason for discontinuation was collected and recorded.
Tumor assessments were done for all patients at baseline and every other cycle
later on (every 6 or 8 weeks, depending on the length of cycles at each different
clinical trial).
Response was assessed according to the RECIST v.1.1 and reported as the best
response169:
Complete response (CR): disappearance of all lesions.
Partial response (PR): reduction of at least 30% in the sum of target
lesions respect to the baseline, without evidence of appearance of new
lesions.
Progressive disease (PD): at least a 20% increase in the sum of largest
diameters of target lesions, taking as reference the smallest sum of largest
diameters recorded since the treatment started, or appearance of
unequivocal new lesions.
Stable disease (SD): neither sufficient decrease in sum of largest
diameters to qualify for PR nor sufficient increase in sum of largest
diameters to qualify for PD.
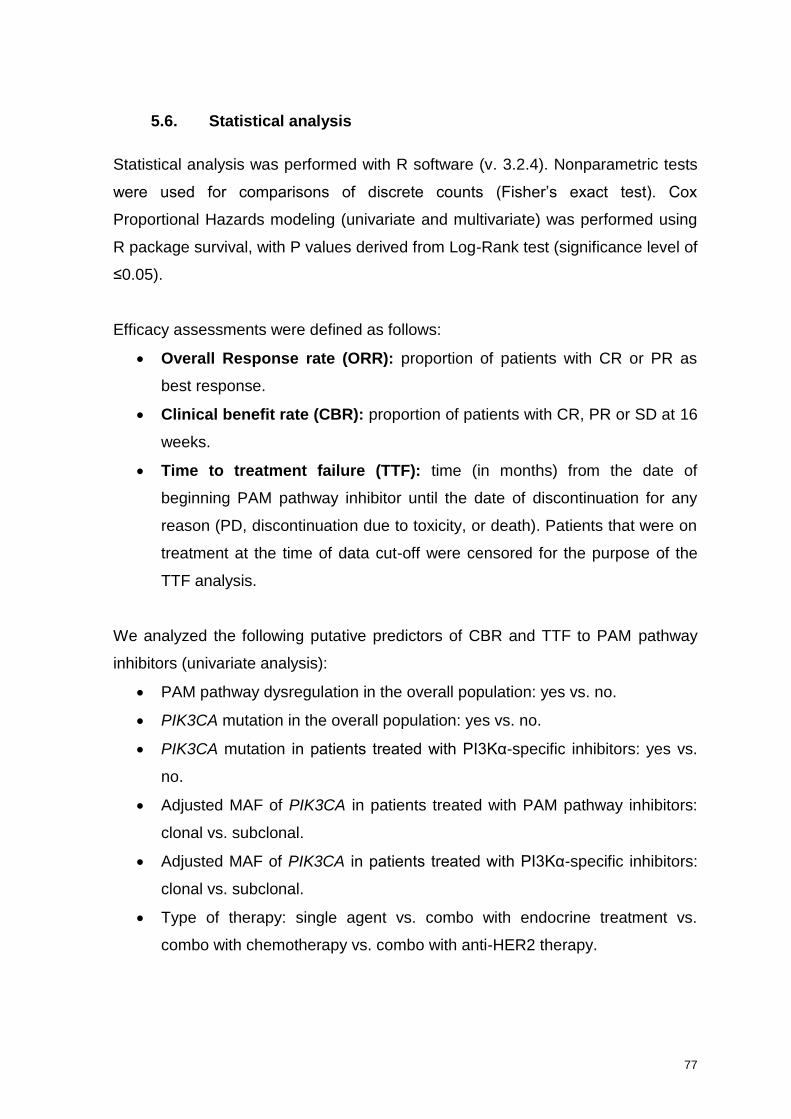
77
5.6. Statistical analysis
Statistical analysis was performed with R software (v. 3.2.4). Nonparametric tests
were used for comparisons of discrete counts (Fisher’s exact test). Cox
Proportional Hazards modeling (univariate and multivariate) was performed using
R package survival, with P values derived from Log-Rank test (significance level of
≤0.05).
Efficacy assessments were defined as follows:
Overall Response rate (ORR): proportion of patients with CR or PR as
best response.
Clinical benefit rate (CBR): proportion of patients with CR, PR or SD at 16
weeks.
Time to treatment failure (TTF): time (in months) from the date of
beginning PAM pathway inhibitor until the date of discontinuation for any
reason (PD, discontinuation due to toxicity, or death). Patients that were on
treatment at the time of data cut-off were censored for the purpose of the
TTF analysis.
We analyzed the following putative predictors of CBR and TTF to PAM pathway
inhibitors (univariate analysis):
PAM pathway dysregulation in the overall population: yes vs. no.
PIK3CA mutation in the overall population: yes vs. no.
PIK3CA mutation in patients treated with PI3Kα-specific inhibitors: yes vs.
no.
Adjusted MAF of PIK3CA in patients treated with PAM pathway inhibitors:
clonal vs. subclonal.
Adjusted MAF of PIK3CA in patients treated with PI3Kα-specific inhibitors:
clonal vs. subclonal.
Type of therapy: single agent vs. combo with endocrine treatment vs.
combo with chemotherapy vs. combo with anti-HER2 therapy.

78
Then, we ran a multivariate model for TTF taking also into account several known
or potential prognostic factors in this context:
Presence of visceral metastasis: no vs. yes.
Number of sites of metastasis: 1-2 vs. 3 or more.
Breast cancer subtype: LUM vs. HER2 vs. TN.
Number or prior chemotherapies: ≤2 vs. >2.
Type of PAM pathway inhibitor: mTORC1/2 vs. AKT vs. pan-PI3K vs.
PI3K/mTOR vs. PI3Kα-specific.

6Results

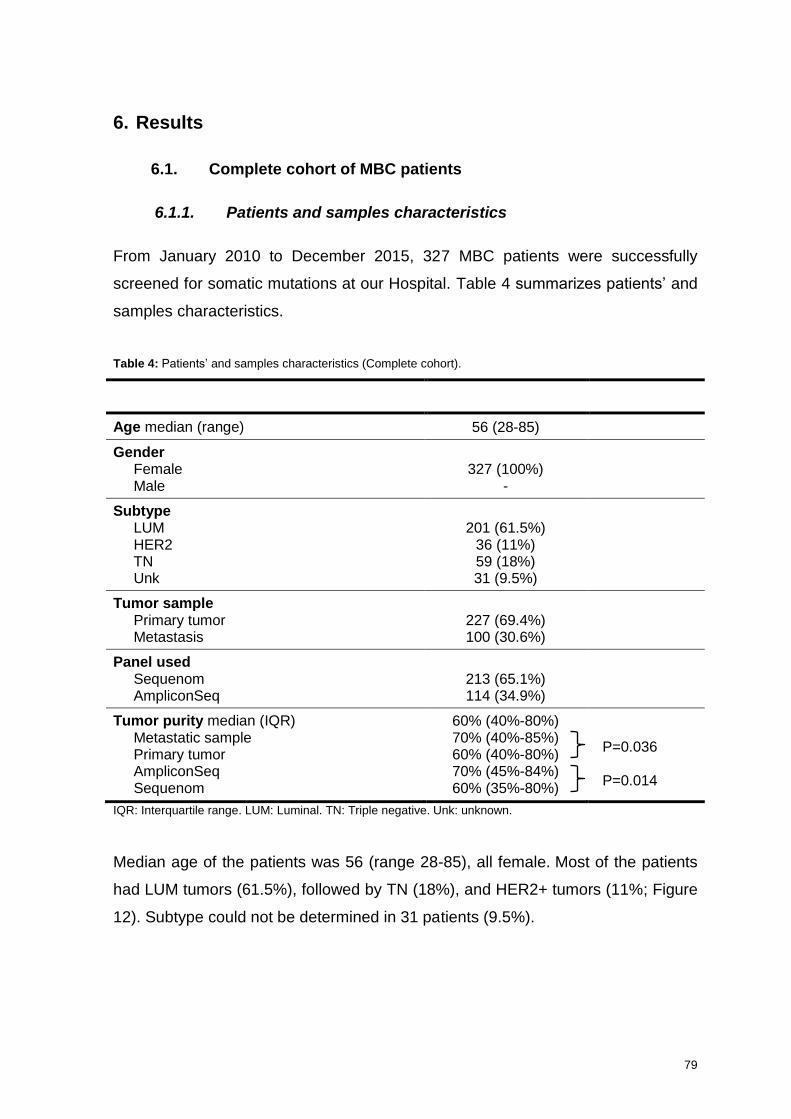
79
6. Results
6.1. Complete cohort of MBC patients
6.1.1. Patients and samples characteristics
From January 2010 to December 2015, 327 MBC patients were successfully
screened for somatic mutations at our Hospital. Table 4 summarizes patients’ and
samples characteristics.
Table 4: Patients’ and samples characteristics (Complete cohort).
N=327
Age median (range) 56 (28-85)
Gender Female Male
327 (100%)
-
Subtype LUM HER2 TN Unk
201 (61.5%)
36 (11%) 59 (18%) 31 (9.5%)
Tumor sample Primary tumor Metastasis
227 (69.4%) 100 (30.6%)
Panel used Sequenom AmpliconSeq
213 (65.1%) 114 (34.9%)
Tumor purity median (IQR) Metastatic sample Primary tumor AmpliconSeq Sequenom
60% (40%-80%) 70% (40%-85%) 60% (40%-80%) 70% (45%-84%) 60% (35%-80%)
P=0.036
P=0.014
IQR: Interquartile range. LUM: Luminal. TN: Triple negative. Unk: unknown.
Median age of the patients was 56 (range 28-85), all female. Most of the patients
had LUM tumors (61.5%), followed by TN (18%), and HER2+ tumors (11%; Figure
12). Subtype could not be determined in 31 patients (9.5%).
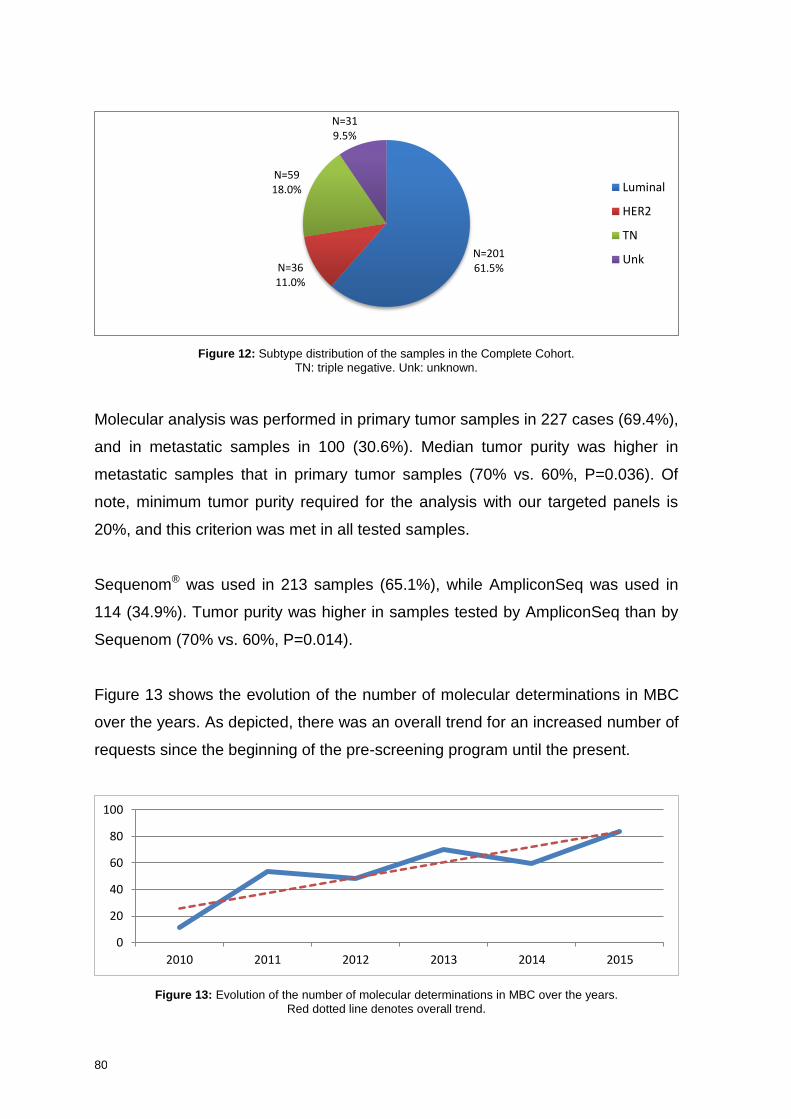
80
Figure 12: Subtype distribution of the samples in the Complete Cohort.
TN: triple negative. Unk: unknown.
Molecular analysis was performed in primary tumor samples in 227 cases (69.4%),
and in metastatic samples in 100 (30.6%). Median tumor purity was higher in
metastatic samples that in primary tumor samples (70% vs. 60%, P=0.036). Of
note, minimum tumor purity required for the analysis with our targeted panels is
20%, and this criterion was met in all tested samples.
Sequenom® was used in 213 samples (65.1%), while AmpliconSeq was used in
114 (34.9%). Tumor purity was higher in samples tested by AmpliconSeq than by
Sequenom (70% vs. 60%, P=0.014).
Figure 13 shows the evolution of the number of molecular determinations in MBC
over the years. As depicted, there was an overall trend for an increased number of
requests since the beginning of the pre-screening program until the present.
Figure 13: Evolution of the number of molecular determinations in MBC over the years.
Red dotted line denotes overall trend.
N=201 61.5% N=36
11.0%
N=59 18.0%
N=31 9.5%
Luminal
HER2
TN
Unk
0
20
40
60
80
100
2010 2011 2012 2013 2014 2015
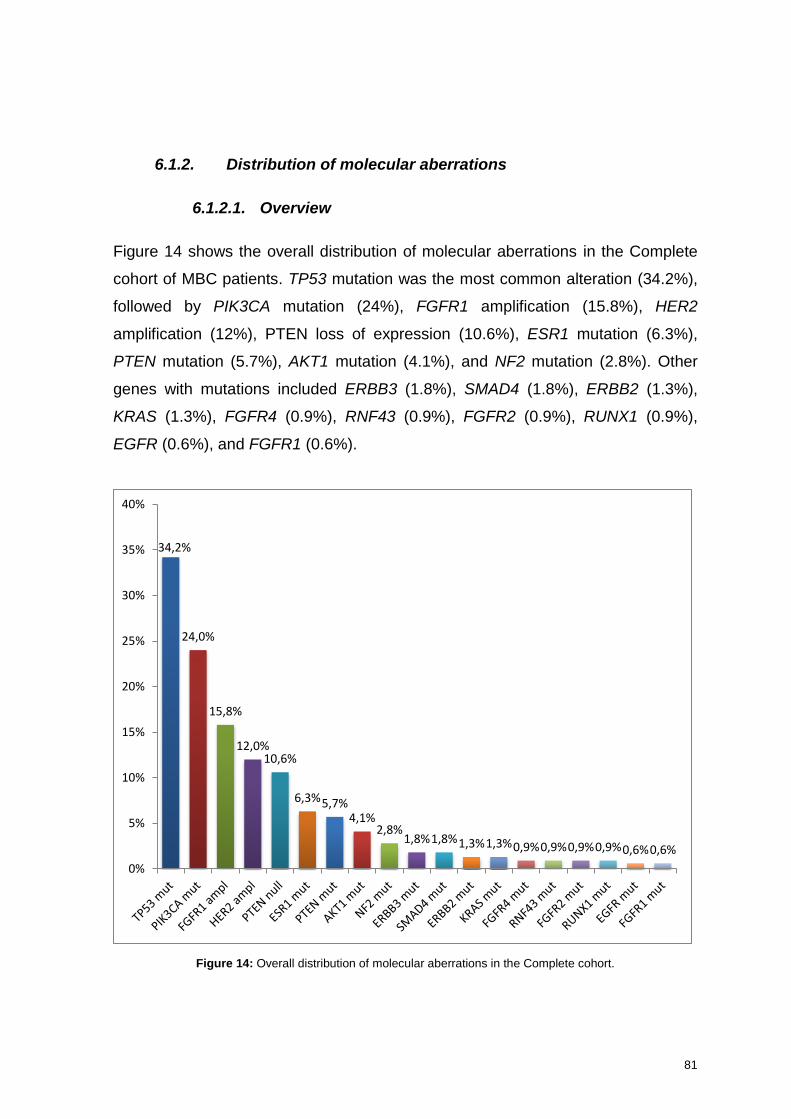
81
6.1.2. Distribution of molecular aberrations
6.1.2.1. Overview
Figure 14 shows the overall distribution of molecular aberrations in the Complete
cohort of MBC patients. TP53 mutation was the most common alteration (34.2%),
followed by PIK3CA mutation (24%), FGFR1 amplification (15.8%), HER2
amplification (12%), PTEN loss of expression (10.6%), ESR1 mutation (6.3%),
PTEN mutation (5.7%), AKT1 mutation (4.1%), and NF2 mutation (2.8%). Other
genes with mutations included ERBB3 (1.8%), SMAD4 (1.8%), ERBB2 (1.3%),
KRAS (1.3%), FGFR4 (0.9%), RNF43 (0.9%), FGFR2 (0.9%), RUNX1 (0.9%),
EGFR (0.6%), and FGFR1 (0.6%).
Figure 14: Overall distribution of molecular aberrations in the Complete cohort.
34,2%
24,0%
15,8%
12,0% 10,6%
6,3% 5,7% 4,1%
2,8% 1,8% 1,8% 1,3% 1,3% 0,9% 0,9% 0,9% 0,9% 0,6% 0,6%
0%
5%
10%
15%
20%
25%
30%
35%
40%
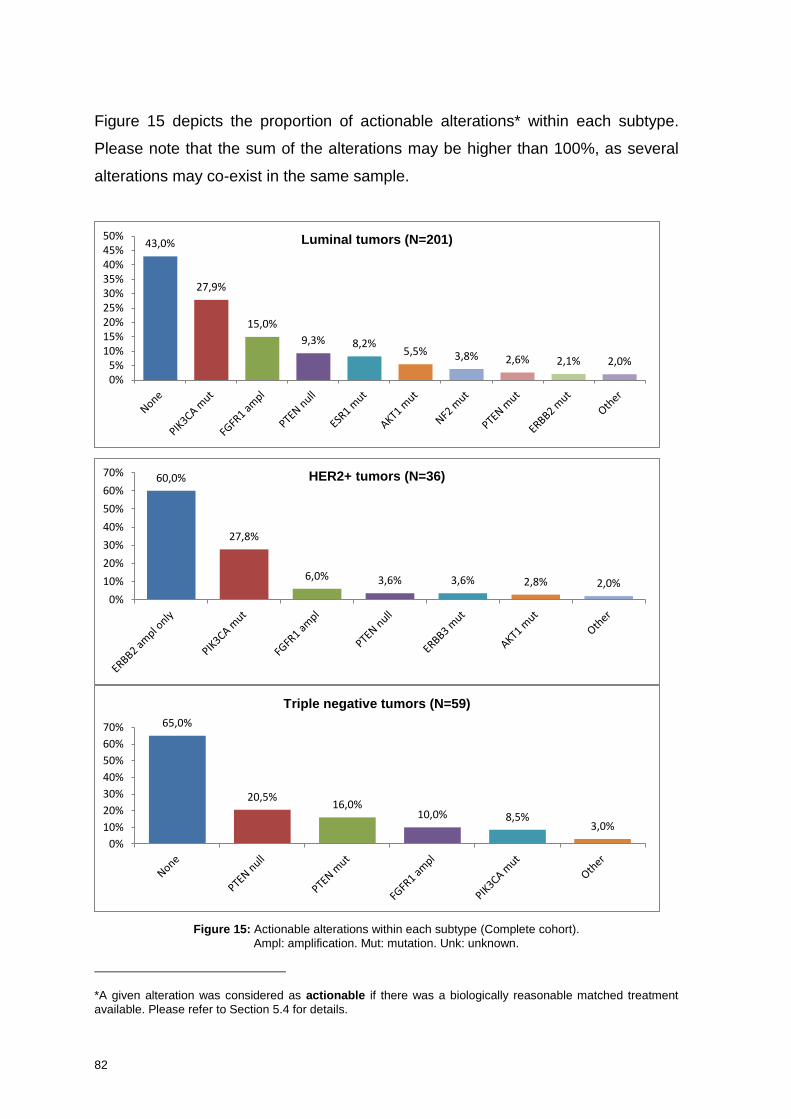
82
Figure 15 depicts the proportion of actionable alterations* within each subtype.
Please note that the sum of the alterations may be higher than 100%, as several
alterations may co-exist in the same sample.
Figure 15: Actionable alterations within each subtype (Complete cohort).
Ampl: amplification. Mut: mutation. Unk: unknown.
*A given alteration was considered as actionable if there was a biologically reasonable matched treatment
available. Please refer to Section 5.4 for details.
43,0%
27,9%
15,0%
9,3% 8,2% 5,5% 3,8% 2,6% 2,1% 2,0%
0%5%
10%15%20%25%30%35%40%45%50% Luminal tumors (N=201)
60,0%
27,8%
6,0% 3,6% 3,6% 2,8% 2,0%
0%
10%
20%
30%
40%
50%
60%
70% HER2+ tumors (N=36)
65,0%
20,5% 16,0%
10,0% 8,5% 3,0%
0%
10%
20%
30%
40%
50%
60%
70%
Triple negative tumors (N=59)
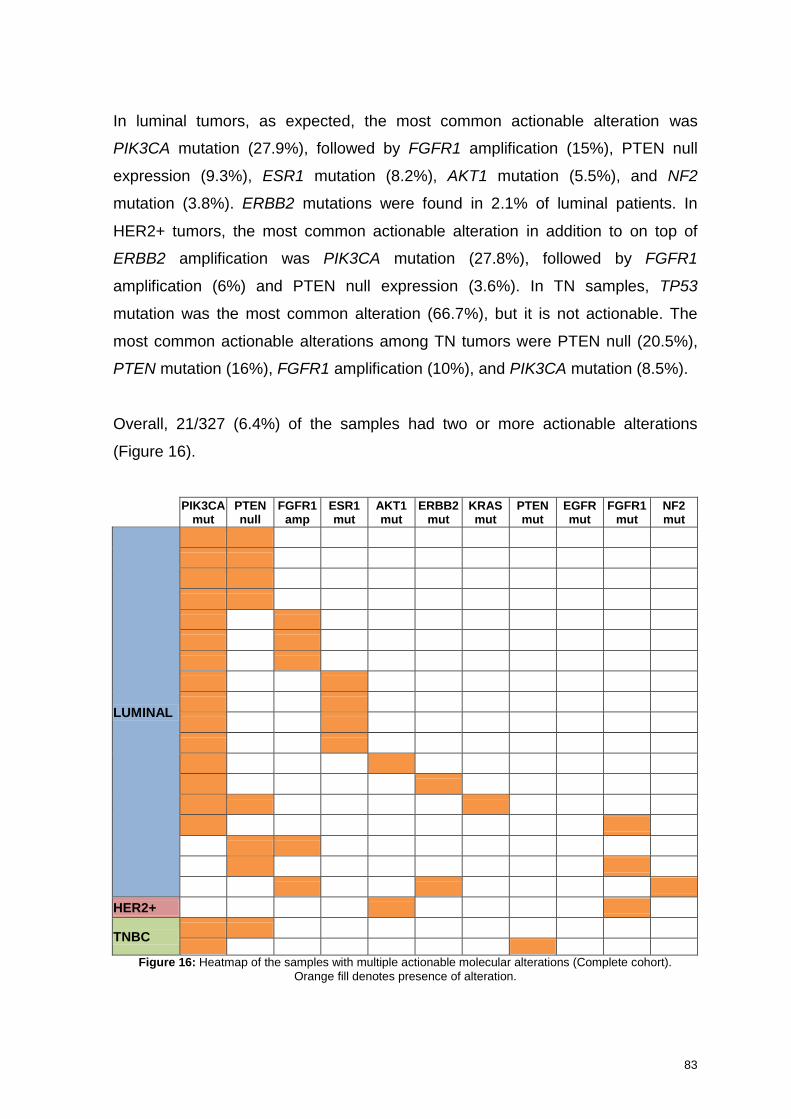
83
In luminal tumors, as expected, the most common actionable alteration was
PIK3CA mutation (27.9%), followed by FGFR1 amplification (15%), PTEN null
expression (9.3%), ESR1 mutation (8.2%), AKT1 mutation (5.5%), and NF2
mutation (3.8%). ERBB2 mutations were found in 2.1% of luminal patients. In
HER2+ tumors, the most common actionable alteration in addition to on top of
ERBB2 amplification was PIK3CA mutation (27.8%), followed by FGFR1
amplification (6%) and PTEN null expression (3.6%). In TN samples, TP53
mutation was the most common alteration (66.7%), but it is not actionable. The
most common actionable alterations among TN tumors were PTEN null (20.5%),
PTEN mutation (16%), FGFR1 amplification (10%), and PIK3CA mutation (8.5%).
Overall, 21/327 (6.4%) of the samples had two or more actionable alterations
(Figure 16).
PIK3CA mut
PTEN null
FGFR1 amp
ESR1 mut
AKT1 mut
ERBB2 mut
KRAS mut
PTEN mut
EGFR mut
FGFR1 mut
NF2 mut
LUMINAL
HER2+
TNBC
Figure 16: Heatmap of the samples with multiple actionable molecular alterations (Complete cohort).
Orange fill denotes presence of alteration.
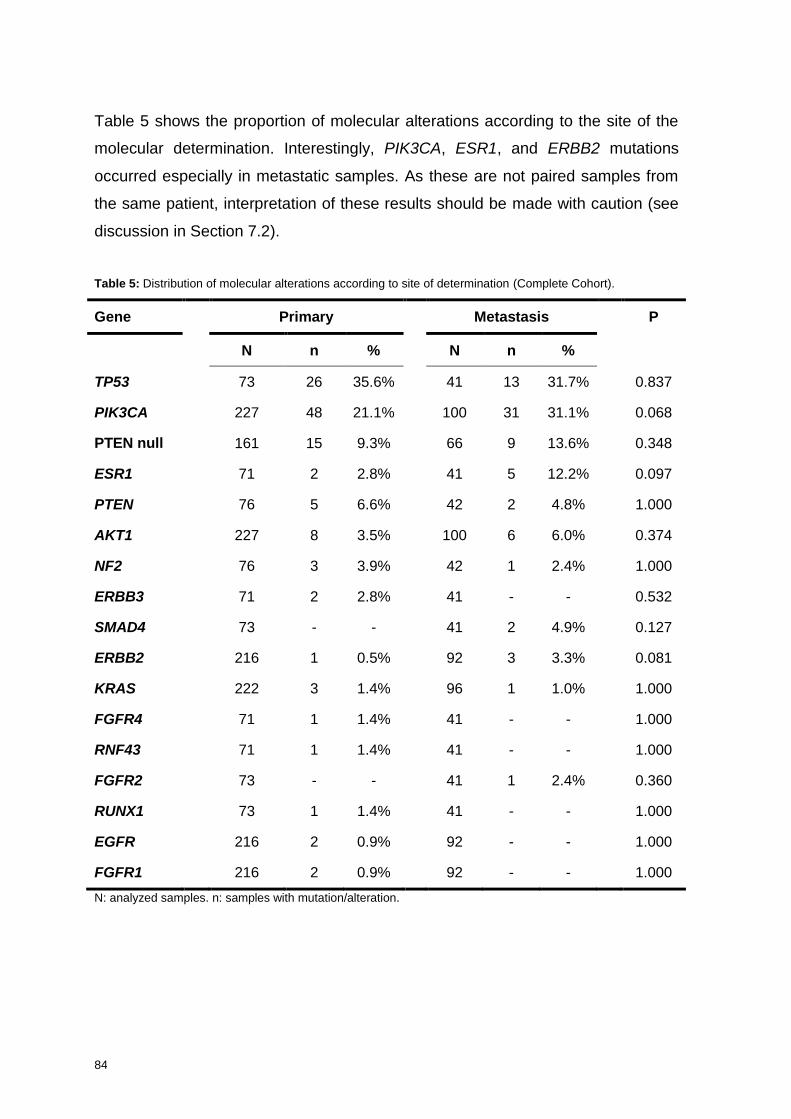
84
Table 5 shows the proportion of molecular alterations according to the site of the
molecular determination. Interestingly, PIK3CA, ESR1, and ERBB2 mutations
occurred especially in metastatic samples. As these are not paired samples from
the same patient, interpretation of these results should be made with caution (see
discussion in Section 7.2).
Table 5: Distribution of molecular alterations according to site of determination (Complete Cohort).
Gene Primary Metastasis P
N n % N n %
TP53 73 26 35.6% 41 13 31.7% 0.837
PIK3CA 227 48 21.1% 100 31 31.1% 0.068
PTEN null 161 15 9.3% 66 9 13.6% 0.348
ESR1 71 2 2.8% 41 5 12.2% 0.097
PTEN 76 5 6.6% 42 2 4.8% 1.000
AKT1 227 8 3.5% 100 6 6.0% 0.374
NF2 76 3 3.9% 42 1 2.4% 1.000
ERBB3 71 2 2.8% 41 - - 0.532
SMAD4 73 - - 41 2 4.9% 0.127
ERBB2 216 1 0.5% 92 3 3.3% 0.081
KRAS 222 3 1.4% 96 1 1.0% 1.000
FGFR4 71 1 1.4% 41 - - 1.000
RNF43 71 1 1.4% 41 - - 1.000
FGFR2 73 - - 41 1 2.4% 0.360
RUNX1 73 1 1.4% 41 - - 1.000
EGFR 216 2 0.9% 92 - - 1.000
FGFR1 216 2 0.9% 92 - - 1.000
N: analyzed samples. n: samples with mutation/alteration.
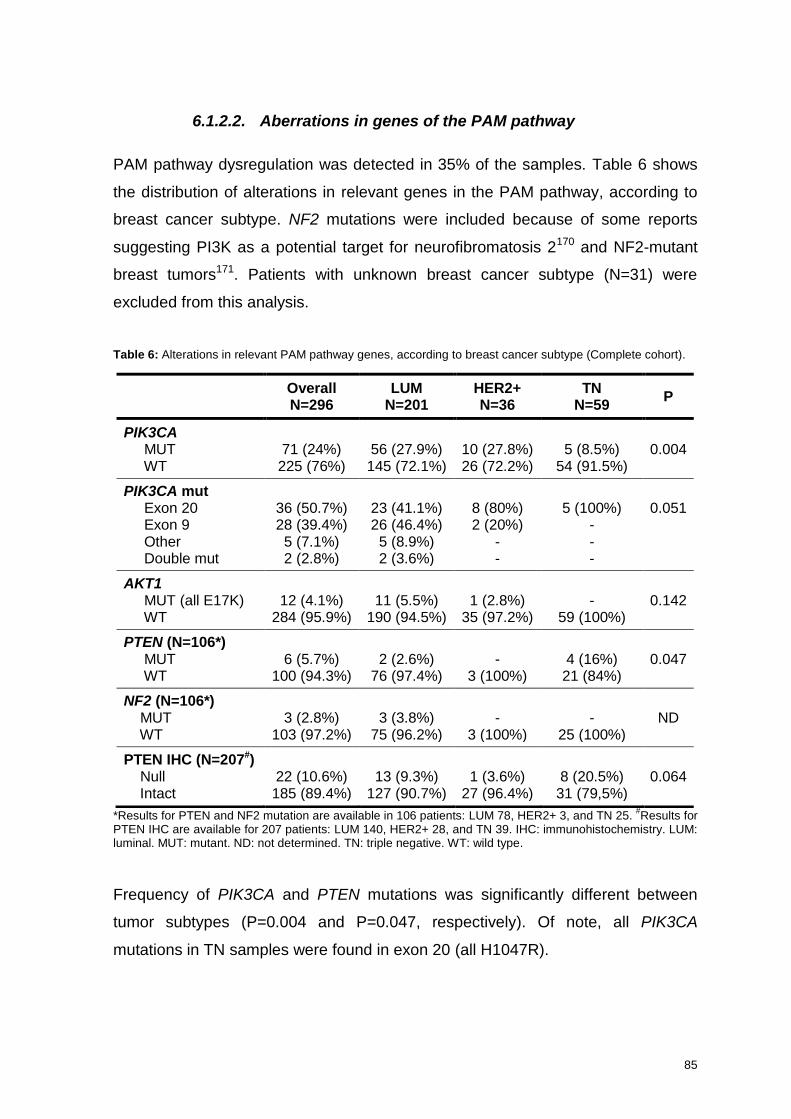
85
6.1.2.2. Aberrations in genes of the PAM pathway
PAM pathway dysregulation was detected in 35% of the samples. Table 6 shows
the distribution of alterations in relevant genes in the PAM pathway, according to
breast cancer subtype. NF2 mutations were included because of some reports
suggesting PI3K as a potential target for neurofibromatosis 2170 and NF2-mutant
breast tumors171. Patients with unknown breast cancer subtype (N=31) were
excluded from this analysis.
Table 6: Alterations in relevant PAM pathway genes, according to breast cancer subtype (Complete cohort).
*Results for PTEN and NF2 mutation are available in 106 patients: LUM 78, HER2+ 3, and TN 25. #Results for
PTEN IHC are available for 207 patients: LUM 140, HER2+ 28, and TN 39. IHC: immunohistochemistry. LUM: luminal. MUT: mutant. ND: not determined. TN: triple negative. WT: wild type.
Frequency of PIK3CA and PTEN mutations was significantly different between
tumor subtypes (P=0.004 and P=0.047, respectively). Of note, all PIK3CA
mutations in TN samples were found in exon 20 (all H1047R).
Overall N=296
LUM N=201
HER2+ N=36
TN N=59
P
PIK3CA MUT WT
71 (24%) 225 (76%)
56 (27.9%) 145 (72.1%)
10 (27.8%) 26 (72.2%)
5 (8.5%)
54 (91.5%)
0.004
PIK3CA mut Exon 20 Exon 9 Other Double mut
36 (50.7%) 28 (39.4%) 5 (7.1%) 2 (2.8%)
23 (41.1%) 26 (46.4%) 5 (8.9%) 2 (3.6%)
8 (80%) 2 (20%)
- -
5 (100%)
- - -
0.051
AKT1 MUT (all E17K) WT
12 (4.1%)
284 (95.9%)
11 (5.5%)
190 (94.5%)
1 (2.8%)
35 (97.2%)
-
59 (100%)
0.142
PTEN (N=106*) MUT WT
6 (5.7%)
100 (94.3%)
2 (2.6%)
76 (97.4%)
-
3 (100%)
4 (16%)
21 (84%)
0.047
NF2 (N=106*) MUT WT
3 (2.8%)
103 (97.2%)
3 (3.8%)
75 (96.2%)
-
3 (100%)
-
25 (100%)
ND
PTEN IHC (N=207#) Null Intact
22 (10.6%) 185 (89.4%)
13 (9.3%)
127 (90.7%)
1 (3.6%)
27 (96.4%)
8 (20.5%)
31 (79,5%)
0.064
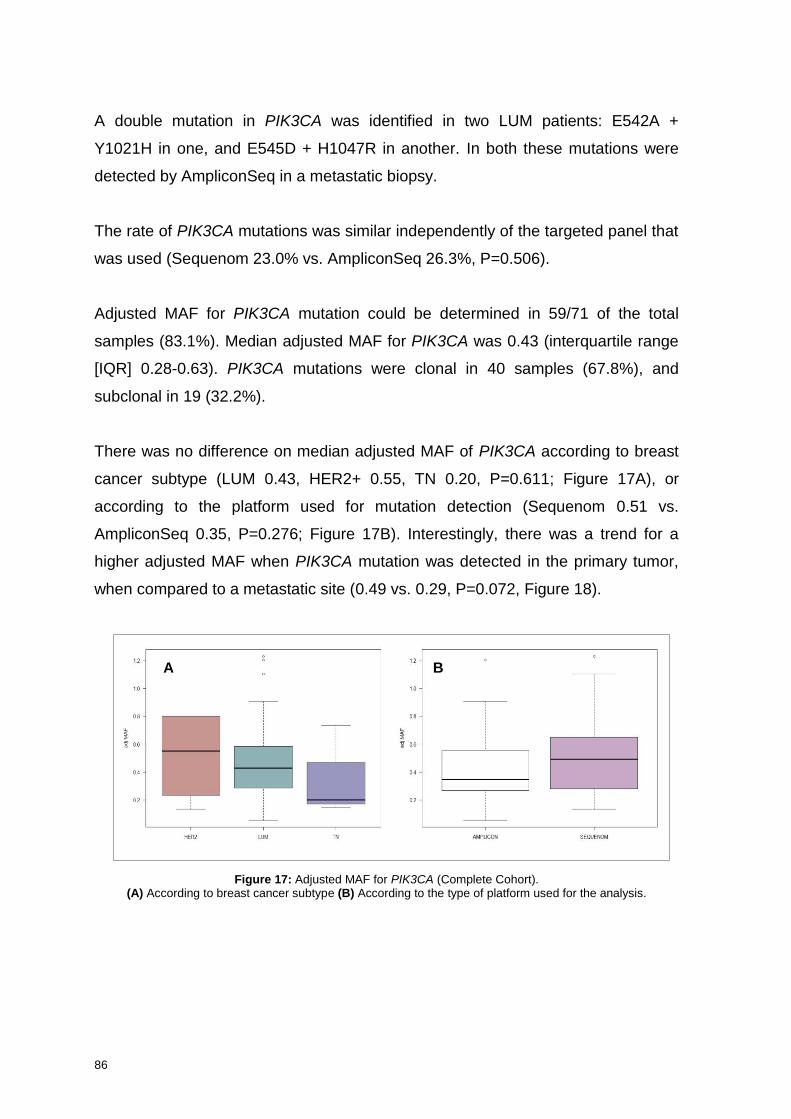
86
A double mutation in PIK3CA was identified in two LUM patients: E542A +
Y1021H in one, and E545D + H1047R in another. In both these mutations were
detected by AmpliconSeq in a metastatic biopsy.
The rate of PIK3CA mutations was similar independently of the targeted panel that
was used (Sequenom 23.0% vs. AmpliconSeq 26.3%, P=0.506).
Adjusted MAF for PIK3CA mutation could be determined in 59/71 of the total
samples (83.1%). Median adjusted MAF for PIK3CA was 0.43 (interquartile range
[IQR] 0.28-0.63). PIK3CA mutations were clonal in 40 samples (67.8%), and
subclonal in 19 (32.2%).
There was no difference on median adjusted MAF of PIK3CA according to breast
cancer subtype (LUM 0.43, HER2+ 0.55, TN 0.20, P=0.611; Figure 17A), or
according to the platform used for mutation detection (Sequenom 0.51 vs.
AmpliconSeq 0.35, P=0.276; Figure 17B). Interestingly, there was a trend for a
higher adjusted MAF when PIK3CA mutation was detected in the primary tumor,
when compared to a metastatic site (0.49 vs. 0.29, P=0.072, Figure 18).
Figure 17: Adjusted MAF for PIK3CA (Complete Cohort). (A) According to breast cancer subtype (B) According to the type of platform used for the analysis.
A B
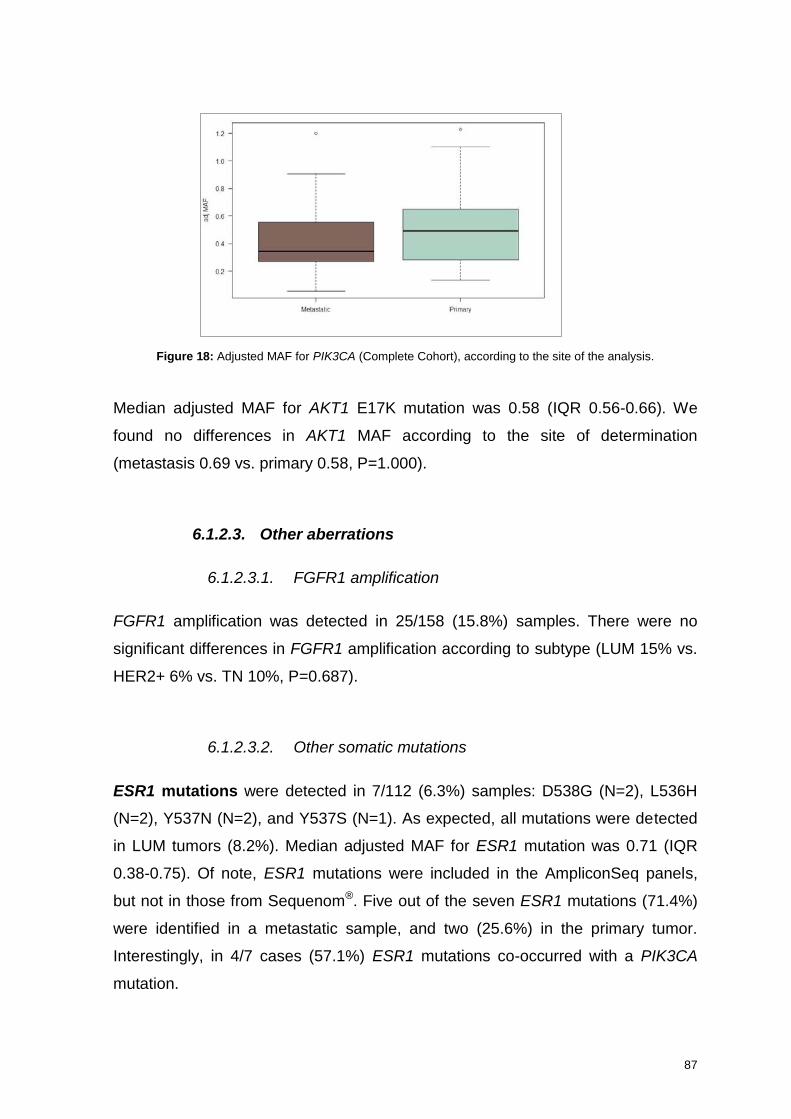
87
Figure 18: Adjusted MAF for PIK3CA (Complete Cohort), according to the site of the analysis.
Median adjusted MAF for AKT1 E17K mutation was 0.58 (IQR 0.56-0.66). We
found no differences in AKT1 MAF according to the site of determination
(metastasis 0.69 vs. primary 0.58, P=1.000).
6.1.2.3. Other aberrations
6.1.2.3.1. FGFR1 amplification
FGFR1 amplification was detected in 25/158 (15.8%) samples. There were no
significant differences in FGFR1 amplification according to subtype (LUM 15% vs.
HER2+ 6% vs. TN 10%, P=0.687).
6.1.2.3.2. Other somatic mutations
ESR1 mutations were detected in 7/112 (6.3%) samples: D538G (N=2), L536H
(N=2), Y537N (N=2), and Y537S (N=1). As expected, all mutations were detected
in LUM tumors (8.2%). Median adjusted MAF for ESR1 mutation was 0.71 (IQR
0.38-0.75). Of note, ESR1 mutations were included in the AmpliconSeq panels,
but not in those from Sequenom®. Five out of the seven ESR1 mutations (71.4%)
were identified in a metastatic sample, and two (25.6%) in the primary tumor.
Interestingly, in 4/7 cases (57.1%) ESR1 mutations co-occurred with a PIK3CA
mutation.
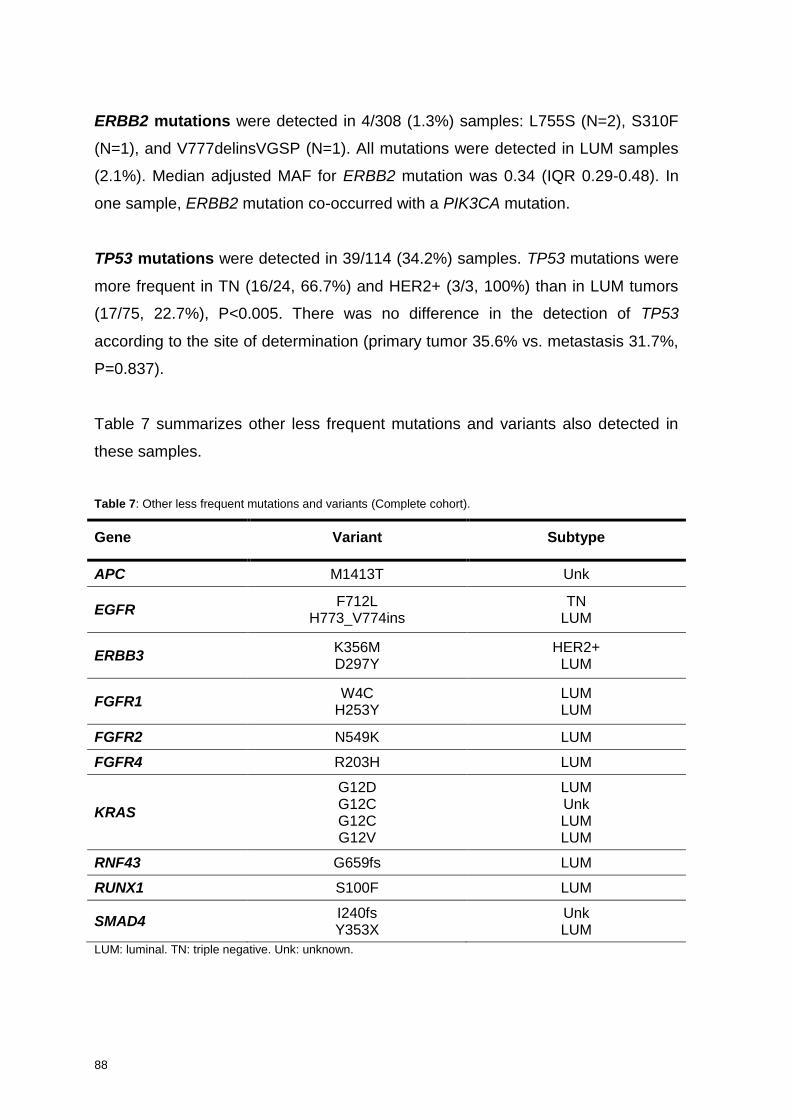
88
ERBB2 mutations were detected in 4/308 (1.3%) samples: L755S (N=2), S310F
(N=1), and V777delinsVGSP (N=1). All mutations were detected in LUM samples
(2.1%). Median adjusted MAF for ERBB2 mutation was 0.34 (IQR 0.29-0.48). In
one sample, ERBB2 mutation co-occurred with a PIK3CA mutation.
TP53 mutations were detected in 39/114 (34.2%) samples. TP53 mutations were
more frequent in TN (16/24, 66.7%) and HER2+ (3/3, 100%) than in LUM tumors
(17/75, 22.7%), P<0.005. There was no difference in the detection of TP53
according to the site of determination (primary tumor 35.6% vs. metastasis 31.7%,
P=0.837).
Table 7 summarizes other less frequent mutations and variants also detected in
these samples.
Table 7: Other less frequent mutations and variants (Complete cohort).
Gene
Variant
Subtype
APC M1413T Unk
EGFR F712L
H773_V774ins TN
LUM
ERBB3 K356M D297Y
HER2+ LUM
FGFR1 W4C
H253Y LUM LUM
FGFR2 N549K LUM
FGFR4 R203H LUM
KRAS
G12D G12C G12C G12V
LUM Unk LUM LUM
RNF43 G659fs LUM
RUNX1 S100F LUM
SMAD4 I240fs Y353X
Unk LUM
LUM: luminal. TN: triple negative. Unk: unknown.
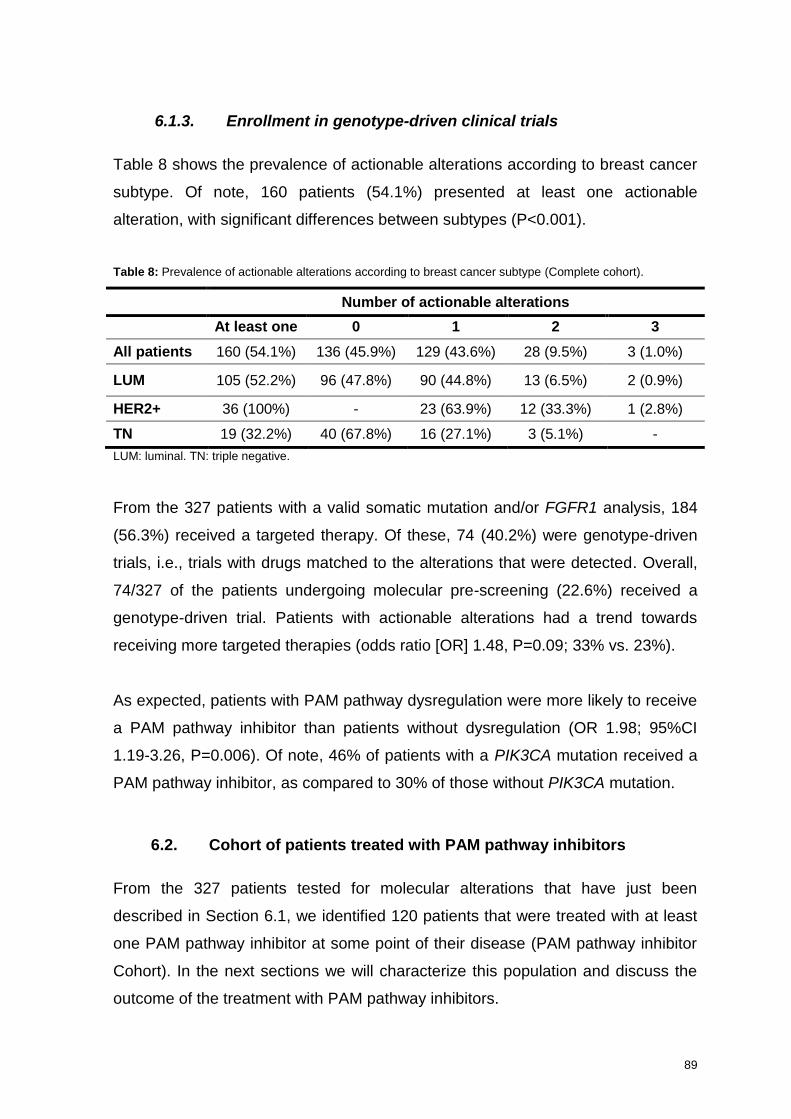
89
6.1.3. Enrollment in genotype-driven clinical trials
Table 8 shows the prevalence of actionable alterations according to breast cancer
subtype. Of note, 160 patients (54.1%) presented at least one actionable
alteration, with significant differences between subtypes (P<0.001).
Table 8: Prevalence of actionable alterations according to breast cancer subtype (Complete cohort).
Number of actionable alterations
At least one 0 1 2 3
All patients 160 (54.1%) 136 (45.9%) 129 (43.6%) 28 (9.5%) 3 (1.0%)
LUM 105 (52.2%) 96 (47.8%) 90 (44.8%) 13 (6.5%) 2 (0.9%)
HER2+ 36 (100%) - 23 (63.9%) 12 (33.3%) 1 (2.8%)
TN 19 (32.2%) 40 (67.8%) 16 (27.1%) 3 (5.1%) -
LUM: luminal. TN: triple negative.
From the 327 patients with a valid somatic mutation and/or FGFR1 analysis, 184
(56.3%) received a targeted therapy. Of these, 74 (40.2%) were genotype-driven
trials, i.e., trials with drugs matched to the alterations that were detected. Overall,
74/327 of the patients undergoing molecular pre-screening (22.6%) received a
genotype-driven trial. Patients with actionable alterations had a trend towards
receiving more targeted therapies (odds ratio [OR] 1.48, P=0.09; 33% vs. 23%).
As expected, patients with PAM pathway dysregulation were more likely to receive
a PAM pathway inhibitor than patients without dysregulation (OR 1.98; 95%CI
1.19-3.26, P=0.006). Of note, 46% of patients with a PIK3CA mutation received a
PAM pathway inhibitor, as compared to 30% of those without PIK3CA mutation.
6.2. Cohort of patients treated with PAM pathway inhibitors
From the 327 patients tested for molecular alterations that have just been
described in Section 6.1, we identified 120 patients that were treated with at least
one PAM pathway inhibitor at some point of their disease (PAM pathway inhibitor
Cohort). In the next sections we will characterize this population and discuss the
outcome of the treatment with PAM pathway inhibitors.
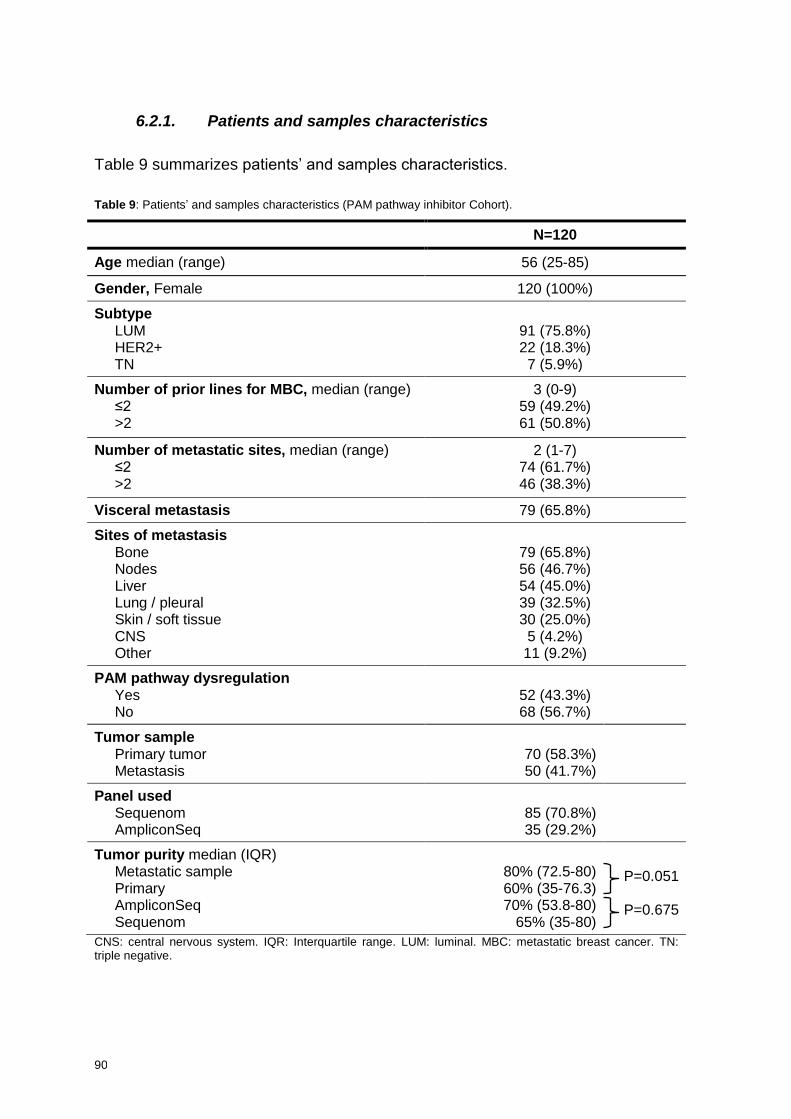
90
6.2.1. Patients and samples characteristics
Table 9 summarizes patients’ and samples characteristics.
Table 9: Patients’ and samples characteristics (PAM pathway inhibitor Cohort).
N=120
Age median (range) 56 (25-85)
Gender, Female 120 (100%)
Subtype LUM HER2+ TN
91 (75.8%) 22 (18.3%) 7 (5.9%)
Number of prior lines for MBC, median (range) ≤2 >2
3 (0-9) 59 (49.2%) 61 (50.8%)
Number of metastatic sites, median (range) ≤2 >2
2 (1-7) 74 (61.7%) 46 (38.3%)
Visceral metastasis 79 (65.8%)
Sites of metastasis Bone Nodes Liver Lung / pleural Skin / soft tissue CNS Other
79 (65.8%) 56 (46.7%) 54 (45.0%) 39 (32.5%) 30 (25.0%) 5 (4.2%) 11 (9.2%)
PAM pathway dysregulation Yes No
52 (43.3%) 68 (56.7%)
Tumor sample Primary tumor Metastasis
70 (58.3%) 50 (41.7%)
Panel used Sequenom AmpliconSeq
85 (70.8%) 35 (29.2%)
Tumor purity median (IQR) Metastatic sample Primary AmpliconSeq Sequenom
80% (72.5-80) 60% (35-76.3) 70% (53.8-80)
65% (35-80)
P=0.051
P=0.675
CNS: central nervous system. IQR: Interquartile range. LUM: luminal. MBC: metastatic breast cancer. TN: triple negative.
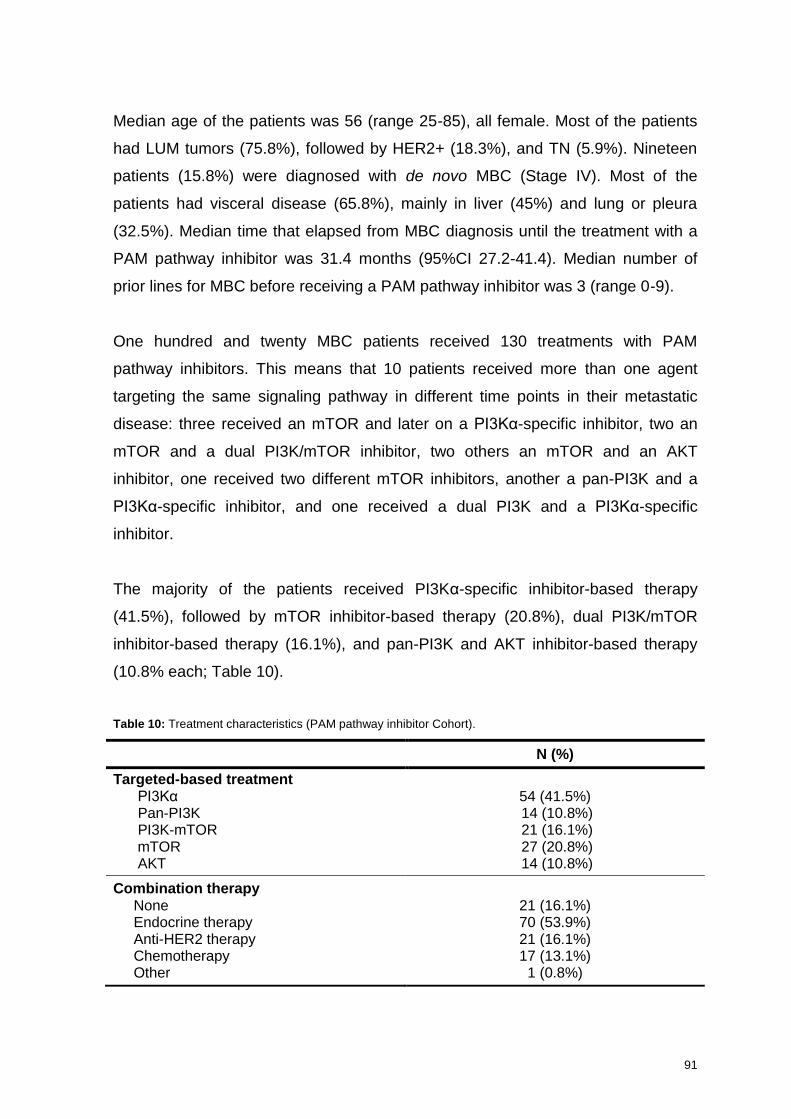
91
Median age of the patients was 56 (range 25-85), all female. Most of the patients
had LUM tumors (75.8%), followed by HER2+ (18.3%), and TN (5.9%). Nineteen
patients (15.8%) were diagnosed with de novo MBC (Stage IV). Most of the
patients had visceral disease (65.8%), mainly in liver (45%) and lung or pleura
(32.5%). Median time that elapsed from MBC diagnosis until the treatment with a
PAM pathway inhibitor was 31.4 months (95%CI 27.2-41.4). Median number of
prior lines for MBC before receiving a PAM pathway inhibitor was 3 (range 0-9).
One hundred and twenty MBC patients received 130 treatments with PAM
pathway inhibitors. This means that 10 patients received more than one agent
targeting the same signaling pathway in different time points in their metastatic
disease: three received an mTOR and later on a PI3Kα-specific inhibitor, two an
mTOR and a dual PI3K/mTOR inhibitor, two others an mTOR and an AKT
inhibitor, one received two different mTOR inhibitors, another a pan-PI3K and a
PI3Kα-specific inhibitor, and one received a dual PI3K and a PI3Kα-specific
inhibitor.
The majority of the patients received PI3Kα-specific inhibitor-based therapy
(41.5%), followed by mTOR inhibitor-based therapy (20.8%), dual PI3K/mTOR
inhibitor-based therapy (16.1%), and pan-PI3K and AKT inhibitor-based therapy
(10.8% each; Table 10).
Table 10: Treatment characteristics (PAM pathway inhibitor Cohort).
N (%)
Targeted-based treatment PI3Kα Pan-PI3K PI3K-mTOR mTOR AKT
54 (41.5%) 14 (10.8%) 21 (16.1%) 27 (20.8%) 14 (10.8%)
Combination therapy None Endocrine therapy Anti-HER2 therapy Chemotherapy Other
21 (16.1%) 70 (53.9%) 21 (16.1%) 17 (13.1%) 1 (0.8%)
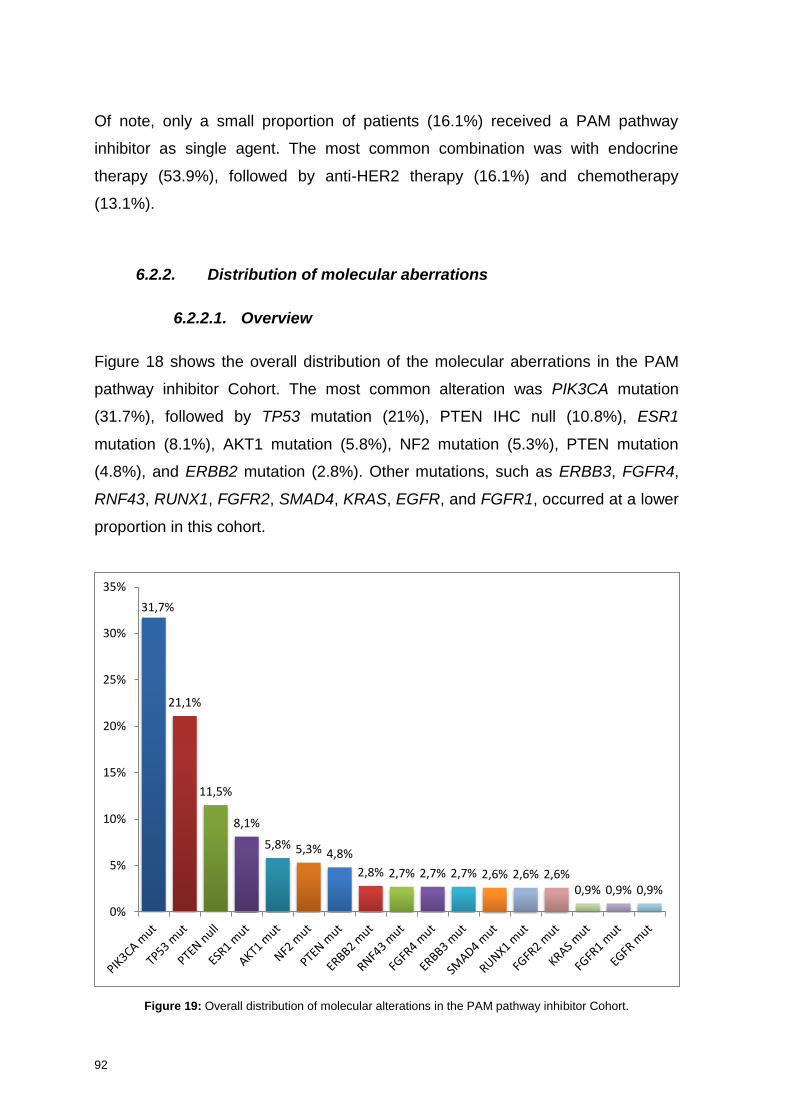
92
Of note, only a small proportion of patients (16.1%) received a PAM pathway
inhibitor as single agent. The most common combination was with endocrine
therapy (53.9%), followed by anti-HER2 therapy (16.1%) and chemotherapy
(13.1%).
6.2.2. Distribution of molecular aberrations
6.2.2.1. Overview
Figure 18 shows the overall distribution of the molecular aberrations in the PAM
pathway inhibitor Cohort. The most common alteration was PIK3CA mutation
(31.7%), followed by TP53 mutation (21%), PTEN IHC null (10.8%), ESR1
mutation (8.1%), AKT1 mutation (5.8%), NF2 mutation (5.3%), PTEN mutation
(4.8%), and ERBB2 mutation (2.8%). Other mutations, such as ERBB3, FGFR4,
RNF43, RUNX1, FGFR2, SMAD4, KRAS, EGFR, and FGFR1, occurred at a lower
proportion in this cohort.
Figure 19: Overall distribution of molecular alterations in the PAM pathway inhibitor Cohort.
31,7%
21,1%
11,5%
8,1%
5,8% 5,3% 4,8%
2,8% 2,7% 2,7% 2,7% 2,6% 2,6% 2,6% 0,9% 0,9% 0,9%
0%
5%
10%
15%
20%
25%
30%
35%
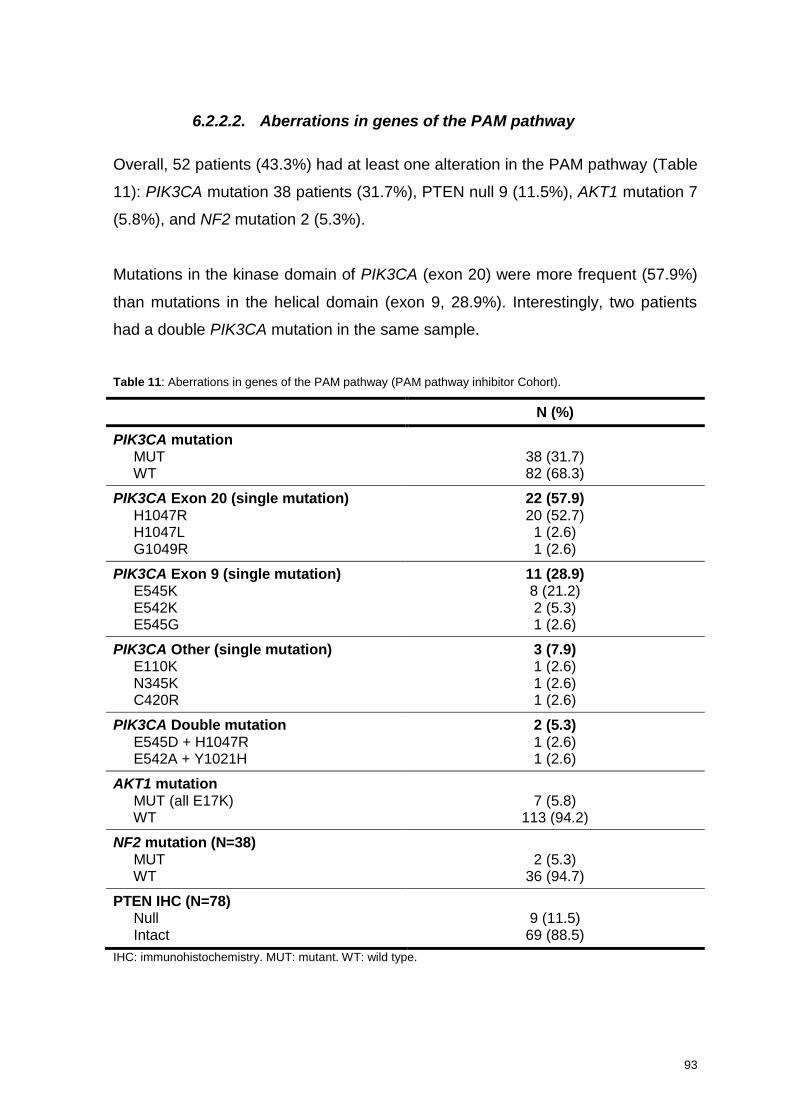
93
6.2.2.2. Aberrations in genes of the PAM pathway
Overall, 52 patients (43.3%) had at least one alteration in the PAM pathway (Table
11): PIK3CA mutation 38 patients (31.7%), PTEN null 9 (11.5%), AKT1 mutation 7
(5.8%), and NF2 mutation 2 (5.3%).
Mutations in the kinase domain of PIK3CA (exon 20) were more frequent (57.9%)
than mutations in the helical domain (exon 9, 28.9%). Interestingly, two patients
had a double PIK3CA mutation in the same sample.
Table 11: Aberrations in genes of the PAM pathway (PAM pathway inhibitor Cohort).
N (%)
PIK3CA mutation MUT WT
38 (31.7) 82 (68.3)
PIK3CA Exon 20 (single mutation) H1047R H1047L G1049R
22 (57.9) 20 (52.7) 1 (2.6) 1 (2.6)
PIK3CA Exon 9 (single mutation) E545K E542K E545G
11 (28.9) 8 (21.2) 2 (5.3) 1 (2.6)
PIK3CA Other (single mutation) E110K N345K C420R
3 (7.9) 1 (2.6) 1 (2.6) 1 (2.6)
PIK3CA Double mutation E545D + H1047R E542A + Y1021H
2 (5.3) 1 (2.6) 1 (2.6)
AKT1 mutation MUT (all E17K) WT
7 (5.8)
113 (94.2)
NF2 mutation (N=38) MUT WT
2 (5.3)
36 (94.7)
PTEN IHC (N=78) Null Intact
9 (11.5)
69 (88.5)
IHC: immunohistochemistry. MUT: mutant. WT: wild type.
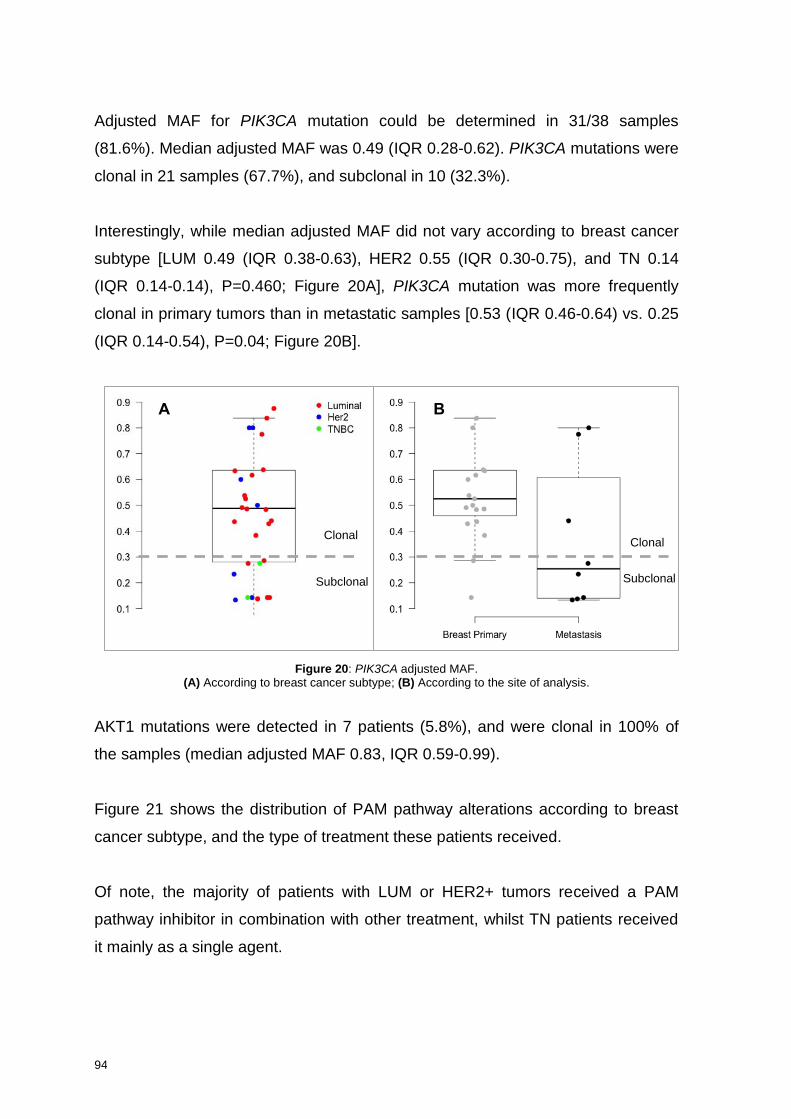
94
Adjusted MAF for PIK3CA mutation could be determined in 31/38 samples
(81.6%). Median adjusted MAF was 0.49 (IQR 0.28-0.62). PIK3CA mutations were
clonal in 21 samples (67.7%), and subclonal in 10 (32.3%).
Interestingly, while median adjusted MAF did not vary according to breast cancer
subtype [LUM 0.49 (IQR 0.38-0.63), HER2 0.55 (IQR 0.30-0.75), and TN 0.14
(IQR 0.14-0.14), P=0.460; Figure 20A], PIK3CA mutation was more frequently
clonal in primary tumors than in metastatic samples [0.53 (IQR 0.46-0.64) vs. 0.25
(IQR 0.14-0.54), P=0.04; Figure 20B].
Figure 20: PIK3CA adjusted MAF. (A) According to breast cancer subtype; (B) According to the site of analysis.
AKT1 mutations were detected in 7 patients (5.8%), and were clonal in 100% of
the samples (median adjusted MAF 0.83, IQR 0.59-0.99).
Figure 21 shows the distribution of PAM pathway alterations according to breast
cancer subtype, and the type of treatment these patients received.
Of note, the majority of patients with LUM or HER2+ tumors received a PAM
pathway inhibitor in combination with other treatment, whilst TN patients received
it mainly as a single agent.
Clonal
Subclonal
Clonal
Subclonal
A B
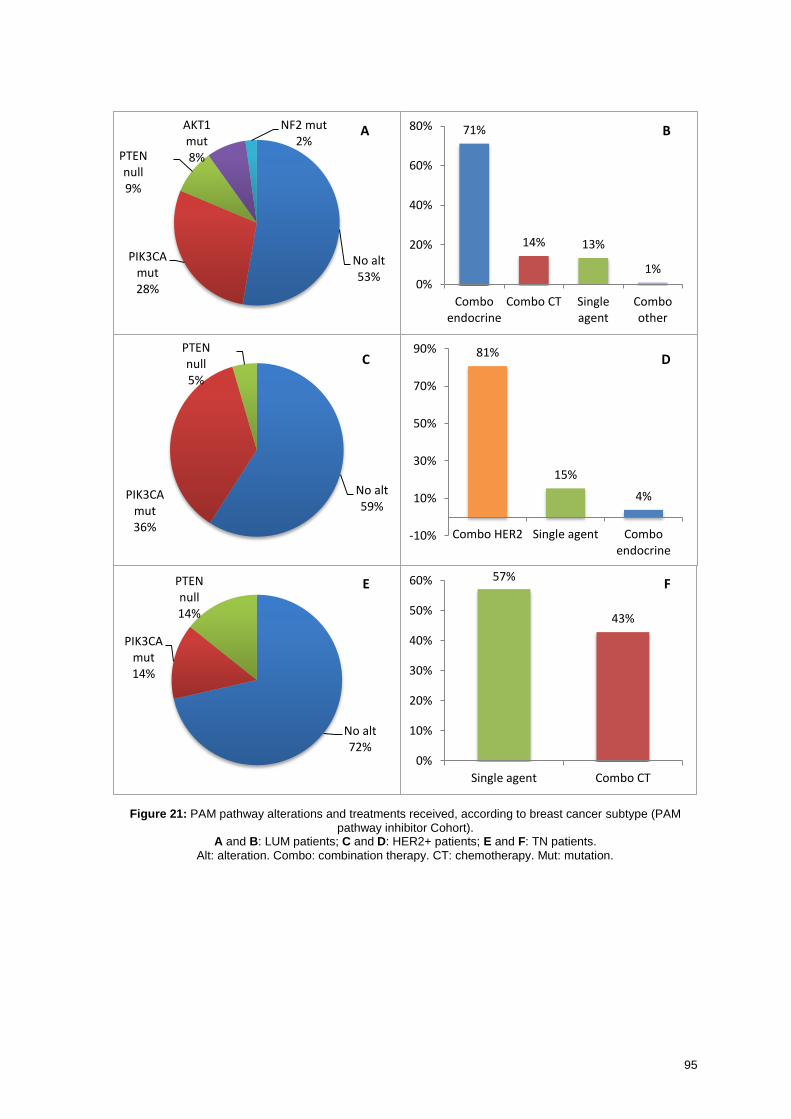
95
Figure 21: PAM pathway alterations and treatments received, according to breast cancer subtype (PAM
pathway inhibitor Cohort). A and B: LUM patients; C and D: HER2+ patients; E and F: TN patients.
Alt: alteration. Combo: combination therapy. CT: chemotherapy. Mut: mutation.
71%
14% 13%
1% 0%
20%
40%
60%
80%
Comboendocrine
Combo CT Singleagent
Comboother
81%
15%
4%
-10%
10%
30%
50%
70%
90%
Combo HER2 Single agent Comboendocrine
57%
43%
0%
10%
20%
30%
40%
50%
60%
Single agent Combo CT
No alt 53%
PIK3CA mut 28%
PTEN null 9%
AKT1 mut 8%
NF2 mut 2%
No alt 59%
PIK3CA mut 36%
PTEN null 5%
No alt 72%
PIK3CA mut 14%
PTEN null 14%
A B
C D
E F
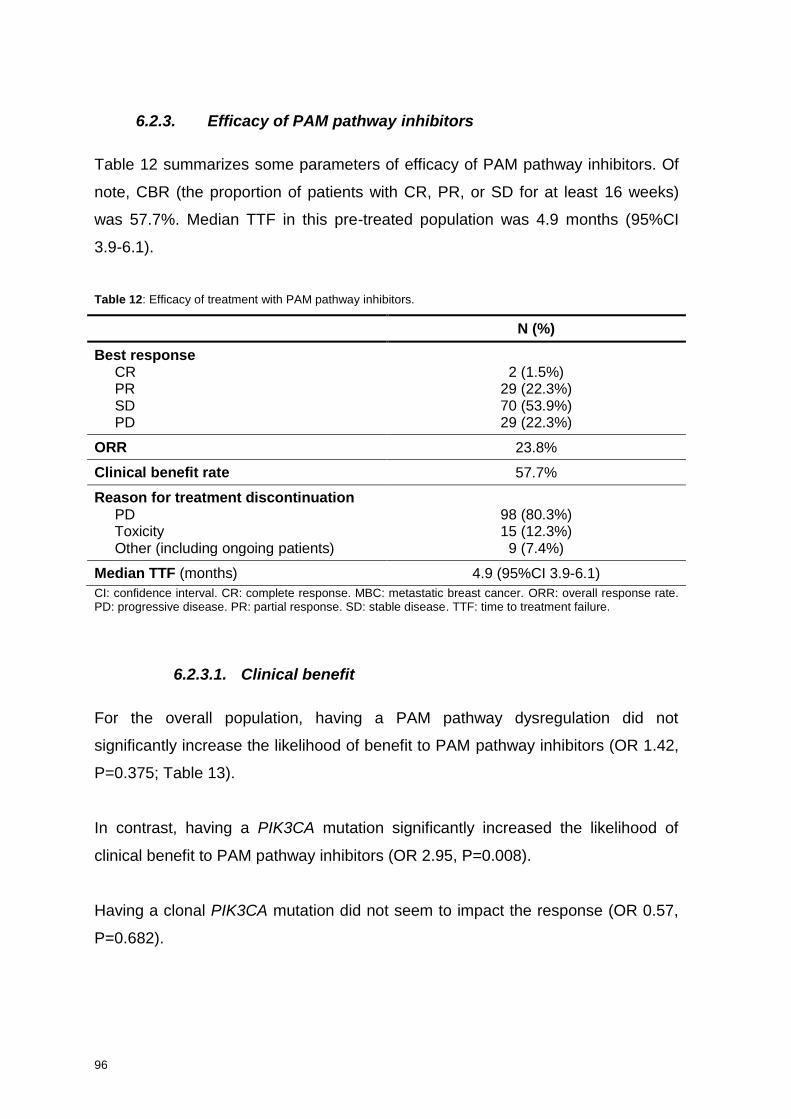
96
6.2.3. Efficacy of PAM pathway inhibitors
Table 12 summarizes some parameters of efficacy of PAM pathway inhibitors. Of
note, CBR (the proportion of patients with CR, PR, or SD for at least 16 weeks)
was 57.7%. Median TTF in this pre-treated population was 4.9 months (95%CI
3.9-6.1).
Table 12: Efficacy of treatment with PAM pathway inhibitors.
N (%)
Best response CR PR SD PD
2 (1.5%)
29 (22.3%) 70 (53.9%) 29 (22.3%)
ORR 23.8%
Clinical benefit rate 57.7%
Reason for treatment discontinuation PD Toxicity Other (including ongoing patients)
98 (80.3%) 15 (12.3%) 9 (7.4%)
Median TTF (months) 4.9 (95%CI 3.9-6.1)
CI: confidence interval. CR: complete response. MBC: metastatic breast cancer. ORR: overall response rate. PD: progressive disease. PR: partial response. SD: stable disease. TTF: time to treatment failure.
6.2.3.1. Clinical benefit
For the overall population, having a PAM pathway dysregulation did not
significantly increase the likelihood of benefit to PAM pathway inhibitors (OR 1.42,
P=0.375; Table 13).
In contrast, having a PIK3CA mutation significantly increased the likelihood of
clinical benefit to PAM pathway inhibitors (OR 2.95, P=0.008).
Having a clonal PIK3CA mutation did not seem to impact the response (OR 0.57,
P=0.682).
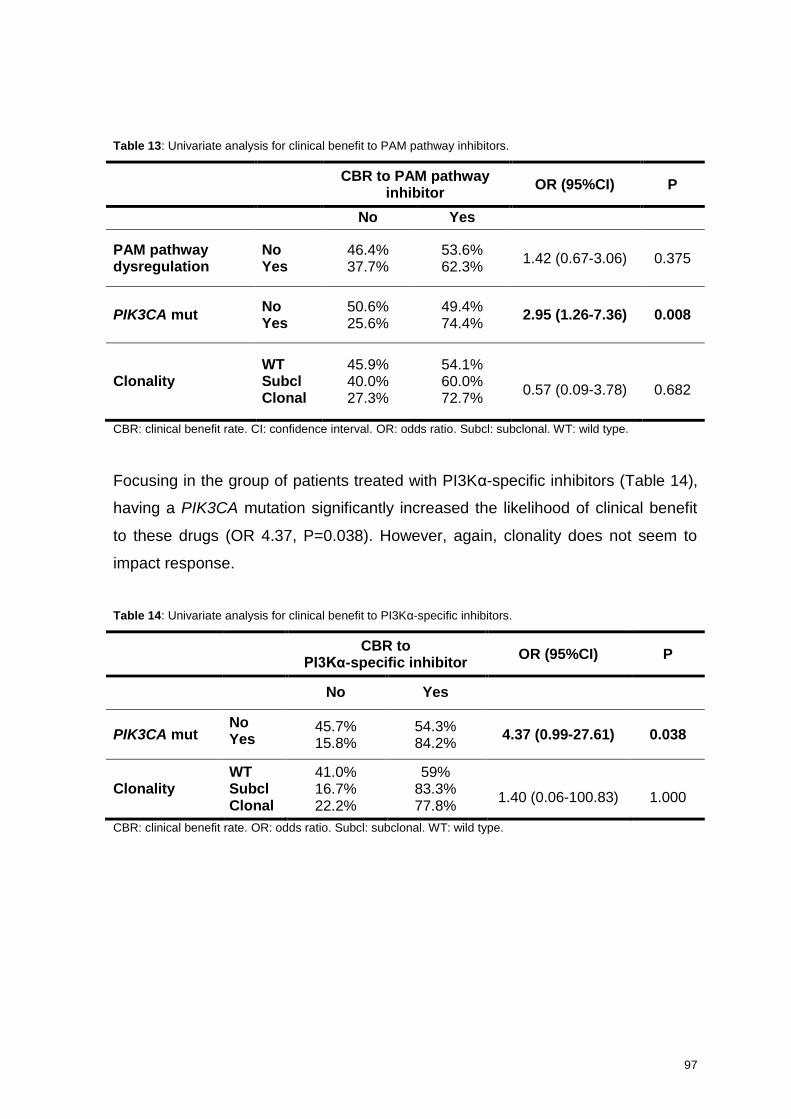
97
Table 13: Univariate analysis for clinical benefit to PAM pathway inhibitors.
CBR to PAM pathway
inhibitor OR (95%CI) P
No Yes
PAM pathway dysregulation
No Yes
46.4% 37.7%
53.6% 62.3%
1.42 (0.67-3.06) 0.375
PIK3CA mut No Yes
50.6% 25.6%
49.4% 74.4%
2.95 (1.26-7.36) 0.008
Clonality WT Subcl Clonal
45.9% 40.0% 27.3%
54.1% 60.0% 72.7%
0.57 (0.09-3.78)
0.682
CBR: clinical benefit rate. CI: confidence interval. OR: odds ratio. Subcl: subclonal. WT: wild type.
Focusing in the group of patients treated with PI3Kα-specific inhibitors (Table 14),
having a PIK3CA mutation significantly increased the likelihood of clinical benefit
to these drugs (OR 4.37, P=0.038). However, again, clonality does not seem to
impact response.
Table 14: Univariate analysis for clinical benefit to PI3Kα-specific inhibitors.
CBR to
PI3Kα-specific inhibitor OR (95%CI) P
No Yes
PIK3CA mut No Yes
45.7% 15.8%
54.3% 84.2%
4.37 (0.99-27.61) 0.038
Clonality WT Subcl Clonal
41.0% 16.7% 22.2%
59% 83.3% 77.8%
1.40 (0.06-100.83)
1.000
CBR: clinical benefit rate. OR: odds ratio. Subcl: subclonal. WT: wild type.
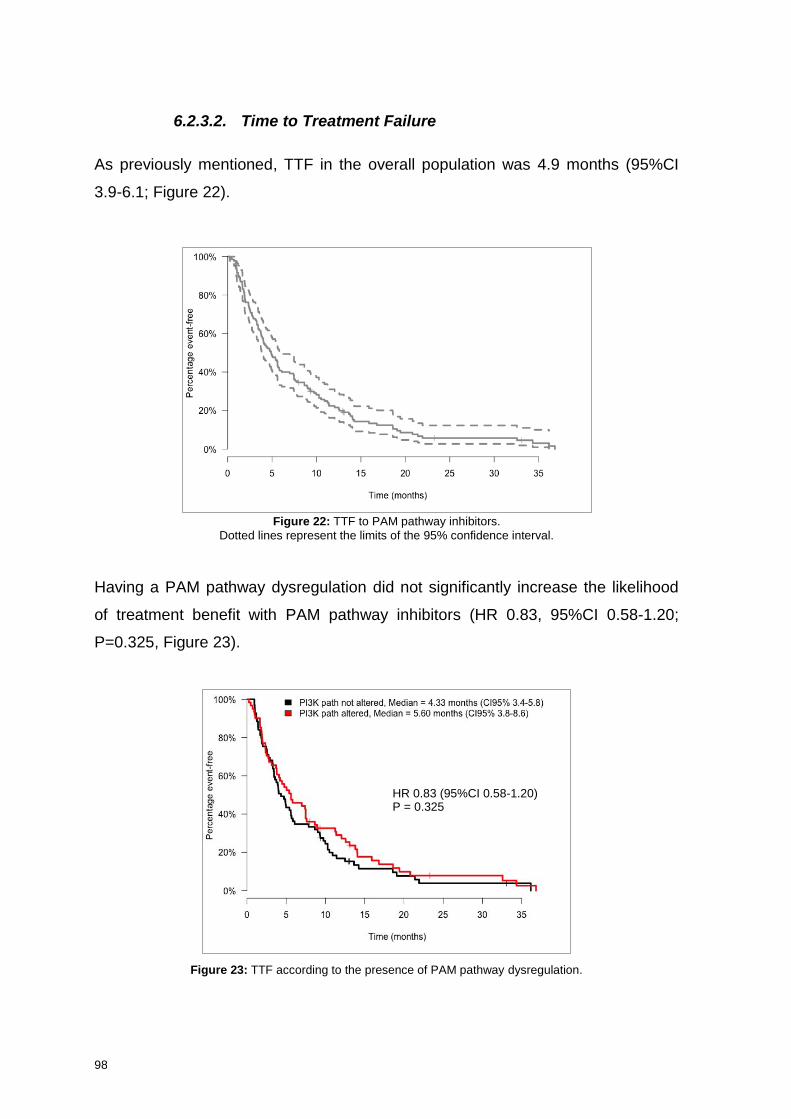
98
6.2.3.2. Time to Treatment Failure
As previously mentioned, TTF in the overall population was 4.9 months (95%CI
3.9-6.1; Figure 22).
Figure 22: TTF to PAM pathway inhibitors.
Dotted lines represent the limits of the 95% confidence interval.
Having a PAM pathway dysregulation did not significantly increase the likelihood
of treatment benefit with PAM pathway inhibitors (HR 0.83, 95%CI 0.58-1.20;
P=0.325, Figure 23).
Figure 23: TTF according to the presence of PAM pathway dysregulation.
HR 0.83 (95%CI 0.58-1.20) P = 0.325
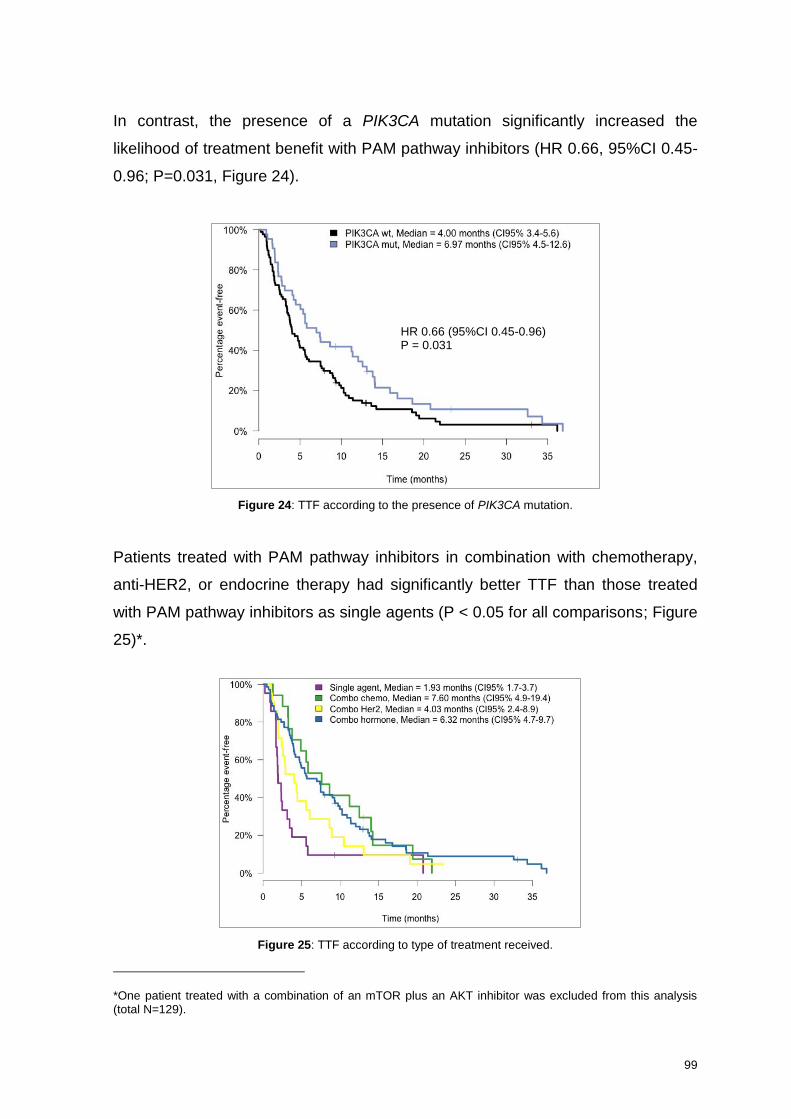
99
In contrast, the presence of a PIK3CA mutation significantly increased the
likelihood of treatment benefit with PAM pathway inhibitors (HR 0.66, 95%CI 0.45-
0.96; P=0.031, Figure 24).
Figure 24: TTF according to the presence of PIK3CA mutation.
Patients treated with PAM pathway inhibitors in combination with chemotherapy,
anti-HER2, or endocrine therapy had significantly better TTF than those treated
with PAM pathway inhibitors as single agents (P < 0.05 for all comparisons; Figure
25)*.
Figure 25: TTF according to type of treatment received.
*One patient treated with a combination of an mTOR plus an AKT inhibitor was excluded from this analysis (total N=129).
HR 0.66 (95%CI 0.45-0.96) P = 0.031
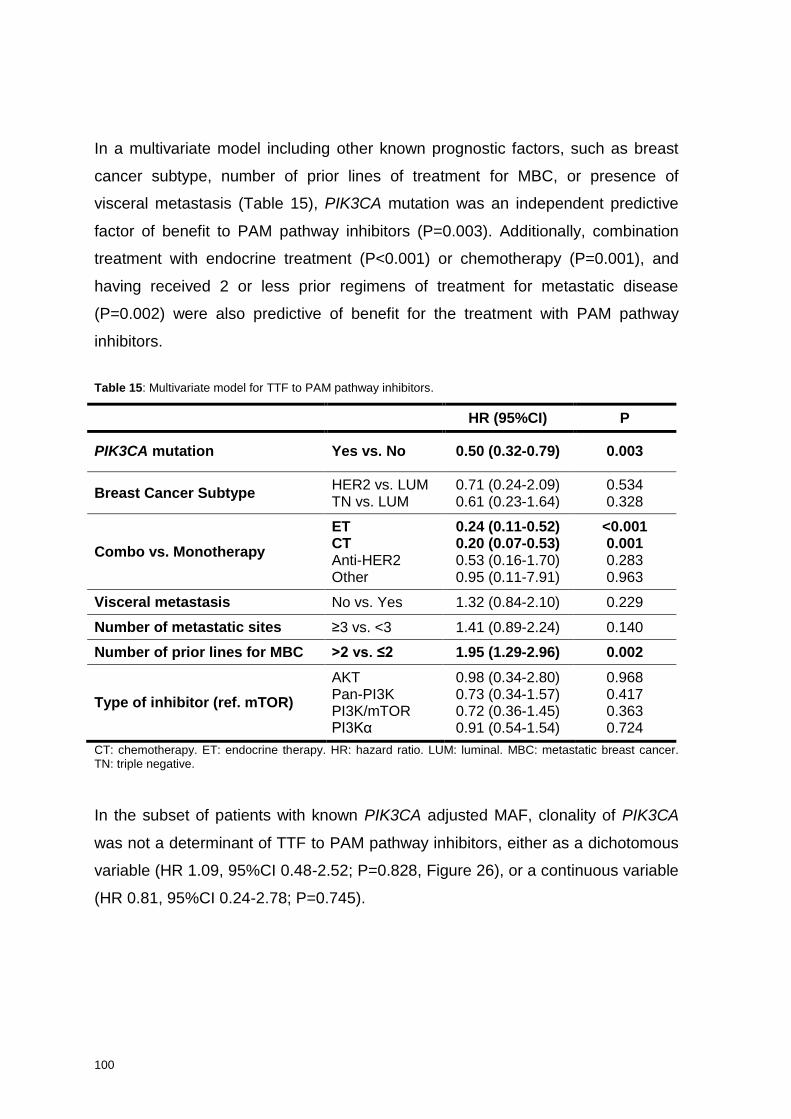
100
In a multivariate model including other known prognostic factors, such as breast
cancer subtype, number of prior lines of treatment for MBC, or presence of
visceral metastasis (Table 15), PIK3CA mutation was an independent predictive
factor of benefit to PAM pathway inhibitors (P=0.003). Additionally, combination
treatment with endocrine treatment (P<0.001) or chemotherapy (P=0.001), and
having received 2 or less prior regimens of treatment for metastatic disease
(P=0.002) were also predictive of benefit for the treatment with PAM pathway
inhibitors.
Table 15: Multivariate model for TTF to PAM pathway inhibitors.
HR (95%CI) P
PIK3CA mutation Yes vs. No 0.50 (0.32-0.79) 0.003
Breast Cancer Subtype HER2 vs. LUM TN vs. LUM
0.71 (0.24-2.09) 0.61 (0.23-1.64)
0.534 0.328
Combo vs. Monotherapy
ET CT Anti-HER2 Other
0.24 (0.11-0.52) 0.20 (0.07-0.53) 0.53 (0.16-1.70) 0.95 (0.11-7.91)
<0.001 0.001 0.283 0.963
Visceral metastasis No vs. Yes 1.32 (0.84-2.10) 0.229
Number of metastatic sites ≥3 vs. <3 1.41 (0.89-2.24) 0.140
Number of prior lines for MBC >2 vs. ≤2 1.95 (1.29-2.96) 0.002
Type of inhibitor (ref. mTOR)
AKT Pan-PI3K PI3K/mTOR PI3Kα
0.98 (0.34-2.80) 0.73 (0.34-1.57) 0.72 (0.36-1.45) 0.91 (0.54-1.54)
0.968 0.417 0.363 0.724
CT: chemotherapy. ET: endocrine therapy. HR: hazard ratio. LUM: luminal. MBC: metastatic breast cancer. TN: triple negative.
In the subset of patients with known PIK3CA adjusted MAF, clonality of PIK3CA
was not a determinant of TTF to PAM pathway inhibitors, either as a dichotomous
variable (HR 1.09, 95%CI 0.48-2.52; P=0.828, Figure 26), or a continuous variable
(HR 0.81, 95%CI 0.24-2.78; P=0.745).
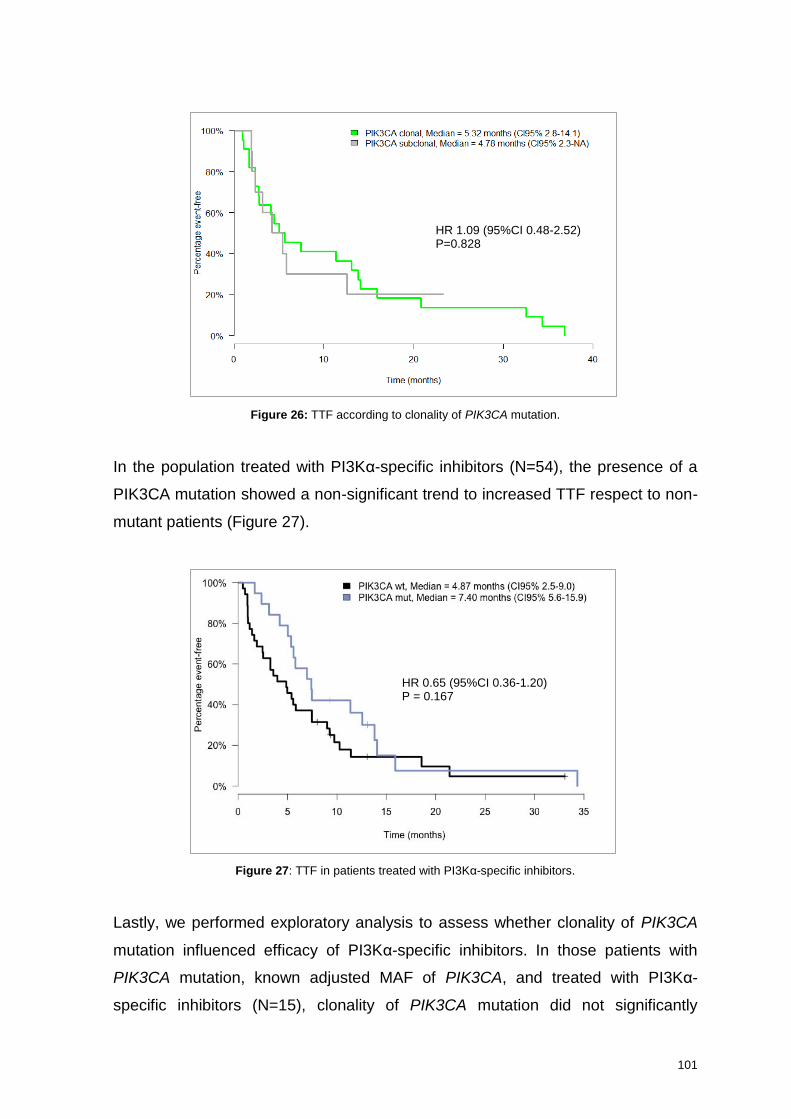
101
Figure 26: TTF according to clonality of PIK3CA mutation.
In the population treated with PI3Kα-specific inhibitors (N=54), the presence of a
PIK3CA mutation showed a non-significant trend to increased TTF respect to non-
mutant patients (Figure 27).
Figure 27: TTF in patients treated with PI3Kα-specific inhibitors.
Lastly, we performed exploratory analysis to assess whether clonality of PIK3CA
mutation influenced efficacy of PI3Kα-specific inhibitors. In those patients with
PIK3CA mutation, known adjusted MAF of PIK3CA, and treated with PI3Kα-
specific inhibitors (N=15), clonality of PIK3CA mutation did not significantly
HR 1.09 (95%CI 0.48-2.52) P=0.828
HR 0.65 (95%CI 0.36-1.20) P = 0.167
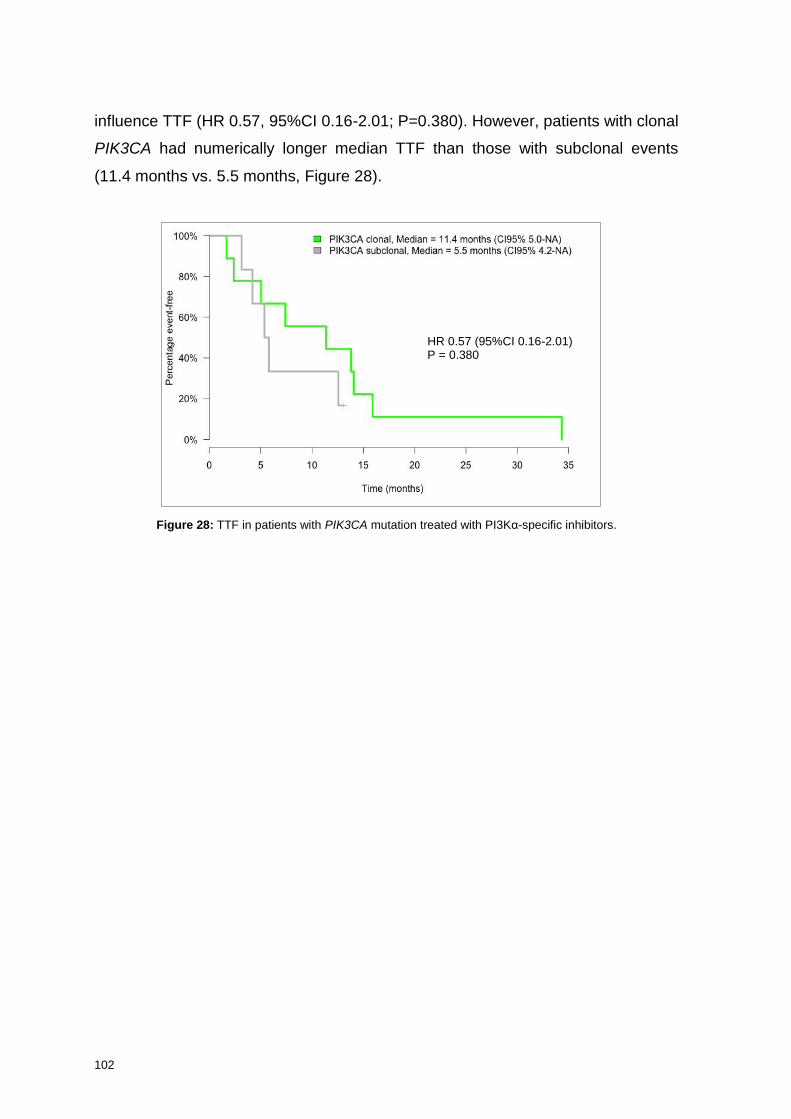
102
influence TTF (HR 0.57, 95%CI 0.16-2.01; P=0.380). However, patients with clonal
PIK3CA had numerically longer median TTF than those with subclonal events
(11.4 months vs. 5.5 months, Figure 28).
Figure 28: TTF in patients with PIK3CA mutation treated with PI3Kα-specific inhibitors.
HR 0.57 (95%CI 0.16-2.01) P = 0.380

7Discussion

103
7. Discussion
Recent advances in molecular biology and sequencing techniques have shed light
on our understanding of breast cancer biology. Besides ER, PgR, and HER2, new
targets for drug intervention have been identified and novel drugs have been
incorporated into our anti-cancer armamentaria. Additionally, the application of
genomics in clinical research and, to some extent, in clinical practice, has made
the concept of precision medicine a reality in many Cancer Centers across the
globe. Our Institution embraced this vision of oncology many years ago, and
routine molecular pre-screening is performed for our MBC patients. The first main
objective of our study was therefore to analyze the results of this genotyping effort.
PAM pathway alterations such as PIK3CA mutation, PTEN dysregulation, and
AKT1 mutations, are among the most frequent molecular alterations in MBC. PAM
pathway inhibitors entered clinical trials more than a decade ago, and a growing
body of evidence suggests that they are useful drugs in the treatment of MBC.
However, knowledge regarding biomarkers of response (and resistance) to these
agents, as well as the clinical contexts in which they would be most useful in, is
incomplete. Since we have participated in the development of several PAM
pathway inhibitors from the very outset, the second main objective of our study
was to assess predictive factors of efficacy to these agents in MBC patients
treated at our Institution.
One pioneering aspect of our study is the analysis of clonality of PIK3CA and
AKT1 mutations in a clinical setting. To the best of our knowledge, this has not yet
been described in breast cancer outside a purely research environment. We also
study whether PIK3CA clonality is a predictor of efficacy to PI3Kα-specific
inhibitors.
Since this is a retrospective study results must be interpreted with caution: it is
difficult to completely control selection biases, data collection biases, and biases
related to missing clinical information in patients’ medical records. Some factors,
however, may have mitigated these issues. First, we collected the genomic data
104
directly from our Institution’s genomic database, where all the molecular
information is prospectively registered. Second, patients included in the PAM
pathway inhibitor population were treated in the context of a clinical trial, and for
this reason, medical records are generally more accurate and complete than those
from patients treated within routine care. Lastly, all medical records were re-
checked for accuracy on clinical information and on the response to PAM pathway
inhibitors.
7.1. Molecular alterations in MBC patients
We present the molecular characterization of 327 MBC patients screened in our
Unit from January 2010 to December 2015. This sample size is comparable to
some of the clinical series published in the literature, although some of the studies
have more patients and other encompass shorter periods of time. For instance, at
the MD Anderson Cancer Center (MDACC) 2000 patients, including more than
850 MBC patients, were successfully screened over an 18-month period62. At the
Princess Margaret Hospital, 1640 patients underwent successful screening over
the course of 29-months, including 310 MBC patients172. At the Mass General
Hospital (MGH), Juric and colleagues report their 4-year experience of MBC
genotyping, with 347 patients enrolled173. These differences in numbers probably
relate to the strategy of the different Institutions regarding the selection of patients
for molecular screening. At our Institution, we do not perform massive genotyping,
but rather offer tumor genotyping only to those patients that can be potential
candidates for enrollment in our clinical trials. The reason for this is twofold. First, it
allows us to optimize Laboratory and human resources. The second reason
relates to financial constraints – in a public healthcare system environment it is
difficult to obtain funding to perform these kinds of studies. This pragmatic
approach, while not optimal for research/discovery, allows us to rationally use
available resources and thus promote sustainability. It is also in line with a recent
consensus panel on personalized medicine, which recognized that molecular
screening programs should not aim to discover new cancer-related genes, but
instead offer first validation steps about their clinical relevance174. As a result of
this strategy, we have a higher patient inclusion rate in genotype matched clinical
105
trials at our Institution when compared to other Hospitals. This will be further
discussed later on.
Most of the patients included in our analysis have LUM tumors (61.5%), followed
by TN (18%), and HER2+ (11%). This distribution is similar to other studies such
as the MDACC experience, where the proportion of LUM, TN, and HER2+ tumors
was 70.4%, 18.3%, and 11.3%, respectively175. Of note, we and others report a
higher proportion of TN tumors with respect to the general population of breast
cancer patients. This probably reflects the search for novel therapeutic targets in
population with a dismal prognosis and limited treatment options.
TP53 mutation was the most frequent mutation in our series (34.2%). Interestingly,
100% of HER2+ samples tested for TP53 had a TP53 mutation, while in TN the
proportion was 66.7%. In the Basal-like subset included in TCGA, this proportion
was 86.0% (Table 16)54. In the MDACC series, 23.8% of patients had a TP53
mutation, especially if TN (58.3%)175. Importantly, TP53 mutations were not
included in the panel that was used with Sequenom® or in the first versions of the
AmpliconSeq panel, and hence the true prevalence of TP53 mutations in our
complete cohort is very likely underestimated. Currently, while there are no
specific drugs targeting this alteration, we are running a trial at our Institution
enrolling patients with WT TP53 (NCT02143635), which was one of the reasons
why TP53 mutation was included in the AmpliconSeq panel.
PIK3CA mutation was the second most frequent alteration in our cohort (24%).
This percentage is similar to other published series (Table 16). In the TCGA
dataset the proportion of PIK3CA mutations is 34.3%54, in the SAFIR01 trial
24.9%63, in the MGH series 23.3%173, and in the MDACC cohort 27.1%175.
PIK3CA mutation is more frequent in LUM tumors (especially if LUM A, according
to TCGA), followed by HER2+ and then TN tumors, where it has a frequency of 7-
9%. Of note, the identification of a small subset of TN patients with a targetable
alteration such as PIK3CA mutation may have therapeutic implications. In our
Hospital, some of these TN, PIK3CA mutant, MBC patients were offered treatment
in a basket study with taselisib, a PI3K β-sparing inhibitor (NCT01296555, see
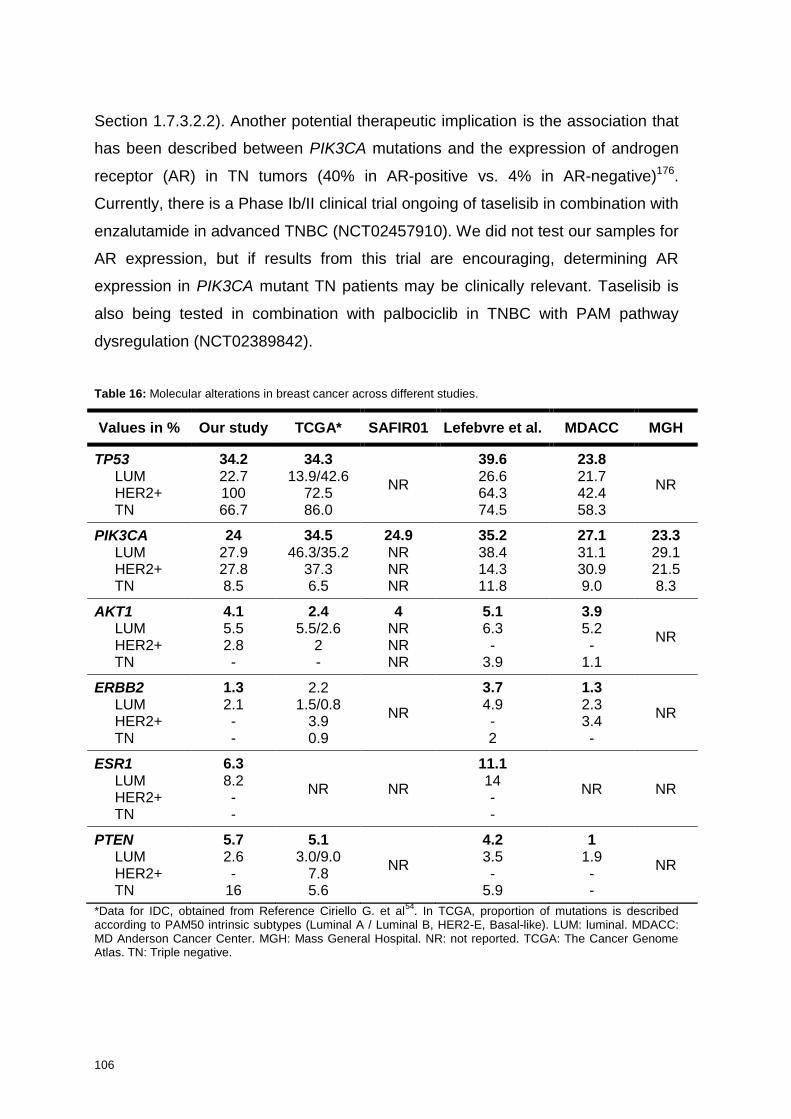
106
Section 1.7.3.2.2). Another potential therapeutic implication is the association that
has been described between PIK3CA mutations and the expression of androgen
receptor (AR) in TN tumors (40% in AR-positive vs. 4% in AR-negative)176.
Currently, there is a Phase Ib/II clinical trial ongoing of taselisib in combination with
enzalutamide in advanced TNBC (NCT02457910). We did not test our samples for
AR expression, but if results from this trial are encouraging, determining AR
expression in PIK3CA mutant TN patients may be clinically relevant. Taselisib is
also being tested in combination with palbociclib in TNBC with PAM pathway
dysregulation (NCT02389842).
Table 16: Molecular alterations in breast cancer across different studies.
Values in % Our study TCGA* SAFIR01 Lefebvre et al. MDACC MGH
TP53 LUM HER2+ TN
34.2 22.7 100 66.7
34.3 13.9/42.6
72.5 86.0
NR
39.6 26.6 64.3 74.5
23.8 21.7 42.4 58.3
NR
PIK3CA LUM HER2+ TN
24 27.9 27.8 8.5
34.5 46.3/35.2
37.3 6.5
24.9 NR NR NR
35.2 38.4 14.3 11.8
27.1 31.1 30.9 9.0
23.3 29.1 21.5 8.3
AKT1 LUM HER2+ TN
4.1 5.5 2.8 -
2.4 5.5/2.6
2 -
4 NR NR NR
5.1 6.3 -
3.9
3.9 5.2 -
1.1
NR
ERBB2 LUM HER2+ TN
1.3 2.1 - -
2.2 1.5/0.8
3.9 0.9
NR
3.7 4.9 - 2
1.3 2.3 3.4 -
NR
ESR1 LUM HER2+ TN
6.3 8.2 - -
NR NR
11.1 14 - -
NR NR
PTEN LUM HER2+ TN
5.7 2.6 -
16
5.1 3.0/9.0
7.8 5.6
NR
4.2 3.5 -
5.9
1 1.9 - -
NR
*Data for IDC, obtained from Reference Ciriello G. et al54
. In TCGA, proportion of mutations is described according to PAM50 intrinsic subtypes (Luminal A / Luminal B, HER2-E, Basal-like). LUM: luminal. MDACC: MD Anderson Cancer Center. MGH: Mass General Hospital. NR: not reported. TCGA: The Cancer Genome Atlas. TN: Triple negative.
107
The frequency of AKT1 mutations was also similar to the literature (Table 16).
Although AKT1-mutant tumors represent a small segment of MBC (around 4-5%,
mainly LUM tumors), detection of this alteration has potential therapeutic impact,
as there is an ongoing basket trial with AZD5363, an ATP-competitive pan-AKT
inhibitor (NCT01226316), for patients with ER+/AKT1 mutant MBC. Preliminary
results suggest that breast tumors with AKT1 mutation have high response rates
with this drug148, and our AKT-mutant patients are offered treatment in this trial.
In LUM tumors, FGFR1 amplification was the second most common actionable
alteration (15%). FGFR signaling plays a crucial role in cancer cell proliferation,
migration, angiogenesis, and survival. The FGF family consists of 18 ligands which
signal through 4 high-affinity receptors177. FGFR signaling may be activated in
breast cancer through FGFR amplification or mutation, or by amplification of FGFR
ligands (located in 11q). FGFR1 amplification is the most common FGFR
alteration in breast cancer, and it associates with worse prognosis and resistance
to endocrine therapy178,179. In our series, the frequency of FGFR1 amplification
was in line with other reported studies. In the biomarker analysis from the
BOLERO-2 trial, for instance, FGFR1 amplification was found in 18.1% of the
samples153. In the SAFIR01 trial, this proportion was 13%63, and in the TCGA 11%
(13% in LUM patients)56. The variation may be due to the type of tissue analyzed,
as well as slightly different definitions of FGFR1 amplification positivity across
trials.
Several drugs targeting FGFR have been developed over recent years. They can
be divided into tyrosine kinase inhibitors (TKI) with dominant pharmacological
activity in other kinases (such as VEGFR, PDGFR, FLT3, RET, KIT, or BCR-ABL),
and selective FGFR inhibitors. The first group includes agents such as dovitinib
and lucitanib, while BGJ398, AZD4547, LY2874455, and JNJ-42756493 are
examples of drugs from the second group. In breast cancer, results from early
clinical trials suggest that selective FGFR inhibitors may not be optimal in treating
FGFR1 amplified tumors, while pan-TKI drugs may prove more efficacious.
Results from trials testing FGFR inhibitors in breast cancer have been
disappointing so far, either because of low efficacy167, or high toxicity rates168.
108
Nonetheless, this is an alteration that – at least for the moment – we keep
prospectively screening in our MBC patients.
Mutations in ESR1, the gene encoding for ERα, have been detected in 6.3% of our
patients, all with LUM tumors. These mutations have been considered very
infrequent in breast cancer for years, probably due to the use of low sensitivity
methods, coupled with analysis focused only in primary tumors. In the METABRIC
study, for instance, no ESR1 mutation was reported81. However, when NGS is
used in the genotyping of metastatic biopsies, the proportion of ESR1 mutations
may rise to up to 20% of the cases180. In our series, we found a proportion of
ESR1 mutations of 6.3%, especially if the determination was done in a metastatic
sample (12.2% vs. 2.8% in the primary). Please refer to Section 7.2 below to
additional discussion of this alteration.
The EGFR/HER2 pathway plays a critical role in the pathogenesis of breast
cancer, especially in HER2+ subtype (10-15% of the total of breast cancer cases).
In these tumors, HER2 (or ERBB2) amplification drives tumorigenesis, and drugs
targeting HER2 have changed the natural history of the disease8,9. It was not until
recently that activating mutations in ERBB2 were identified in MBC patients
lacking ERBB2 gene amplification or overexpression181. ERBB2 mutation occurs in
around 1.5-2.5% of MBC patients181,182. In our cohort, ERBB2 mutation was
detected in 1.3% of the patients (all LUM tumors), which is in line with the
available literature. These patients are not candidates for HER2-targeted drugs
under current standards of treatment, but some reports suggest that they may
benefit from anti-HER2 small molecule inhibitor drugs, such as neratinib181,183. A
basket trial with neratinib is available at our Institution (NCT01953926), and
patients with ERBB2 mutations are offered enrollment in this study.
PTEN is a tumor suppressor gene that encodes a dual specific phosphatase that
dephosphorylates PIP3 to PIP2. Intact PTEN plays a key role in the negative
regulation of the PAM pathway82. PTEN can be downregulated by several
mechanisms including genetic alterations (like mutations or gene deletions),
transcription, translation, and post-translational modification. In our cohort, we
109
analyzed both PTEN expression and PTEN mutations. Loss of PTEN expression
by IHC is probably a sign of impaired PTEN function, leading to the consequent
PAM pathway activation. The best cut-off to measure PTEN dysregulation by IHC
is not well established, but probably the best read-out for loss of PTEN function is
the absence of PTEN staining (PTEN null), and this is the definition we used as a
surrogate for pathway dysregulation. Overall, 10.6% of our patients had PTEN
null, especially if TN (20.5%, compared with 9.3% in LUM and 3.6% in HER2+).
PTEN can also be dysregulated by the presence of inactivating mutations. In our
study, PTEN mutation was present in 5.7% of the samples, with significant
differences between subtypes (LUM 2.6%, HER2+ no PTEN mutation detected,
TN 16%, P=0.047). The overall PTEN mutation rate is similar to the one found in
the study by Lefebvre et al. (4.2%), although no differences were observed in this
study according to breast cancer subtype (LUM 3.5% vs. TN 5.9%). Our results
are however aligned with the findings of Nik-Zeinal et al., who described an
enrichment for PTEN mutations in ER-negative breast tumors55. Importantly, not
all PTEN mutations or alterations are deleterious to PTEN function. It is crucial to
have a good annotating procedure in order to call PTEN variants as pathogenic or
non-pathogenic, with the consequent therapeutic implications. PTEN alterations
that ablate function of the gene – such as point or multi-nucleotide substitutions,
insertions and deletions, rearrangements and loss of part of or the entire gene
locus, coding or non-coding variants – are generally considered to be pathogenic.
Trials with PI3K β-specific inhibitors, such as AZD8186 (NCT01884285), and with
AKT-inhibitors, like AZD5363 (NCT01226316), are enrolling PTEN-mutant TN and
ER+ patients, respectively.
In HER2+ tumors, the most common actionable alteration on top of ERBB2
amplification was PIK3CA mutation, detected in 27.8% of the samples. These
numbers are similar to the reported in the literature. Of note, PIK3CA mutations
confer resistance to some anti-HER2 drugs such as trastuzumab and
lapatinib184,185, but not to others, e.g. T-DM1 or pertuzumab185,186. For this reason,
it is clinically relevant to obtain data regarding the PIK3CA mutation status in a
HER2+ MBC patient. However, for the time being, the presence of a PIK3CA
110
mutation should not per se prevent these patients from receiving any effective anti-
HER2 drug, if otherwise candidates to that treatment.
Actionable alterations in the population of TN patients were infrequent. Indeed, no
actionable alteration could be identified in 65% of these patients, suggesting that
new genomically agnostic treatment strategies, such as immunotherapy187 or the
use of antibody-drug conjugates188, are urgently needed in this bad prognosis
MBC subgroup.
In our study, we have detected a long tail of alterations occurring in less than 2%
of the samples, including EGFR, ERBB3, FGFR1, FGFR2, FGFR3, or KRAS
mutations. These results are in line with several published works63,172,175. This
raises the question whether it will ever be feasible to design clinical trials for these
small segments of MBC, even if they represent potentially actionable alterations.
For instance, frequency of EGFR mutation in our population was 0.6%, which
suggests that the logistics of a specific trial with anti-EGFR drugs in EGFR-mutant
breast cancer are at least challenging. However, EGFR TKIs are active drugs in
lung cancer12, and we may preclude EGFR-mutant MBC patients to receive a
potentially active treatment. Umbrella trials and basket trials are options to
circumvent this issue.
Umbrella trials assess the effect of different drugs in different molecular alterations
within the same tumor type. They typically include a central infrastructure for
screening and identification of patients, and have multiple sub-trials within the
umbrella framework. By continuously gaining insights into the molecular
complexity of the disease and the efficacy of the different arms of the trials, they
have the flexibility to drop-off or add additional arms as needed. Some examples
are the BATTLE trial in lung cancer189, or the SAFIR-02 trial in breast cancer
(NCT02299999).
Basket trials, in turn, test the effect of a single drug on a molecular alteration in a
variety of cancer types190. Intense translational work can be done in basket trials in
order to study mechanisms of resistance to targeted therapies in the different
111
tumor types, with the possibility of subsequently adding new arms of treatment
with novel, more active, combinations. For instance, it was observed that BRAF
V600E inhibition causes a rapid feedback activation of EGFR in BRAF-mutant
CRC, which supports continued proliferation despite treatment191. Based on these
findings, an arm of vemurafenib plus cetuximab for BRAF-mutant CRC was
included in the basket trial recruiting patients with BRAF-mutant tumors. In the
cohort of patients with CRC who received single agent vemurafenib, no responses
were observed. In the cohort of patients with CRC treated with vemurafenib and
cetuximab, one response was observed, and approximately half the patients had
tumor regression192.
We identified 21 samples with two or more molecular alterations. This information
is useful in better guiding treatment decisions. First, it may lead us to consider the
upfront use of combination therapies, if available. For instance, the patient with
PIK3CA plus ERBB2 mutation could potentially benefit from dual PAM pathway
and ERBB2 blockade. Second, it may influence the decision in selecting a given
therapy over another. The patients with ESR1 plus PIK3CA mutation won’t be
good candidates to receive an AI plus a PAM pathway inhibitor, while the
combination of a PAM pathway inhibitor with fulvestrant could be a better option.
Lastly, it may allow us to exclude upfront some treatment options. Based on pre-
clinical as well as some clinical data, the PIK3CA mutant patient with a
concomitant KRAS mutation will probably not respond to a PI3K inhibitor, and we
could spare potential toxicities to a patient that probably will not benefit from the
treatment.
7.2. Genomic alterations in primary tumors and metastasis
Sequencing of EBC has provided insight into the biology of early malignancy, but
only around 20-25% of the patients will ever present with overt metastatic
disease22,23. Furthermore, as a result of tumor clonal evolution, the genetic
landscape of a metastasis from breast cancer is different from the primary193-195.
For this reason, we believe that genotyping a metastatic sample rather than the
primary tumor may be more informative to steer therapeutic decisions and, if
112
feasible, this is our preferred approach. In our cohort, 100 samples (30.6%)
derived from a metastatic site. Generally, these patients undergo a biopsy
specifically to perform molecular pre-screening, or in the context of a clinical trial.
Interestingly, median tumor purity was higher in metastatic samples than in
primary tumor samples (70% vs. 60%, P=0.04). This probably reflects more
stringent criteria for collection of metastatic biopsies in a research environment.
As previously mentioned, we found a higher proportion of ESR1 mutations in
metastatic samples than in primary tumors (12.2% vs. 2.8%, P=0.097), which is in
line with the current literature196. Of note, these samples were not matched, i.e.
coming from the same patient, so the results are merely hypothesis generating.
The proportion of ESR1 mutations appears to increase with successive exposure
to endocrine therapies, especially AIs. Recent studies have reported detection
rates of ESR1 mutations in plasma samples from patients previously treated with
AIs of 26.8-30.6%, suggesting that they arise as a mechanism of resistance to
these therapies197,198. Since this is a heavily pre-treated cohort – with a median of
3 prior lines of treatment for MBC – it is conceivable that most, if not all of our
patients had received an AI as part of their adjuvant or metastatic treatment.
Detection of ESR1 mutation has also been correlated with worse prognosis and
resistance to AIs, but not to fulvestrant. In one study investigating the presence of
ESR1 mutations in ctDNA, the authors found that LUM patients with ESR1
mutations have a substantially shorter PFS on AI-based therapy than those
patients without ESR1 mutations (HR 3.10, 95%CI 1.9-23.1; P=0.004)198.
Additionally, in the SOFEA trial, patients with ESR1 mutations had improved PFS
after taking fulvestrant compared with exemestane (HR 0.52, 95%CI 0.30-0.92;
P=0.02), whereas patients with WT ESR1 had similar PFS after receiving either
treatment (HR 1.07, 95%CI 0.68-1.67; P=0.77)199. This analysis is outside the
scope of our work, but these data reinforce the importance of real-time detection of
ESR1 mutations to optimize the treatment of ER+ MBC, either by the acquisition of
biopsies from metastatic sites prior to initiation of a new therapy, or by the
determination of ESR1 mutation in plasma ctDNA. Of note, detection of ESR1
mutations in ctDNA is currently being incorporated in the prescreening of our MBC
patients.
113
Interestingly, there was also a trend for PIK3CA and ERBB2 mutations to be more
frequent in samples from metastatic sites than in those from primary tumors:
31.1% vs. 21.1% (P=0.068) and 3.3% vs. 0.5% (P=0.081), respectively. This may
suggest that PIK3CA and ERBB2 have a role in the metastatic process and drug
resistance, and hence could be good candidates for drug targeting in the
metastatic setting.
The landscape of MBC has been better characterized in a recent paper from
Lefebvre et al200. In this study, the authors performed whole-exome sequencing
(WES) on 216 metastatic samples from MBC patients who underwent a biopsy in
the context of the SAFIR-0163, SAFIR-02 (NCT02299999), SHIVA201, or the
MOSCATO (NCT01566019) prospective trials. Taking the TCGA dataset as a
reference, the authors found similar frequencies of mutations in LUM MBC as
compared to LUM EBC in some genes, like PIK3CA (37% vs. 40%) or TP53 (27%
vs. 20%). In contrast, LUM MBC had a higher proportion of mutations in other
genes like ESR1 (14% vs. <1%) and RB1 (6.3% vs. 2%). Other genes frequently
mutant in MBC samples were PALB2, TSC1, TSC2, ERBB4, NOTCH3, and ALK.
Interestingly, TSC1 and TSC2 mutations have been described as sensitivity
mutations to mTOR inhibitors, and this finding may also have therapeutic
implications202. The panels we used for our analysis do not include these genes,
and we may have missed these mutations in our population.
7.3. Clonality of PIK3CA and AKT1
Tumors often evolve through a process of branched evolution, involving
genetically distinct subclones203,204. This means that the level of knowledge of a
patient’s genomic alterations at a given time point should not merely be based on
a catalog of cancer genes mutations, but also on the understanding of their spatial
and temporal dynamics during the tumor’s evolution. While it is difficult to
rigorously assess the clonal evolution of a patient’s tumor outside a purely
research-based environment, real-time information about the presence of
dominant somatic events could be therapeutically relevant205.
114
The use of NGS techniques in molecular pre-screening programs allows us to
assess the MAF of a given mutation in a patient’s sample. MAF is the number of
mutant reads divided by the total number of reads – coverage – at the specific
genomic position of interest. It is largely influenced by tumor purity (fraction of
neoplastic cells in the sample) and copy number alterations (gene amplifications
and deletions)165. MAF of driver genes may be used to infer the mutational
timeline, intra-tumor genomic heterogeneity, and dynamic clonal evolution166.
However, this information is seldom reported, despite its potential impact on
response to targeted drugs.
To the best of our knowledge, characterization of MAF of recurrent mutations in
breast cancer within a clinical setting is lacking so far. We therefore proposed to
analyze the clonality of PIK3CA and AKT1 mutations in our MBC cohort, and to
assess whether the clonality of PIK3CA was predictive of response to PAM
pathway inhibitors, namely PI3Kα-specific inhibitors.
In our study, clonality was determined as described in section 5.4. In brief, the
number of mutant alleles in the sample was corrected for tumor purity, resulting in
a value that we called adjusted MAF. We considered an adjusted MAF of >0.3 as
clonal, and subclonal otherwise. In the absence of an established cut-off to define
clonality, the presence of at least 30% mutant alleles was considered biologically
relevant. Given the small numbers, we did not look at other cut-offs, but we did
analyze adjusted MAF as a continuous variable. Of note, we did not consider the
copy number variants of the gene, or the ploidy, to correct the MAF for a given
mutation – in most of the cases this information was not available. As a
consequence, there might be an overestimation of adjusted MAF if a gene
amplification coexisted with a gene mutation. It is unlikely that our results were
altered for this reason, since the percentage of breast cancer samples with both
PIK3CA mutation and amplification is typically low (1.9% in METABRIC and 2.3%
in TCGA79,80).
115
Median adjusted MAF for PIK3CA in the complete cohort and in the PAM pathway
inhibitor cohort was 0.43 (IQR 0.28-0.63) and 0.49 (IQR 0.28-0.62), respectively.
PIK3CA adjusted MAF was higher in primary tumor samples when compared to
samples coming from a metastatic site (complete cohort 0.49 vs. 0.29, p=0.072;
PAM pathway inhibitor cohort 0.53 vs. 0.25, P=0.04). In contrast, no differences
were found across breast cancer subtypes in both cohorts (complete cohort: LUM
0.43 vs. HER2 0.55 vs. TN 0.20, P=0.611; PAM pathway inhibitor cohort: LUM
0.49 vs. HER2 0.55 vs. TN 0.14, P=0.460). Of note, in TN tumors PIK3CA
adjusted MAF was found to be in the subclonal range in both cohorts (0.2 and
0.14, respectively), while in LUM and HER2+ it was always in the clonal range.
Regarding AKT1, it was a clonal event in both cohorts, independently of the type
of sample.
Taken together, all these data suggest that PIK3CA and AKT1 mutations are
truncal events in breast cancer (or at least in LUM and HER2+ subtypes), and
there may be a selection for PIK3CA WT subclones in the metastasis probably
due to therapeutic pressure. In a comprehensive analysis of TCGA data in nine
solid tumors, McGranahan et al. found a clear tendency for mutations in driver
genes to be clonal compared with mutations in non-cancer genes. However, PAM
pathway-related genes (such as PIK3CA) harbored a higher proportion of
subclonal mutations compared with genes associated with RAS-MAPK pathway,
including KRAS, NRAS and BRAF206. These data are in line with our findings,
which certainly require further validation.
7.4. Rate of enrollment in clinical trials
From the 327 patients with a valid somatic mutation and/or FGFR1 analysis, 184
(56.3%) received a targeted therapy. Of these, 74 (40.2%) were genotype-driven
trials, i.e., trials with drugs matched to the alterations that were detected. Overall,
22.6% (74/327) of the patients undergoing molecular pre-screening received
treatment within a genotype-driven trial.
116
The number of patients that received a matched drug is globally higher than in the
literature. For instance, in the Princess Margaret IMPACT/COMPACT trial, only
5% of patients who underwent successful molecular profiling (i.e. 84 patients out
of 1640 patients tested, all cancer types) were subsequently treated on genotype-
matched clinical trials172. The MDACC institutional genomic testing protocol
matched 83/2000 (4%) of patients62, while the British Columbia Cancer Agency
Personalized Oncogenomics Trial matched 1/100 (1%)207. Specifically in breast
cancer, the SAFIR-01 trial matched 48/423 (11.3%) patients, although only 28/423
(6.6%) received a matched treatment within a Phase I/II clinical trial63.
One reason that can explain the high enrollment rate at our Institution is patient
selection for genomic testing. As previously discussed, we restrict genotyping to
those patients that can potentially be good candidates for clinical trials.
Additionally, the genotyping request is made directly by the treating physician, not
by an investigator not directly involved in treatment decisions. In this way,
genotyping information is generally not lost nor missed, and can be used for real-
time treatment decisions.
7.5. Characteristics of the PAM pathway inhibitor cohort
From the 327 patients that were tested for molecular alterations, 120 received a
PAM pathway inhibitor (PAM pathway inhibitor Cohort). Patients in the PAM
pathway inhibitor Cohort were heavily pre-treated, with a median of 3 prior lines of
therapy for metastatic disease (range 0-9). This information is important when
comparing outcomes of our patients with those from trials testing mTOR and PI3K
inhibitors. In the latter, patients generally have received less lines of therapy,
typically an AI and a maximum of one prior chemotherapy for metastatic disease.
Hyperactivation of the PAM pathway induces resistance to endocrine therapy208,
anti-HER2 treatment209, and chemotherapy210. Conversely, inhibition of the
pathway reverts the resistance to endocrine therapies in ER+ breast cancer cells
and xenografts211,212, restores the sensitivity to HER2 blockade in preclinical
models resistant to anti-HER2 therapy213, and induces tumor regression when
117
combined to chemotherapy in models resistant to the same chemotherapy
backbone210,214. Over the years, the drug development strategy of PAM pathway
inhibitors in breast cancer has evolved from trials testing single agents to trials
testing combinations with standard therapies. It is not surprising, though, that most
of the patients in this cohort received a combination of PAM pathway inhibitor with
endocrine (53.9%), anti-HER2 (16.1%), or chemotherapy (13.1%). Of note, 3 out
of 4 patients with LUM tumors received a combination with endocrine therapy, and
over 80% of patients with HER2+ tumors received a combination with anti-HER2
blockade. Regarding TN patients, 57% received a PAM pathway inhibitor as a
single agent, and the remaining in combination with chemotherapy.
Interestingly, most of the patients in this cohort (54/120, 41.5%) were treated with
PI3Kα-specific inhibitors, followed by mTOR inhibitors (20.8%), which traduces the
availability of drugs in clinical trials during the considered period of time at our
Institution.
The proportion of molecular aberrations in the PAM pathway inhibitor cohort was
similar to that of the complete cohort (Figure 29). The main differences were a
higher proportion of PIK3CA mutations (31.7% vs. 24%) and a lower proportion of
TP53 mutations (21.1% vs. 34.2%) in the PAM pathway inhibitor cohort. Notably,
the proportion of patients with PAM pathway dysregulation was higher in the PAM
pathway inhibitor cohort than in the complete cohort (43.3% vs. 35%). Overall, this
reflects the matching effort described above.
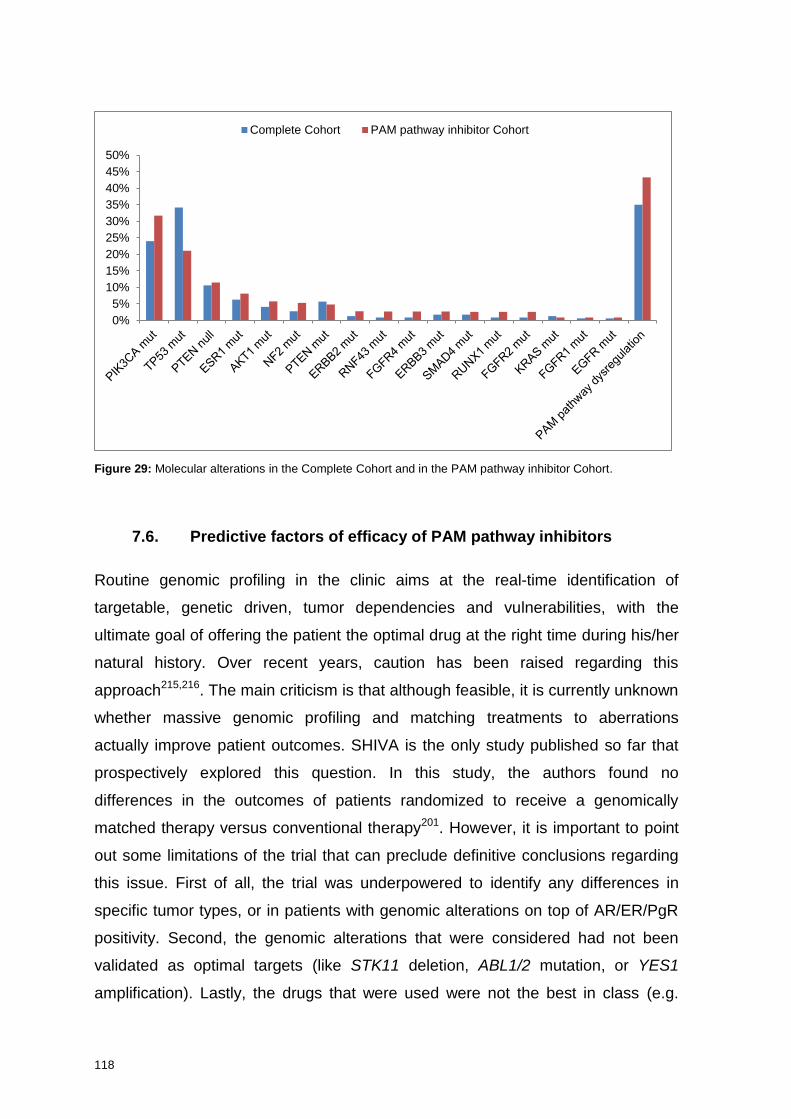
118
Figure 29: Molecular alterations in the Complete Cohort and in the PAM pathway inhibitor Cohort.
7.6. Predictive factors of efficacy of PAM pathway inhibitors
Routine genomic profiling in the clinic aims at the real-time identification of
targetable, genetic driven, tumor dependencies and vulnerabilities, with the
ultimate goal of offering the patient the optimal drug at the right time during his/her
natural history. Over recent years, caution has been raised regarding this
approach215,216. The main criticism is that although feasible, it is currently unknown
whether massive genomic profiling and matching treatments to aberrations
actually improve patient outcomes. SHIVA is the only study published so far that
prospectively explored this question. In this study, the authors found no
differences in the outcomes of patients randomized to receive a genomically
matched therapy versus conventional therapy201. However, it is important to point
out some limitations of the trial that can preclude definitive conclusions regarding
this issue. First of all, the trial was underpowered to identify any differences in
specific tumor types, or in patients with genomic alterations on top of AR/ER/PgR
positivity. Second, the genomic alterations that were considered had not been
validated as optimal targets (like STK11 deletion, ABL1/2 mutation, or YES1
amplification). Lastly, the drugs that were used were not the best in class (e.g.
0%
5%
10%
15%
20%
25%
30%
35%
40%
45%
50%
Complete Cohort PAM pathway inhibitor Cohort
119
everolimus for AKT1 mutation, or lapatinib for ERBB2 mutation). All these factors
may have influenced the negative results of SHIVA. Next-generation prospective
trials, such as SAFIR-02, may more reliably address this question.
Given the limited evidence regarding the success of matching genomic alterations
with targeted treatments in terms of patient benefit, it is important to study
predictive factors of efficacy to novel drugs in real-world data. PAM pathway
inhibitors are one of the main areas of research and drug development in our Unit,
and our patients with PAM pathway dysregulation are more likely to receive a PAM
pathway inhibitor than those patients without dysregulation (OR 1.98, 95%CI 1.19-
3.26; P=0.006). We took advantage of the large number of patients treated with
PAM pathway inhibitors – mTOR, dual PI3K/mTOR, pan-PI3K, PI3Kα, and AKT
inhibitors – and the fact that most of them were treated in genotype-driven trials, to
analyze predictive factors of efficacy to these drugs.
In our population, 57.7% of the patients showed clinical benefit –achieving a CR,
PR, or SD for at least 16 weeks – when treated with PAM pathway inhibitors, and
the ORR was 23.8%. Median TTF in this pre-treated population was 4.9 months
(95%CI 3.9-6.1).
In our study the presence of a PIK3CA mutation, but not its clonality or the
presence of PAM pathway dysregulation, was predictive of clinical benefit to PAM
pathway inhibitors, measured both as CBR and TTF. In the multivariate model
including other prognostic factors for TTF, PIK3CA mutation stood as an
independent predictor of better TTF. Other factors that positively correlated with
TTF in the multivariate model were receiving combination therapy with endocrine
and chemotherapy, and having received the PAM pathway inhibitor in up to third
line of treatment for MBC. Breast cancer subtype, the presence of visceral
metastasis, or the type of PAM pathway inhibitor, were not independent predictors
of TTF in our population.
Globally, these results of CBR and TTF compare favorably with trials testing
different PAM pathway inhibitors. However, comparison with these prospective
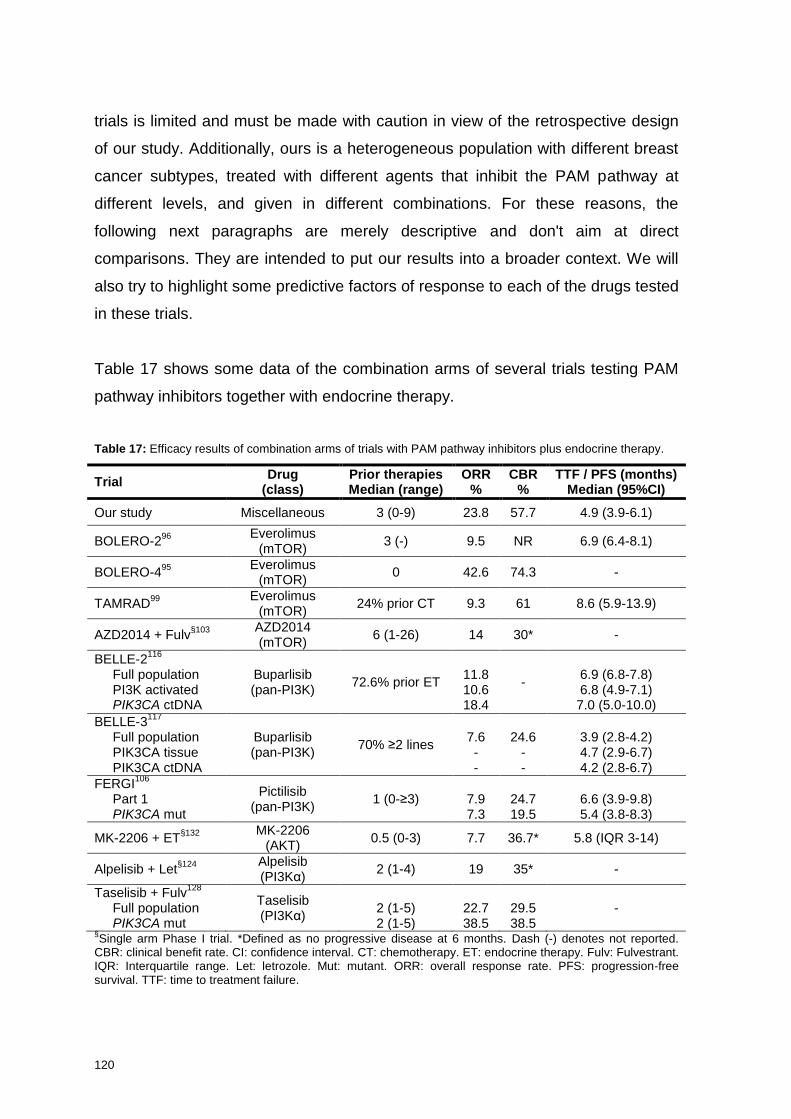
120
trials is limited and must be made with caution in view of the retrospective design
of our study. Additionally, ours is a heterogeneous population with different breast
cancer subtypes, treated with different agents that inhibit the PAM pathway at
different levels, and given in different combinations. For these reasons, the
following next paragraphs are merely descriptive and don't aim at direct
comparisons. They are intended to put our results into a broader context. We will
also try to highlight some predictive factors of response to each of the drugs tested
in these trials.
Table 17 shows some data of the combination arms of several trials testing PAM
pathway inhibitors together with endocrine therapy.
Table 17: Efficacy results of combination arms of trials with PAM pathway inhibitors plus endocrine therapy.
Trial Drug
(class) Prior therapies Median (range)
ORR %
CBR %
TTF / PFS (months) Median (95%CI)
Our study Miscellaneous 3 (0-9) 23.8 57.7 4.9 (3.9-6.1)
BOLERO-296
Everolimus
(mTOR) 3 (-) 9.5 NR 6.9 (6.4-8.1)
BOLERO-495
Everolimus
(mTOR) 0 42.6 74.3 -
TAMRAD99
Everolimus
(mTOR) 24% prior CT 9.3 61 8.6 (5.9-13.9)
AZD2014 + Fulv§103
AZD2014 (mTOR)
6 (1-26) 14 30* -
BELLE-2116
Full population PI3K activated PIK3CA ctDNA
Buparlisib (pan-PI3K)
72.6% prior ET
11.8 10.6 18.4
-
6.9 (6.8-7.8) 6.8 (4.9-7.1) 7.0 (5.0-10.0)
BELLE-3117
Full population PIK3CA tissue PIK3CA ctDNA
Buparlisib (pan-PI3K)
70% ≥2 lines
7.6 - -
24.6
- -
3.9 (2.8-4.2) 4.7 (2.9-6.7) 4.2 (2.8-6.7)
FERGI106
Part 1 PIK3CA mut
Pictilisib (pan-PI3K)
1 (0-≥3)
7.9 7.3
24.7 19.5
6.6 (3.9-9.8) 5.4 (3.8-8.3)
MK-2206 + ET§132
MK-2206
(AKT) 0.5 (0-3) 7.7 36.7* 5.8 (IQR 3-14)
Alpelisib + Let§124
Alpelisib (PI3Kα)
2 (1-4) 19 35* -
Taselisib + Fulv128
Full population PIK3CA mut
Taselisib (PI3Kα)
2 (1-5) 2 (1-5)
22.7 38.5
29.5 38.5
-
§Single arm Phase I trial. *Defined as no progressive disease at 6 months. Dash (-) denotes not reported.
CBR: clinical benefit rate. CI: confidence interval. CT: chemotherapy. ET: endocrine therapy. Fulv: Fulvestrant. IQR: Interquartile range. Let: letrozole. Mut: mutant. ORR: overall response rate. PFS: progression-free survival. TTF: time to treatment failure.
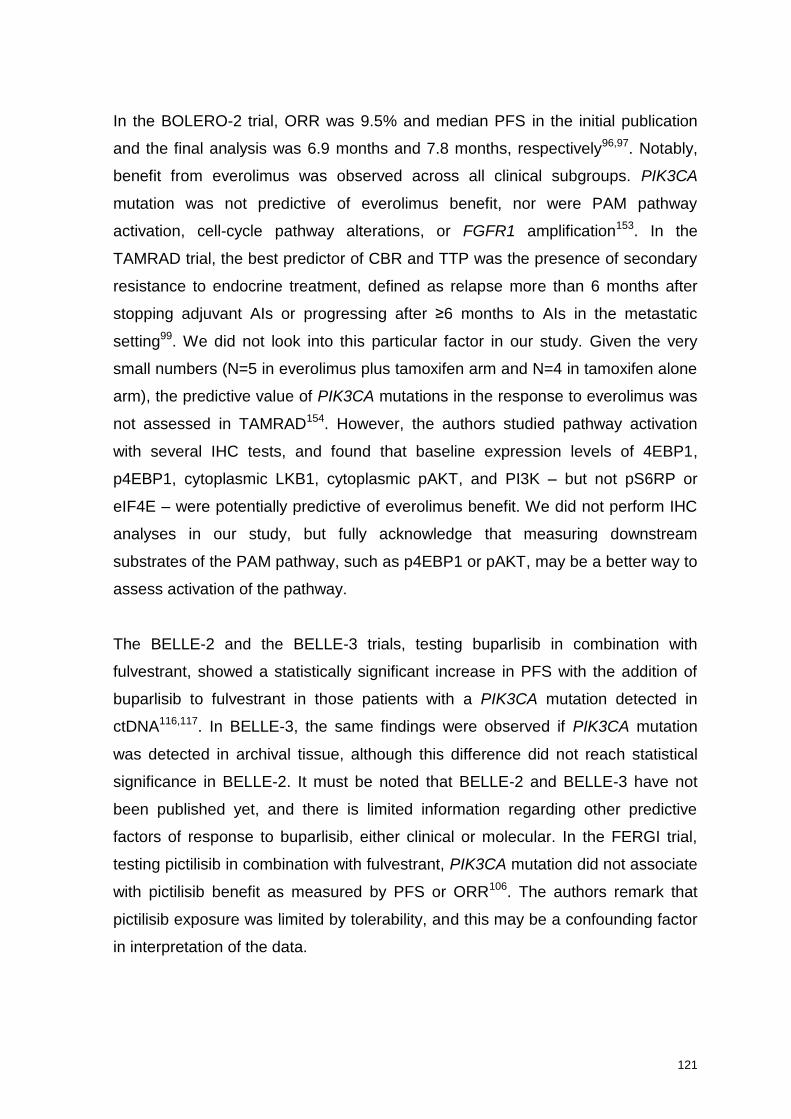
121
In the BOLERO-2 trial, ORR was 9.5% and median PFS in the initial publication
and the final analysis was 6.9 months and 7.8 months, respectively96,97. Notably,
benefit from everolimus was observed across all clinical subgroups. PIK3CA
mutation was not predictive of everolimus benefit, nor were PAM pathway
activation, cell-cycle pathway alterations, or FGFR1 amplification153. In the
TAMRAD trial, the best predictor of CBR and TTP was the presence of secondary
resistance to endocrine treatment, defined as relapse more than 6 months after
stopping adjuvant AIs or progressing after ≥6 months to AIs in the metastatic
setting99. We did not look into this particular factor in our study. Given the very
small numbers (N=5 in everolimus plus tamoxifen arm and N=4 in tamoxifen alone
arm), the predictive value of PIK3CA mutations in the response to everolimus was
not assessed in TAMRAD154. However, the authors studied pathway activation
with several IHC tests, and found that baseline expression levels of 4EBP1,
p4EBP1, cytoplasmic LKB1, cytoplasmic pAKT, and PI3K – but not pS6RP or
eIF4E – were potentially predictive of everolimus benefit. We did not perform IHC
analyses in our study, but fully acknowledge that measuring downstream
substrates of the PAM pathway, such as p4EBP1 or pAKT, may be a better way to
assess activation of the pathway.
The BELLE-2 and the BELLE-3 trials, testing buparlisib in combination with
fulvestrant, showed a statistically significant increase in PFS with the addition of
buparlisib to fulvestrant in those patients with a PIK3CA mutation detected in
ctDNA116,117. In BELLE-3, the same findings were observed if PIK3CA mutation
was detected in archival tissue, although this difference did not reach statistical
significance in BELLE-2. It must be noted that BELLE-2 and BELLE-3 have not
been published yet, and there is limited information regarding other predictive
factors of response to buparlisib, either clinical or molecular. In the FERGI trial,
testing pictilisib in combination with fulvestrant, PIK3CA mutation did not associate
with pictilisib benefit as measured by PFS or ORR106. The authors remark that
pictilisib exposure was limited by tolerability, and this may be a confounding factor
in interpretation of the data.
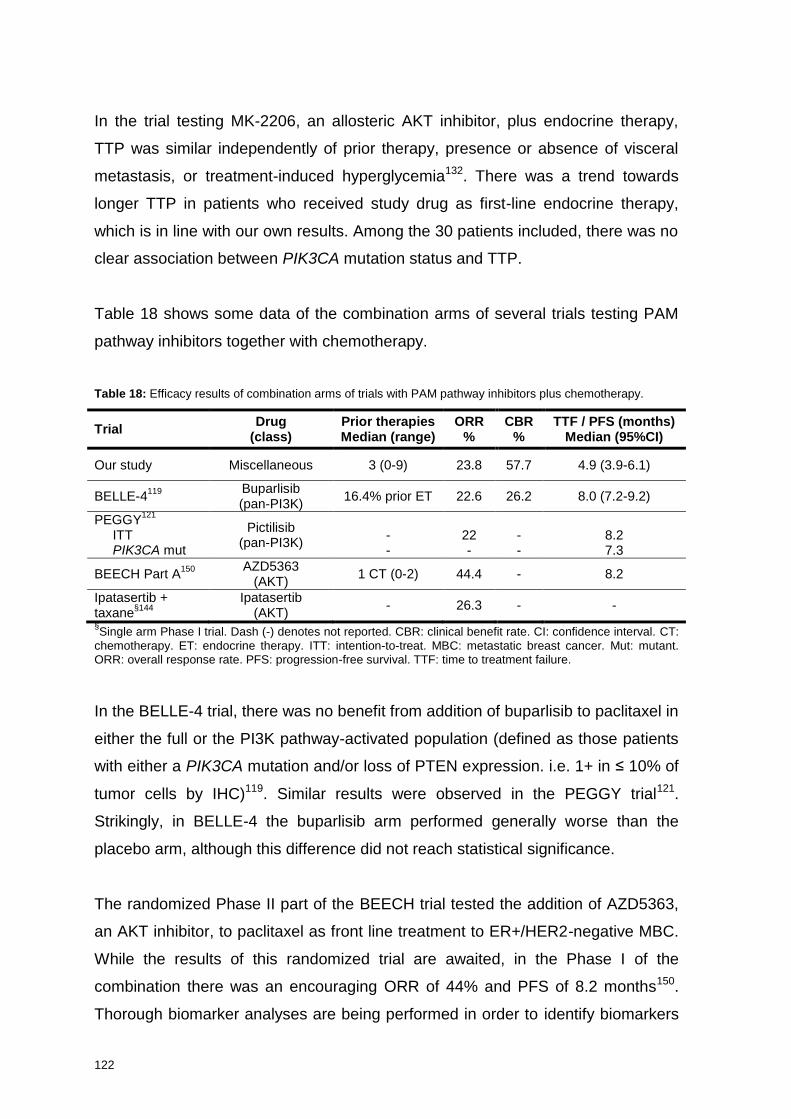
122
In the trial testing MK-2206, an allosteric AKT inhibitor, plus endocrine therapy,
TTP was similar independently of prior therapy, presence or absence of visceral
metastasis, or treatment-induced hyperglycemia132. There was a trend towards
longer TTP in patients who received study drug as first-line endocrine therapy,
which is in line with our own results. Among the 30 patients included, there was no
clear association between PIK3CA mutation status and TTP.
Table 18 shows some data of the combination arms of several trials testing PAM
pathway inhibitors together with chemotherapy.
Table 18: Efficacy results of combination arms of trials with PAM pathway inhibitors plus chemotherapy.
Trial Drug
(class) Prior therapies Median (range)
ORR %
CBR %
TTF / PFS (months) Median (95%CI)
Our study Miscellaneous 3 (0-9) 23.8 57.7 4.9 (3.9-6.1)
BELLE-4119
Buparlisib (pan-PI3K)
16.4% prior ET 22.6 26.2 8.0 (7.2-9.2)
PEGGY121
ITT PIK3CA mut
Pictilisib (pan-PI3K)
- -
22 -
- -
8.2 7.3
BEECH Part A150
AZD5363
(AKT) 1 CT (0-2) 44.4 - 8.2
Ipatasertib + taxane
§144
Ipatasertib (AKT)
- 26.3 - -
§Single arm Phase I trial. Dash (-) denotes not reported. CBR: clinical benefit rate. CI: confidence interval. CT:
chemotherapy. ET: endocrine therapy. ITT: intention-to-treat. MBC: metastatic breast cancer. Mut: mutant. ORR: overall response rate. PFS: progression-free survival. TTF: time to treatment failure.
In the BELLE-4 trial, there was no benefit from addition of buparlisib to paclitaxel in
either the full or the PI3K pathway-activated population (defined as those patients
with either a PIK3CA mutation and/or loss of PTEN expression. i.e. 1+ in ≤ 10% of
tumor cells by IHC)119. Similar results were observed in the PEGGY trial121.
Strikingly, in BELLE-4 the buparlisib arm performed generally worse than the
placebo arm, although this difference did not reach statistical significance.
The randomized Phase II part of the BEECH trial tested the addition of AZD5363,
an AKT inhibitor, to paclitaxel as front line treatment to ER+/HER2-negative MBC.
While the results of this randomized trial are awaited, in the Phase I of the
combination there was an encouraging ORR of 44% and PFS of 8.2 months150.
Thorough biomarker analyses are being performed in order to identify biomarkers
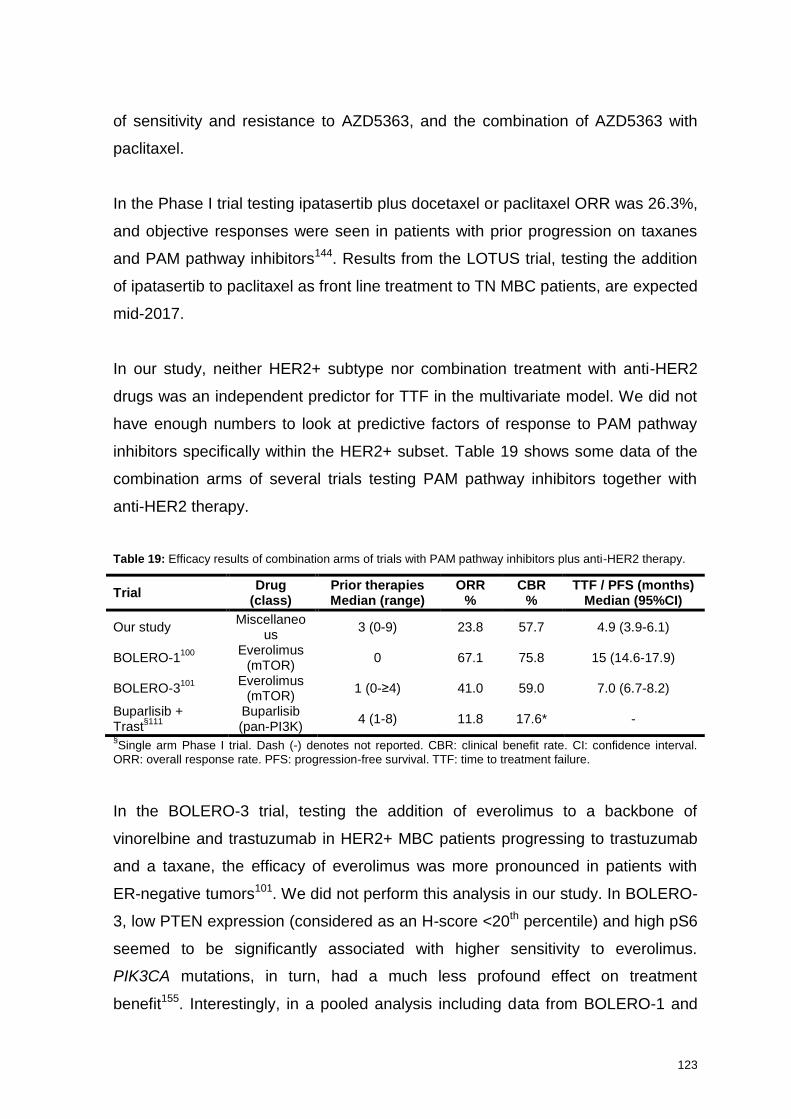
123
of sensitivity and resistance to AZD5363, and the combination of AZD5363 with
paclitaxel.
In the Phase I trial testing ipatasertib plus docetaxel or paclitaxel ORR was 26.3%,
and objective responses were seen in patients with prior progression on taxanes
and PAM pathway inhibitors144. Results from the LOTUS trial, testing the addition
of ipatasertib to paclitaxel as front line treatment to TN MBC patients, are expected
mid-2017.
In our study, neither HER2+ subtype nor combination treatment with anti-HER2
drugs was an independent predictor for TTF in the multivariate model. We did not
have enough numbers to look at predictive factors of response to PAM pathway
inhibitors specifically within the HER2+ subset. Table 19 shows some data of the
combination arms of several trials testing PAM pathway inhibitors together with
anti-HER2 therapy.
Table 19: Efficacy results of combination arms of trials with PAM pathway inhibitors plus anti-HER2 therapy.
Trial Drug
(class) Prior therapies Median (range)
ORR %
CBR %
TTF / PFS (months) Median (95%CI)
Our study Miscellaneo
us 3 (0-9) 23.8 57.7 4.9 (3.9-6.1)
BOLERO-1100
Everolimus
(mTOR) 0 67.1 75.8 15 (14.6-17.9)
BOLERO-3101
Everolimus
(mTOR) 1 (0-≥4) 41.0 59.0 7.0 (6.7-8.2)
Buparlisib + Trast
§111
Buparlisib (pan-PI3K)
4 (1-8) 11.8 17.6* -
§Single arm Phase I trial. Dash (-) denotes not reported. CBR: clinical benefit rate. CI: confidence interval.
ORR: overall response rate. PFS: progression-free survival. TTF: time to treatment failure.
In the BOLERO-3 trial, testing the addition of everolimus to a backbone of
vinorelbine and trastuzumab in HER2+ MBC patients progressing to trastuzumab
and a taxane, the efficacy of everolimus was more pronounced in patients with
ER-negative tumors101. We did not perform this analysis in our study. In BOLERO-
3, low PTEN expression (considered as an H-score <20th percentile) and high pS6
seemed to be significantly associated with higher sensitivity to everolimus.
PIK3CA mutations, in turn, had a much less profound effect on treatment
benefit155. Interestingly, in a pooled analysis including data from BOLERO-1 and
124
BOLERO-3 (both in the setting of HER2+ MBC), PIK3CA mutation, PTEN loss,
and PAM pathway activation predicted efficacy of everolimus plus trastuzumab
plus chemotherapy (CT)155. In line with BOLERO-3 and BOLERO-1, in the Phase I
trial testing trastuzumab plus buparlisib all the patients experiencing a PR or SD
for more than 6 months had PAM pathway activation111.
Focusing on the 54 patients treated with PI3Kα-specific inhibitors in our study,
PIK3CA mutation was predictive of clinical benefit (84.2% vs. 54.3% in patients
with no PIK3CA mutation, P=0.038). In contrast, PIK3CA mutation did not
correlate to increased TTF, although numerical TTF was higher in PIK3CA mutant
patients treated with PI3Kα-specific inhibitors than in PIK3CA WT patients (7.4 vs.
4.9 months, HR 0.65, 95%CI 0.36-1.20; P=0.167). The small number of patients
within each subgroup may have diluted the potential magnitude of the TTF benefit
of PI3Kα-specific inhibitors in PIK3CA mutant patients in this population.
In line to our results, the Phase I trial testing alpelisib plus letrozole showed
increased benefit from the combination in those patients with PIK3CA mutation124.
In this trial, patients with PIK3CA-mutant MBC had numerically higher CBR equal
or greater than 6 months and 12 months than patients with WT PIK3CA tumors
(44% vs. 20% and 38% vs. 20%, respectively). Additionally, from the five PR
observed, four were in patients with PIK3CA mutation. Similarly, in the Phase II
trial testing taselisib plus fulvestrant, ORR was 38.1% (95%CI 18.1-61.6) in
PIK3CA-mutant patients and 8.7% (95%CI 1.1-28.0) in PIK3CA WT patients128.
In summary, in large prospective trials testing PAM pathway inhibitors, PIK3CA
mutations seem to be predictive of benefit to some pan-PI3K or PI3Kα-specific
inhibitors, especially when combined with endocrine therapy or anti-HER2
blockade, but not with mTOR inhibitors, or PAM pathway inhibitors when
combined with chemotherapy. In our cohort, the presence of PIK3CA mutation
was predictive of benefit to PAM pathway inhibitors, especially in patients that
received these agents in combination with endocrine therapy and chemotherapy
early on during the course of metastatic disease. Again, it must be noted that the
125
different sample size and the huge heterogeneity of these trials make these
comparisons merely descriptive.
7.7. Clonality of PIK3CA mutation and efficacy of PAM inhibitors
The MAFs of driver genes may be used to infer mutational timelines, intra-tumor
genomic heterogeneity, and dynamic clonal evolution. However, despite their
potential impact on tumor progression and response to targeted agents, they are
often not reported. To the best of our knowledge, the influence of PIK3CA
mutation clonality on response to PAM pathway inhibitors has not yet been
described in breast cancer.
In our study, clonality of PIK3CA mutation did not impact response to PAM
pathway inhibitors or to PI3Kα-specific inhibitors. Similarly, clonality of PIK3CA
mutation was not a determinant of TTF to PAM pathway inhibitors – either as
continuous or dichotomous variable – or to PI3Kα-specific inhibitors.
Our results are in contrast with some published data in NSCLC and CRC. In
NSCLC, different studies have found that the abundance of EGFR mutations in
primary tumors predicts for benefit from treatment with EGFR TKIs in the
advanced setting217,218. Zhou et al. tested 100 samples from NSCLC patients
treated with gefitinib for the presence of EGFR mutations and their abundance217.
They used both Sanger sequencing and Scorpion amplification refractory mutation
system (ARMS; DxS, Manchester, United Kingdom), which have a sensitivity cut-
off for mutation call of 10% and 1%, respectively. In this study, MAF was not
directly evaluated, but patients were categorized in 3 groups according to the
detection of EGFR mutation by the two techniques: high abundance of EGFR
(group H, N=51), i.e. those patients with mutation-positive tumors by both
methods; low abundance of EGFR (group L, N=18), i.e. those patients with
mutation positive by ARMS but negative by sequencing; and WT group (group W,
N=31), i.e., those patients with mutation-negative tumors by both methods. In
group L, tumors were also tested for KRAS, BRAF, PI3KCA, ALK, and cMET, in
order to exclude their potential effect on the benefit from gefitinib treatment, and
126
no alteration was detected in 10/18 patients. Median PFS of patients in group H
(11.3 months, 95%CI 7.4-15.2) was significantly longer than that in group L (6.9
months, 95%CI, 5.5-8.4; P=0.014). Additionally, median PFS of patients in group L
was significantly longer than that in group W (2.1 months, 95%CI 1.0-3.2;
P=0.010). This study provided the first evidence that the relative abundance of
EGFR mutations could predict the extent of benefit from EGFR-TKI therapy.
A subsequent study from Ono et al. assessed the predictive implications of the
MAF of a point mutation at codon 858 in exon 21 (L858R) for the usefulness of
treatment with EGFR-TKIs (gefitinib and erlotinib) in 29 patients with advanced
mutant EGFR lung adenocarcinoma218. EGFR mutation was analyzed by
pyrosequencing, Cycleave and ARMS. The MAF for L858R was 18.5% (range 8-
82%). The authors found that the ORR to EGFR-TKI was significantly higher in the
group with MAF >9% (79.1%, N=24) than in the group with a MAF of ≤9% (20%,
N=5; P=0.022). Also, PFS was longer in the group with MAF >9% than in the
group with MAF of ≤9% (92 vs. 284 days, P=0.0027).
Conversely, the presence of subclonal KRAS mutations may reduce the clinical
benefit of cetuximab in CRC219. For instance, Laurent-Puig et al. studied the role of
minor mutant KRAS subclones in patients with advanced CRC treated with anti-
EGFR antibodies in the resistance to these drugs220. They used an ultra-sensitive
method, picoliter multiplex droplet PCR (dPCR), to detect mutant KRAS subclones
among 136 patients WT for KRAS, NRAS, and BRAF, and 41 patients with KRAS-
mutant tumors – all treated with anti-EGFR agents. The use of dPCR allowed for
the detection of 22 additional tumors with KRAS mutation (median MAF 0.04%,
range 0.01%-12.4%), and 2 with BRAF mutation (MAF of 6.9% and 0.07%). The
authors observed an inverse correlation between the proportion of mutant DNA
and the frequency of anti-EGFR response (P < 0.001). Considering a cutoff value
for EGFR mutation MAF of 1%, only 2/46 patients (4.3%) with >1% of KRAS-
mutant allele were responders as compared with 62.5% of the patients with 1% or
less of KRAS-mutant allele. This association with response was translated in
terms of PFS and OS. When comparing patients with WT tumors or with tumors
presenting ≤1% of a mutant allele with patients with tumor with >1% of mutant
127
allele, the HRs were 3.2 (95%CI 1.3-7.9; P=0.014) and 4.7 (95%CI 1.6-14.3;
P=0.006) for PFS respectively, and 4.1 (95%CI 1.6-10.4; P=0.003) and 5.6
(95%CI 1.8-16.8; P=0.002) for OS.
In another study, Azuara et al. sought to evaluate the added value of using dPCR
to analyze a panel of 34 hotspots, including RAS (KRAS and NRAS exons 2/3/4)
and BRAF (V600E), in tumor FFPE samples from 102 metastatic CRC patients
treated with anti-EGFR therapy221. Frequency of mutations by conventional
techniques was 22%, and using dPCR the number of patients bearing mutations
increased to 47%. Interestingly, dPCR identified multiple additional low-frequency
mutant alleles in 12 cases. The percentage of mutant alleles in this set of 26
patients detected only by dPCR ranged from 0.04% to 10.8% (median 1.26%). An
inverse correlation between the fraction of mutant alleles and radiologic response
was observed (P<0.005). Consistent with the previous study, ROC analysis
showed that a fraction of 1% or higher of any mutant alleles offered the best
predictive value for all combinations of RAS and BRAF analysis, and optimized
prediction of both PFS and OS to EGFR-inhibitors.
It could be speculated that not only MAF, but also the level of gene amplification,
could influence the sensitivity to targeted therapy. Using data from a translational
clinical trial to assess whether cancers with amplification of FGFR1 or FGFR2
respond to the selective FGFR inhibitor AZD4547222, Pearson et al correlated the
levels of amplification of each gene with response to the targeted agent. They
found that gastric cancers with high-level clonal FGFR2 amplification (ratio
FGFR2:CEP10 ≥5.0) had a high response rate to AZD4547, whereas cancers with
subclonal or low-level amplification did not respond223. In contrast to this
observation, it had previously been described that the level of ERBB2 amplification
does not affect sensitivity to the HER2-targeting antibody trastuzumab224, which
highlights the need to learn the underlying biology of each molecular alteration.
Importantly, Pearson et al. also described the mechanistic model behind their
observation. They showed that high-level FGFR2 amplification initiates a distinct
oncogene addiction phenotype, characterized by FGFR2-mediated transactivation
of alternative receptor kinases, bringing PI3K/mTOR signaling under FGFR
128
control. In contrast, in low-level FGFR1-amplified cancers PI3K/mTOR signaling is
not blocked by FGFR inhibition, which limits the sensitivity of these cell lines to
FGFR inhibition. We did not analyze whether the levels of amplification of FGFR1
or FGFR2 were predictive of benefit to FGFR inhibitors since this is outside of the
scope of our study.
Among our 15 patients with PIK3CA mutation, with information regarding MAF,
and treated with a PI3Kα-specific inhibitor, patients with clonal PIK3CA had
numerically higher TTF than those with subclonal PIK3CA (11.4 vs. 5.5 months),
but this difference did not reach statistical significance (HR 0.57, 95%CI 0.16-2.01;
P=0.380). This finding, in contrast to the studies previously described, may have
several explanations. The most likely explanation is that the very small sample
size in our study (15 patients, 9 with clonal and 6 with subclonal PIK3CA) is not
enough to give statistical power for the comparison. This is suggested by the wide
95%CI associated with an HR of 0.57. If the sample size is increased, a
statistically significant difference may emerge. Another explanation is that clonality
of PIK3CA is indeed not a determinant of response to PI3Kα-specific inhibitors.
There are some studies that suggest that PAM pathway activation signatures,
rather than the presence of PIK3CA mutation per se, is determinant to the
response to other PAM pathway inhibitors such as everolimus225,226. If this were
the case, the relative abundance of PIK3CA mutant clones would have no
influence on the treatment with PAM pathway inhibitors whatsoever, unless it also
correlated with PAM pathway activation as measured by RNA or RPPA signatures.
It must be noted that in our series, PIK3CA mutation correlates with better CBR
and marginally with better TTF to PI3Kα-specific inhibitors, and is an independent
predictor of benefit to PAM pathway inhibitors in general, so we believe these
findings do not support the above explanation. Finally, the cut-off we used to
define clonality may have missed a significant benefit of PI3Kα-specific inhibitors.
However, with so small numbers, it was not possible to test other cut-offs.
Nonetheless, this is an issue that merits further investigation.
129
7.8. Summary of findings and future directions
This study had two main objectives: characterize the prevalence of molecular
alterations in a cohort of MBC patients treated in our Institution, and assess
predictive factors of efficacy to PAM pathway inhibitors in our population.
We have shown that the prevalence of molecular alterations in our cohort is similar
to that previously reported in the literature (with TP53 mutation being the most
frequent alteration, followed by PIK3CA mutation), and have characterized the
distribution of molecular alterations across breast cancer subtypes. We have also
evidenced that additional alterations in the PAM pathway – such as PTEN
dysregulation (either by the presence of missense mutations or null expression by
IHC) and AKT1 mutation – are frequent in breast cancer. We have identified
samples with two or more actionable alterations and discussed the potential
therapeutic implications of this finding. We have also described the differences
between the alterations that were detected in primary tumor samples and
metastatic samples. These were not paired biopsies, and hence conclusions must
be cautious. Although the differences were not statistically significant, we have
found a trend for ESR1, ERBB2, and PIK3CA mutation to be more frequently
detected when the sample came from a metastatic lesion.
We have described that both PIK3CA and AKT1 mutations are clonal events in our
population. To the best of our knowledge, this analysis has not previously been
performed in samples coming from a clinical setting in breast cancer. Interestingly,
we have found that PIK3CA mutation was a subclonal event when detected in a
metastatic sample, and have discussed the potential implications of this finding.
We have presented the rate of enrollment in clinical trials among the patients
tested for molecular alterations, and have discussed the reasons for the generally
higher numbers in our Institution as compared to other series.
We then focused on the outcomes of the patients treated with PAM pathway
inhibitors and analyzed putative predictive factors for clinical benefit to these
130
agents. We found that patients with PIK3CA mutation, treated early in their course
of metastatic disease in trials testing combinations with endocrine or
chemotherapy had better outcomes than the rest.
Finally, given the previous results in other tumor types such as NSCLC and
CRC217,220, we studied whether the clonality of PIK3CA mutation was predictive of
benefit to treatment with PI3Kα-specific inhibitors. To the best of our knowledge
this issue had not previously been explored in MBC. In our series we found no
such association and have discussed potential reasons for these results.
The introduction of NGS in clinical practice has allowed the routine genomic study
of a patient’s tumor at the point of care, bringing important advances in the clinical
management of breast cancer patients and translational research. Crucially, a
good annotation of the variables that are found in routine genotyping with NGS will
better distinguish between actionable variations and passenger alterations with no
biological importance. Several efforts are ongoing to facilitate the clinical
interpretation of variants. Some examples include the Gene Drug Knowledge
Database227, the Database of Curated Mutations228, ClinVar229, ClinGen230,
PharmGKB231, OncoKB (http://oncokb.org), My Cancer Genome232, and CiVIC233,
among others. These initiatives are important to narrow the gap between the
identification of increasing numbers of somatic mutations and the scarcity of
biological or clinical information – and validation – for each of those alterations, as
well as translating this biological information into better patient care.
Despite all the genotyping efforts, there are relatively few actionable mutations in
breast cancer (PIK3CA, AKT1, ERBB2, ESR1), and the response to targeted
agents towards those alterations, although promising, is less than ideal. Moving
forward, it will be important to expand the druggable genome in breast cancer,
either by identifying additional actionable missense mutations, or by identifying
other targetable alterations, such as driver copy number alterations or gene
fusions. The latter have dramatically changed the natural history of NSCLC (ALK
and ROS1 translocations17,234), and sarcomas and other tumor types (NTRK
translocations235). The introduction of NGS techniques in the clinical setting may
131
provide us with knowledge about these and other alterations in breast cancer,
ultimately leading to improvement to the treatment and care of patients.
Despite acknowledging that the mutational landscape of the metastatic disease is
not identical to that of the primary tumor, not all patients are amenable to
undergoing a biopsy from a metastatic site. It is therefore important to implement
the genotyping of the so-called “liquid biopsies” in the clinic; a test that only
requires a blood draw, and can be repeated as needed, with little or no risk to
patients. Liquid biopsies include ctDNA, circulating tumor cells (CTCs), exosomes,
and other circulating biomarkers. ctDNA may better capture tumor heterogeneity
by detecting mutations that are both shared and private to metastasis sites, and
can also be used to monitor response to targeted therapy236. We envision that the
routine use of ctDNA will change clinical care of MBC patients.
Another area of required improvement is the accurate identification of those
patients who will benefit from targeted agents. The quest for biomarkers of
response to novel drugs seems a long and hard path, but there are some tools
that may help us our endeavors. As postulated by Hyman et al. in a recent
manuscript, clinical studies evaluating a genomic-driven hypotheses should be
designed to learn from each case in an unprecedented way237. This includes a
systematic analysis of patient-derived biospecimens and potential clinical
strategies to overcome adaptive or acquired resistance in real-time. The authors
propose that the hallmarks of a modern precision-oncology study should include
the following primary scientific objectives: 1) Identification of the target, by
collection of pre-treatment biopsy and ctDNA; 2) Confirmation of target inhibition,
with collection of an on-treatment biopsy, liquid biopsy (ctDNA, exosomes,
circulating tumor cells), and functional imaging with 18F-PET-CT; 3) Biologic target
validation, through the generation of patient-derived xenograft (PDX) models or
organoids at the time of tumor biopsies; and 4) Description of the mechanisms
underlying acquired resistance, by comparative analysis of pre- and post-
treatment tumor biopsies (using DNA and RNA-sequencing, phosphoprotein
analysis, and immune profiling), acquisition of liquid biopsies upon progression,
generation of PDX models with the progressing biopsy, or by performing rapid

132
autopsies in those patients who ultimately succumb to their disease. While such
an effort can only be done in specialized and dedicated Cancer Centers, the
analysis and integration of huge amounts of data that can potentially come from all
this biological material will certainly help to inform regarding biomarkers to
response and resistance to targeted agents.
As a final remark, all that we have discussed until now relates mainly to DNA
changes and their influence in cancer genesis, progression, and response to
targeted agents. This was the main focus of our study. However, an increasing
body of evidence suggests that other factors such as immune-mediated
phenomena, epigenetic changes, and metabolic dysregulations are essential in
the development of breast cancer and response to therapy238-240. An integrative
approach of genomic oncology, immunogenomics, epigenomics, and
metabolomics will be key to understanding, and hence target, additional
susceptibilities in breast cancer.

8Conclusions

133
8. Conclusions
1. Molecular alterations are frequent events in MBC patients treated at our
Institution. The most common molecular alteration across subtypes is TP53
mutation, followed by PIK3CA mutation.
2. PAM pathway dysregulation is frequent in MBC, and PIK3CA mutation is
the most common alteration leading to PAM pathway dysregulation.
3. The most common actionable alteration in LUM and HER2+ breast cancer
on top of ER/PgR expression and ERBB2 amplification, respectively, is
PIK3CA mutation. In TN, the most common actionable alteration is PTEN
null expression, but most of the tumors have no actionable alteration.
4. There is a trend for more frequent detection of ESR1, ERBB2, and PIK3CA
mutations in metastatic samples than in primary tumors.
5. Overall, PIK3CA mutation and AKT1 mutation are clonal events in our
population of MBC.
6. Co-occurrence of molecular alterations is an infrequent event in MBC, but if
present can have relevant therapeutic implications.
7. Patients with actionable alterations are enrolled in clinical trials with
matched agents more frequently at our Institution than in others, and the
presence of a PAM pathway alteration increases the probability of
enrollment in a trial with a PAM pathway inhibitor.
8. Patients with PIK3CA mutation, treated early during their metastatic disease
in trials testing combinations with endocrine or chemotherapy, benefit most
from PAM pathway inhibitors.
9. Although it associates with better response, PIK3CA mutation is not
predictive of TTF to PI3Kα-specific inhibitors.
10. Clonality of PIK3CA mutation does not correlate with efficacy of PAM
pathway inhibitors or PI3Kα-specific inhibitors.

134

9References

135
9. References
1. Jouanna J, Eijk PJvd: Greek medicine from Hippocrates to Galen :
selected papers. Leiden ; Boston, Brill, 2012
2. Garrod AE: The Lancet. The incidence of alkaptonuria: a study in
chemical individuality. Nutr Rev 33:81-3, 1975
3. Meric-Bernstam F, Mills GB: Overcoming implementation challenges
of personalized cancer therapy. Nat Rev Clin Oncol 9:542-8, 2012
4. Wagle N, Berger MF, Davis MJ, et al: High-throughput detection of
actionable genomic alterations in clinical tumor samples by targeted, massively
parallel sequencing. Cancer Discov 2:82-93, 2012
5. Vucic EA, Thu KL, Robison K, et al: Translating cancer 'omics' to
improved outcomes. Genome Res 22:188-95, 2012
6. Moseson DL, Sasaki GH, Kraybill WG, et al: The use of
antiestrogens tamoxifen and nafoxidine in the treatment of human breast cancer in
correlation with estrogen receptor values. A phase II study. Cancer 41:797-802,
1978
7. Piccart-Gebhart MJ, Procter M, Leyland-Jones B, et al: Trastuzumab
after adjuvant chemotherapy in HER2-positive breast cancer. N Engl J Med
353:1659-72, 2005
8. Baselga J, Cortes J, Kim SB, et al: Pertuzumab plus trastuzumab
plus docetaxel for metastatic breast cancer. N Engl J Med 366:109-19, 2012
9. Verma S, Miles D, Gianni L, et al: Trastuzumab emtansine for HER2-
positive advanced breast cancer. N Engl J Med 367:1783-91, 2012
10. Druker BJ, Talpaz M, Resta DJ, et al: Efficacy and safety of a
specific inhibitor of the BCR-ABL tyrosine kinase in chronic myeloid leukemia. N
Engl J Med 344:1031-7, 2001
136
11. Demetri GD, von Mehren M, Blanke CD, et al: Efficacy and safety of
imatinib mesylate in advanced gastrointestinal stromal tumors. N Engl J Med
347:472-80, 2002
12. Lynch TJ, Bell DW, Sordella R, et al: Activating mutations in the
epidermal growth factor receptor underlying responsiveness of non-small-cell lung
cancer to gefitinib. N Engl J Med 350:2129-39, 2004
13. Tsao MS, Sakurada A, Cutz JC, et al: Erlotinib in lung cancer -
molecular and clinical predictors of outcome. N Engl J Med 353:133-44, 2005
14. Flaherty KT, Puzanov I, Kim KB, et al: Inhibition of mutated,
activated BRAF in metastatic melanoma. N Engl J Med 363:809-19, 2010
15. Flaherty KT, Infante JR, Daud A, et al: Combined BRAF and MEK
inhibition in melanoma with BRAF V600 mutations. N Engl J Med 367:1694-703,
2012
16. Kwak EL, Bang YJ, Camidge DR, et al: Anaplastic lymphoma kinase
inhibition in non-small-cell lung cancer. N Engl J Med 363:1693-703, 2010
17. Shaw AT, Kim DW, Mehra R, et al: Ceritinib in ALK-rearranged non-
small-cell lung cancer. N Engl J Med 370:1189-97, 2014
18. Siegel RL, Miller KD, Jemal A: Cancer statistics, 2016. CA Cancer J
Clin 66:7-30, 2016
19. Sant M, Chirlaque Lopez MD, Agresti R, et al: Survival of women
with cancers of breast and genital organs in Europe 1999-2007: results of the
EUROCARE-5 study. Eur J Cancer, 2015
20. Kalager M, Zelen M, Langmark F, et al: Effect of screening
mammography on breast-cancer mortality in Norway. N Engl J Med 363:1203-10,
2010
21. Bleyer A, Baines C, Miller AB: Impact of screening mammography on
breast cancer mortality. Int J Cancer 138:2003-12, 2016
137
22. Guarneri V, Conte P: Metastatic breast cancer: therapeutic options
according to molecular subtypes and prior adjuvant therapy. Oncologist 14:645-56,
2009
23. O'Shaughnessy J: Extending survival with chemotherapy in
metastatic breast cancer. Oncologist 10 Suppl 3:20-9, 2005
24. Largillier R, Ferrero JM, Doyen J, et al: Prognostic factors in 1,038
women with metastatic breast cancer. Ann Oncol 19:2012-9, 2008
25. Andre F, Slimane K, Bachelot T, et al: Breast cancer with
synchronous metastases: trends in survival during a 14-year period. J Clin Oncol
22:3302-8, 2004
26. Cardoso F, Costa A, Norton L, et al: ESO-ESMO 2nd international
consensus guidelines for advanced breast cancer (ABC2)dagger. Ann Oncol
25:1871-88, 2014
27. Gavila J, Lopez-Tarruella S, Saura C, et al: SEOM clinical guidelines
in metastatic breast cancer 2015. Clin Transl Oncol 17:946-55, 2015
28. Fiteni F, Villanueva C, Bazan F, et al: Long-term follow-up of patients
with metastatic breast cancer treated by trastuzumab: impact of institutions. Breast
23:165-9, 2014
29. Jensen EV, DeSombre ER: Estrogen-receptor interaction. Science
182:126-34, 1973
30. Slamon DJ, Clark GM, Wong SG, et al: Human breast cancer:
correlation of relapse and survival with amplification of the HER-2/neu oncogene.
Science 235:177-82, 1987
31. Perou CM, Sorlie T, Eisen MB, et al: Molecular portraits of human
breast tumours. Nature 406:747-52, 2000
32. Levin ER: Integration of the extranuclear and nuclear actions of
estrogen. Mol Endocrinol 19:1951-9, 2005
138
33. Couse JF, Lindzey J, Grandien K, et al: Tissue distribution and
quantitative analysis of estrogen receptor-alpha (ERalpha) and estrogen receptor-
beta (ERbeta) messenger ribonucleic acid in the wild-type and ERalpha-knockout
mouse. Endocrinology 138:4613-21, 1997
34. Russo J, Russo IH: The role of estrogen in the initiation of breast
cancer. J Steroid Biochem Mol Biol 102:89-96, 2006
35. Rugo HS, Rumble RB, Macrae E, et al: Endocrine Therapy for
Hormone Receptor-Positive Metastatic Breast Cancer: American Society of
Clinical Oncology Guideline. J Clin Oncol 34:3069-103, 2016
36. Early Breast Cancer Trialists' Collaborative G, Davies C, Godwin J,
et al: Relevance of breast cancer hormone receptors and other factors to the
efficacy of adjuvant tamoxifen: patient-level meta-analysis of randomised trials.
Lancet 378:771-84, 2011
37. Early Breast Cancer Trialists' Collaborative G, Dowsett M, Forbes
JF, et al: Aromatase inhibitors versus tamoxifen in early breast cancer: patient-
level meta-analysis of the randomised trials. Lancet 386:1341-52, 2015
38. Di Fiore PP, Pierce JH, Kraus MH, et al: erbB-2 is a potent oncogene
when overexpressed in NIH/3T3 cells. Science 237:178-82, 1987
39. Slamon DJ, Leyland-Jones B, Shak S, et al: Use of chemotherapy
plus a monoclonal antibody against HER2 for metastatic breast cancer that
overexpresses HER2. N Engl J Med 344:783-92, 2001
40. Lewis Phillips GD, Li G, Dugger DL, et al: Targeting HER2-positive
breast cancer with trastuzumab-DM1, an antibody-cytotoxic drug conjugate.
Cancer Res 68:9280-90, 2008
41. Krop IE, Kim SB, Gonzalez-Martin A, et al: Trastuzumab emtansine
versus treatment of physician's choice for pretreated HER2-positive advanced
breast cancer (TH3RESA): a randomised, open-label, phase 3 trial. Lancet Oncol
15:689-99, 2014
139
42. Wildiers H KS, Gonzalez-Martin A, LoRusso PM, Ferrero JM, Yu R,
Smitt M, Krop I: Trastuzumab emtansine improves overall survival versus
treatment of physician's choice in patients with previously treated HER2-positive
metastatic breast cancer: Final overall survival results from the phase 3 TH3RESA
study. [abstract]. Cancer Res 76:Abstract n. S5-05, 2016
43. Slamon D, Eiermann W, Robert N, et al: Adjuvant trastuzumab in
HER2-positive breast cancer. N Engl J Med 365:1273-83, 2011
44. Romond EH, Perez EA, Bryant J, et al: Trastuzumab plus adjuvant
chemotherapy for operable HER2-positive breast cancer. N Engl J Med 353:1673-
84, 2005
45. Joensuu H, Kellokumpu-Lehtinen PL, Bono P, et al: Adjuvant
docetaxel or vinorelbine with or without trastuzumab for breast cancer. N Engl J
Med 354:809-20, 2006
46. Sorlie T, Perou CM, Tibshirani R, et al: Gene expression patterns of
breast carcinomas distinguish tumor subclasses with clinical implications. Proc
Natl Acad Sci U S A 98:10869-74, 2001
47. Sorlie T, Tibshirani R, Parker J, et al: Repeated observation of breast
tumor subtypes in independent gene expression data sets. Proc Natl Acad Sci U S
A 100:8418-23, 2003
48. Goldhirsch A, Winer EP, Coates AS, et al: Personalizing the
treatment of women with early breast cancer: highlights of the St Gallen
International Expert Consensus on the Primary Therapy of Early Breast Cancer
2013. Ann Oncol 24:2206-23, 2013
49. Prat A, Cheang MC, Martin M, et al: Prognostic significance of
progesterone receptor-positive tumor cells within immunohistochemically defined
luminal A breast cancer. J Clin Oncol 31:203-9, 2013
140
50. Cheang MC, Chia SK, Voduc D, et al: Ki67 index, HER2 status, and
prognosis of patients with luminal B breast cancer. J Natl Cancer Inst 101:736-50,
2009
51. Prat A, Parker JS, Fan C, et al: Concordance among gene
expression-based predictors for ER-positive breast cancer treated with adjuvant
tamoxifen. Ann Oncol 23:2866-73, 2012
52. Dienstmann R, Rodon J, Barretina J, et al: Genomic medicine
frontier in human solid tumors: prospects and challenges. J Clin Oncol 31:1874-
84, 2013
53. Ma QC, Ennis CA, Aparicio S: Opening Pandora's Box--the new
biology of driver mutations and clonal evolution in cancer as revealed by next
generation sequencing. Curr Opin Genet Dev 22:3-9, 2012
54. Ciriello G, Gatza ML, Beck AH, et al: Comprehensive Molecular
Portraits of Invasive Lobular Breast Cancer. Cell 163:506-19, 2015
55. Nik-Zainal S, Davies H, Staaf J, et al: Landscape of somatic
mutations in 560 breast cancer whole-genome sequences. Nature 534:47-54,
2016
56. Cancer Genome Atlas N: Comprehensive molecular portraits of
human breast tumours. Nature 490:61-70, 2012
57. Shaw AT, Yeap BY, Mino-Kenudson M, et al: Clinical features and
outcome of patients with non-small-cell lung cancer who harbor EML4-ALK. J Clin
Oncol 27:4247-53, 2009
58. Yoshihara K, Wang Q, Torres-Garcia W, et al: The landscape and
therapeutic relevance of cancer-associated transcript fusions. Oncogene 34:4845-
54, 2015
59. Desmedt C, Zoppoli G, Gundem G, et al: Genomic Characterization
of Primary Invasive Lobular Breast Cancer. J Clin Oncol 34:1872-81, 2016
141
60. Hyman DM, Solit DB, Arcila ME, et al: Precision medicine at
Memorial Sloan Kettering Cancer Center: clinical next-generation sequencing
enabling next-generation targeted therapy trials. Drug Discov Today 20:1422-8,
2015
61. Rodon J, Saura C, Dienstmann R, et al: Molecular prescreening to
select patient population in early clinical trials. Nat Rev Clin Oncol 9:359-66, 2012
62. Meric-Bernstam F, Brusco L, Shaw K, et al: Feasibility of Large-
Scale Genomic Testing to Facilitate Enrollment Onto Genomically Matched
Clinical Trials. J Clin Oncol 33:2753-62, 2015
63. Andre F, Bachelot T, Commo F, et al: Comparative genomic
hybridisation array and DNA sequencing to direct treatment of metastatic breast
cancer: a multicentre, prospective trial (SAFIR01/UNICANCER). Lancet Oncol
15:267-74, 2014
64. Zardavas D, Maetens M, Irrthum A, et al: The AURORA initiative for
metastatic breast cancer. Br J Cancer 111:1881-7, 2014
65. Engelman JA, Luo J, Cantley LC: The evolution of
phosphatidylinositol 3-kinases as regulators of growth and metabolism. Nat Rev
Genet 7:606-19, 2006
66. Vanhaesebroeck B, Stephens L, Hawkins P: PI3K signalling: the
path to discovery and understanding. Nat Rev Mol Cell Biol 13:195-203, 2012
67. Yuan TL, Cantley LC: PI3K pathway alterations in cancer: variations
on a theme. Oncogene 27:5497-510, 2008
68. Courtney KD, Corcoran RB, Engelman JA: The PI3K pathway as
drug target in human cancer. J Clin Oncol 28:1075-83, 2010
69. Engelman JA: Targeting PI3K signalling in cancer: opportunities,
challenges and limitations. Nat Rev Cancer 9:550-62, 2009
142
70. Katso R, Okkenhaug K, Ahmadi K, et al: Cellular function of
phosphoinositide 3-kinases: implications for development, homeostasis, and
cancer. Annu Rev Cell Dev Biol 17:615-75, 2001
71. Amzel LM, Huang CH, Mandelker D, et al: Structural comparisons of
class I phosphoinositide 3-kinases. Nat Rev Cancer 8:665-9, 2008
72. Gewinner C, Wang ZC, Richardson A, et al: Evidence that inositol
polyphosphate 4-phosphatase type II is a tumor suppressor that inhibits PI3K
signaling. Cancer Cell 16:115-25, 2009
73. Meric-Bernstam F, Gonzalez-Angulo AM: Targeting the mTOR
signaling network for cancer therapy. J Clin Oncol 27:2278-87, 2009
74. Kang S, Bader AG, Vogt PK: Phosphatidylinositol 3-kinase mutations
identified in human cancer are oncogenic. Proc Natl Acad Sci U S A 102:802-7,
2005
75. Kang S, Denley A, Vanhaesebroeck B, et al: Oncogenic
transformation induced by the p110beta, -gamma, and -delta isoforms of class I
phosphoinositide 3-kinase. Proc Natl Acad Sci U S A 103:1289-94, 2006
76. Denley A, Gymnopoulos M, Kang S, et al: Requirement of
phosphatidylinositol(3,4,5)trisphosphate in phosphatidylinositol 3-kinase-induced
oncogenic transformation. Mol Cancer Res 7:1132-8, 2009
77. Isakoff SJ, Engelman JA, Irie HY, et al: Breast cancer-associated
PIK3CA mutations are oncogenic in mammary epithelial cells. Cancer Res
65:10992-1000, 2005
78. Lopez-Knowles E, O'Toole SA, McNeil CM, et al: PI3K pathway
activation in breast cancer is associated with the basal-like phenotype and cancer-
specific mortality. Int J Cancer 126:1121-31, 2010
79. Gao J, Aksoy BA, Dogrusoz U, et al: Integrative analysis of complex
cancer genomics and clinical profiles using the cBioPortal. Sci Signal 6:pl1, 2013
143
80. Cerami E, Gao J, Dogrusoz U, et al: The cBio cancer genomics
portal: an open platform for exploring multidimensional cancer genomics data.
Cancer Discov 2:401-4, 2012
81. Pereira B, Chin SF, Rueda OM, et al: The somatic mutation profiles
of 2,433 breast cancers refines their genomic and transcriptomic landscapes. Nat
Commun 7:11479, 2016
82. Stemke-Hale K, Gonzalez-Angulo AM, Lluch A, et al: An integrative
genomic and proteomic analysis of PIK3CA, PTEN, and AKT mutations in breast
cancer. Cancer Res 68:6084-91, 2008
83. Kalinsky K, Jacks LM, Heguy A, et al: PIK3CA mutation associates
with improved outcome in breast cancer. Clin Cancer Res 15:5049-59, 2009
84. Dieci MV, Prat A, Tagliafico E, et al: Integrated evaluation of PAM50
subtypes and immune modulation of pCR in HER2-positive breast cancer patients
treated with chemotherapy and HER2-targeted agents in the CherLOB trial. Ann
Oncol, 2016
85. Prat A, Carey LA, Adamo B, et al: Molecular features and survival
outcomes of the intrinsic subtypes within HER2-positive breast cancer. J Natl
Cancer Inst 106, 2014
86. Prat A, Bianchini G, Thomas M, et al: Research-based PAM50
subtype predictor identifies higher responses and improved survival outcomes in
HER2-positive breast cancer in the NOAH study. Clin Cancer Res 20:511-21,
2014
87. Giacomini CP, Sun S, Varma S, et al: Breakpoint analysis of
transcriptional and genomic profiles uncovers novel gene fusions spanning
multiple human cancer types. PLoS Genet 9:e1003464, 2013
88. West JA, Davis CP, Sunwoo H, et al: The long noncoding RNAs
NEAT1 and MALAT1 bind active chromatin sites. Mol Cell 55:791-802, 2014
144
89. Curtis C, Shah SP, Chin SF, et al: The genomic and transcriptomic
architecture of 2,000 breast tumours reveals novel subgroups. Nature 486:346-52,
2012
90. Dienstmann R, Rodon J, Serra V, et al: Picking the point of inhibition:
a comparative review of PI3K/AKT/mTOR pathway inhibitors. Mol Cancer Ther
13:1021-31, 2014
91. Rodon J, Dienstmann R, Serra V, et al: Development of PI3K
inhibitors: lessons learned from early clinical trials. Nat Rev Clin Oncol 10:143-53,
2013
92. Hudes G, Carducci M, Tomczak P, et al: Temsirolimus, interferon
alfa, or both for advanced renal-cell carcinoma. N Engl J Med 356:2271-81, 2007
93. Motzer RJ, Escudier B, Oudard S, et al: Phase 3 trial of everolimus
for metastatic renal cell carcinoma : final results and analysis of prognostic factors.
Cancer 116:4256-65, 2010
94. Wolff AC, Lazar AA, Bondarenko I, et al: Randomized phase III
placebo-controlled trial of letrozole plus oral temsirolimus as first-line endocrine
therapy in postmenopausal women with locally advanced or metastatic breast
cancer. J Clin Oncol 31:195-202, 2013
95. Royce MV, C.; Ozguroglu, M.; Bachelot, T.; Azevedo, S.; Melo Cruz,
F.; Hegg, R.; Debled, M.; Gradishar, W.J.; Manlius, C.; Ridolfi, A.; Lin, J.;
Ringeisen, J.; Cardoso, F.: BOLERO-4: Phase 2 trial of first-line everolimus (EVE)
plus letrozole (LET) in estrogen receptor–positive (ER+), human epidermal growth
factor receptor 2–negative (HER2−) advanced breast cancer (BC). Annals of
Oncology 27:222O, 2016
96. Baselga J, Campone M, Piccart M, et al: Everolimus in
postmenopausal hormone-receptor-positive advanced breast cancer. N Engl J
Med 366:520-9, 2012
145
97. Yardley DA, Noguchi S, Pritchard KI, et al: Everolimus plus
exemestane in postmenopausal patients with HR(+) breast cancer: BOLERO-2
final progression-free survival analysis. Adv Ther 30:870-84, 2013
98. Piccart M, Hortobagyi GN, Campone M, et al: Everolimus plus
exemestane for hormone-receptor-positive, human epidermal growth factor
receptor-2-negative advanced breast cancer: overall survival results from
BOLERO-2dagger. Ann Oncol 25:2357-62, 2014
99. Bachelot T, Bourgier C, Cropet C, et al: Randomized phase II trial of
everolimus in combination with tamoxifen in patients with hormone receptor-
positive, human epidermal growth factor receptor 2-negative metastatic breast
cancer with prior exposure to aromatase inhibitors: a GINECO study. J Clin Oncol
30:2718-24, 2012
100. Hurvitz SA, Andre F, Jiang Z, et al: Combination of everolimus with
trastuzumab plus paclitaxel as first-line treatment for patients with HER2-positive
advanced breast cancer (BOLERO-1): a phase 3, randomised, double-blind,
multicentre trial. Lancet Oncol 16:816-29, 2015
101. Andre F, O'Regan R, Ozguroglu M, et al: Everolimus for women with
trastuzumab-resistant, HER2-positive, advanced breast cancer (BOLERO-3): a
randomised, double-blind, placebo-controlled phase 3 trial. Lancet Oncol 15:580-
91, 2014
102. Zheng B, Mao JH, Qian L, et al: Pre-clinical evaluation of AZD-2014,
a novel mTORC1/2 dual inhibitor, against renal cell carcinoma. Cancer Lett
357:468-75, 2015
103. Hamilton EPP, M.P.; Gluck, W.L.; Weise, A.M.; Pant, S.; Jones, S.F.;
LoRusso, P.; Kittaneh, M.; Cosulich, S.; Harrington, E.A.; Littlewood, G.; Oelmann,
E.M.; Burris, H.A.: A phase I study of continuous (Con) and intermittent (Int)
AZD2014 plus fulvestrant (F) in patients (pts) with estrogen receptor (ER+)
metastatic breast cancer (BC). Presented at the 2016 ASCO Annual Meeting,
Chicago, 2016
146
104. Roda DW, H.H.; Geuna, E.; Rafii, S.; Ruddle, R.; Hayes, A.; Swales,
K.E.; Stimpson, S.J.; Sathiyayogan, N.; Tunariu, N.; Turner, A.J.; Hall, E.; Yap,
T.A.; Banerjee, S.N.; O'Brien, M.E.R.; Molife, L.R.; Kaye, S.B.; De Bono, J.S.;
Basu, B.; Banerji, U.: TAX-TORC: A phase I trial of the combination of AZD2014
(dual mTORC1/mTORC2 inhibitor) and weekly paclitaxel in patients with solid
tumors. Presented at the ASCO 2014 Annual Meeting, Chicago, 2014
105. Dolly SO, Wagner AJ, Bendell JC, et al: Phase I Study of Apitolisib
(GDC-0980), Dual Phosphatidylinositol-3-Kinase and Mammalian Target of
Rapamycin Kinase Inhibitor, in Patients with Advanced Solid Tumors. Clin Cancer
Res 22:2874-84, 2016
106. Krop IE, Mayer IA, Ganju V, et al: Pictilisib for oestrogen receptor-
positive, aromatase inhibitor-resistant, advanced or metastatic breast cancer
(FERGI): a randomised, double-blind, placebo-controlled, phase 2 trial. Lancet
Oncol 17:811-21, 2016
107. Papadopoulos KP, Tabernero J, Markman B, et al: Phase I safety,
pharmacokinetic, and pharmacodynamic study of SAR245409 (XL765), a novel,
orally administered PI3K/mTOR inhibitor in patients with advanced solid tumors.
Clin Cancer Res 20:2445-56, 2014
108. Ma CX, Luo J, Naughton M, et al: A Phase I Trial of BKM120
(Buparlisib) in Combination with Fulvestrant in Postmenopausal Women with
Estrogen Receptor-Positive Metastatic Breast Cancer. Clin Cancer Res 22:1583-
91, 2016
109. Bedard PL, Tabernero J, Janku F, et al: A phase Ib dose-escalation
study of the oral pan-PI3K inhibitor buparlisib (BKM120) in combination with the
oral MEK1/2 inhibitor trametinib (GSK1120212) in patients with selected advanced
solid tumors. Clin Cancer Res 21:730-8, 2015
110. Mayer IA, Abramson VG, Isakoff SJ, et al: Stand up to cancer phase
Ib study of pan-phosphoinositide-3-kinase inhibitor buparlisib with letrozole in
147
estrogen receptor-positive/human epidermal growth factor receptor 2-negative
metastatic breast cancer. J Clin Oncol 32:1202-9, 2014
111. Saura C, Bendell J, Jerusalem G, et al: Phase Ib study of Buparlisib
plus Trastuzumab in patients with HER2-positive advanced or metastatic breast
cancer that has progressed on Trastuzumab-based therapy. Clin Cancer Res
20:1935-45, 2014
112. Bendell JC, Rodon J, Burris HA, et al: Phase I, dose-escalation study
of BKM120, an oral pan-Class I PI3K inhibitor, in patients with advanced solid
tumors. J Clin Oncol 30:282-90, 2012
113. Sarker D, Ang JE, Baird R, et al: First-in-human phase I study of
pictilisib (GDC-0941), a potent pan-class I phosphatidylinositol-3-kinase (PI3K)
inhibitor, in patients with advanced solid tumors. Clin Cancer Res 21:77-86, 2015
114. Schmid P, Pinder SE, Wheatley D, et al: Phase II Randomized
Preoperative Window-of-Opportunity Study of the PI3K Inhibitor Pictilisib Plus
Anastrozole Compared With Anastrozole Alone in Patients With Estrogen
Receptor-Positive Breast Cancer. J Clin Oncol 34:1987-94, 2016
115. Shapiro GI, Rodon J, Bedell C, et al: Phase I safety,
pharmacokinetic, and pharmacodynamic study of SAR245408 (XL147), an oral
pan-class I PI3K inhibitor, in patients with advanced solid tumors. Clin Cancer Res
20:233-45, 2014
116. Baselga J, Im S-A, Iwata H, et al: Abstract S6-01: PIK3CA status in
circulating tumor DNA (ctDNA) predicts efficacy of buparlisib (BUP) plus
fulvestrant (FULV) in postmenopausal women with endocrine-resistant
HR+/HER2– advanced breast cancer (BC): First results from the randomized,
phase III BELLE-2 trial. Cancer Research 76:S6-01-S6-01, 2016
117. Di Leo ASL, K.; Ciruelos, E.; Lønning, P.; Janni, W.; O'Regan, R.;
Mouret Reynier, M.A.; Kalev, D.; Egle, D.; Csoszi, T.; Bordonaro, R.; Decker, T.;
Tjan-Heijnen, V.C.; Blau, S.; Schirone, A.; Weber, D.; El-Hashimy, M.; Dharan, B.;
Sellami, D.; Bachelot, T BELLE-3: A phase III study of buparlisib + fulvestrant in
148
postmenopausal women with HR+, HER2–, aromatase inhibitor-treated, locally
advanced or metastatic breast cancer, who progressed on or after mTOR inhibitor-
based treatment. Presented at the San Antonio Breast Cancer Symposium, San
Antonio, Texas, 2016
118. O'Brien NA, McDonald K, Tong L, et al: Targeting PI3K/mTOR
overcomes resistance to HER2-targeted therapy independent of feedback
activation of AKT. Clin Cancer Res 20:3507-20, 2014
119. Martin M, Chan A, Dirix L, et al: A randomized adaptive phase II/III
study of buparlisib, a pan-class I PI3K inhibitor, combined with paclitaxel for the
treatment of HER2- advanced breast cancer (BELLE-4). Ann Oncol, 2016
120. Matulonis UA, Wulf G, Barry W, et al: Abstract CT324: Phase I of
oral BKM120 or BYL719 and olaparib for high-grade serous ovarian cancer or
triple-negative breast cancer: Final results of the BKM120 plus olaparib cohort.
Cancer Research 75:CT324-CT324, 2015
121. Vuylsteke P, Huizing M, Petrakova K, et al: Pictilisib PI3Kinase
inhibitor (a phosphatidylinositol 3-kinase [PI3K] inhibitor) plus paclitaxel for the
treatment of hormone receptor-positive, HER2-negative, locally recurrent, or
metastatic breast cancer: interim analysis of the multicentre, placebo-controlled,
phase II randomised PEGGY study. Ann Oncol 27:2059-2066, 2016
122. Furet P, Guagnano V, Fairhurst RA, et al: Discovery of NVP-BYL719
a potent and selective phosphatidylinositol-3 kinase alpha inhibitor selected for
clinical evaluation. Bioorg Med Chem Lett 23:3741-8, 2013
123. Juric D, Burris H, Schuler M, et al: 451PDPHASE I STUDY OF THE
PI3Kα INHIBITOR BYL719, AS A SINGLE AGENT IN PATIENTS WITH
ADVANCED SOLID TUMORS (AST). Annals of Oncology 25:iv150, 2014
124. Mayer IA, Abramson VG, Formisano L, et al: A Phase Ib Study of
Alpelisib (BYL719), a PI3Kalpha-Specific Inhibitor, with Letrozole in ER+/HER2-
Metastatic Breast Cancer. Clin Cancer Res 23:26-34, 2017
149
125. Ndubaku CO, Heffron TP, Staben ST, et al: Discovery of 2-{3-[2-(1-
isopropyl-3-methyl-1H-1,2-4-triazol-5-yl)-5,6-dihydrobenzo[f]imidazo[1 ,2-
d][1,4]oxazepin-9-yl]-1H-pyrazol-1-yl}-2-methylpropanamide (GDC-0032): a beta-
sparing phosphoinositide 3-kinase inhibitor with high unbound exposure and
robust in vivo antitumor activity. J Med Chem 56:4597-610, 2013
126. Juric D, Krop I, Ramanathan RK, et al: Phase I Dose Escalation
Study of Taselisib (GDC-0032), an Oral PI3K Inhibitor, in Patients with Advanced
Solid Tumors. Cancer Discov, 2017
127. Saura C, Sachdev J, Patel MR, et al: Abstract PD5-2: Ph1b study of
the PI3K inhibitor taselisib (GDC-0032) in combination with letrozole in patients
with hormone receptor-positive advanced breast cancer. Cancer Research
75:PD5-2-PD5-2, 2015
128. Dickler MN, Saura C, Richards DA, et al: A phase II study of the
PI3K inhibitor taselisib (GDC-0032) combined with fulvestrant (F) in patients (pts)
with HER2-negative (HER2-), hormone receptor-positive (HR+) advanced breast
cancer (BC). J Clin Oncol 34:Abs520, 2016
129. Wu WI, Voegtli WC, Sturgis HL, et al: Crystal structure of human
AKT1 with an allosteric inhibitor reveals a new mode of kinase inhibition. PLoS
One 5:e12913, 2010
130. Vivanco I, Chen ZC, Tanos B, et al: A kinase-independent function of
AKT promotes cancer cell survival. Elife 3, 2014
131. Parikh C, Janakiraman V, Wu WI, et al: Disruption of PH-kinase
domain interactions leads to oncogenic activation of AKT in human cancers. Proc
Natl Acad Sci U S A 109:19368-73, 2012
132. Ma CX, Sanchez C, Gao F, et al: A Phase I Study of the AKT
Inhibitor MK-2206 in Combination with Hormonal Therapy in Postmenopausal
Women with Estrogen Receptor-Positive Metastatic Breast Cancer. Clin Cancer
Res 22:2650-8, 2016
150
133. Molife LR, Yan L, Vitfell-Rasmussen J, et al: Phase 1 trial of the oral
AKT inhibitor MK-2206 plus carboplatin/paclitaxel, docetaxel, or erlotinib in
patients with advanced solid tumors. J Hematol Oncol 7:1, 2014
134. Gonzalez-Angulo AM, Krop I, Akcakanat A, et al: SU2C phase Ib
study of paclitaxel and MK-2206 in advanced solid tumors and metastatic breast
cancer. J Natl Cancer Inst 107, 2015
135. Chien AJ, Cockerill A, Fancourt C, et al: A phase 1b study of the Akt-
inhibitor MK-2206 in combination with weekly paclitaxel and trastuzumab in
patients with advanced HER2-amplified solid tumor malignancies. Breast Cancer
Res Treat 155:521-30, 2016
136. Wisinski KB, Tevaarwerk AJ, Burkard ME, et al: Phase I Study of an
AKT Inhibitor (MK-2206) Combined with Lapatinib in Adult Solid Tumors Followed
by Dose Expansion in Advanced HER2+ Breast Cancer. Clin Cancer Res
22:2659-67, 2016
137. Berry DA: Adaptive clinical trials in oncology. Nat Rev Clin Oncol
9:199-207, 2012
138. Tripathy D, Chien AJ, Hylton N, et al: Adaptively randomized trial of
neoadjuvant chemotherapy with or without the Akt inhibitor MK-2206: Graduation
results from the I-SPY 2 Trial. J Clin Oncol 33, 2015
139. Lin J, Sampath D, Nannini MA, et al: Targeting activated Akt with
GDC-0068, a novel selective Akt inhibitor that is efficacious in multiple tumor
models. Clin Cancer Res 19:1760-72, 2013
140. Yan Y, Serra V, Prudkin L, et al: Evaluation and clinical analyses of
downstream targets of the Akt inhibitor GDC-0068. Clin Cancer Res 19:6976-86,
2013
141. Lin J, Sampath D, Nannini MA, et al: Targeting Activated Akt with
GDC-0068, a Novel Selective Akt Inhibitor That Is Efficacious in Multiple Tumor
Models. Clinical Cancer Research 19:1760-1772, 2013
151
142. Saura C, Roda D, Rosello S, et al: A First-in-Human Phase I Study
of the ATP-Competitive AKT Inhibitor Ipatasertib Demonstrates Robust and Safe
Targeting of AKT in Patients with Solid Tumors. Cancer Discov 7:102-113, 2017
143. Clark AS, West K, Streicher S, et al: Constitutive and inducible Akt
activity promotes resistance to chemotherapy, trastuzumab, or tamoxifen in breast
cancer cells. Mol Cancer Ther 1:707-17, 2002
144. Isakoff SJ, Bendell JC, Cervantes A, et al: Abstract P6-12-02: Phase
Ib dose-escalation study of an Akt inhibitor ipatasertib (Ipat) in combination with
docetaxel (Doc) or paclitaxel (Pac) in patients (pts) with metastatic breast cancer
(MBC). Cancer Research 75:P6-12-02-P6-12-02, 2015
145. Davies BR, Greenwood H, Dudley P, et al: Preclinical pharmacology
of AZD5363, an inhibitor of AKT: pharmacodynamics, antitumor activity, and
correlation of monotherapy activity with genetic background. Mol Cancer Ther
11:873-87, 2012
146. Tamura K, Hashimoto J, Tanabe Y, et al: Safety and tolerability of
AZD5363 in Japanese patients with advanced solid tumors. Cancer Chemother
Pharmacol 77:787-95, 2016
147. Banerji UD, E.J.; Perez-Fidalgo, J.A.; Batist, G.; Bedard, P.L.; You,
B.; Westin, S.N.; Kabos, P.; Davies, B.; Elvin, P.; Lawrence, P.; Yates, J.W.T.;
Ambrose, H.; Rugman, P.; Foxley, A.; Salim, S.; Casson, E.; Lindemann, J.P.O.;
Schellens, J.H.M.: A pharmacokinetically (PK) and pharmacodynamically (PD)
driven phase I trial of the pan-AKT inhibitor AZD5363 with expansion cohorts in
PIK3CA mutant breast and gynecological cancers. Presented at the ASCO Annual
Meeting, Chicago, 2015
148. Hyman DM, Smyth L, Bedard PL, et al: Abstract B109: AZD5363, a
catalytic pan-Akt inhibitor, in <em>Akt1</em> E17K mutation positive advanced
solid tumors. Molecular Cancer Therapeutics 14:B109-B109, 2015
149. Smyth LMR, J.B.; Tang, J.; Patel, J.A.A.; Meng, F.; Selcuklu, S.D.;
You, D.; Samoila, A.; Schiavon, G.; Li, B.T.; Razavi, P.; Piscuoglio, S.; Reis-Filho,
152
J.S.; Hudis, C.A.; Baselga, J.; Solit, D.B.; Taylor, B.S.; Hyman, D.M.; Berger, M.F.;
Chandarlapaty, S.: Serial next generation sequencing (NGS) of cell free DNA
(cfDNA) and clonal evolution of AKT1 E17K mutant tumors: Analyses from
patients (pts) enrolled on a phase I basket study of an AKT inhibitor (AZD5363).
Presented at the ASCO Annual Meeting, Chicago, 2016
150. Turner NC, Oliveira M, Armstrong A, et al: Abstract CT331:
“BEECH”, a phase I/II study of the AKT inhibitor AZD5363 combined with
paclitaxel in patients with advanced or metastatic breast cancer: results from the
dose-finding study, including quantitative assessment of circulating tumor DNA as
a s. Cancer Research 75:CT331-CT331, 2015
151. Guidance for Industry. E15 Definitions for Genomic Biomarkers,
Pharmacogenomics, Pharmacogenetics, Genomic Data and Sample Coding
Categories, in U.S. Department of Health and Human Services FaDA, Center for
Drug Evaluation and Research (CDER), Center for Biologics Evaluation and
Research (CBER) (ed), 2008
152. Ballman KV: Biomarker: Predictive or Prognostic? Journal of Clinical
Oncology 33:3968-3971, 2015
153. Hortobagyi GN, Chen D, Piccart M, et al: Correlative Analysis of
Genetic Alterations and Everolimus Benefit in Hormone Receptor-Positive, Human
Epidermal Growth Factor Receptor 2-Negative Advanced Breast Cancer: Results
From BOLERO-2. J Clin Oncol 34:419-26, 2016
154. Treilleux I, Arnedos M, Cropet C, et al: Translational studies within
the TAMRAD randomized GINECO trial: evidence for mTORC1 activation marker
as a predictive factor for everolimus efficacy in advanced breast cancer. Ann
Oncol 26:120-5, 2015
155. Andre F, Hurvitz S, Fasolo A, et al: Molecular Alterations and
Everolimus Efficacy in Human Epidermal Growth Factor Receptor 2-
Overexpressing Metastatic Breast Cancers: Combined Exploratory Biomarker
Analysis From BOLERO-1 and BOLERO-3. J Clin Oncol 34:2115-24, 2016
153
156. Maugeri-Sacca M, Barba M, Vici P, et al: Presurgical window of
opportunity trial design as a platform for testing anticancer drugs: Pros, cons and a
focus on breast cancer. Crit Rev Oncol Hematol 106:132-42, 2016
157. Rodon J, Juric D, Gonzalez-Angulo A-M, et al: Abstract LB-65:
Towards defining the genetic framework for clinical response to treatment with
BYL719, a PI3Kalpha-specific inhibitor. Cancer Research 73:LB-65-LB-65, 2013
158. Kim A, Lee JE, Lee SS, et al: Coexistent mutations of KRAS and
PIK3CA affect the efficacy of NVP-BEZ235, a dual PI3K/MTOR inhibitor, in
regulating the PI3K/MTOR pathway in colorectal cancer. Int J Cancer 133:984-96,
2013
159. Wilson TR, Savage H, O'Brien C, et al: Abstract 915: Expanded
biomarker results from a phase I dose escalation study of GDC-0032, a beta
isoform-sparing PI3K inhibitor. Cancer Research 74:915-915, 2014
160. Drilon A, Wang L, Arcila ME, et al: Broad, Hybrid Capture-Based
Next-Generation Sequencing Identifies Actionable Genomic Alterations in Lung
Adenocarcinomas Otherwise Negative for Such Alterations by Other Genomic
Testing Approaches. Clin Cancer Res 21:3631-9, 2015
161. Tsimberidou AM, Wen S, Hong DS, et al: Personalized medicine for
patients with advanced cancer in the phase I program at MD Anderson: validation
and landmark analyses. Clin Cancer Res 20:4827-36, 2014
162. Tsimberidou AM, Iskander NG, Hong DS, et al: Personalized
medicine in a phase I clinical trials program: the MD Anderson Cancer Center
initiative. Clin Cancer Res 18:6373-83, 2012
163. Von Hoff DD, Stephenson JJ, Jr., Rosen P, et al: Pilot study using
molecular profiling of patients' tumors to find potential targets and select
treatments for their refractory cancers. J Clin Oncol 28:4877-83, 2010
164. Press MF, Sauter G, Buyse M, et al: HER2 Gene Amplification
Testing by Fluorescent In Situ Hybridization (FISH): Comparison of the ASCO-
154
College of American Pathologists Guidelines With FISH Scores Used for
Enrollment in Breast Cancer International Research Group Clinical Trials. Journal
of Clinical Oncology 34:3518-3528, 2016
165. Dienstmann R, Cervantes A: Heterogeneity of driver genes and
therapeutic implications in colorectal cancer. Ann Oncol 26:1523-5, 2015
166. Dienstmann RE, E.; Matos, I.; Sanz-Garcia, E.; Ortiz, C.; Argiles, G.;
Macarulla, T.; Capdevila, J.; Alsina, M.; Sauri, T.; Graselli, J.; Verdaguer, H.;
Vilaro, M.; Ruiz, F.; Garcia, A.; Landolfi, S.; Palmer, H.G.; Nuciforo, P.; Vivancos,
A.; Tabernero, J.: Clonality patterns of driver mutations (mut) to reveal spatial-
temporal genomic heterogeneity in colorectal cancer (CRC). J Clin Oncol 24
Suppl; Abstract 3509, 2016
167. Andre F, Bachelot T, Campone M, et al: Targeting FGFR with
dovitinib (TKI258): preclinical and clinical data in breast cancer. Clin Cancer Res
19:3693-702, 2013
168. Soria JC, DeBraud F, Bahleda R, et al: Phase I/IIa study evaluating
the safety, efficacy, pharmacokinetics, and pharmacodynamics of lucitanib in
advanced solid tumors. Ann Oncol 25:2244-51, 2014
169. Eisenhauer EA, Therasse P, Bogaerts J, et al: New response
evaluation criteria in solid tumours: revised RECIST guideline (version 1.1). Eur J
Cancer 45:228-47, 2009
170. Petrilli AM, Fuse MA, Donnan MS, et al: A chemical biology
approach identified PI3K as a potential therapeutic target for neurofibromatosis
type 2. Am J Transl Res 6:471-93, 2014
171. Moulder S, Helgason T, Janku F, et al: Inhibition of the
phosphoinositide 3-kinase pathway for the treatment of patients with metastatic
metaplastic breast cancer. Ann Oncol 26:1346-52, 2015
155
172. Stockley TL, Oza AM, Berman HK, et al: Molecular profiling of
advanced solid tumors and patient outcomes with genotype-matched clinical trials:
the Princess Margaret IMPACT/COMPACT trial. Genome Med 8:109, 2016
173. Juric D, Isakoff SJ, Borger DR, et al: Impact of routine tumor
genotyping on enrollment in targeted therapy trials for metastatic breast cancer
(MBC): 4-year review. Journal of Clinical Oncology 31:145-145, 2013
174. Swanton C, Soria JC, Bardelli A, et al: Consensus on precision
medicine for metastatic cancers: a report from the MAP conference. Ann Oncol
27:1443-8, 2016
175. Basho RK, de Melo Gagliato D, Ueno NT, et al: Clinical outcomes
based on multigene profiling in metastatic breast cancer patients. Oncotarget
7:76362-76373, 2016
176. Lehmann BD, Bauer JA, Schafer JM, et al: PIK3CA mutations in
androgen receptor-positive triple negative breast cancer confer sensitivity to the
combination of PI3K and androgen receptor inhibitors. Breast Cancer Res 16:406,
2014
177. Jain VK, Turner NC: Challenges and opportunities in the targeting of
fibroblast growth factor receptors in breast cancer. Breast Cancer Res 14:208,
2012
178. Elbauomy Elsheikh S, Green AR, Lambros MB, et al: FGFR1
amplification in breast carcinomas: a chromogenic in situ hybridisation analysis.
Breast Cancer Res 9:R23, 2007
179. Turner N, Pearson A, Sharpe R, et al: FGFR1 amplification drives
endocrine therapy resistance and is a therapeutic target in breast cancer. Cancer
Res 70:2085-94, 2010
180. Jeselsohn R, Buchwalter G, De Angelis C, et al: ESR1 mutations-a
mechanism for acquired endocrine resistance in breast cancer. Nat Rev Clin
Oncol 12:573-83, 2015
156
181. Bose R, Kavuri SM, Searleman AC, et al: Activating HER2 mutations
in HER2 gene amplification negative breast cancer. Cancer Discov 3:224-37, 2013
182. Ross JS, Gay LM, Wang K, et al: Nonamplification ERBB2 genomic
alterations in 5605 cases of recurrent and metastatic breast cancer: An emerging
opportunity for anti-HER2 targeted therapies. Cancer 122:2654-62, 2016
183. Hyman D, Piha-Paul S, Rodón J, et al: Abstract PD5-05: Neratinib
for <em>ERBB2</em> mutant, HER2 non-amplified, metastatic breast cancer:
Preliminary analysis from a multicenter, open-label, multi-histology phase II basket
trial. Cancer Research 76:PD5-05-PD5-05, 2016
184. Majewski IJ, Nuciforo P, Mittempergher L, et al: PIK3CA mutations
are associated with decreased benefit to neoadjuvant human epidermal growth
factor receptor 2-targeted therapies in breast cancer. J Clin Oncol 33:1334-9, 2015
185. Baselga J, Lewis Phillips GD, Verma S, et al: Relationship between
Tumor Biomarkers and Efficacy in EMILIA, a Phase III Study of Trastuzumab
Emtansine in HER2-Positive Metastatic Breast Cancer. Clin Cancer Res 22:3755-
63, 2016
186. Baselga J, Cortes J, Im SA, et al: Biomarker analyses in
CLEOPATRA: a phase III, placebo-controlled study of pertuzumab in human
epidermal growth factor receptor 2-positive, first-line metastatic breast cancer. J
Clin Oncol 32:3753-61, 2014
187. Nanda R, Chow LQ, Dees EC, et al: Pembrolizumab in Patients With
Advanced Triple-Negative Breast Cancer: Phase Ib KEYNOTE-012 Study. J Clin
Oncol 34:2460-7, 2016
188. Cardillo TM, Sharkey RM, Rossi DL, et al: Synthetic lethality
exploitation by an anti-Trop-2-SN-38 antibody-drug conjugate, IMMU-132, plus
PARP-inhibitors in BRCA1/2-wild-type triple-negative breast cancer. Clin Cancer
Res, 2017
157
189. Kim ES, Herbst RS, Wistuba, II, et al: The BATTLE trial:
personalizing therapy for lung cancer. Cancer Discov 1:44-53, 2011
190. Cunanan KM, Gonen M, Shen R, et al: Basket Trials in Oncology: A
Trade-Off Between Complexity and Efficiency. J Clin Oncol 35:271-273, 2017
191. Prahallad A, Sun C, Huang S, et al: Unresponsiveness of colon
cancer to BRAF(V600E) inhibition through feedback activation of EGFR. Nature
483:100-3, 2012
192. Hyman DM, Puzanov I, Subbiah V, et al: Vemurafenib in Multiple
Nonmelanoma Cancers with BRAF V600 Mutations. N Engl J Med 373:726-36,
2015
193. Nik-Zainal S, Van Loo P, Wedge DC, et al: The life history of 21
breast cancers. Cell 149:994-1007, 2012
194. Murtaza M, Dawson SJ, Pogrebniak K, et al: Multifocal clonal
evolution characterized using circulating tumour DNA in a case of metastatic
breast cancer. Nat Commun 6:8760, 2015
195. Bertucci F, Finetti P, Guille A, et al: Comparative genomic analysis of
primary tumors and metastases in breast cancer. Oncotarget 7:27208-19, 2016
196. Toy W, Shen Y, Won H, et al: ESR1 ligand-binding domain
mutations in hormone-resistant breast cancer. Nat Genet 45:1439-45, 2013
197. Jeselsohn R, Yelensky R, Buchwalter G, et al: Emergence of
constitutively active estrogen receptor-alpha mutations in pretreated advanced
estrogen receptor-positive breast cancer. Clin Cancer Res 20:1757-67, 2014
198. Schiavon G, Hrebien S, Garcia-Murillas I, et al: Analysis of ESR1
mutation in circulating tumor DNA demonstrates evolution during therapy for
metastatic breast cancer. Sci Transl Med 7:313ra182, 2015
158
199. Fribbens C, O'Leary B, Kilburn L, et al: Plasma ESR1 Mutations and
the Treatment of Estrogen Receptor-Positive Advanced Breast Cancer. J Clin
Oncol 34:2961-8, 2016
200. Lefebvre C, Bachelot T, Filleron T, et al: Mutational Profile of
Metastatic Breast Cancers: A Retrospective Analysis. PLoS Med 13:e1002201,
2016
201. Le Tourneau C, Delord JP, Goncalves A, et al: Molecularly targeted
therapy based on tumour molecular profiling versus conventional therapy for
advanced cancer (SHIVA): a multicentre, open-label, proof-of-concept,
randomised, controlled phase 2 trial. Lancet Oncol 16:1324-34, 2015
202. Iyer G, Hanrahan AJ, Milowsky MI, et al: Genome sequencing
identifies a basis for everolimus sensitivity. Science 338:221, 2012
203. Burrell RA, McGranahan N, Bartek J, et al: The causes and
consequences of genetic heterogeneity in cancer evolution. Nature 501:338-45,
2013
204. Yates LR, Campbell PJ: Evolution of the cancer genome. Nat Rev
Genet 13:795-806, 2012
205. Yap TA, Gerlinger M, Futreal PA, et al: Intratumor heterogeneity:
seeing the wood for the trees. Sci Transl Med 4:127ps10, 2012
206. McGranahan N, Favero F, de Bruin EC, et al: Clonal status of
actionable driver events and the timing of mutational processes in cancer
evolution. Sci Transl Med 7:283ra54, 2015
207. Laskin J, Jones S, Aparicio S, et al: Lessons learned from the
application of whole-genome analysis to the treatment of patients with advanced
cancers. Cold Spring Harb Mol Case Stud 1:a000570, 2015
208. Miller TW, Hennessy BT, Gonzalez-Angulo AM, et al:
Hyperactivation of phosphatidylinositol-3 kinase promotes escape from hormone
159
dependence in estrogen receptor-positive human breast cancer. J Clin Invest
120:2406-13, 2010
209. Esteva FJ, Guo H, Zhang S, et al: PTEN, PIK3CA, p-AKT, and p-
p70S6K status: association with trastuzumab response and survival in patients
with HER2-positive metastatic breast cancer. Am J Pathol 177:1647-56, 2010
210. Serra V, Gris-Oliver A, Saura C, et al: Abstract P5-08-06: PI3K
blockade enhances the antitumor activity of eribulin in PIK3CA-mutant eribulin-
resistant tumor xenografts. Cancer Research 73:P5-08-06-P5-08-06, 2013
211. O'Brien C, Wallin JJ, Sampath D, et al: Predictive biomarkers of
sensitivity to the phosphatidylinositol 3' kinase inhibitor GDC-0941 in breast cancer
preclinical models. Clin Cancer Res 16:3670-83, 2010
212. Miller TW, Balko JM, Arteaga CL: Phosphatidylinositol 3-kinase and
antiestrogen resistance in breast cancer. J Clin Oncol 29:4452-61, 2011
213. Garcia-Garcia C, Ibrahim YH, Serra V, et al: Dual mTORC1/2 and
HER2 blockade results in antitumor activity in preclinical models of breast cancer
resistant to anti-HER2 therapy. Clin Cancer Res 18:2603-12, 2012
214. Hu L, Hofmann J, Lu Y, et al: Inhibition of phosphatidylinositol 3'-
kinase increases efficacy of paclitaxel in in vitro and in vivo ovarian cancer
models. Cancer Res 62:1087-92, 2002
215. Tannock IF, Hickman JA: Limits to Personalized Cancer Medicine. N
Engl J Med 375:1289-94, 2016
216. Voest EE, Bernards R: DNA-Guided Precision Medicine for Cancer:
A Case of Irrational Exuberance? Cancer Discov 6:130-2, 2016
217. Zhou Q, Zhang XC, Chen ZH, et al: Relative abundance of EGFR
mutations predicts benefit from gefitinib treatment for advanced non-small-cell lung
cancer. J Clin Oncol 29:3316-21, 2011
160
218. Ono A, Kenmotsu H, Watanabe M, et al: Mutant allele frequency
predicts the efficacy of EGFR-TKIs in lung adenocarcinoma harboring the L858R
mutation. Ann Oncol 25:1948-53, 2014
219. Misale S, Yaeger R, Hobor S, et al: Emergence of KRAS mutations
and acquired resistance to anti-EGFR therapy in colorectal cancer. Nature
486:532-6, 2012
220. Laurent-Puig P, Pekin D, Normand C, et al: Clinical relevance of
KRAS-mutated subclones detected with picodroplet digital PCR in advanced
colorectal cancer treated with anti-EGFR therapy. Clin Cancer Res 21:1087-97,
2015
221. Azuara D, Santos C, Lopez-Doriga A, et al: Nanofluidic Digital PCR
and Extended Genotyping of RAS and BRAF for Improved Selection of Metastatic
Colorectal Cancer Patients for Anti-EGFR Therapies. Mol Cancer Ther 15:1106-
12, 2016
222. Gavine PR, Mooney L, Kilgour E, et al: AZD4547: an orally
bioavailable, potent, and selective inhibitor of the fibroblast growth factor receptor
tyrosine kinase family. Cancer Res 72:2045-56, 2012
223. Pearson A, Smyth E, Babina IS, et al: High-Level Clonal FGFR
Amplification and Response to FGFR Inhibition in a Translational Clinical Trial.
Cancer Discov 6:838-51, 2016
224. Dowsett M, Procter M, McCaskill-Stevens W, et al: Disease-free
survival according to degree of HER2 amplification for patients treated with
adjuvant chemotherapy with or without 1 year of trastuzumab: the HERA Trial. J
Clin Oncol 27:2962-9, 2009
225. Loi S, Michiels S, Baselga J, et al: PIK3CA genotype and a PIK3CA
mutation-related gene signature and response to everolimus and letrozole in
estrogen receptor positive breast cancer. PLoS One 8:e53292, 2013
161
226. Loi S, Haibe-Kains B, Majjaj S, et al: PIK3CA mutations associated
with gene signature of low mTORC1 signaling and better outcomes in estrogen
receptor-positive breast cancer. Proc Natl Acad Sci U S A 107:10208-13, 2010
227. Dienstmann R, Jang IS, Bot B, et al: Database of genomic
biomarkers for cancer drugs and clinical targetability in solid tumors. Cancer
Discov 5:118-23, 2015
228. Ainscough BJ, Griffith M, Coffman AC, et al: DoCM: a database of
curated mutations in cancer. Nat Methods 13:806-7, 2016
229. Landrum MJ, Lee JM, Benson M, et al: ClinVar: public archive of
interpretations of clinically relevant variants. Nucleic Acids Res 44:D862-8, 2016
230. Rehm HL, Berg JS, Brooks LD, et al: ClinGen--the Clinical Genome
Resource. N Engl J Med 372:2235-42, 2015
231. Thorn CF, Klein TE, Altman RB: PharmGKB: the Pharmacogenomics
Knowledge Base. Methods Mol Biol 1015:311-20, 2013
232. Yeh P, Chen H, Andrews J, et al: DNA-Mutation Inventory to Refine
and Enhance Cancer Treatment (DIRECT): a catalog of clinically relevant cancer
mutations to enable genome-directed anticancer therapy. Clin Cancer Res
19:1894-901, 2013
233. Griffith M, Spies NC, Krysiak K, et al: CIViC is a community
knowledgebase for expert crowdsourcing the clinical interpretation of variants in
cancer. Nat Genet 49:170-174, 2017
234. Shaw AT, Ou SH, Bang YJ, et al: Crizotinib in ROS1-rearranged
non-small-cell lung cancer. N Engl J Med 371:1963-71, 2014
235. Doebele RC, Davis LE, Vaishnavi A, et al: An Oncogenic NTRK
Fusion in a Patient with Soft-Tissue Sarcoma with Response to the Tropomyosin-
Related Kinase Inhibitor LOXO-101. Cancer Discov 5:1049-57, 2015
162
236. De Mattos-Arruda L, Weigelt B, Cortes J, et al: Capturing intra-tumor
genetic heterogeneity by de novo mutation profiling of circulating cell-free tumor
DNA: a proof-of-principle. Ann Oncol 25:1729-35, 2014
237. Hyman DM, Taylor BS, Baselga J: Implementing Genome-Driven
Oncology. Cell 168:584-599, 2017
238. Cohen EN, Gao H, Anfossi S, et al: Inflammation Mediated
Metastasis: Immune Induced Epithelial-To-Mesenchymal Transition in
Inflammatory Breast Cancer Cells. PLoS One 10:e0132710, 2015
239. Hiken JF, McDonald JI, Decker KF, et al: Epigenetic activation of the
prostaglandin receptor EP4 promotes resistance to endocrine therapy for breast
cancer. Oncogene, 2016
240. Tang X, Lin CC, Spasojevic I, et al: A joint analysis of metabolomics
and genetics of breast cancer. Breast Cancer Res 16:415, 2014
163
Index of Tables
Table 1: Surrogate definitions of intrinsic breast cancer subtypes (St. Gallen
Consensus).
Table 2: Genes in Oncocarta used with Sequenom®.
Table 3: Genes in VHIO-Card v2 used with AmpliconSeq.
Table 4: Patients’ and samples characteristics (Complete cohort).
Table 5: Distribution of molecular alterations according to site of determination
(Complete Cohort).
Table 6: Alterations in relevant PAM pathway genes, according to breast cancer
subtype (Complete cohort).
Table 7: Other less frequent mutations and variants (Complete cohort).
Table 8: Prevalence of actionable alterations according to breast cancer subtype
(Complete cohort).
Table 9: Patients’ and samples characteristics (PAM pathway inhibitor Cohort).
Table 10: Treatment characteristics (PAM pathway inhibitor Cohort).
Table 11: Aberrations in genes of the PAM pathway (PAM pathway inhibitor
Cohort).
Table 12: Efficacy of treatment with PAM pathway inhibitors.
Table 13: Univariate analysis for clinical benefit to PAM pathway inhibitors.
Table 14: Univariate analysis for clinical benefit to PI3Kα-specific inhibitors.
Table 15: Multivariate model for TTF to PAM pathway inhibitors.
Table 16: Molecular alterations in breast cancer across different studies.
Table 17: Efficacy results of combination arms of trials with PAM pathway
inhibitors plus endocrine therapy.
Table 18: Efficacy results of combination arms of trials with PAM pathway
inhibitors plus chemotherapy.
Table 19: Efficacy results of combination arms of trials with PAM pathway
inhibitors plus anti-HER2 therapy.
164
Index of Figures
Figure 1: Estimated age-standardized incidence cases of breast cancer (women)
worldwide (2012).
Figure 2: Estimated age-standardized rates of deaths from breast cancer
(women) worldwide (2012).
Figure 3: Significantly mutated genes and correlations with genomic and clinical
features in TCGA.
Figure 4: SAFIR-01 Study design.
Figure 5: SAFIR-02 Study design.
Figure 6: The distinct classes of mammalian PI3Ks.
Figure 7: The PAM pathway signaling network.
Figure 8: Oncoprint from relevant PAM pathway genes (PIK3CA, AKT1, and
PTEN).
Figure 9: Kaplan-Meier curves for PFS by treatment arm for patient subgroups in
the BOLERO-2.
Figure 10: Forest plot of TTP with tamoxifen plus everolimus vs. tamoxifen alone
for each biomarker tested.
Figure 11: Kaplan-Meier curves for PFS by biomarker status in BOLERO-1 and
BOLERO-3 (pooled data).
Figure 12: Subtype distribution of the samples in the Complete Cohort.
Figure 13: Evolution of the number of molecular determinations in MBC over the
years.
Figure 14: Overall distribution of molecular aberrations in the Complete cohort.
Figure 15: Actionable alterations within each subtype (Complete cohort).
Figure 16: Heatmap of the samples with multiple actionable molecular alterations
(Complete cohort).
Figure 17: Adjusted MAF for PIK3CA (Complete Cohort).
Figure 18: Adjusted MAF for PIK3CA (Complete Cohort), according to the site of
the analysis.
Figure 19: Overall distribution of molecular alterations in the PAM pathway
inhibitor Cohort.
Figure 20: PIK3CA adjusted MAF.
165
Figure 21: PAM pathway alterations and treatments received, according to breast
cancer subtype (PAM pathway inhibitor Cohort).
Figure 22: TTF to PAM pathway inhibitors.
Figure 23: TTF according to the presence of PAM pathway dysregulation.
Figure 24: TTF according to the presence of PIK3CA mutation.
Figure 25: TTF according to type of treatment received.
Figure 26: TTF according to clonality of PIK3CA mutation.
Figure 27: TTF in patients treated with PI3Kα-specific inhibitors.
Figure 28: TTF in patients with PIK3CA mutation treated with PI3Kα-specific
inhibitors.
Figure 29: Molecular alterations in the Complete Cohort and in the PAM pathway
inhibitor Cohort.
166
Index of Abbreviations
AE Adverse Event
AI Aromatase Inhibitor
Alt Alteration
AR Androgen Receptor
ARMS Amplification Refractory Mutation System
BID Twice a Day
BIG Breast International Group
CBR Clinical Benefit Rate
CGH Comparative Genomic Hybridization
CI Confidence Interval
CNA Copy Number Aberration
CNS Central Nervous System
CNV Copy Number Variation
CR Complete Response
CRC Colorectal Cancer
CT Chemotherapy
CTC Circulating Tumor Cell
ctDNA Circulating tumor DNA
DLT Dose Limiting Toxicity
ddPCR Digital droplet PCR
dPCR droplet PCR
EBC Early Breast Cancer
EBCTCG Early Breast Cancer Trialists Collaborative Group
EGFR Epidermal Growth Factor Receptor
ER Estrogen Receptor
FFPE Formalin-Fixed Paraffin Embedded
GCIG Gynecologic Cancer InterGroup
HER2 Human Epidermal growth factor Receptor 2
HER2-E HER2-Enriched
HR Hazard Ratio
ICGC International Cancer Genome Consortium
IDC Invasive Ductal Carcinoma
IHC Immunohistochemistry
ILC Invasive Lobular Carcinoma
INPP4B Inositol polyphosphate-4-phosphatase
IntClust Internal Cluster
IQR Interquartile range
IRS1 Insulin receptor substrate 1
ITT Intention To Treat
LUM Luminal
167
MAF Mutant Allele Fraction
MBC Metastatic Breast Cancer
MDACC MD Anderson Cancer Center
MGH Mass General Hospital
mRNA messenger RNA
MTD Maximum Tolerated Dose
mTOR mammalian target of rapamycin
MUT Mutant
NGS Next Generation Sequencing
NSCLC Non-small Cell Lung Cancer
OR Odds Ratio
ORR Overall Response Rate
OS Overall Survival
PAM PI3K/AKT/mTOR
PCR Polymerase Chain Reaction
PD Progressive Disease
PDK1 3-phosphoinositide dependent protein kinase 1
PDX Patient-derived xenograft
PFS Progression Free Survival
PgR Progesterone Receptor
PI3K Phosphatidylinositol-3-kinases
PIP2 or PIP(4,5)2 Phosphatidylinositol 4,5-bisphosphate
PIP3 or PIP(3,4,5)3 Phosphatidylinositol (3,4,5)-trisphosphate
PR Partial Response
PTEN Phosphatase and tensin homolog in chromosome 10
QD Once a day
RECIST Response Evaluation Criteria In Solid Tumors
RP2D Recommended Phase 2 Dose
RPPA Reverse Protein Phase Array
RR Relative Risk
RTK Receptor Tyrosine Kinase
SD Stable Disease
TCGA The Cancer Genome Atlas
TKI Tyrosine-Kinase Inhibitor
TN Triple Negative
TNBC Triple Negative Breast Cancer
TPC Treatment of Physician's Choice
TTP Time to Progression
US United States
VPS34 Vacuolar Sorting-associated Protein 34
WES Whole-exome Sequencing
WT Wild Type

TESIS DOCTORAL
MOLECULAR ALTERATIONS IN METASTATIC BREAST
CANCER AND EFFICACY OF PI3K/AKT/MTOR INHIBITORS IN
EARLY PHASE CLINICAL TRIALS