Embed Size (px)
Citation preview
América Latina en cifras 2018LATIN AMERICA IN FIGURES2018
2. Alacero América Latina en cifras Latin America in figures 3
_ _ _ _
Alacero –Asociación Latinoamericana del Acero– es la
entidad civil sin fines de lucro que reúne a la cadena
de valor del acero de América Latina para fomentar
los valores de integración regional, innovación
tecnológica, excelencia en recursos humanos,
seguridad en el trabajo, responsabilidad empresarial
y sustentabilidad socioambiental. Fundada en 1959,
está integrada por más de 60 empresas productoras
y afines de 19 países de América Latina y del
mundo, cuya producción es cercana a 70 millones de
toneladas anuales.
Alacero está reconocida como Organismo Consultor
Especial por las Naciones Unidas.
Alacero - Latin American Steel Association - is the non-
profit civil association that brings together the steel value
chain of Latin America to promote the values of regional
integration, technological innovation, excellence in
human resources, safety at work, corporate responsibility
and socio-environmental sustainability. Founded in 1959,
it is integrated by more than 60 producing and related
companies from 19 countries in Latin America and the
world, whose production is close to 70 million tons per
year.
Alacero is recognized as a Special Consultant
Organization by the United Nations.
© Alf Ribeiro / Shutterstock.com
COvER
Santa EfigEnia Viaduct, Sao Paulo, Brazil
PORTADA
ViADucTO SAnTA ifigêniA SãO PAulO, BRASil
4. Alacero América Latina en cifras Latin America in figures 5
_ _ _ _
ContenidoContent
P. 06
P.08
P. 10
P.12
P. 18
P.26
P.30
P.34
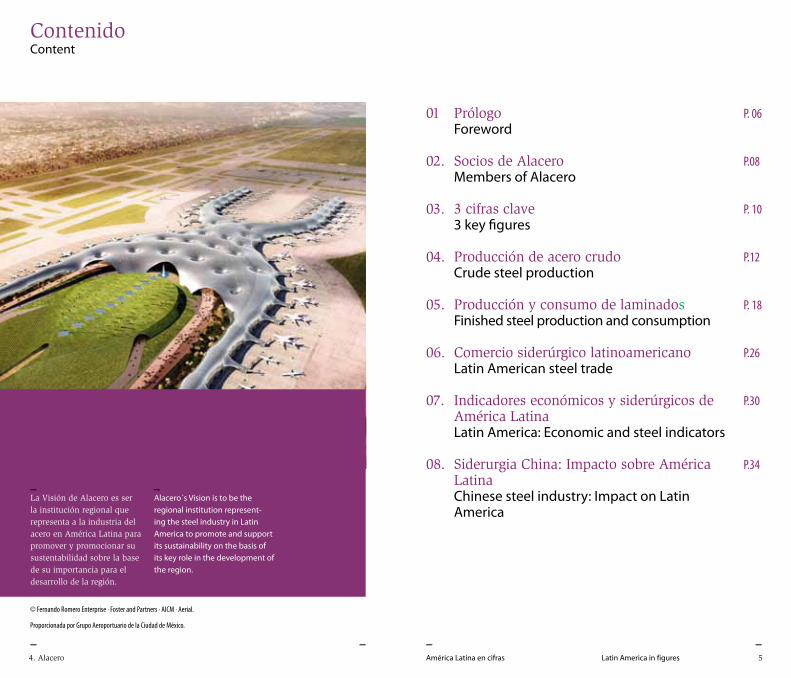
_Alacero´s vision is to be the regional institution represent-ing the steel industry in Latin America to promote and support its sustainability on the basis of its key role in the development of the region.
_La Visión de Alacero es ser la institución regional que representa a la industria del acero en América Latina para promover y promocionar su sustentabilidad sobre la base de su importancia para el desarrollo de la región.
PrólogoForeword
Socios de Alacero Members of Alacero
3 cifras clave3 key figures
Producción de acero crudo Crude steel production
Producción y consumo de laminados Finished steel production and consumption
Comercio siderúrgico latinoamericano Latin American steel trade
Indicadores económicos y siderúrgicos de América Latina Latin America: Economic and steel indicators
Siderurgia China: Impacto sobre América LatinaChinese steel industry: Impact on Latin America
01
02.
03.
04.
05.
06.
07.
08.
© Fernando Romero Enterprise · Foster and Partners · AICM · Aerial.
Proporcionada por Grupo Aeroportuario de la Ciudad de México.
América Latina en cifras Latin America in figures 7
_ _ 6. Alacero
_ _
01. PrólogoForeword
La economía de América Latina
mantiene el ritmo de crecimiento
que comenzó a inicios del año
pasado. A pesar de la incertidum-
bre política, las crecientes tensiones
comerciales y la fuerte crisis finan-
ciera en Argentina, América Latina
espera una expansión del PIB de
1,2% apoyándose en el recuperado
crecimiento global y los altos pre-
cios de los commodities.
En 2018 el consumo aparente de
acero alcanzará los 68,5 millones
de toneladas (Mt), mientras que
la de laminados llegará a 55,9 Mt,
1,3% y 5,6% más que en 2017
respectivamente.
También se pronostica un incre-
mento del consumo mundial de
3,9% y de 6,0% en China.
Las importaciones totales de Améri-
ca Latina alcanzarán 23,5 Mt, lo
que representa una contracción de
6,5% frente a 2017, sin embargo el
consumo regional es abastecido en
un 34% por dichas importaciones.
A partir de 2015, los gobiernos de
los países de la región junto con
las empresas han fortalecido sus
esfuerzos por nivelar el campo
de juego, estableciendo acciones
antidumping y salvaguardas, que
buscan asegurar la competitivi-
dad internacional de la industria.
En la actualidad, América Latina
mantiene 66 acciones de defensa
comercial vigentes, 44 de estas
contra China.
The Latin American economy maintains the growth rate that began the first trimester of previous year. Despite the political uncertainty, the escalatory trade tensions, and the strong financial crisis in Argentina, Latin America expects to set a 1.2% GDP expansion in 2018 supported by stronger global growth and the high prices of commodities.In 2018, apparent steel use will reach to 68.5 million tons (Mt), while finished steel output will reach to 55.9 Mt, 1.3% and 5.6% higher than 2017, respectively.Forecasts includes an increase in world consumption of 3.9%, and 6.0% in China.Latin America total imports will reach 23.5 Mt, which represents a contraction of 6.5% compared to 2017, however regional consumption is supplied by 34% for these imports.Since 2015, the regional governments in cooperation with steel companies have strengthened their efforts to level the playing field, establishing antidumping actions and safeguards, pursuing to ensure international competitiveness in the industry. Currently, Latin America has 66 trade defense actions in force, 44 of these are against China.
Francisco Leal
Director General – Alacero
_Alacero has undertaken to encourage cooperation between companies and regional associations to combat unfair trade, favoring fair competition and good practices to all its participants.
_Alacero se ha encargado de motivar la cooperación entre las empresas y las asociaciones regionales para combatir el comercio desleal, favoreciendo la competencia limpia y las buenas prácticas de todos sus participantes.
8. Alacero América Latina en cifras Latin America in figures 9
_ _ _ _ 8. Alacero América Latina en cifras Latin America in figures 9
_ _ _ _
ArgentinaAcerbrag
Acindar Grupo AcelorMittal
Cámara Argentina del Acero
Gerdau
Instituto Argentino
de Siderurgia – IAS
Tenaris
Ternium
BrasilArcelorMittal Long Carbon
Americas
ArcelorMittal Tubarão. Aços
Planos
Companhia Siderúrgica
Nacional - CSN
Gerdau
Instituto Aço Brasil
Ternium
USIMINAS
Votorantim Siderurgia – VS
ChileAZA
CAP Acero
CAP Minería
Instituto Chileno del Acero
- ICHA
México Altos Hornos de México –
AHMSA
ArcelorMittal México
Autlán
Cámara Nacional de la
Industria del Hierro y del Acero
– CANACERO
Deacero
Gerdau
Grupo Villacero
Tenaris
Ternium
PerúCorporación Aceros Arequipa
Gerdau
República DominicanaAsociación Dominicana del
Acero – ADOACERO
Gerdau Metaldom
UruguayGerdau
ColombiaAcerías de Colombia – ACESCO
Acerías Paz del Río
ANDI-Cámara Fedemetal
Comité Colombiano de
Productores de Acero de ANDI
Gerdau
Tenaris
Ternium
Costa RicaMETALCO
EcuadorAcerías Nacionales del Ecuador –
ANDEC
Federación Ecuatoriana
de Industrias del Metal –
FEDIMETAL
Novacero
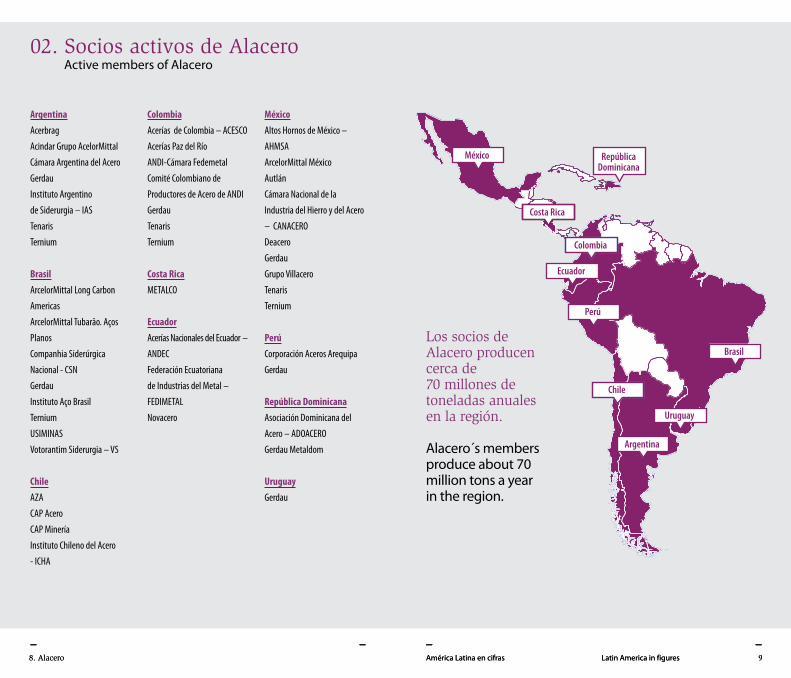
02. Socios activos de AlaceroActive members of Alacero
Los socios de Alacero producen cerca de 70 millones de toneladas anuales en la región.
Alacero´s members produce about 70 million tons a year in the region.
RepúblicaDominicana
Uruguay
Brasil
Colombia
México
Costa Rica
Ecuador
Perú
Chile
Argentina
10. Alacero América Latina en cifras Latin America in figures 11
_ _ _ _
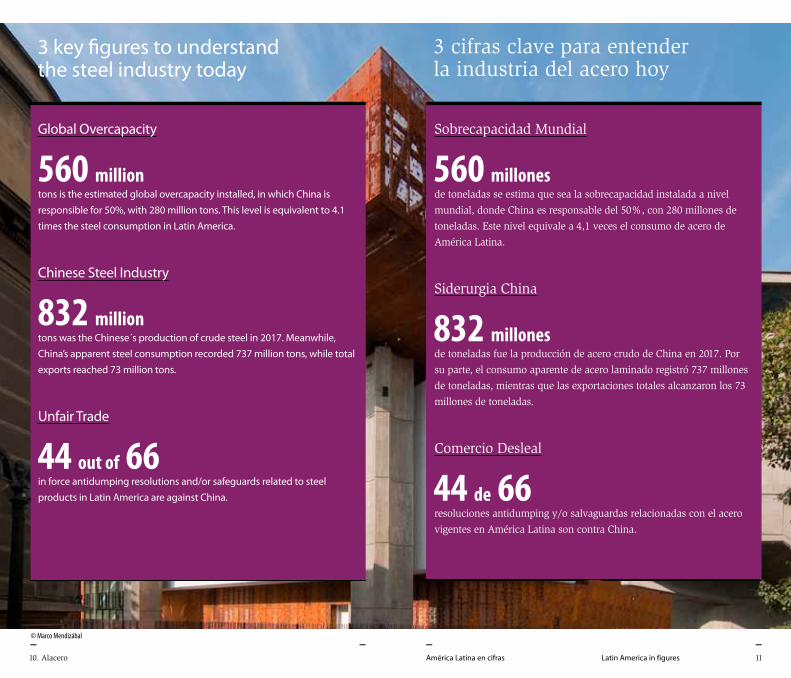
3 cifras clave para entender la industria del acero hoy
3 key figures to understand the steel industry today
Global Overcapacity
tons is the estimated global overcapacity installed, in which China is responsible for 50%, with 280 million tons. This level is equivalent to 4.1 times the steel consumption in Latin America.
Chinese Steel Industry
tons was the Chinese´s production of crude steel in 2017. Meanwhile, China’s apparent steel consumption recorded 737 million tons, while total exports reached 73 million tons.
Unfair Trade
in force antidumping resolutions and/or safeguards related to steel products in Latin America are against China.
Sobrecapacidad Mundial
de toneladas se estima que sea la sobrecapacidad instalada a nivel
mundial, donde China es responsable del 50%, con 280 millones de
toneladas. Este nivel equivale a 4,1 veces el consumo de acero de
América Latina.
Siderurgia China
de toneladas fue la producción de acero crudo de China en 2017. Por
su parte, el consumo aparente de acero laminado registró 737 millones
de toneladas, mientras que las exportaciones totales alcanzaron los 73
millones de toneladas.
Comercio Desleal
resoluciones antidumping y/o salvaguardas relacionadas con el acero
vigentes en América Latina son contra China.
560 million 560 millones
832 million 832 millones
44 out of 66 44 de 66
© Marco Mendizábal
12. Alacero
_ _
04. Producción de acero crudoCrude steel production
12. Alacero América Latina en cifras Latin America in figures 13
_ _
El año 2017 fue un punto de
inflexión para la industria apoyado
en condiciones más favorables
para la recuperación productiva y
un alza moderada en los precios
del mercado del acero. El 2018
inició su curso con muy buenas
expectativas, que se han mantenido
a pesar de las adversidades internas
y externas que se han presentado
en lo que va de año.
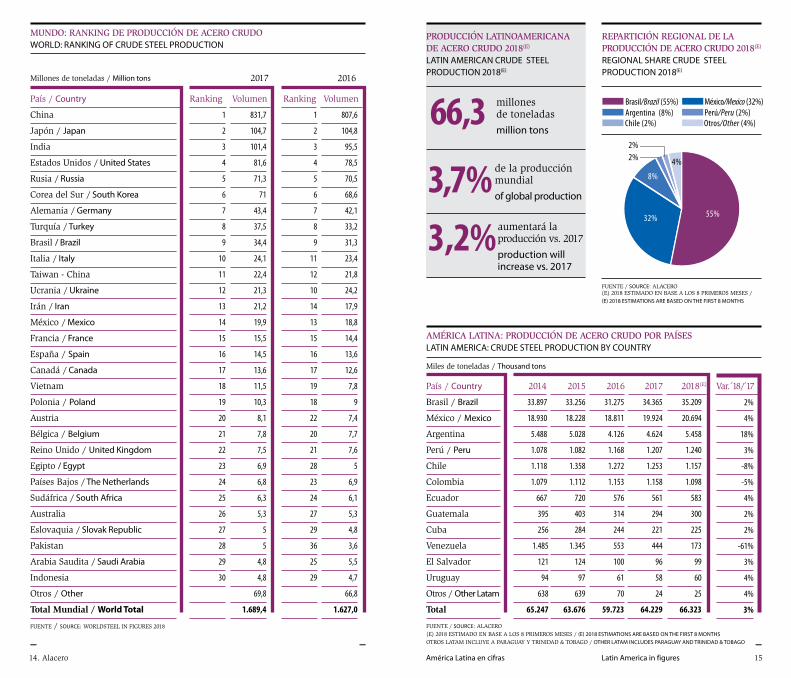
Para el cierre de 2018 se espera
que la producción de acero crudo
alcance los 66,3 millones de
toneladas, lo que representaría un
aumento del 3,2% respecto al año
anterior.
The recovery continues
The year 2017 was a turning point for the industry supported by better conditions for the productive recovery and a moderate rise in the prices of the steel market. 2018 began with very good expectations, which have remained despite internal and external adversities that have been faced so far this year.By the end of 2018, crude steel production is expected to reach 66.3 million tons, which represents an increase of 3.2% over the previous year.
Se mantiene la recuperación
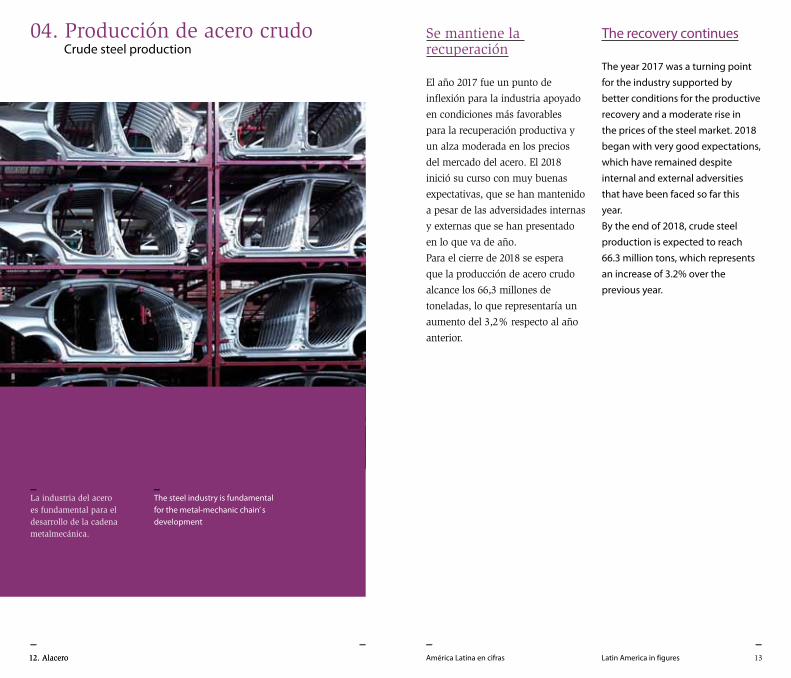
_The steel industry is fundamental for the metal-mechanic chain’ s development
_La industria del acero es fundamental para el desarrollo de la cadena metalmecánica.
14. Alacero
_ _
REPARTICIÓN REGIONAL DE LAPRODUCCIÓN DE ACERO CRUDO 2018(E)
REGIONAL SHARE OF CRUDE STEELPRODUCTION 2018(E)
Brasil/Brazil (55%)Argentina (8%)Chile (2%)
México/Mexico (32%)Perú/Peru (2%)Otros/Other (4%)
2%
4%2%
8%
32% 55%
América Latina en cifras Latin America in figures 15
_
China
Japón / Japan
India
Estados Unidos / United States
Rusia / Russia
Corea del Sur / South Korea
Alemania / Germany
Turquía / Turkey
Brasil / Brazil
Italia / Italy
Taiwan - China
Ucrania / Ukraine
Irán / Iran
México / Mexico
Francia / France
España / Spain
Canadá / Canada
Vietnam
Polonia / Poland
Austria
Bélgica / Belgium
Reino Unido / United Kingdom
Egipto / Egypt
Países Bajos / The Netherlands
Sudáfrica / South Africa
Australia
Eslovaquia / Slovak Republic
Pakistan
Arabia Saudita / Saudi Arabia
Indonesia
Otros / Other
Total Mundial / World Total
1
2
3
4
5
6
7
8
9
11
12
10
14
13
15
16
17
19
18
22
20
21
28
23
24
27
29
36
25
29
807,6
104,8
95,5
78,5
70,5
68,6
42,1
33,2
31,3
23,4
21,8
24,2
17,9
18,8
14,4
13,6
12,6
7,8
9
7,4
7,7
7,6
5
6,9
6,1
5,3
4,8
3,6
5,5
4,7
66,8
1.627,0
2016
Ranking Volumen
1
2
3
4
5
6
7
8
9
10
11
12
13
14
15
16
17
18
19
20
21
22
23
24
25
26
27
28
29
30
831,7
104,7
101,4
81,6
71,3
71
43,4
37,5
34,4
24,1
22,4
21,3
21,2
19,9
15,5
14,5
13,6
11,5
10,3
8,1
7,8
7,5
6,9
6,8
6,3
5,3
5
5
4,8
4,8
69,8
1.689,4
2017
VolumenRanking
ProDucción LAtinoAmericAnA De Acero cruDo 2018(e)
LATIN AMERICAN CRUDE STEELPRODUCTION 2018(E)
millones de toneladas
million tons66,3
de la producción mundial
of global production
3,7% aumentará la producción vs. 2017
production willincrease vs. 2017
3,2%
FUENTE / SOURCE: wORLDSTEEL IN FIgURES 2018
Brasil / Brazil
México / Mexico
Argentina
Perú / Peru
Chile
Colombia
Ecuador
guatemala
Cuba
Venezuela
El Salvador
Uruguay
Otros / Other Latam
Total
33.897
18.930
5.488
1.078
1.118
1.079
667
395
256
1.485
121
94
638
65.247
33.256
18.228
5.028
1.082
1.358
1.112
720
403
284
1.345
124
97
639
63.676
31.275
18.811
4.126
1.168
1.272
1.153
576
314
244
553
100
61
70
59.723
34.365
19.924
4.624
1.207
1.253
1.158
561
294
221
444
96
58
24
64.229
35.209
20.694
5.458
1.240
1.157
1.098
583
300
225
173
99
60
25
66.323
2%
4%
18%
3%
-8%
-5%
4%
2%
2%
-61%
3%
4%
4%
3%
201620152014 2017 2018(E) Var.́ 18/́ 17
AméricA LAtinA: ProDucción De Acero cruDo Por PAísesLATIN AMERICA: CRUDE STEEL PRODUCTION By COUNTRy
País / Country
País / Country
FUENTE / SOURCE: ALACERO(E) 2018 ESTIMADO EN BASE A LOS 8 PRIMEROS MESES / (E) 2018 ESTIMATIONS ARE BASED ON ThE FIRST 8 MONThSOTROS LATAM INCLUyE A PARAgUAy y TRINIDAD & TOBAgO / OThER LATAM INCLUDES PARAGUAy AND TRINIDAD & TOBAGO
Miles de toneladas / Thousand tons
FUENTE / SOURCE: ALACERO(E) 2018 ESTIMADO EN BASE A LOS 8 PRIMEROS MESES / (E) 2018 ESTIMATIONS ARE BASED ON ThE FIRST 8 MONThS
rePArtición reGionAL De LA ProDucción De Acero cruDo 2018(e)
REGIONAL ShARE CRUDE STEELPRODUCTION 2018(E)
REPARTICIÓN REGIONAL DE LAPRODUCCIÓN DE ACERO CRUDO 2018(E)
REGIONAL SHARE OF CRUDE STEELPRODUCTION 2018(E)
Brasil/Brazil (55%)Argentina (8%)Chile (2%)
México/Mexico (32%)Perú/Peru (2%)Otros/Other (4%)
2%
4%2%
8%
32% 55%
munDo: rAnkinG De ProDucción De Acero cruDoWORLD: RANKING OF CRUDE STEEL PRODUCTION
Millones de toneladas / Million tons
16. Alacero América Latina en cifras Latin America in figures 17
_ _ _ _
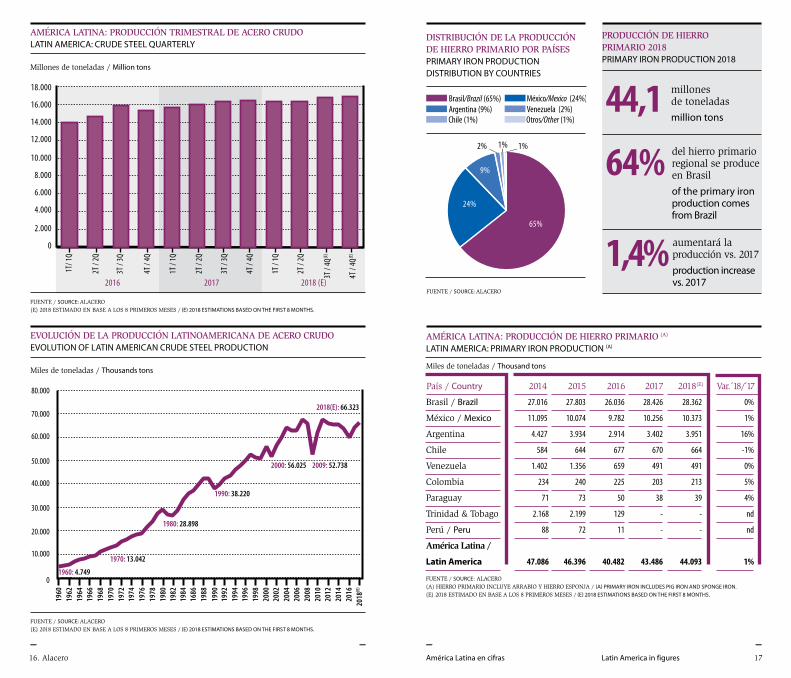
AméricA LAtinA: ProDucción De Hierro PrimArio (A) LATIN AMERICA: PRIMARy IRON PRODUCTION (A)
1960: 4.749
1970: 13.042
1980: 28.898
1990: 38.220
2000: 56.025 2009: 52.738
2018(E): 66.323
1962
1960
1964
1966
1968
1970
1972
1974
1976
1978
1980
1982
1984
1686
1988
1990
1992
1994
1996
1998
2000
2002
2004
2006
2008
2010
2012
2014
2016
2018
(E)
Brasil / Brazil
México / Mexico
Argentina
Chile
Venezuela
Colombia
Paraguay
Trinidad & Tobago
Perú / Peru
América Latina /
Latin America
27.016
11.095
4.427
584
1.402
234
71
2.168
88
47.086
27.803
10.074
3.934
644
1.356
240
73
2.199
72
46.396
26.036
9.782
2.914
677
659
225
50
129
11
40.482
28.426
10.256
3.402
670
491
203
38
-
-
43.486
28.362
10.373
3.951
664
491
213
39
-
-
44.093
0%
1%
16%
-1%
0%
5%
4%
nd
nd
1%
201620152014 2017 2018(E) Var.́ 18/́ 17País / Country
Miles de toneladas / Thousand tons
FUENTE / SOURCE: ALACERO(E) 2018 ESTIMADO EN BASE A LOS 8 PRIMEROS MESES / (E) 2018 ESTIMATIONS BASED ON ThE FIRST 8 MONThS.
FUENTE / SOURCE: ALACERO (A) hIERRO PRIMARIO INCLUyE ARRABIO y hIERRO ESPONJA / (A) PRIMARy IRON INCLUDES PIG IRON AND SPONGE IRON.(E) 2018 ESTIMADO EN BASE A LOS 8 PRIMEROS MESES / (E) 2018 ESTIMATIONS BASED ON ThE FIRST 8 MONThS.
2016 2017 2018 (E)
18.000
16.000
14.000
12.000
10.000
8.000
6.000
4.000
2.000
0
ProDucción De Hierro PrimArio 2018PRIMARy IRON PRODUCTION 2018
millones de toneladas
million tons44,1
del hierro primario regional se produce en Brasil
of the primary iron production comes from Brazil
64%
aumentará laproducción vs. 2017
production increase vs. 2017
1,4%
AméricA LAtinA: ProDucción trimestrAL De Acero cruDoLATIN AMERICA: CRUDE STEEL qUARTERLy
Millones de toneladas / Million tons
evoLución De LA ProDucción LAtinoAmericAnA De Acero cruDoEvOLUTION OF LATIN AMERICAN CRUDE STEEL PRODUCTION
Miles de toneladas / Thousands tons
DistriBución De LA ProDucción De Hierro PrimArio Por PAísesPRIMARy IRON PRODUCTION DISTRIBUTION By COUNTRIES
DISTRIBUCIÓN DE LA PRODUCCIÓN DE HIERRO PRIMARIO POR PAÍSES
PRIMARY IRON PRODUCTION DISTRIBUTION BY COUNTRIES
Brasil/Brazil (65%)Argentina (9%)Chile (1%)
México/Mexico (24%)Venezuela (2%)Otros/Other (1%)
1%2% 1%
65%
24%
9%
FUENTE / SOURCE: ALACERO
DISTRIBUCIÓN DE LA PRODUCCIÓN DE HIERRO PRIMARIO POR PAÍSES
PRIMARY IRON PRODUCTION DISTRIBUTION BY COUNTRIES
Brasil/Brazil (65%)Argentina (9%)Chile (1%)
México/Mexico (24%)Venezuela (2%)Otros/Other (1%)
1%2% 1%
65%
24%
9%
FUENTE / SOURCE: ALACERO(E) 2018 ESTIMADO EN BASE A LOS 8 PRIMEROS MESES / (E) 2018 ESTIMATIONS BASED ON ThE FIRST 8 MONThS.
América Latina en cifras Latin America in figures 19
_ _ 18. Alacero
_ _
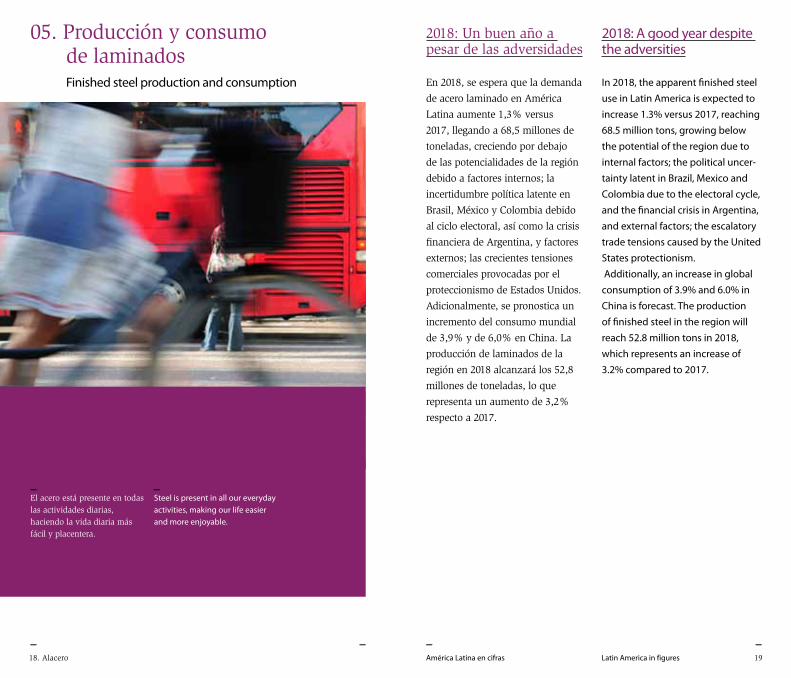
05. Producción y consumo de laminados Finished steel production and consumption
2018: Un buen año a pesar de las adversidades
En 2018, se espera que la demanda
de acero laminado en América
Latina aumente 1,3% versus
2017, llegando a 68,5 millones de
toneladas, creciendo por debajo
de las potencialidades de la región
debido a factores internos; la
incertidumbre política latente en
Brasil, México y Colombia debido
al ciclo electoral, así como la crisis
financiera de Argentina, y factores
externos; las crecientes tensiones
comerciales provocadas por el
proteccionismo de Estados Unidos.
Adicionalmente, se pronostica un
incremento del consumo mundial
de 3,9% y de 6,0% en China. La
producción de laminados de la
región en 2018 alcanzará los 52,8
millones de toneladas, lo que
representa un aumento de 3,2%
respecto a 2017.
2018: A good year despite the adversities
In 2018, the apparent finished steel use in Latin America is expected to increase 1.3% versus 2017, reaching 68.5 million tons, growing below the potential of the region due to internal factors; the political uncer-tainty latent in Brazil, Mexico and Colombia due to the electoral cycle, and the financial crisis in Argentina, and external factors; the escalatory trade tensions caused by the United States protectionism. Additionally, an increase in global consumption of 3.9% and 6.0% in China is forecast. The production of finished steel in the region will reach 52.8 million tons in 2018, which represents an increase of 3.2% compared to 2017.
_El acero está presente en todas las actividades diarias, haciendo la vida diaria más fácil y placentera.
_Steel is present in all our everyday activities, making our life easier and more enjoyable.
20. Alacero América Latina en cifras Latin America in figures 21
_ _ _ _
Argentina
Brasil / Brazil
Chile
Colombia
México / Mexico
Perú / Peru
Venezuela
Otros / Other
América Latina /
Latin America
14.895
8.803
13.549
6.089
9.674
6.150
7.923
5.223
8.378
12.709
8.701
13.738
5.800
8.815
6.178
7.688
5.282
8.000
14.463
9.896
15.068
6.380
9.319
6.732
6.890
5.536
8.722
10.667
9.127
16.143
6.761
9.614
7.118
3.300
5.744
8.196
-26%
-8%
7%
6%
3%
6%
-52%
4%
-6%
20162015 2017 2018E) Var.́ 18/́ 17
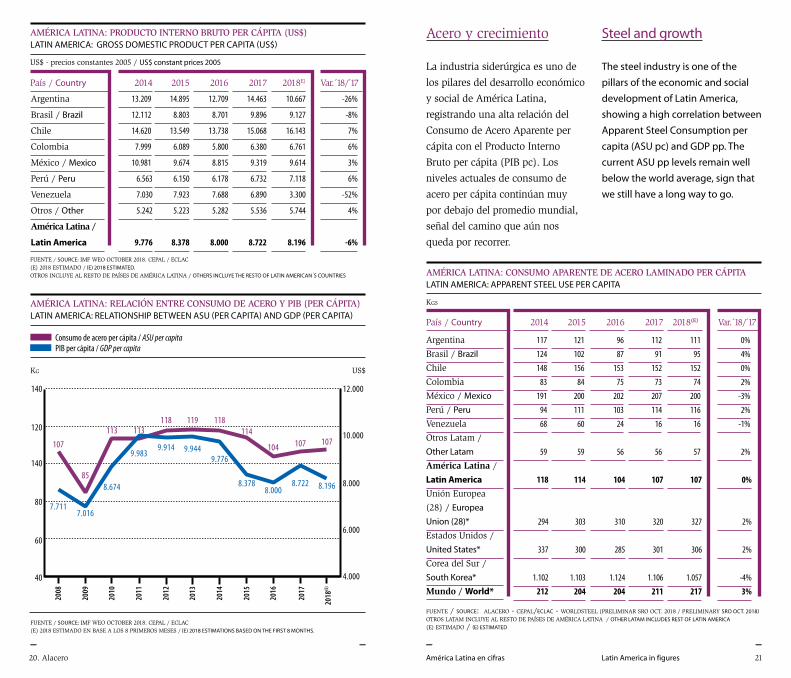
AméricA LAtinA: ProDucto interno Bruto Per cáPitA (us$)LATIN AMERICA: GROSS DOMESTIC PRODUCT PER CAPITA (US$)
País / Country
FUENTE / SOURCE: IMF wEO OCTOBER 2018. CEPAL / ECLAC (E) 2018 ESTIMADO / (E) 2018 ESTIMATED.OTROS INCLUyE AL RESTO DE PAíSES DE AMéRICA LATINA / OThERS INCLUyE ThE RESTO OF LATIN AMERICAN´S COUNTRIES
Acero y crecimiento
La industria siderúrgica es uno de
los pilares del desarrollo económico
y social de América Latina,
registrando una alta relación del
Consumo de Acero Aparente per
cápita con el Producto Interno
Bruto per cápita (PIB pc). Los
niveles actuales de consumo de
acero per cápita continúan muy
por debajo del promedio mundial,
señal del camino que aún nos
queda por recorrer.
Steel and growth
The steel industry is one of the pillars of the economic and social development of Latin America, showing a high correlation between Apparent Steel Consumption per capita (ASU pc) and GDP pp. The current ASU pp levels remain well below the world average, sign that we still have a long way to go.
Argentina
Brasil / BrazilChile
Colombia
México / MexicoPerú / PeruVenezuela
Otros Latam /
Other LatamAmérica Latina /
Latin AmericaUnión Europea
(28) / Europea Union (28)*Estados Unidos /
United States*Corea del Sur /
South Korea*Mundo / World*
117
124
148
83
191
94
68
59
118
294
337
1.102
212
201620152014 2017 2018(E) Var.́ 18/́ 17
AméricA LAtinA: consumo APArente De Acero LAminADo Per cáPitALATIN AMERICA: APPARENT STEEL USE PER CAPITA
País / Country
FUENTE / SOURCE: ALACERO - CEPAL/ECLAC - wORLDSTEEL (PRELIMINAR SRO OCT. 2018 / PRELIMINARy SRO OCT. 2018)OTROS LATAM INCLUyE AL RESTO DE PAíSES DE AMéRICA LATINA / OThER LATAM INCLUDES REST OF LATIN AMERICA(E) ESTIMADO / (E) ESTIMATED
KgS
FUENTE / SOURCE: IMF wEO OCTOBER 2018. CEPAL / ECLAC (E) 2018 ESTIMADO EN BASE A LOS 8 PRIMEROS MESES / (E) 2018 ESTIMATIONS BASED ON ThE FIRST 8 MONThS.
2016
140
2015
2014
2013
2012
2011
2010
2009
2008
120
140
80
60
40
Kg
12.000
10.000
8.000
6.000
4.000
US$
2017
107
85
113 113118 119 118
114
104 107
7.711
9.9449.776
8.3788.000
8.722
9.9149.983
8.674
7.016
2018
(E)
107
8.196
AméricA LAtinA: reLAción entre consumo De Acero y PiB (Per cáPitA)LATIN AMERICA: RELATIONShIP BETWEEN ASU (PER CAPITA) AND GDP (PER CAPITA)
Consumo de acero per cápita / ASU per capitaPIB per cápita / GDP per capita
US$ - precios constantes 2005 / US$ constant prices 2005
Kg uS$
121
102
156
84
200
111
60
59
114
303
300
1.103
204
96
87
153
75
202
103
24
56
104
310
285
1.124
204
112
91
152
73
207
114
16
56
107
320
301
1.106
211
111
95
152
74
200
116
16
57
107
327
306
1.057
217
0%
4%
0%
2%
-3%
2%
-1%
2%
0%
2%
2%
-4%
3%
13.209
12.112
14.620
7.999
10.981
6.563
7.030
5.242
9.776
2014
22. Alacero América Latina en cifras Latin America in figures 23
_ _ _
Asia
China
Unión Europea (28)
European Union (28)
América del Norte/
North America
América Latina /
Latin America
Medio Oriente /
Middle East
Países CIS /
CIS Countries
Otros Europa /
Others Europe
Africa
Australia & N.Z.
Mundo / World
1.011,1
710,8
148,9
122,7
72,3
54,5
57,7
37,0
37,4
7,6
1.550
977,5
672,3
153,7
109,5
70,5
53,8
52,4
40,1
38,7
7,4
1.504
1.000,6
681,0
157,6
106,9
64,9
53,1
50,9
40,7
37,6
6,9
1.520
1.058,5
736,8
163,0
114,3
67,6
53,3
54,0
42,6
34,9
6,6
1.595
1.110,5
781,0
166,8
117,3
68,5
54,5
54,8
41,9
36,0
7,3
1.658
4,9%
6,0%
2,3%
2,6%
1,3%
2,1%
1,4%
-1,6%
3,1%
11,2%
3,9%
201620152014 2017 Var.́ 18/́ 17
munDo: consumo APArente De ProDuctos LAminADos WORLD: APPARENT FINIShED STEEL USE
Región / Region
Millones de toneladas / Million tons
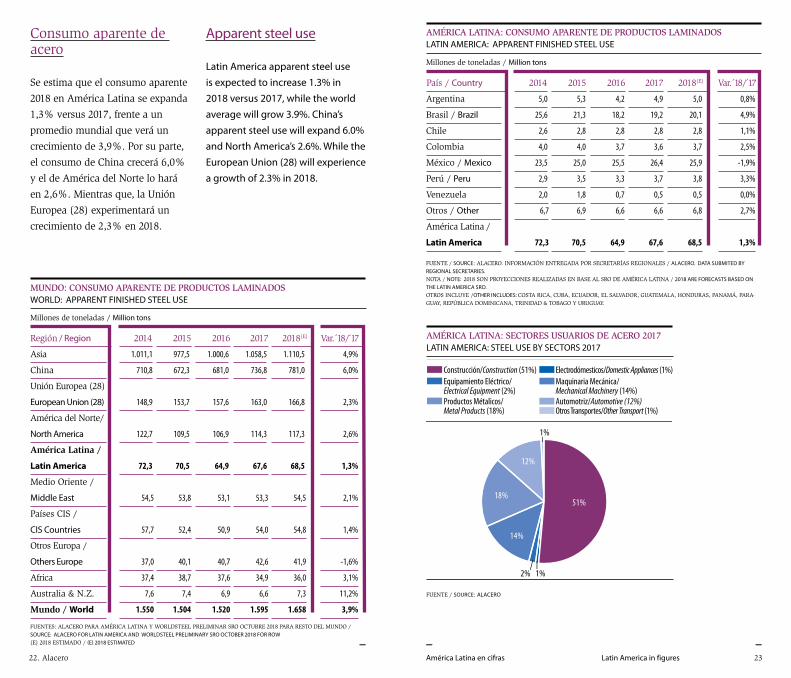
Consumo aparente de acero
Se estima que el consumo aparente
2018 en América Latina se expanda
1,3% versus 2017, frente a un
promedio mundial que verá un
crecimiento de 3,9%. Por su parte,
el consumo de China crecerá 6,0%
y el de América del Norte lo hará
en 2,6%. Mientras que, la Unión
Europea (28) experimentará un
crecimiento de 2,3% en 2018.
Apparent steel use
Latin America apparent steel use is expected to increase 1.3% in 2018 versus 2017, while the world average will grow 3.9%. China’s apparent steel use will expand 6.0% and North America’s 2.6%. While the European Union (28) will experience a growth of 2.3% in 2018.
2018(E)
Argentina
Brasil / Brazil
Chile
Colombia
México / Mexico
Perú / Peru
Venezuela
Otros / Other
América Latina /
Latin America
5,0
25,6
2,6
4,0
23,5
2,9
2,0
6,7
72,3
5,3
21,3
2,8
4,0
25,0
3,5
1,8
6,9
70,5
4,2
18,2
2,8
3,7
25,5
3,3
0,7
6,6
64,9
4,9
19,2
2,8
3,6
26,4
3,7
0,5
6,6
67,6
5,0
20,1
2,8
3,7
25,9
3,8
0,5
6,8
68,5
0,8%
4,9%
1,1%
2,5%
-1,9%
3,3%
0,0%
2,7%
1,3%
201620152014 2017 2018(E) Var.́ 18/́ 17
AméricA LAtinA: consumo APArente De ProDuctos LAminADos LATIN AMERICA: APPARENT FINIShED STEEL USE
País / Country
Millones de toneladas / Million tons
FUENTE / SOURCE: ALACERO. INFORMACIóN ENTREgADA POR SECRETARíAS REgIONALES / ALACERO. DATA SUBMITED By REGIONAL SECRETARIES. NOTA / NOTE: 2018 SON PROyECCIONES REALIZADAS EN BASE AL SRO DE AMéRICA LATINA / 2018 ARE FORECASTS BASED ON ThE LATIN AMERICA SRO.OTROS INCLUyE /OThER INCLUDES: COSTA RICA, CUBA, ECUADOR, EL SALVADOR, gUATEMALA, hONDURAS, PANAMá, PARA-gUAy, REPúBLICA DOMINICANA, TRINIDAD & TOBAgO y URUgUAy.
FUENTES: ALACERO PARA AMéRICA LATINA y wORLDSTEEL PRELIMINAR SRO OCTUBRE 2018 PARA RESTO DEL MUNDO /SOURCE: ALACERO FOR LATIN AMERICA AND WORLDSTEEL PRELIMINARy SRO OCTOBER 2018 FOR ROW(E) 2018 ESTIMADO / (E) 2018 ESTIMATED
FUENTE / SOURCE: ALACERO
Construcción/Construction (51%) Electrodómesticos/Domestic Appliances (1%)Equipamiento Eléctrico/Electrical Equipment (2%)
Maquinaria Mecánica/Mechanical Machinery (14%)
Productos Métalicos/Metal Products (18%)
Automotriz/Automotive (12%)Otros Transportes/Other Transport (1%)
51%
12%
18%
14%
1%
1%2%
AméricA LAtinA: sectores usuArios De Acero 2017LATIN AMERICA: STEEL USE By SECTORS 2017
América Latina en cifras Latin America in figures 25
_ _América Latina en cifras Latin America in figures 25
_ _ 24. Alacero
_ _
México / Mexico
Brasil / Brazil
Perú / Peru
Argentina
Colombia
Chile
Ecuador
guatemala
Costa Rica
Rep. Dominicana /
Dominican Rep.
Venezuela
Cuba
El Salvador
Uruguay
Otros / Others
América Latina /
Latin America
Brasil / Brazil
México / Mexico
Argentina
Colombia
Venezuela
Perú / Peru
Rep. Dominicana /
Dominican Rep.
América Latina /
Latin America
8.084
10.688
1.725
1.312
1.394
1.017
707
574
516
460
726
105
83
79
425
27.894
14.229
8.594
2.546
410
635
60
-
26.474
8.301
9.253
1.656
1.291
1.420
1.035
761
591
426
474
504
126
85
81
438
26.442
13.388
8.533
2.556
440
756
52
-
25.725
8.742
8.647
1.333
1.360
1.326
1.081
696
474
436
382
305
130
97
75
19
25.102
12.273
9.154
2.274
447
225
57
46
24.476
8.731
8.734
1.594
1.462
1.414
1.062
710
454
417
378
158
114
90
66
21
25.406
13.688
9.023
2.374
482
246
55
54
25.922
9.227
9.365
1.885
1.503
1.397
1.112
754
476
463
401
138
120
95
70
23
27.029
14.417
9.682
2.351
421
95
58
60
27.084
5%
7%
-1%
-13%
-61%
5%
10%
4%
2016
2016
2015
2015
2014
2014
2017
2017
2018(E)
2018(E)
Var.́ 18/́ 17
Var.́ 18/́ 17
AmericA LAtinA: ProDuccion De Aceros LArGosLATIN AMERICA: LONG STEEL PRODUCTION
AméricA LAtinA: ProDuccion De Aceros PLAnosLATIN AMERICA: FLAT STEEL PRODUCTION
País / Country
País / Country
FUENTE / SOURCE: ALACERO. INFORMACIóN ENTREgADA POR SECRETARíAS REgIONALES / ALACERO. DATA SUBMITED By REGIONAL SECRETARIES OTROS INCLUyE A PARAgUAy yTRINIDAD y TOBAgO / OThERS INCLUDE PARAGUAy AND TRINIDAD y TOBAGO(E) 2018 ESTIMADO EN BASE A LOS 8 PRIMEROS MESES / (E) 2017 ESTIMATIONS ARE BASED ON ThE FIRST 8 MONThS
FUENTE / SOURCE: ALACERO. INFORMACIóN ENTREgADA POR SECRETARíAS REgIONALES / ALACERO. DATA SUBMITED By REGIONAL SECRETARIES. (E) 2017 ESTIMADO EN BASE A LOS 7 PRIMEROS MESES / (E) 2017 ESTIMATIONS ARE BASED ON ThE FIRST 7 MONThS
Miles de toneladas / Thousand tons
Argentina
Brasil / Brazil
México / Mexico
Venezuela
América Latina /
Latin America
750
657
1.064
-
2.471
360
388
739
-
1.486
376
391
801
-
1.568
621
384
939
-
1.944
736
427
1.000
-
2.164
19%
11%
7%
0%
11%
201620152014 2017 2018(E) Var.́ 18/́ 17
AméricA LAtinA: ProDucción De tuBos sin costurALATIN AMERICA: SEAMLESS TUBES PRODUCTION
País / Country
Millones de toneladas / Million tons
Miles de toneladas / Thousand tons
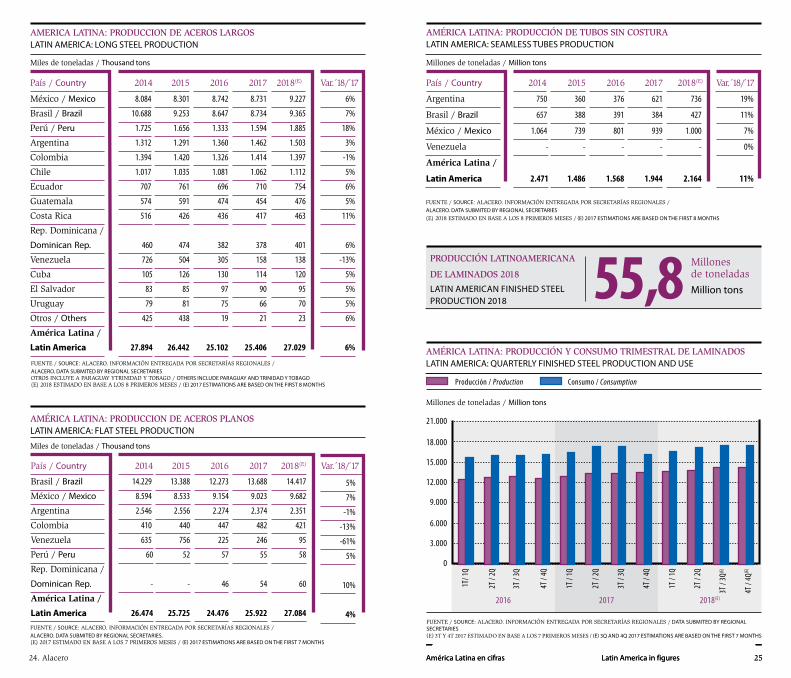
ProDucción LAtinoAmericAnA
De LAminADos 2018
LATIN AMERICAN FINIShED STEEL PRODUCTION 2018
Millones de toneladas
Million tons55,8 FUENTE / SOURCE: ALACERO. INFORMACIóN ENTREgADA POR SECRETARíAS REgIONALES / ALACERO. DATA SUBMITED By REGIONAL SECRETARIES(E) 2018 ESTIMADO EN BASE A LOS 8 PRIMEROS MESES / (E) 2017 ESTIMATIONS ARE BASED ON ThE FIRST 8 MONThS
6%
7%
18%
3%
-1%
5%
6%
5%
11%
6%
-13%
5%
5%
5%
6%
6%
2016 2017 2018(E)
AMÉRICA LATINA: PRODUCCIÓN Y CONSUMO TRIMESTRAL DE LAMINADOSLATIN AMERICA: QUARTERLY FINISHED STEEL PRODUCTION AND USE
21.000
18.000
15.000
12.000
9.000
6.000
3.000
0
AméricA LAtinA: ProDucción y consumo trimestrAL De LAminADosLATIN AMERICA: qUARTERLy FINIShED STEEL PRODUCTION AND USE
Millones de toneladas / Million tons
2016 2017 2018(E)
AMÉRICA LATINA: PRODUCCIÓN Y CONSUMO TRIMESTRAL DE LAMINADOSLATIN AMERICA: QUARTERLY FINISHED STEEL PRODUCTION AND USE
21.000
18.000
15.000
12.000
9.000
6.000
3.000
0
FUENTE / SOURCE: ALACERO. INFORMACIóN ENTREgADA POR SECRETARíAS REgIONALES / DATA SUBMITED By REGIONAL SECRETARIES (E) 3T y 4T 2017 EsTimado En basE a los 7 primEros mEsEs / (E) 3q AND 4q 2017 ESTIMATIONS ARE BASED ON ThE FIRST 7 MONThS
América Latina en cifras Latin America in figures 27
_ _América Latina en cifras Latin America in figures 27
_ _ 26. Alacero
_ _ _ _
06. Comercio siderúrgico latinoamericano Latin American steel trade
Las importaciones siguen siendo una amenaza
Las importaciones totales de acero
que recibe América Latina se han
contraído con respecto a 2017,
principalmente por el menor
saldo exportador de China, sin
embargo la participación de las
importaciones sobre el consumo
sigue siendo alta, y se estima que
alcancen un 34% para el cierre de
2018. Esta situación se mantiene
o agrava año tras año, generando
desincentivos para la industria
local, fricciones comerciales y
arriesgando fuentes de empleo.
Además, en muchos casos estos
productos entran a la región a
precios dumping, provenientes
de países con economías de
‘no mercado’, que subsidian la
producción de acero y entregan
facilidades financieras, fuera de
los lineamientos de la OMC a
sus industrias. En 2017, China
embarcó a la región 7,0 millones
de toneladas de acero.
A partir de 2015, los gobiernos
de los países de la región junto
con las empresas han fortalecido
sus esfuerzos por nivelar el
campo de juego, siguiendo los
procedimientos permitidos por
la OMC, estableciendo acciones
antidumping y salvaguardas, que
buscan asegurar la competitividad
internacional de la industria.
Imports are still a threat
Total steel imports received by Latin America have contracted with re-spect to 2017, mainly due to China lower export balance, however the share of imports over consumption remains high, and it is estimated to reach 34% by the end of 2018. This situation remains or aggravated year after year, generating disincen-tives for the local industry, trade frictions and threatens jobs. In addi-tion, in many cases these products enter the region at dumping prices, from countries with ‘non-market’ economies, which subsidize steel production and provide financial fa-cilities, outside the WTO guidelines for their industries. In 2017, China shipped 7.0 million tonnes of steel to the region.Since 2015, local governments and steel companies have strengthened their efforts to level the playing field, following the procedures allowed by the WTO, through the establishment of anti-dumping and safeguard actions, seeking to ensure the international competi-tiveness of the industry.
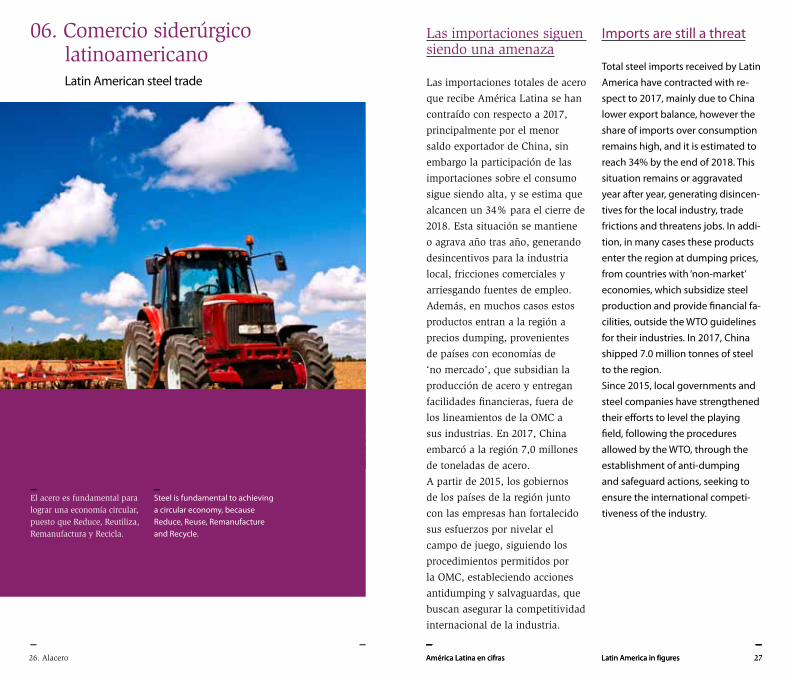
_El acero es fundamental para lograr una economía circular, puesto que Reduce, Reutiliza, Remanufactura y Recicla.
_Steel is fundamental to achievinga circular economy, becauseReduce, Reuse, Remanufactureand Recycle.
28. Alacero América Latina en cifras Latin America in figures 29
_ _ _ _
Argentina
Brasil / Brazil
Chile
Colombia
México / Mexico
Perú / Peru
Venezuela
Otros / Other
América Latina /
Latin America
Argentina
Brasil / Brazil
Chile
Colombia
México / Mexico
Perú / Peru
Venezuela
Otros / Other
América Latina /
Latin America
790
3.389
82
85
3.579
162
20
431
8.538
762
3.921
1.561
2.645
8.716
2.054
732
4.327
24.719
394
4.905
67
49
2.910
162
72
491
9.050
1.054
2.825
1.854
2.661
10.217
1.593
956
4.427
25.587
391
4.717
78
60
3.134
203
41
576
9.200
573
1.398
1.604
2.392
9.925
1.750
189
4.455
22.286
706
5.455
99
79
3.349
236
0
699
10.623
1.021
1.995
1.719
2.200
11.086
2.378
108
4.587
25.095
722
5.246
146
114
3.749
217
-
750
10.944
1.302
2.103
1.835
2.428
9.304
1.659
55
4.782
23.467
2%
-4%
48%
44%
12%
-8%
-100%
7%
3%
28%
5%
7%
10%
-16%
-30%
-49%
4%
-6%
2016
2016
2015
2015
2014
2014
2017
2017
2018E)
2018(E)
Var.́ 18/́ 17
Var.́ 18/́ 17
AméricA LAtinA: eXPortAciones De Acero LAminADoLATIN AMERICA: FINIShED STEEL ExPORTS
AméricA LAtinA: imPortAciones De Acero LAminADoLATIN AMERICA: FINIShED STEEL IMPORTS
País / Country
País / Country
FUENTE / SOURCE: ALACERO, INFORMACIóN ENTREgADA POR SECRETARíAS REgIONALES / INFORMATION SUBMITED By REGIONAL SECRETARIESOTROS INCLUyE / OThERS INCLUDE: CUBA, ECUADOR, EL SALVADOR, gUATEMALA, hONDURAS, PANAMá, PARAgUAy, REPúBLICA DOMINICANA y URUgUAy. (E) 2018 ESTIMADO EN BASE A LOS 8 PRIMEROS MESES / (E) 2018 ESTIMATIONS ARE BASED ON ThE FIRST 8 MONThS
FUENTE / SOURCE: ALACERO, INFORMACIóN ENTREgADA POR SECRETARíAS REgIONALES / INFORMATION SUBMITED By REGIONAL SECRETARIESOTROS INCLUyE / OThERS INCLUDE: CUBA, ECUADOR, EL SALVADOR, gUATEMALA, hONDURAS, PANAMá, PARAgUAy, REPúBLICA DOMINICANA y URUgUAy. (E) 2018 ESTIMADO EN BASE A LOS 8 PRIMEROS MESES / (E) 2018 ESTIMATIONS ARE BASED ON ThE FIRST 8 MONThS
Miles de toneladas / Thousand tons
Miles de toneladas / Thousand tons
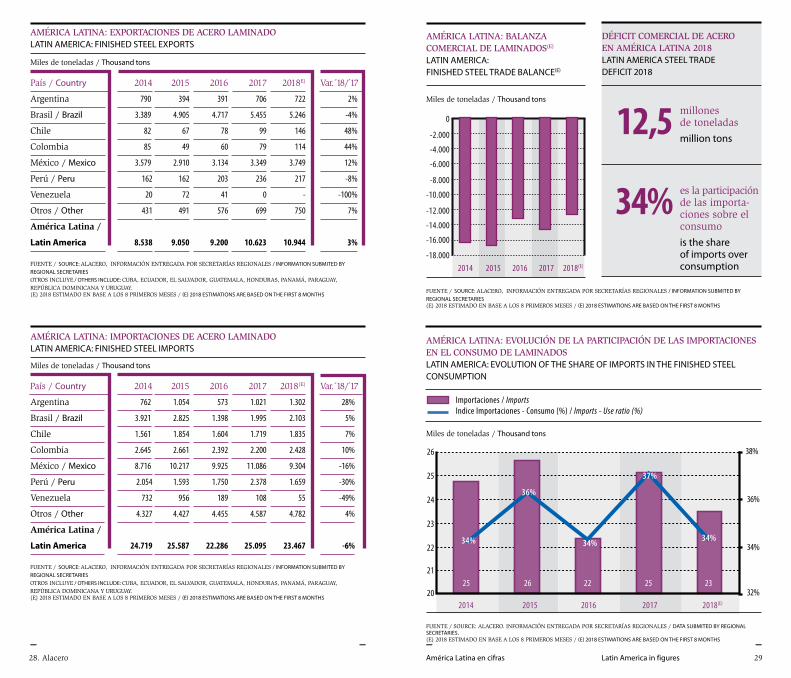
DéFicit comerciAL De Acero en AméricA LAtinA 2018LATIN AMERICA STEEL TRADE DEFICIT 2018
millones de toneladas
million tons
es la participación de las importa-ciones sobre el consumo
is the share of imports over consumption
12,5
34%
0
-2.000
-4.000
-6.000
-8.000
-10.000
-12.000
-14.000
-16.000
-18.0002018(E)2017201620152014
2018(E)2017201620152014
25
24
23
22
21
20
34%
25
36%
26
34%
22
37%
25
34%
23
38%
36%
34%
32%
26
AméricA LAtinA: BALAnzA comerciAL De LAminADos(e)
LATIN AMERICA: FINIShED STEEL TRADE BALANCE(E)
Miles de toneladas / Thousand tons
AméricA LAtinA: evoLución De LA PArticiPAción De LAs imPortAciones en eL consumo De LAminADosLATIN AMERICA: EvOLUTION OF ThE ShARE OF IMPORTS IN ThE FINIShED STEEL CONSUMPTION
Miles de toneladas / Thousand tons
2018(E)2017201620152014
25
24
23
22
21
20
34%
25
36%
26
34%
22
37%
25
34%
23
38%
36%
34%
32%
26
FUENTE / SOURCE: ALACERO. INFORMACIóN ENTREgADA POR SECRETARíAS REgIONALES / DATA SUBMITED By REGIONAL SECRETARIES. (E) 2018 ESTIMADO EN BASE A LOS 8 PRIMEROS MESES / (E) 2018 ESTIMATIONS ARE BASED ON ThE FIRST 8 MONThS
FUENTE / SOURCE: ALACERO, INFORMACIóN ENTREgADA POR SECRETARíAS REgIONALES / INFORMATION SUBMITED By REGIONAL SECRETARIES(E) 2018 ESTIMADO EN BASE A LOS 8 PRIMEROS MESES / (E) 2018 ESTIMATIONS ARE BASED ON ThE FIRST 8 MONThS
América Latina en cifras Latin America in figures 31
_ _ 30. Alacero
_ _
07. Indicadores económicos y siderúrgicos de América Latina Latin America: Economic and steel indicators
Crecimiento moderado
A pesar de la incertidumbre política
causada por los ciclos electorales
en las principales economías de
la región, las crecientes tensiones
comerciales generadas por el
proteccionismo de Estados Unidos
y la fuerte crisis financiera que
se mantiene en Argentina desde
el segundo trimestre, América
Latina se ha beneficiado con el
crecimiento económico mundial y
los altos niveles en los precios de
los commodities.
De acuerdo con el Fondo Monetario
Internacional (FMI), el crecimiento
en 2018 será de 1,2%, manteniendo
prácticamente el mismo ritmo
del año pasado. Sería el segundo
año consecutivo de recuperación
moderada del periodo recesivo
2015-2016.
Para 2019, se observa un
crecimiento del 2,1% en la
región, principalmente a raíz
de recuperaciones económicas
más amplias en Brasil, México, y
Colombia.
Moderate growth
Despite the political uncertainty caused by the electoral cycles in the main economies of the region, the escalatory trade tensions due to United States protectionism, and the strong financial crisis that is facing Argentina since second tri-mester, Latin America has benefited from world economic growth and high levels of commodity prices.According to the International Mon-etary Fund (IMF), growth in 2018 will be 1.2%, maintaining almost the same pace of last year. It would be the second consecutive year of moderate recovery of the recessive period 2015-2016.By 2019, a 2.1% growth is observed in the region, mainly due to of broader economic recoveries in Brazil, Mexico, and Colombia.
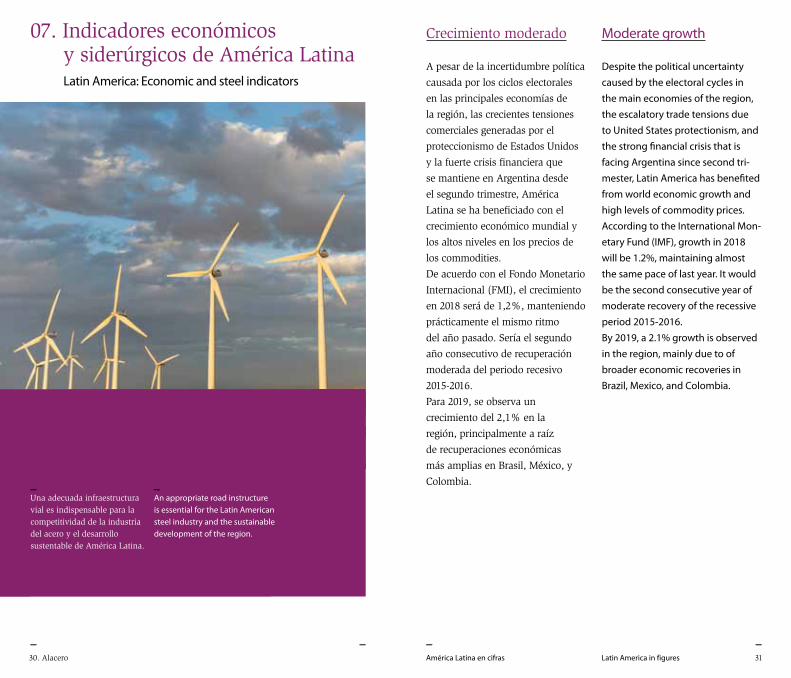
_Una adecuada infraestructura vial es indispensable para la competitividad de la industria del acero y el desarrollo sustentable de América Latina.
_An appropriate road instructure is essential for the Latin American steel industry and the sustainable development of the region.
32. Alacero América Latina en cifras Latin America in figures 33
_ _ _ _
Argentina
Brasil / Brazil
Chile
Colombia
México / Mexico
Perú / Peru
Venezuela
Otros / Other
América Latina /
Latin America
Argentina
Brasil / Brazil
Chile
Colombia
México / Mexico
Perú / Peru
Venezuela
América Latina /
Latin America
-2,5%
0,5%
1,8%
4,7%
2,8%
2,4%
-3,9%
4,7%
1,3%
2,7%
-3,5%
2,3%
3,0%
3,3%
3,3%
-6,2%
3,2%
0,3%
-1,8%
-3,5%
1,3%
2,0%
2,9%
4,0%
-16,5%
4,3%
-0,6%
2,9%
1,0%
1,5%
1,8%
2,0%
2,5%
-14,0%
4,6%
1,3%
-2,6%
1,4%
4,0%
2,8%
2,2%
4,1%
-18,0%
4,3%
1,2%
201620152014 2017 2018(E)
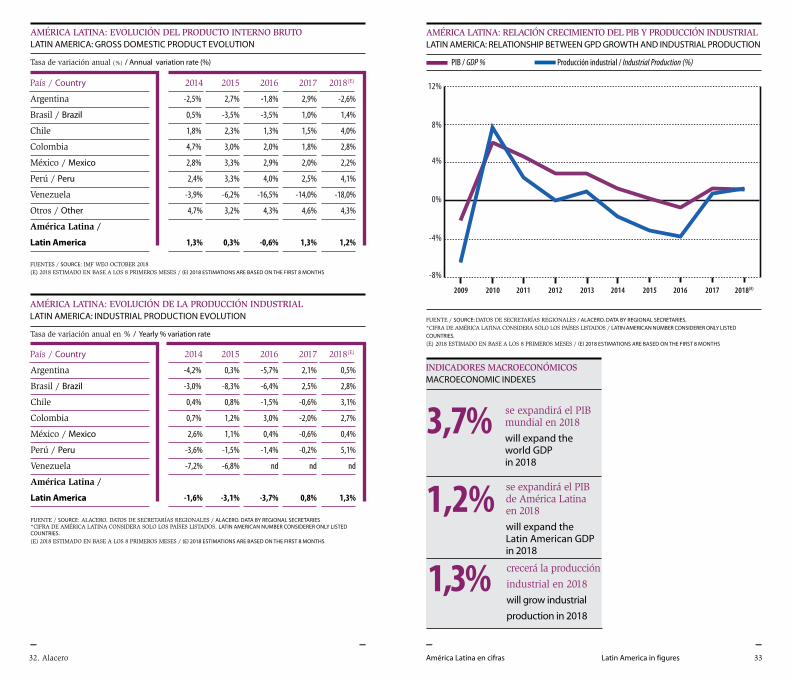
AméricA LAtinA: evoLución DeL ProDucto interno BrutoLATIN AMERICA: GROSS DOMESTIC PRODUCT EvOLUTION
AméricA LAtinA: evoLución De LA ProDucción inDustriALLATIN AMERICA: INDUSTRIAL PRODUCTION EvOLUTION
País / Country
País / Country
Tasa de variación anual (%) / Annual variation rate (%)
Tasa de variación anual en % / yearly % variation rate
FUENTES / SOURCE: IMF wEO OCTOBER 2018(E) 2018 ESTIMADO EN BASE A LOS 8 PRIMEROS MESES / (E) 2018 ESTIMATIONS ARE BASED ON ThE FIRST 8 MONThS
FUENTE / SOURCE: ALACERO. DATOS DE SECRETARíAS REgIONALES / ALACERO. DATA By REGIONAL SECRETARIES*CIFRA DE AMéRICA LATINA CONSIDERA SOLO LOS PAíSES LISTADOS. LATIN AMERICAN NUMBER CONSIDERER ONLy LISTED COUNTRIES.(E) 2018 ESTIMADO EN BASE A LOS 8 PRIMEROS MESES / (E) 2018 ESTIMATIONS ARE BASED ON ThE FIRST 8 MONThS
inDicADores mAcroeconómicosMACROECONOMIC INDExES
se expandirá el PIB mundial en 2018 will expand the world GDP in 2018
3,7% se expandirá el PIB de América Latina en 2018
will expand the Latin American GDP in 2018
1,2% crecerá la producción
industrial en 2018
will grow industrial production in 2018
1,3%
-4,2%
-3,0%
0,4%
0,7%
2,6%
-3,6%
-7,2%
-1,6%
0,3%
-8,3%
0,8%
1,2%
1,1%
-1,5%
-6,8%
-3,1%
-5,7%
-6,4%
-1,5%
3,0%
0,4%
-1,4%
nd
-3,7%
2,1%
2,5%
-0,6%
-2,0%
-0,6%
-0,2%
nd
0,8%
0,5%
2,8%
3,1%
2,7%
0,4%
5,1%
nd
1,3%
201620152014 2017 2018(E)
FUENTE / SOURCE: DATOS DE SECRETARíAS REgIONALES / ALACERO. DATA By REGIONAL SECRETARIES. *CIFRA DE AMéRICA LATINA CONSIDERA SOLO LOS PAíSES LISTADOS / LATIN AMERICAN NUMBER CONSIDERER ONLy LISTED COUNTRIES.(E) 2018 ESTIMADO EN BASE A LOS 8 PRIMEROS MESES / (E) 2018 ESTIMATIONS ARE BASED ON ThE FIRST 8 MONThS
2017
12%
2015201420132012201120102009
8%
4%
0%
-4%
-8%
2016 2018(E)
PIB / GDP % Producción industrial / Industrial Production (%)
AméricA LAtinA: reLAción crecimiento DeL PiB y ProDucción inDustriALLATIN AMERICA: RELATIONShIP BETWEEN GPD GROWTh AND INDUSTRIAL PRODUCTION
34. Alacero
_ _
08. Siderurgia china: Impacto sobre América Latina Chinese steel industry: Impact on Latin America
América Latina en cifras Latin America in figures 35
_ _
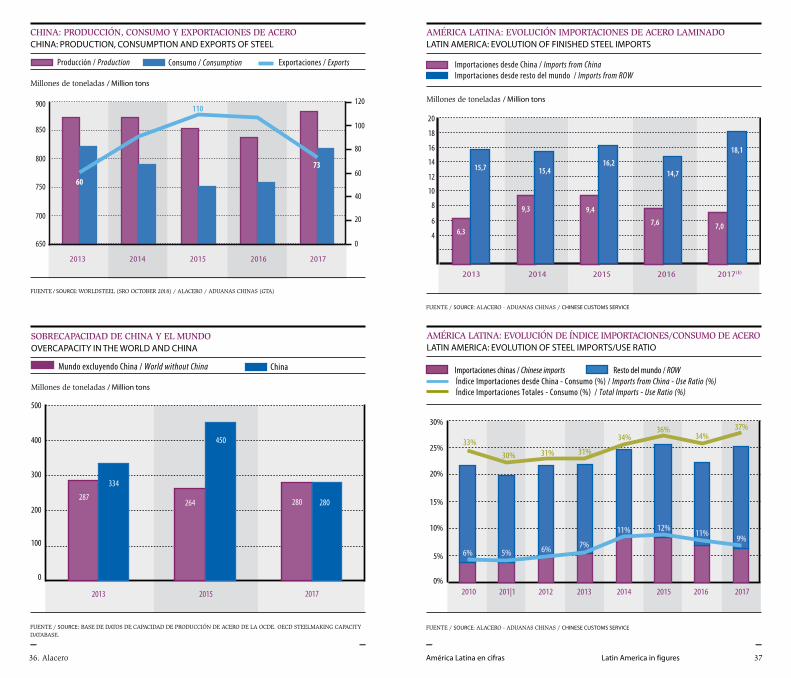
China aumenta su producción y consumo
La economía de China ha cumplido
las expectativas de crecimiento,
alcanzando un promedio de 6,8%
anualizado durante el primer
semestre del año.
En 2018, las exportaciones chinas
de acero laminado han disminuido
frente al año anterior, principal-
mente por el acentuado crecimiento
en el consumo aparente de lamina-
dos que asciende a 781 millones de
toneladas (6,0%) más que en 2017.
Desde 2016 China comenzó un plan
de reducción de su capacidad in-
stalada de acero, y desde entonces
ha logrado revertir la tendencia de
crecimiento acelerado y al cierre de
2017 su capacidad era de 1.047 mil-
lones de toneladas, 4% menos que
el año previo de acuerdo a cifras de
la OCDE.
A pesar de estas reducciones, el
gigante asiático sigue elevando sus
cifras de producción. El acumulado
de acero crudo producido durante
los 8 primeros meses del año es
6% mayor al del mismo período
de 2017.
China increases its production and consumption
China’s economy has met growth expectations, reaching an annualized average of 6.8% during the first half of the year.In 2018, Chinese exports finished steel capacity have decreased compared to the previous year, mainly due to the apparent steel consumption strong growth, accounting 781 million tons (6.0%) more than in 2017.In 2016 China started a plan to reduce its installed steel capacity, and since then they have managed to reverse the accelerated growth trend and at the end of 2017 its capacity was 1,047 million tons, 4% less than the previous year according to OECD data.Despite these reductions, the Asian giant continues to raise its production figures. The accumulated crude steel produced during the first 8 months of the year is 6% higher than the same period of 2017._
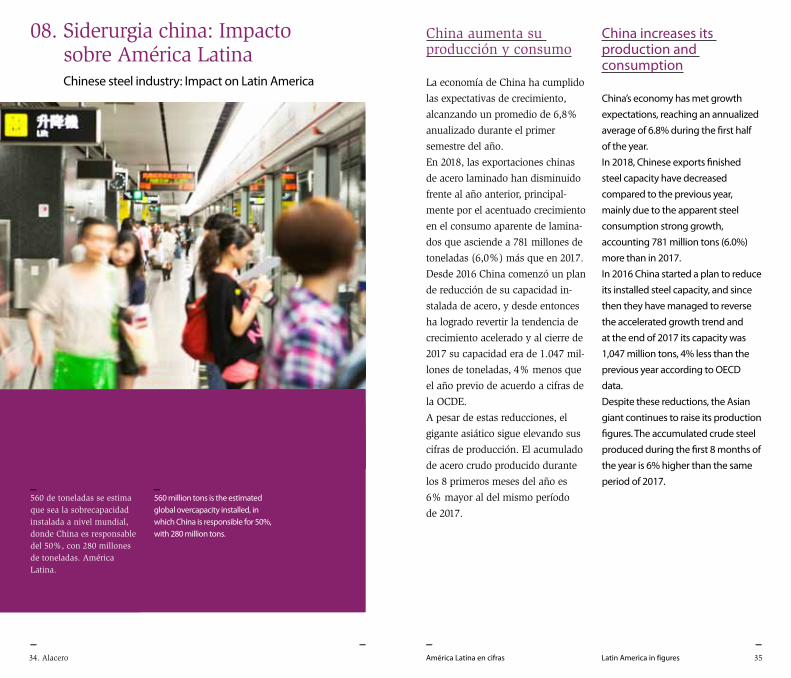
560 million tons is the estimated global overcapacity installed, in which China is responsible for 50%, with 280 million tons.
_560 de toneladas se estima que sea la sobrecapacidad instalada a nivel mundial, donde China es responsable del 50%, con 280 millones de toneladas. América Latina.
36. Alacero América Latina en cifras Latin America in figures 37
_ _ _ _
2013 2014 2015 2016 2017(E)
6,3
15,7 15,4
9,3 9,4
16,2
7,6
14,7
7,0
18,1
2012 2013 2014 2015 2016
33%
30% 31%
34%37%
20172010 201|1
36%30%
25%
20%
5%
0%
34%
9%
31%
11%12%11%
7%6%5%6%
15%
10%
650
700
750
120
100
80
60
40
20
0
2013 2014 2015 2016 2017
Producción / Production Consumo / Consumption Exportaciones / Exports
60
110
800
850
900
73
FUENTE / SOURCE: wORLDSTEEL (SRO OCTOBER 2018) / ALACERO / ADUANAS ChINAS (gTA)
FUENTE / SOURCE: BASE DE DATOS DE CAPACIDAD DE PRODUCCIóN DE ACERO DE LA OCDE. OECD STEELMAkINg CAPACITy DATABASE.
FUENTE / SOURCE: ALACERO - ADUANAS ChINAS / ChINESE CUSTOMS SERvICE
SOBRECAPACIDAD DE CHINA Y EL MUNDO
0
100
200
300
400
500
Millones de toneladas / Million tons
2013 2015 2017
Mundo excluyendo China / World without China China
OVERCAPACITY IN THE WORLD AND CHINA
287264 280 280
450
334
cHinA: ProDucción, consumo y eXPortAciones De AceroChINA: PRODUCTION, CONSUMPTION AND ExPORTS OF STEEL
Millones de toneladas / Million tons
650
700
750
120
100
80
60
40
20
0
2013 2014 2015 2016 2017
Producción / Production Consumo / Consumption Exportaciones / Exports
60
110
800
850
900
73
soBrecAPAciDAD De cHinA y eL munDoOvERCAPACITy IN ThE WORLD AND ChINA
Millones de toneladas / Million tons
SOBRECAPACIDAD DE CHINA Y EL MUNDO
0
100
200
300
400
500
Millones de toneladas / Million tons
2013 2015 2017
Mundo excluyendo China / World without China China
OVERCAPACITY IN THE WORLD AND CHINA
287264 280 280
450
334
AméricA LAtinA: evoLución imPortAciones De Acero LAminADoLATIN AMERICA: EvOLUTION OF FINIShED STEEL IMPORTS
2013 2014 2015 2016 2017(E)
6,3
15,7 15,4
9,3 9,4
16,2
7,6
14,7
7,0
18,1
Millones de toneladas / Million tons
AméricA LAtinA: evoLución De ínDice imPortAciones/consumo De AceroLATIN AMERICA: EvOLUTION OF STEEL IMPORTS/USE RATIO
2012 2013 2014 2015 2016
33%
30% 31%
34%37%
20172010 201|1
36%30%
25%
20%
5%
0%
34%
9%
31%
11%12%11%
7%6%5%6%
15%
10%
FUENTE / SOURCE: ALACERO - ADUANAS ChINAS / ChINESE CUSTOMS SERvICE
Importaciones chinas / Chinese imports Resto del mundo / ROW

Asociación Latinoamericana del Acero
Alameda Santos 2.300, conjunto 62
CEP: 01418-200 - São Paulo, SP, Brasil
[email protected] | www.alacero.org
Tel: (+55) 11 3195 5491
@RedAlacero Alacero Alacero