Embed Size (px)
Citation preview
1 9 9 1 - 2 0 1 0
AnuArio de estAdísticAs del cobre y otros MinerAles Yearbook: Copper and other Mineral StatiStiCS
COCHILCOCOmIsIón CHILena deL CObre
1
1 9 9 1 - 2 0 1 0
AnuArio de estAdísticAs del cobre y otros MinerAles Yearbook: Copper and other Mineral StatiStiCS
COCHILCO
Comisión Chilena del Cobre

2
3
Í N D I C E / c o n t e n t s
PRESENTACIÓN 10FOREWORD 11
CAPÍTULO 1 : LA MINERÍA CHILENA 13CHAPTER 1 : THE CHILEAN MINING SECTOR 13
1.1 PRODUCCIÓN MINERA 15 MininG sector Production
tAblA 1.1 Producción de la Minería de chile, Metálica, no Metálica y combustibles 1991-2000 16 table 1.1 Mining production: Metals, industrial Minerals and Fuels, 1991-2000
tAblA 1.2 Producción de la Minería de chile, Metálica, no Metálica y combustibles 2001-2010 17 table 1.2 Mining production: Metals, industrial Minerals and Fuels, 2001-2010
tAblA 2.1 Producción chilena de cobre comerciable por empresas y Productos 1991-2000 18 table 2.1 Copper production by Company and product type, 1991-2000
tAblA 2.2 Producción chilena de cobre comerciable por empresas y Productos 2001-2010 19 table 2.2 Copper production by Company and product type, 2001-2010
tAblA 3.1 índice de Producción Minera 1991-2000 20
table 3.1 Mining Sector production index, 1991-2000
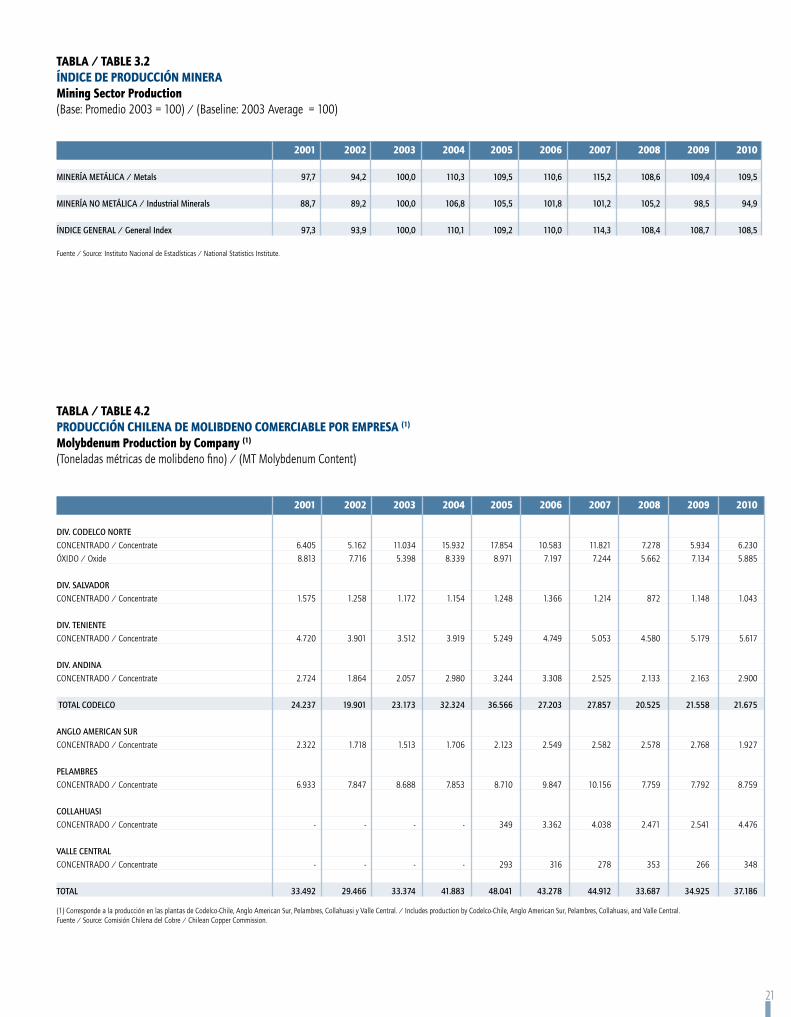
tAblA 3.2 índice de Producción Minera 2001-2010 21 table 3.2 Mining Sector production index, 2001-2010
tAblA 4.1 Producción chilena de Molibdeno comerciable por empresa 1991-2000 20 table 4.1 Molybdenum production by Company, 1991-2000
tAblA 4.2 Producción chilena de Molibdeno comerciable por empresa 2001-2010 21 table 4.2 Molybdenum production by Company, 2001-2010
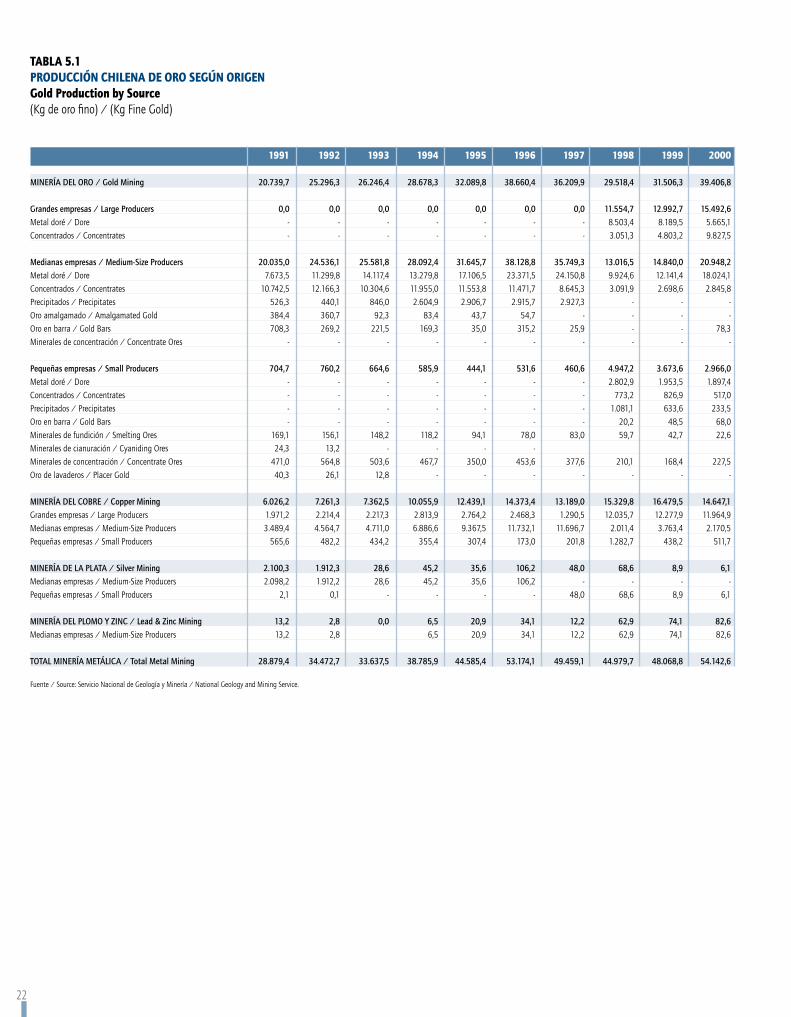
tAblA 5.1 Producción chilena de oro según origen 1991-2000 22 table 5.1 Gold production by Source, 1991-2000
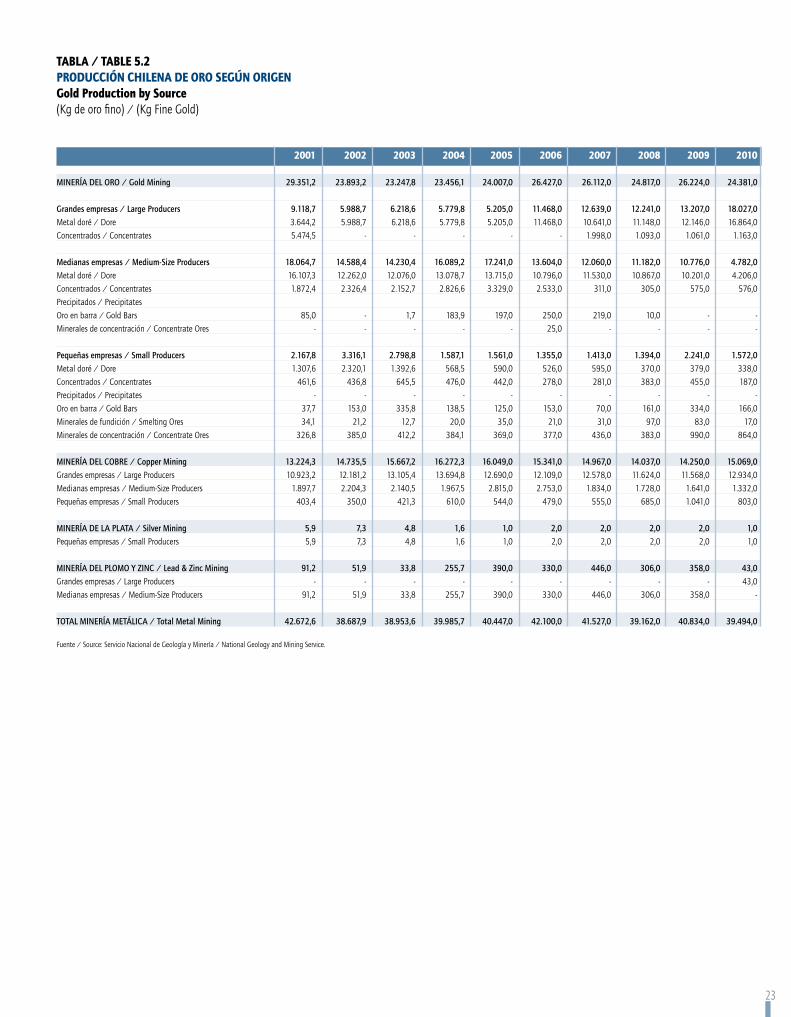
tAblA 5.2 Producción chilena de oro según origen 2001-2010 23 table 5.2 Gold production by Source, 2001-2010
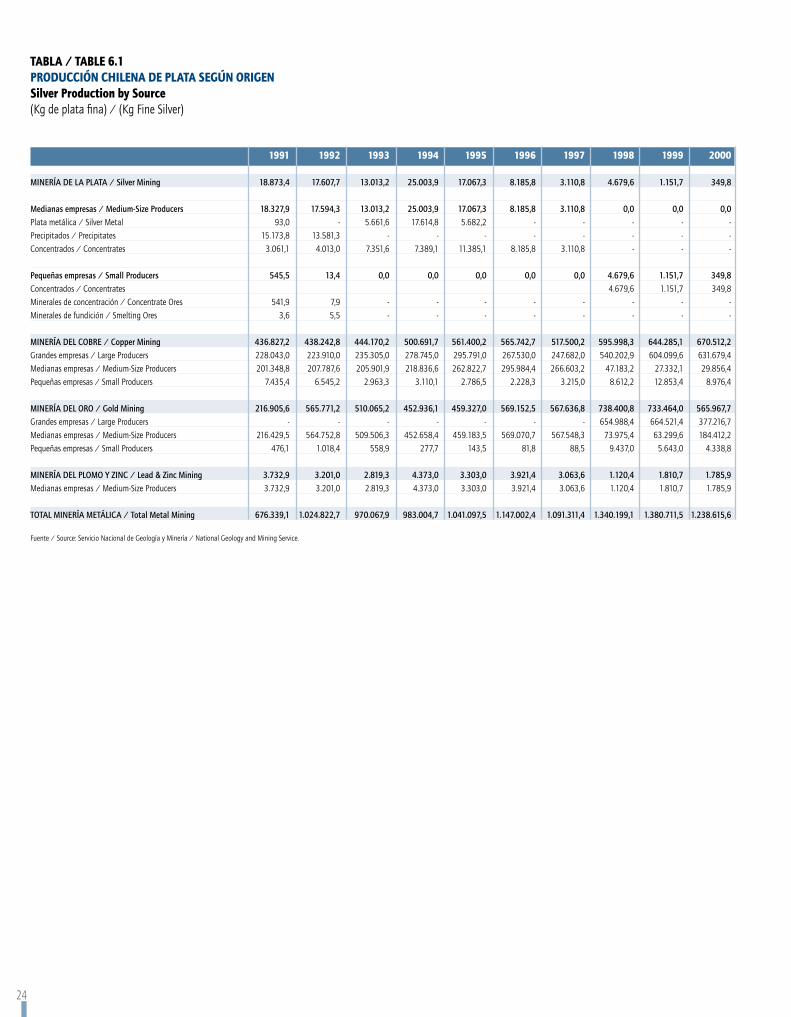
tAblA 6.1 Producción chilena de Plata según origen 1991-2000 24 table 6.1 Silver production by Source, 1991-2000
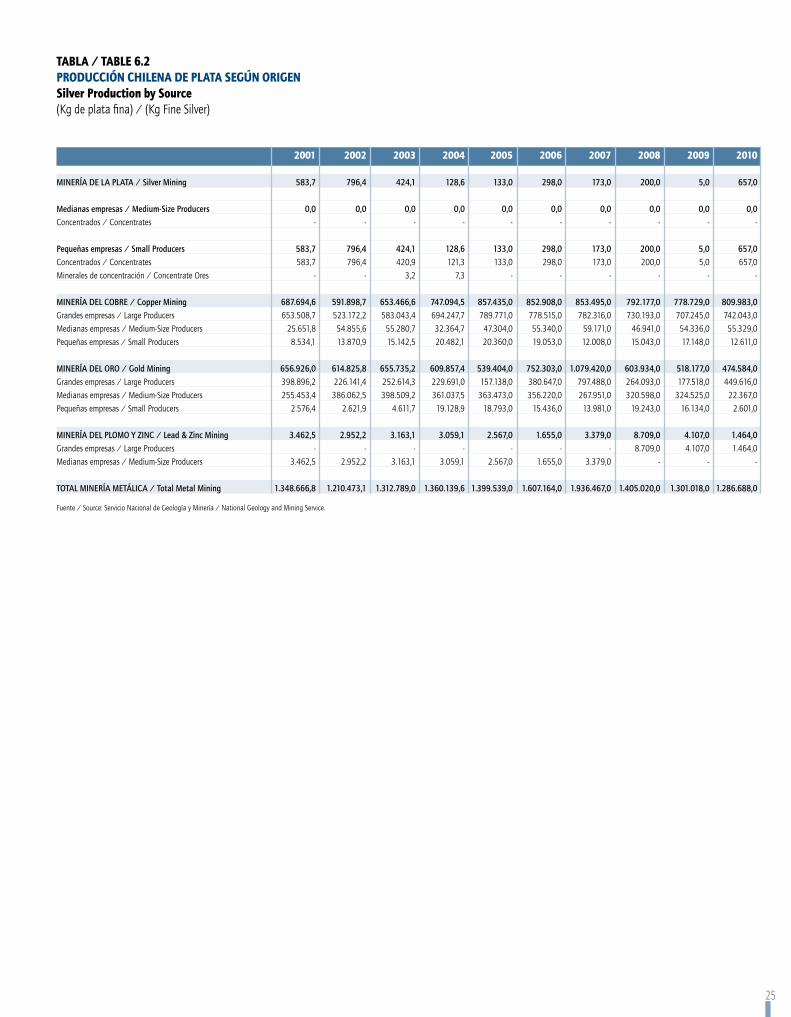
tAblA 6.2 Producción chilena de Plata según origen 2001-2010 25 tabla 6.2 Silver production by Source, 2001-2010
1.2 EXPORTACIONES MINERAS 27 MininG eXPorts
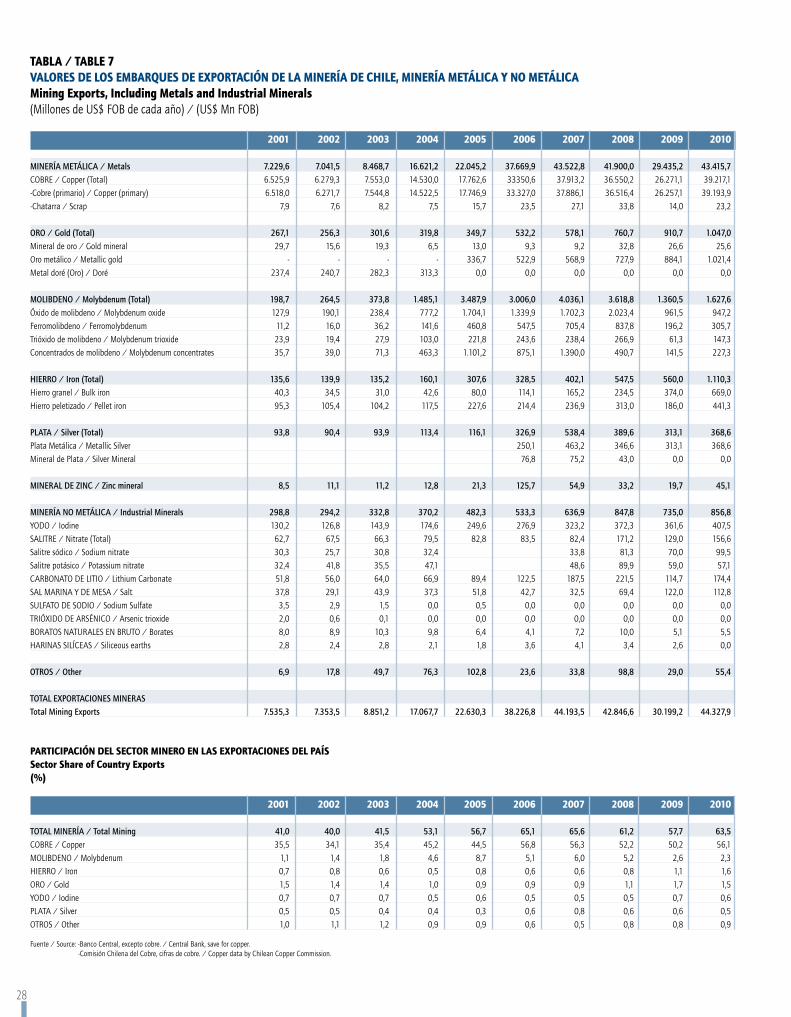
tAblA 7 Valores de los embarques de exportación de la Minería de chile, Metálica y no Metálica 2001-2010 28 table 7 Mining exports, including Metals and industrial Minerals (US$), 2001-2010
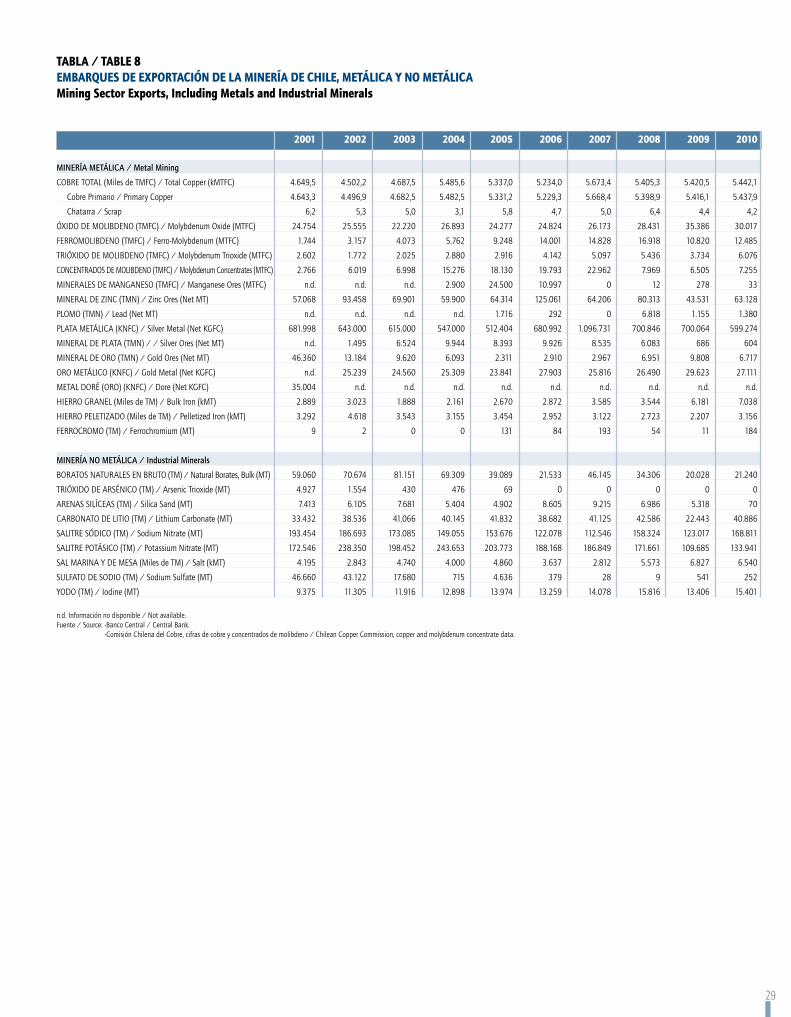
tAblA 8 embarques de exportación de la Minería de chile, Metálica y no Metálica 2001-2010 29 table 8 Mining exports, including Metals and industrial Minerals, 2001-2010
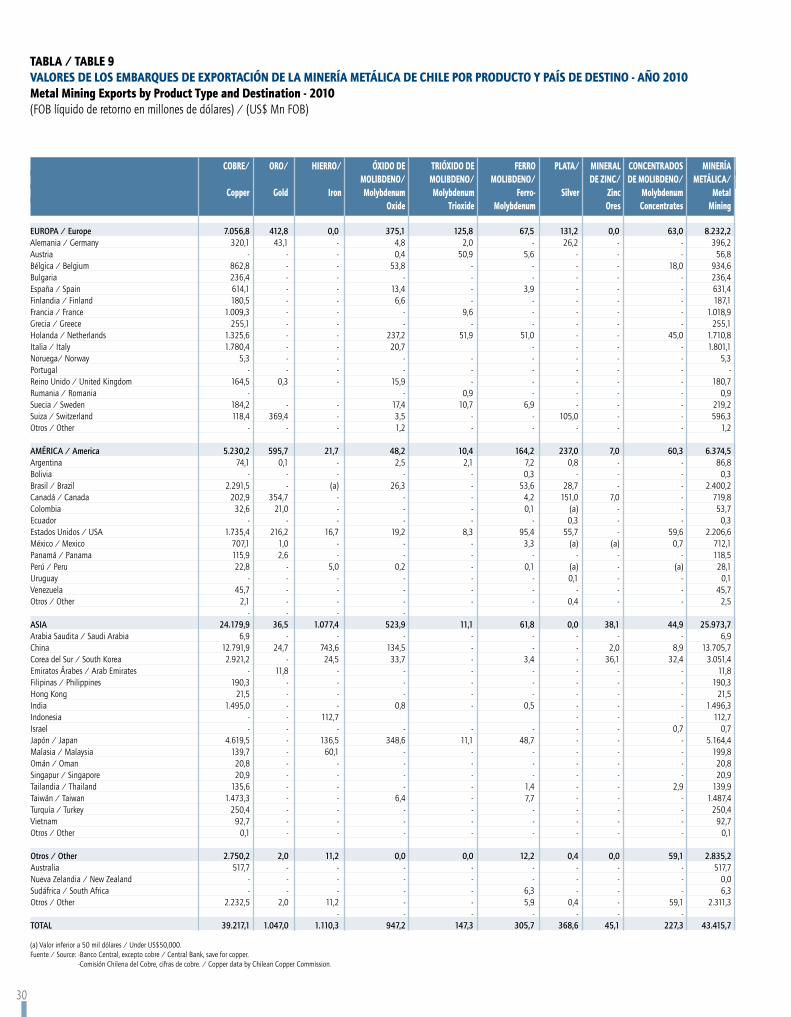
tAblA 9 Valores de los embarques de exportación de la Minería Metálica de chile por Producto y País de destino-año 2010 30 table 9 Metal Mining exports by product type and destination - 2010 (US$)
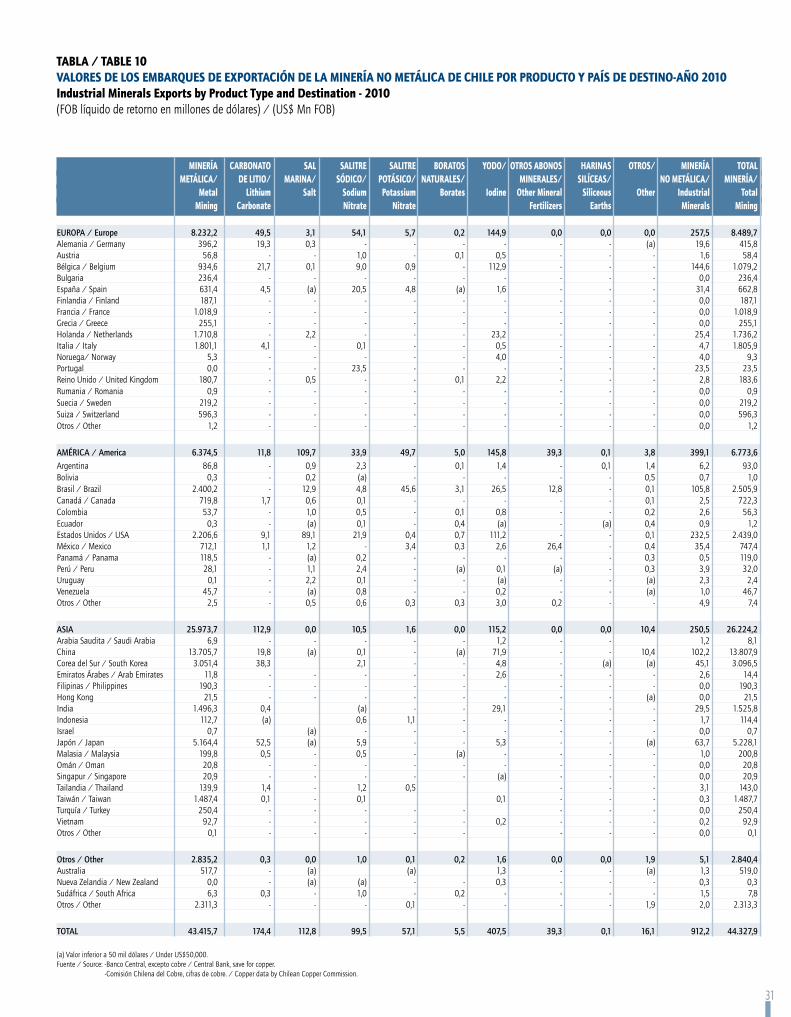
tAblA 10 Valores de los embarques de exportación de la Minería no Metálica de chile por Producto y País de destino-año 2010 31 table 10 industrial Minerals exports by product type and destination – 2010 (US$)
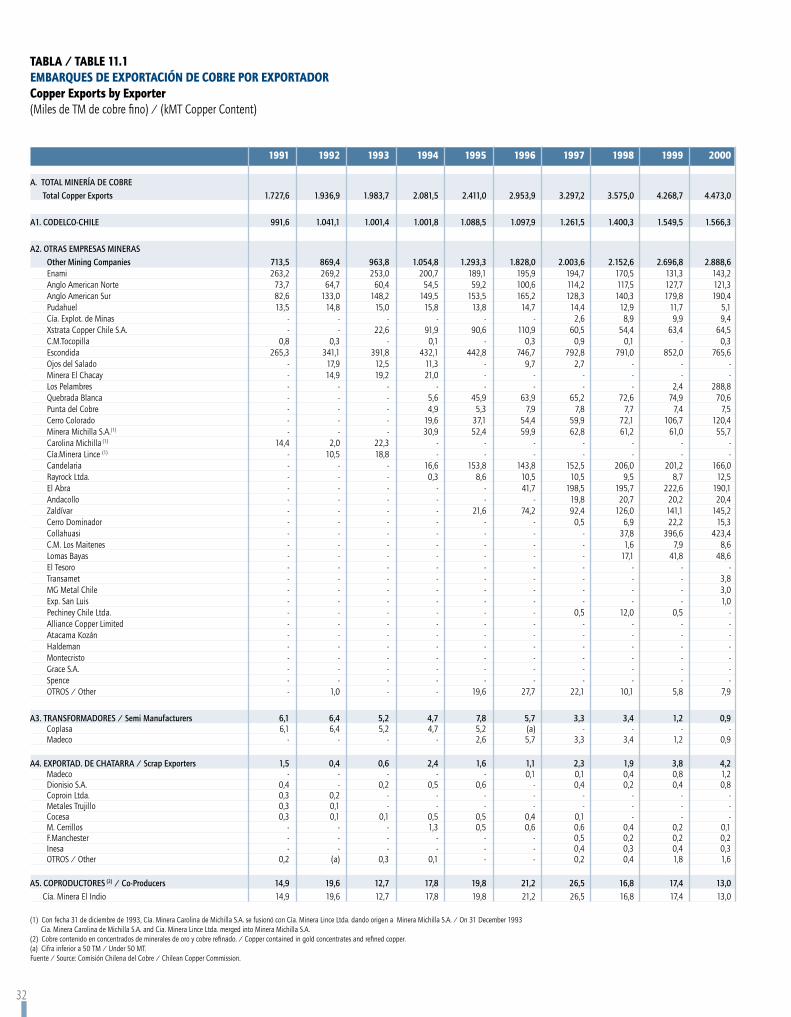
tAblA 11.1 embarques de exportación de cobre por exportador 1991-2000 32 table 11.1 Copper exports by exporter, 1991-2000
tAblA 11.2 embarques de exportación de cobre por exportador 2001-2010 33 table 11.2 Copper exports by exporter, 2001-2010
tAblA 12.1 Valores de los embarques de exportación de cobre por Productos 1991-2000 34 table 12.1 Copper exports by product type (US$), 1991-2000
tAblA 12.2 Valores de los embarques de exportación de cobre por Productos 2001-2010 35 table 12.2 Copper exports by product type (US$), 2001-2010
tAblA 13.1 embarques Físicos de exportación de cobre por Productos 1991-2000 36 table 13.1 Copper exports by product type, 1991-2000
4
tAblA 13.2 embarques Físicos de exportación de cobre por Productos 2001-2010 37 table 13.2 Copper exports by product type, 2001-2010
tAblA 14.1 Valores de los embarques de exportación de cobre por País de destino 1991-2000 38 table 14.1 Copper exports by destination (US$), 1991-2000
tAblA 14.2 Valores de los embarques de exportación de cobre por País de destino 2001-2010 39 table 14.2 Copper exports by destination (US$), 2001-2010
tAblA 15.1 embarques de exportación de cobre por País de destino 1991-2000 40 table 15.1 Copper exports by destination, 1991-2000
tAblA 15.2 embarques de exportación de cobre por País de destino 2001-2010 41 table 15.2 Copper exports by destination, 2001-2010
tAblA 16.1 Participación en los embarques de exportación de cobre por País de destino 1991-2000 42 table 16.1 Share of Copper exports by destination, 1991-2000
tAblA 16.2 Participación en los embarques de exportación de cobre por País de destino 2001-2010 43 table 16.2 Share of Copper exports by destination, 2001-2010
tAblA 17.1 embarques de exportación de cobre refinado por País de destino 1991-2000 44 table 17.1 refined Copper exports by destination, 1991-2000
tAblA 17.2 embarques de exportación de cobre refinado por País de destino 2001-2010 45 table 17.2 refined Copper exports by destination, 2001-2010
tAblA 18.1 embarques de exportación de cobre blíster por País de destino 1991-2000 46 table 18.1 blister Copper exports by destination, 1991-2000
tAblA 18.2 embarques de exportación de cobre blíster por País de destino 2001-2010 47 table 18.2 blister Copper exports by destination, 2001-2010
tAblA 19.1 embarques de exportación de Graneles de cobre por País de destino 1991-2000 48 table 19.1 bulk Copper exports by destination, 1991-2000
tAblA 19.2 embarques de exportación de Graneles de cobre por País de destino 2001-2010 49 table 19.2 bulk Copper exports by destination, 2001-2010
tAblA 20.1 Valores de los embarques de exportación de cobre y subproductos por País de destino 1991-2000 50 table 20.1 Copper and Copper byproduct exports by destination (US$), 1991-2000
tAblA 20.2 Valores de los embarques de exportación de cobre y subproductos por País de destino 2001-2010 51 table 20.2 Copper and Copper byproduct exports by destination (US$), 2001-2010
tAblA 21.1 Valores de los embarques de exportación de concentrados de Molibdenita por País de destino 1991-2000 52 table 21.1 Molybdenite Concentrate exports by destination (US$), 1991-2000
tAblA 21.2 Valores de los embarques de exportación de concentrados de Molibdenita por País de destino 2001-2010 53 table 21.2 Molybdenite Concentrate exports by destination (US$), 2001-2010
tAblA 22.1 embarques de exportación de concentrado de Molibdenita por País de destino 1991-2000 54 table 22.1 Molybdenite Concentrate exports by destination, 1991-2000
tAblA 22.2 embarques de exportación de concentrado de Molibdenita por País de destino 2001-2010 55 table 22.2 Molybdenite Concentrate exports by destination, 2001-2010
tAblA 23.1 Valores de los embarques de exportación de otros subproductos del cobre por País de destino 1991-2000 56 table 23.1 exports of other Copper byproducts, by destination (US$), 1991-2000
tAblA 23.2 Valores de los embarques de exportación de otros subproductos del cobre por País de destino 2001-2010 57 table 23.2 exports of other Copper byproducts, by destination (US$), 2001-2010
tAblA 24 Valores de los embarques de exportación Manufacturados de cobre y Productos de la Minería no Metálica 2001-2010 58 table 24 Copper Semis and industrial Mineral product exports (US$), 2001-2010
tAblA 25 embarques de exportación Manufacturados de cobre y Productos de la Minería no Metálica 2001-2010 59 table 25 Copper Semis and industrial Mineral product exports, 2001-2010
1.3 ANTECEDENTES DE LOS CONTRATOS DE EXPORTACIONES CHILENAS DE COBRE AÑO 2010 61 cHileAn coPPer eXPort contrActs - 2010
1.3.1 características de los contratos de exportación de cátodos de cobre Año 2010 62 2010 Cathode export Contracts
tAblA 26 compromisos de exportación de cátodos de cobre Año 2010 63 table 26 2010 Cathode export agreements
1.3.2 características de los contratos de exportación de concentrados de cobre Año 2010 64 2010 Concentrate export Contracts
tAblA 27 compromisos de exportación de concentrados de cobre Año 2010 65 table 27 2010 Concentrate export agreements
5
1.4 EL SECTOR MINERO Y LA ECONOMÍA CHILENA 67 cHileAn MininG sector And econoMy
tAblA 28.1 Producto interno bruto por clase de Actividad económica a Precios constantes de 2003, 2003-2010 68 table 28.1 Gross domestic product by Sector of economy at Constant 2003 prices, 2003-2010
tAblA 28.2 Producto interno bruto por clase de Actividad económica a Precios corrientes, 2003-2010 69 table 28.2 Gross domestic product by Sector of economy at Current prices, 2003-2010
tAblA 29 inversión extranjera en chile según dl-600, 1974-2010 70 table 29 Fdi Under decree-law 600, 1974-2010
tAblA 30 inversión Gran Minería de cobre y oro en chile 2001-2010 71 table 30 large-Scale Copper and Gold Mining investments, 2001-2010
tAblA 31.1 Personal ocupado en Minería 1991-2000 72 table 31.1 employment in the Mining Sector, 1991-2000
tAblA 31.2 Personal ocupado en Minería 2001-2010 73 table 31.2 employment in the Mining Sector, 2001-2010
tAblA 32.1 tributación Gran Minería Privada del cobre (GMP-10) y Aportes de empresas Mineras estatales a los ingresos Fiscales 1991-2000 74 table 32.1 large-Scale private Mining Company (GMp-10) taxes paid and Contribution of publicly-owned Mining Companies to public treasury, 1991-2000
tAblA 32.2 tributación Gran Minería Privada del cobre (GMP-10) y Aportes de empresas Mineras estatales a los ingresos Fiscales 2001-2010 75 table 32.2 large-Scale private Mining Company (GMp-10) taxes paid and Contribution of publicly-owned Mining Companies to public treasury, 2001-2010
tAblA 33.1 índice nominal de remuneraciones por Actividad económica 1991-2000 76 table 33.1 nominal Wage index by Sector of economy, 1991-2000
tAblA 33.2 índice nominal de remuneraciones por Actividad económica 2001-2010 77 table 33.2 nominal Wage index by Sector of economy, 2001-2010
1.5 INSUMOS ESTRATÉGICOS PARA LA MINERÍA CHILENA 79 cHileAn MininG: strAteGic suPPlies
1.5.1 energía energy
tAblA 34 consumo de combustibles por tonelada de cobre Fino contenido en el Producto de cada Área de Proceso 2001-2010 80 table 34 Fuel Use per ton of refined Copper Content, by process, 2001-2010
tAblA 35 consumo de combustibles por tonelada de Material extraído y Procesado en cada Área de Proceso 2001-2010 81 table 35 Fuel Use per ton of ore Mined and processed, by process, 2001-2010
tAblA 36 consumo de energía eléctrica por tonelada de cobre Fino contenido en el Producto de cada Área de Proceso 2001-2010 82
table 36 electricity Use per ton of Copper Content, by process, 2001-2010
tAblA 37 consumo de energía eléctrica por tonelada de Material extraído y Procesado en cada Área de Proceso 2001-2010 83 table 37 electricity Use per ton of ore Mined and processed, by process, 2001-2010
1.5.2 Ácido sulfúrico Sulfuric acid
tAblA 38 consumo Aparente, Producción, importaciones y exportaciones de Ácido sulfúrico en chile 2001-2010 84 table 38 Sulfuric acid: apparent Consumption, production, import and export, 2001-2010
tAblA 39 Producción chilena de Ácido sulfúrico por regiones 2001-2010 84 table 39 Chilean Sulfuric acid production, by region, 2001-2010
tAblA 40 Valores de embarques de importación de Ácido sulfúrico según País de origen 2001-2010 85 table 40 Sulfuric acid imports, by Country of origin (US$ ‘000 CiF), 2001-2010
tAblA 41 embarques Físicos de importación de Ácido sulfúrico según País de origen 2001-2010 86 table 41 Sulfuric acid imports, by Country of origin (Mt), 2001-2010
tAblA 42 Valores unitarios de embarques de importación de Ácido sulfúrico según País de origen 2001-2010 87 table 42 Unit Value of Sulfuric acid imports, by Country of origin, 2001-2010
tAblA 43 Valores de los embarques de exportación de Ácido sulfúrico por País de destino 2001-2010 88 table 43 Sulfuric acid exports, by destination (net US$ ‘000 Fob), 2001-2010
tAblA 44 embarques Físicos de exportación de Ácido sulfúrico por País de destino 2001-2010 88 table 44 Sulfuric acid exports, by destination (Mt), 2001-2010
tAblA 45 Valores unitarios de embarques de exportación de Ácido sulfúrico por País de destino 2001-2010 89 table 45 Unit Value of Sulfuric acid exports, by destination, 2001-2010
6
1.6 INDICADORES DE COMPETITIVIDAD DE LA INDUSTRIA DEL COBRE EN CHILE 91 cHileAn coPPer industry: coMPetitiVeness indicAtors
tAblA 46 índice de costos totales unitarios de cobre en chile, empresas GMP-10 y codelco 2001-2010 92 table 46 Chilean Copper: index of total Unit Costs, GMp-10 Companies & CodelCo, 2001-2010
tAblA 47 ley Promedio de Mineral de cobre en las operaciones Mineras en chile por tipo de Proceso 2001-2010 92 table 47 average Copper Mining Grades in Chile, by process type, 2001-2010
tAblA 48 índice de Productividad laboral de dotación Propia en chile, empresas GMP-10 y codelco 2005-2010 93
table 48 own Workforce productivity index, GMp-10 Companies + CodelCo, 2005-2010
tAblA 49 codelco, Principales indicadores Gestión corporativa 1991-2010 94 table 49 CodelCo: leading indicators, 1991-2010
tAblA 50 emisiones directas e indirectas de Gases de efecto invernadero por tonelada de cobre Fino contenido 95 en el Producto de cada Área de Proceso 2000-2009 table 50 direct and indirect Greenhouse Gas emissions per ton of Copper Content, by process type, 2000-2009
tAblA 51 emisiones totales de Gases de efecto invernadero de la Minería del cobre de chile 2000-2009 96
table 51 total Greenhouse Gas emissions, Chilean Copper Mining industry, 2000-2009
1.7 MINERÍA REGIONAL 97 reGionAl MininG
tAblA 52.1 Producción Minera - i región de tarapacá, Metálica, no Metálica y combustibles 1991-2000 98 table 52.1 Mining production - region i tarapaca, Metals, industrial Minerals and Fuels, 1991-2000
tAblA 52.2 Producción Minera - i región de tarapacá, Metálica, no Metálica y combustibles 2001-2010 99 table 52.2 Mining production - region i tarapaca, Metals, industrial Minerals and Fuels, 2001-2010
tAblA 53.1 Producción Minera - ii región de Antofagasta, Metálica, no Metálica y combustibles 1991-2000 100 table 53.1 Mining production - region ii antofagasta, Metals, industrial Minerals and Fuels, 1991-2000
tAblA 53.2 Producción Minera - ii región de Antofagasta, Metálica, no Metálica y combustibles 2001-2010 101 table 53.2 Mining production - region ii antofagasta, Metals, industrial Minerals and Fuels, 2001-2010
tAblA 54.1 Producción Minera -iii región de Atacama, Metálica, no Metálica y combustibles 1991-2000 102 table 54.1 Mining production - region iii atacama, Metals, industrial Minerals and Fuels, 1991-2000
tAblA 54.2 Producción Minera - iii región de Atacama, Metálica, no Metálica y combustibles 2001-2010 103 table 54.2 Mining production - region iii atacama, Metals, industrial Minerals and Fuels, 2001-2010
tAblA 55.1 Producción Minera - iV región de coquimbo, Metálica, no Metálica y combustibles 1991-2000 104 table 55.1 Mining production - region iV Coquimbo, Metals, industrial Minerals and Fuels, 1991-2000
tAblA 55.2 Producción Minera - iV región de coquimbo, Metálica, no Metálica y combustibles 2001-2010 105 table 55.2 Mining production - region iV Coquimbo, Metals, industrial Minerals and Fuels, 2001-2010
tAblA 56.1 Producción Minera - V región de Valparaíso, Metálica, no Metálica y combustibles 1991-2000 106 table 56.1 Mining production - region V Valparaiso, Metals, industrial Minerals and Fuels, 1991-2000
tAblA 56.2 Producción Minera - V región de Valparaíso, Metálica, no Metálica y combustibles 2001-2010 107 table 56.2 Mining production - region V Valparaiso, Metals, industrial Minerals and Fuels, 2001-2010
tAblA 57.1 Producción Minera - Vi región de o’Higgins, Metálica, no Metálica y combustibles 1991-2000 108 table 57.1 Mining production - region Vi o’higgins, Metals, industrial Minerals and Fuels, 1991-2000
tAblA 57.2 Producción Minera - Vi región de o’Higgins, Metálica, no Metálica y combustibles 2001-2010 109 table 57.2 Mining production - region Vi o’higgins, Metals, industrial Minerals and Fuels, 2001-2010
tAblA 58.1 Producción Minera - Vii región del Maule, Metálica, no Metálica y combustibles 1991-2000 110 table 58.1 Mining production - region Vii Maule, Metals, industrial Minerals and Fuels, 1991-2000
tAblA 58.2 Producción Minera - Vii región del Maule, Metálica, no Metálica y combustibles 2001-2010 111 table 58.2 Mining production - region Vii Maule, Metals, industrial Minerals and Fuels, 2001-2010
tAblA 59.1 Producción Minera - Viii región del bío bío, Metálica, no Metálica y combustibles 1991-2000 112 table 59.1 Mining production - region Viii bio bio, Metals, industrial Minerals and Fuels, 1991-2000
tAblA 59.2 Producción Minera - Viii región del bío bío, Metálica, no Metálica y combustibles 2001-2010 113 table 59.2 Mining production – region Viii bio bio, Metals, industrial Minerals and Fuels, 2001-2010
tAblA 60.1 Producción Minera - iX región de la Araucanía, Metálica, no Metálica y combustibles 1991-2000 114 table 60.1 Mining production - region iX araucania, Metals, industrial Minerals and Fuels, 1991-2000
tAblA 60.2 Producción Minera - iX región de la Araucanía, Metálica, no Metálica y combustibles 2001-2010 115 table 60.2 Mining production - region iX araucania, Metals, industrial Minerals and Fuels, 2001-2010
tAblA 61.1 Producción Minera - X región de los lagos, Metálica, no Metálica y combustibles 1991-2000 116 table 61.1 Mining production - region X los lagos, Metals, industrial Minerals and Fuels, 1991-2000
tAblA 61.2 Producción Minera - X región de los lagos, Metálica, no Metálica y combustibles 2001-2010 117 table 61.2 Mining production - region X los lagos, Metals, industrial Minerals and Fuels, 2001-2010
7
tAblA 62.1 Producción Minera - Xi región de Aysén, Metálica, no Metálica y combustibles 1991-2000 118 table 62.1 Mining production - region Xi aysen, Metals, industrial Minerals and Fuels, 1991-2000
tAblA 62.2 Producción Minera - Xi región de Aysén, Metálica, no Metálica y combustibles 2001-2010 119 table 62.2 Mining production - region Xi aysen, Metals, industrial Minerals and Fuels, 2001-2010
tAblA 63.1 Producción Minera - Xii región de Magallanes y Antártica chilena, Metálica, no Metálica y combustibles 1991-2000 120 table 63.1 Mining production - region Xii Magallanes and antartica Chilena, Metals, industrial Minerals and Fuels, 1991-2000
tAblA 63.2 Producción Minera - Xii región de Magallanes y Antártica chilena, Metálica, no Metálica y combustibles 2001-2010 121 table 63.2 Mining production - region Xii Magallanes and antartica Chilena, Metals, industrial Minerals and Fuels, 2001-2010
tAblA 64.1 Producción Minera - Xiii región Metropolitana, Metálica, no Metálica y combustibles 1991-2000 122 table 64.1 Mining production - region Xiii Metropolitan, Metals, industrial Minerals and Fuels, 1991-2000
tAblA 64.2 Producción Minera - Xiii región Metropolitana, Metálica, no Metálica y combustibles 2001-2010 123 table 64.2 Mining production - region Xiii Metropolitan, Metals, industrial Minerals and Fuels, 2001-2010
tAblA 65 Producción Minera - XV región de Arica y Parinacota, Metálica, no Metálica y combustibles 2001-2010 124 table 65 Mining production - region XV arica and parinacota, Metals, industrial Minerals and Fuels, 2001-2010
tAblA 66 inversión extranjera Materializada en Minería en chile según dl-600 por regiones 1974-2010 125 table 66 actual Mining Fdi Under decree-law 600, Shown by region, 1974-2010
1.8 OTRAS ESTADÍSTICAS NACIONALES 127 otHer country stAtistics
tAblA 67 Ventas de cobre refinado a la industria Manufacturera nacional 2001-2010 128 table 67 refined Copper Sales to domestic Manufacturing industry, 2001-2010
tAblA 68 Valores de importaciones chilenas de Productos Mineros, Metálicos y no Metálicos 2001-2010 128 table 68 Mining product imports, including Metals and industrial Minerals (US$), 2001-2010
tAblA 69 importaciones chilenas de Productos Mineros, Metálicos y no Metálicos 2001-2010 129 table 69 Mining product imports, including Metals and industrial Minerals, 2001-2010
tAblA 70 Valores de los embarques de importación de Manufacturas de cobre y Productos de la Minería no Metálica 2001-2010 130 tabla 70 Copper Semis and industrial Minerals product imports (US$), 2001-2010
tAblA 71 embarques de importación de Manufacturas de cobre y Productos de la Minería no Metálica 2001-2010 131
table 71 Copper Semis and industrial Minerals product imports, 2001-2010
CAPÍTULO 2 : MERCADO INTERNACIONAL: PRODUCCIÓN, CONSUMO, COMERCIO Y PRECIOS 133CHAPTER 2 : WORLD MARKET, PRODUCTION, CONSUMPTION, TRADE AND PRICES
2.1 PRODUCCIÓN MINERA MUNDIAL 135 World MininG Production
tAblA 72 Producción Mundial de cobre de Mina 2001-2010 136 table 72 Global Copper Mine production, 2001-2010
tAblA 73 Participación en la Producción Mundial de cobre de Mina (%) 2001-2010 137 table 73 Share of Global Copper Mine production (%), 2001-2010
tAblA 74 Producción Mundial de cobre de Fundición 2001-2010 138 table 74 Global Copper Smelter production, 2001-2010
tAblA 75 Participación en la Producción Mundial de cobre de Fundición (%) 2001-2010 139 table 75 Share of Global Copper Smelter production (%), 2001-2010
tAblA 76 Producción Mundial de cobre refinado 2001-2010 140 table 76 Global refined Copper production, 2001-2010
tAblA 77 Participación en la Producción Mundial de cobre refinado (%) 2001-2010 141 table 77 Share of Global refined Copper production (%), 2001-2010
tAblA 78 Producción Mundial de cobre sX-eW 2001-2010 142 table 78 Global SX-eW Copper production, 2001-2010
tAblA 79 Producción Mundial de oro de Mina 2001-2010 143 table 79 Global Gold Mine production, 2001-2010
tAblA 80 Producción Mundial de Plata de Mina 2001-2010 144 table 80 Global Silver Mine production, 2001-2010
tAblA 81 Producción Mundial de Molibdeno de Mina 2001-2010 145 table 81 Global Molybdenum Mine production, 2001-2010
8
2.2 CONSUMO Y PRECIOS INTERNACIONALES 147 World consuMPtion And Prices
tAblA 82 consumo Mundial de cobre refinado 2001-2010 148 table 82 Global refined Copper Consumption, 2001-2010
tAblA 83 Participación en el consumo Mundial de cobre refinado (%) 2001-2010 149 table 83 Share of Global refined Copper Consumption (%), 2001-2010
tAblA 84 Precio del cobre refinado y chatarra de cobre 1991-2010 150 table 84 price of refined and Scrap Copper, 1991-2010
tAblA 85 Precios de otros Metales 1991-2010 151 table 85 other Metal prices, 1991-2010
tAblA 86 Precios reales de otros Metales 1991-2010 152 table 86 real prices of other Metals, 1991-2010
tAblA 87 Precio relativo del cobre con respecto a otros Productos básicos 1991-2010 153 table 87 Copper price relative to other Commodities, 1991-2010
tAblA 88 Precios internacionales de Productos Mineros no Metálicos 2001-2010 154 table 88 industrial Minerals, World prices 2001-2010
2.3 COMERCIO INTERNACIONAL DEL COBRE 157 World coPPer trAde
2.3.1 exportaciones exports
tAblA 89 exportaciones Mundiales de cobre 2001-2010 158 table 89 Global Copper exports, 2001-2010
tAblA 90 exportaciones Mundiales de cobre por Productos 2001-2010 159 table 90 Global Copper exports by product type, 2001-2010
tAblA 91 Participación en las exportaciones de cobre por Producto (%) 2001-2010 160 table 91 Share of Copper exports by product type (%), 2001-2010
2.3.2 importaciones imports
tAblA 92 importaciones Mundiales de cobre 2001-2010 161 table 92 Global Copper imports, 2001-2010
tAblA 93 importaciones Mundiales de cobre por Productos 2001-2010 162 table 93 Global Copper imports by product type, 2001-2010
tAblA 94 Participación en las importaciones de cobre por Producto (%) 2001-2010 163 table 94 Share of Copper imports by product type (%), 2001-2010
2.4 OTROS INDICADORES DEL MERCADO INTERNACIONAL DEL COBRE 165 otHer World coPPer MArKet indicAtors
tAblA 95 índice de intensidad de uso del cobre 2001-2010 166 table 95 index of Copper Use intensity, 2001-2010
tAblA 96 stocks Mundiales de cobre refinado 2001-2010 166 table 96 Global refined Copper inventories, 2001-2010
tAblA 97 costo unitario de Producción de cátodos de cobre de chile y Mundial 2001-2010 167 table 97 Copper Cathodes – Unit production Cost, 2001-2010

9
10
P r e s e n t a c i ó n
esta nueva versión del “anuario de estadísticas del Cobre y otros Minerales 1991-2010”, que corresponde a su edición n° 30, refleja el permanente interés de la Comisión Chilena del Cobre (Cochilco) por entregar información minera de manera oportuna, confiable y relevante. en esta oportunidad, hemos incorporado nuevos indicadores que creemos son sustanciales para tener una visión acabada del sector y entender el vigoroso crecimiento que ha alcanzado la minería en el último tiempo.
la nueva información considera estadísticas sobre la inversión privada y pública de la Gran Minería del cobre y oro en Chile para el periodo 2001-2010, desagregada por empresas; datos sobre la tributación total de las empresas de la Gran Minería privada y los aportes de Codelco y enami a los ingresos fiscales para el periodo 1991-2010; y el monto total del impuesto específico a la minería, declarado por las empresas GMp-10 para el periodo 2006-2010. además, se informa por primera vez, sobre las emisiones directas e indirectas de Gases de efecto invernadero (Gei) de cada área de proceso productivo para el lapso 2000-2009.
a partir de las cifras del anuario se puede dimensionar el gran significado que tiene la industria minera para Chile, particularmente en un año como el 2010, de altos precios internacionales de los minerales: el precio del cobre alcanzó un promedio anual de US$ 3,42 la libra, 37% más que en 2009; en tanto, que el oro registró su máximo promedio histórico con un valor de US$ 1.225 la onza. de esta manera, durante el año pasado la participación que tuvo la minería en el pib, medido a precios corrientes, alcanzó a 19,2% y la minería del cobre a 17,4%.
el año 2010 también fue relevante en materia de inversiones. las empresas mineras materializaron cerca de US$ 6.620 millones -considerando la minería privada del cobre y oro y el gasto de Codelco y enami- lo que representó un aumento de 37% en comparación con los recursos invertidos el año 2009.
agradezco a todas las personas que hicieron posible la realización de esta compilación estadística e invitamos al lector a consultar este libro y todas las demás publicaciones que Cochilco tiene disponible en su página web www.cochilco.cl.
andrés Mac-lean Vergara Vicepresidente ejecutivo Comisión Chilena del Cobre
11
F o r e w o r d
this 30th edition of the Copper and other Mineral Statistics Yearbook 1991-2010 reflects the Chilean Copper Commission’s ongoing commitment to providing timely, reliable, relevant information on the Chilean mining industry. this edition includes new indicators designed to help provide a more comprehensive overview of the local industry and judge the strength of Chilean mining growth in recent times.
the Yearbook reviews investment by major private and public copper and gold miners in 2001-2010, shown by company; total tax paid by major private miners as well as Codelco-enami contributions to fiscal revenues in 1991-2010, and total mining taxes declared by the ten largest private copper miners (GMp-10) in 2006-2010. direct and indirect GhG emissions per process area in 2000-2009 are reported for the first time.
the figures in the Yearbook illustrate the significance of the mining industry to Chile, particularly in a year of high metal prices. Copper averaged US$3.42/lb., up 37 percent over 2009, while gold averaged a record-breaking US$1,225/oz. Measured at current prices, mining accounted for 19.2 percent of Gdp. Copper mining alone stood for 17.4 percent of Gdp.
this was also a relevant investment year. Codelco, enami and private copper and gold miners invested a combined US$6.6 billion, a 37 percent increase over 2009.
i thank all who made the Yearbook possible and cordially invite readers to leverage this and other publications the Commission makes available through its web site at www.cochilco.cl.
andrés Mac-lean Vergaraexecutive Vice president,Chilean Copper Commission

12
13
CAPÍTULO 1lA MineríA cHilenA
cHAPter 1tHe cHileAn MininG sector

14

15
1.1PRODUCCIÓN MINERAMininG sector Production
16
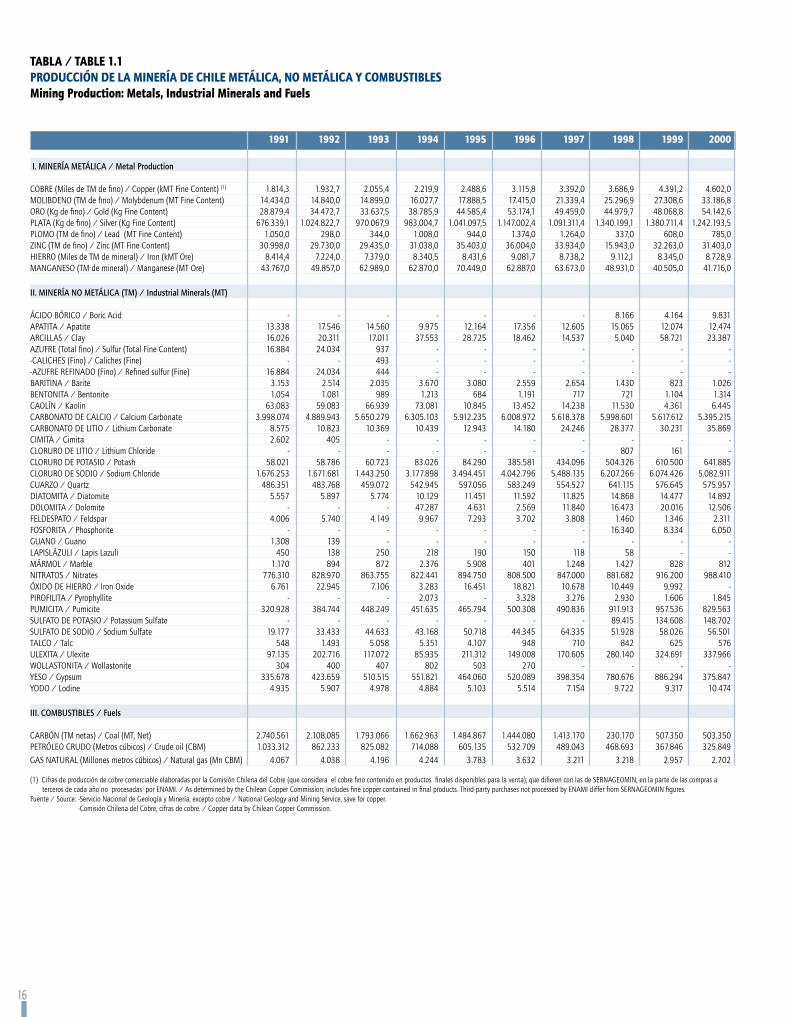
TABLA / TABLE 1.1 PRODUCCIÓN DE LA MINERÍA DE CHILE METÁLICA, NO METÁLICA Y COMBUSTIBLES Mining Production: Metals, Industrial Minerals and Fuels
1991 1992 1993 1994 1995 1996 1997 1998 1999 2000
i. MineríA MetÁlicA / Metal Production
Cobre (Miles de tM de fino) / Copper (kMt Fine Content) (1) 1.814,3 1.932,7 2.055,4 2.219,9 2.488,6 3.115,8 3.392,0 3.686,9 4.391,2 4.602,0Molibdeno (tM de fino) / Molybdenum (Mt Fine Content) 14.434,0 14.840,0 14.899,0 16.027,7 17.888,5 17.415,0 21.339,4 25.296,9 27.308,6 33.186,8oro (kg de fino) / Gold (kg Fine Content) 28.879,4 34.472,7 33.637,5 38.785,9 44.585,4 53.174,1 49.459,0 44.979,7 48.068,8 54.142,6plata (kg de fino) / Silver (kg Fine Content) 676.339,1 1.024.822,7 970.067,9 983.004,7 1.041.097,5 1.147.002,4 1.091.311,4 1.340.199,1 1.380.711,4 1.242.193,5ploMo (tM de fino) / lead (Mt Fine Content) 1.050,0 298,0 344,0 1.008,0 944,0 1.374,0 1.264,0 337,0 608,0 785,0ZinC (tM de fino) / Zinc (Mt Fine Content) 30.998,0 29.730,0 29.435,0 31.038,0 35.403,0 36.004,0 33.934,0 15.943,0 32.263,0 31.403,0hierro (Miles de tM de mineral) / iron (kMt ore) 8.414,4 7.224,0 7.379,0 8.340,5 8.431,6 9.081,7 8.738,2 9.112,1 8.345,0 8.728,9ManGaneSo (tM de mineral) / Manganese (Mt ore) 43.767,0 49.857,0 62.989,0 62.870,0 70.449,0 62.887,0 63.673,0 48.931,0 40.505,0 41.716,0
ii. MineríA no MetÁlicA (tM) / industrial Minerals (Mt)
ÁCido bÓriCo / boric acid - - - - - - - 8.166 4.164 9.831apatita / apatite 13.338 17.546 14.560 9.975 12.164 17.356 12.605 15.065 12.074 12.474arCillaS / Clay 16.026 20.311 17.011 37.553 28.725 18.462 14.537 5.040 58.721 23.387aZUFre (total fino) / Sulfur (total Fine Content) 16.884 24.034 937 - - - - - - --CaliCheS (Fino) / Caliches (Fine) - - 493 - - - - - - --aZUFre reFinado (Fino) / refined sulfur (Fine) 16.884 24.034 444 - - - - - - -baritina / barite 3.153 2.514 2.035 3.670 3.080 2.559 2.654 1.430 823 1.026bentonita / bentonite 1.054 1.081 989 1.213 684 1.191 717 721 1.104 1.314CaolÍn / kaolin 63.083 59.083 66.939 73.081 10.845 13.452 14.238 11.530 4.361 6.445Carbonato de CalCio / Calcium Carbonate 3.998.074 4.889.943 5.650.279 6.305.103 5.912.235 6.008.972 5.618.378 5.998.601 5.617.612 5.395.215Carbonato de litio / lithium Carbonate 8.575 10.823 10.369 10.439 12.943 14.180 24.246 28.377 30.231 35.869CiMita / Cimita 2.602 405 - - - - - - - -ClorUro de litio / lithium Chloride - - - - - - - 807 161 -ClorUro de potaSio / potash 58.021 58.786 60.723 83.026 84.290 385.581 434.096 504.326 610.500 641.885ClorUro de Sodio / Sodium Chloride 1.676.253 1.671.681 1.443.250 3.177.898 3.494.451 4.042.796 5.488.135 6.207.266 6.074.426 5.082.911CUarZo / Quartz 486.351 483.768 459.072 542.945 597.056 583.249 554.527 641.115 576.645 575.957diatoMita / diatomite 5.557 5.897 5.774 10.129 11.451 11.592 11.825 14.868 14.477 14.892doloMita / dolomite - - - 47.287 4.631 2.569 11.840 16.473 20.016 12.506FeldeSpato / Feldspar 4.006 5.740 4.149 9.967 7.293 3.702 3.808 1.460 1.346 2.311FoSForita / phosphorite - - - - - - - 16.340 8.334 6.050GUano / Guano 1.308 139 - - - - - - - -lapiSlÁZUli / lapis lazuli 450 138 250 218 190 150 118 58 - -MÁrMol / Marble 1.170 894 872 2.376 5.908 401 1.248 1.427 828 812nitratoS / nitrates 776.310 828.970 863.755 822.441 894.750 808.500 847.000 881.682 916.200 988.410ÓXido de hierro / iron oxide 6.761 22.945 7.106 3.283 16.451 18.821 10.678 10.449 9.992 -piroFilita / pyrophyllite - - - 2.073 - 3.328 3.276 2.930 1.606 1.845pUMiCita / pumicite 320.928 384.744 448.249 451.635 465.794 500.308 490.836 911.913 957.536 829.563SUlFato de potaSio / potassium Sulfate - - - - - - - 89.415 134.608 148.702SUlFato de Sodio / Sodium Sulfate 19.177 33.433 44.633 43.168 50.718 44.345 64.335 51.928 58.026 56.501talCo / talc 548 1.493 5.058 5.351 4.107 948 710 842 625 576UleXita / Ulexite 97.135 202.716 117.072 85.935 211.312 149.008 170.605 280.140 324.691 337.966WollaStonita / Wollastonite 304 400 407 802 503 270 - - - -YeSo / Gypsum 335.678 423.659 510.515 551.821 464.060 520.089 398.354 780.676 886.294 375.847Yodo / lodine 4.935 5.907 4.978 4.884 5.103 5.514 7.154 9.722 9.317 10.474
iii. coMbustibles / Fuels
CarbÓn (tM netas) / Coal (Mt, net) 2.740.561 2.108.085 1.793.066 1.662.963 1.484.867 1.444.080 1.413.170 230.170 507.350 503.350petrÓleo CrUdo (Metros cúbicos) / Crude oil (CbM) 1.033.312 862.233 825.082 714.088 605.135 532.709 489.043 468.693 367.846 325.849
GaS natUral (Millones metros cúbicos) / natural gas (Mn CbM) 4.067 4.038 4.196 4.244 3.783 3.632 3.211 3.218 2.957 2.702
(1) Cifras de producción de cobre comerciable elaboradas por la Comisión Chilena del Cobre (que considera el cobre fino contenido en productos finales disponibles para la venta), que difieren con las de SernaGeoMin, en la parte de las compras a terceros de cada año no procesadas por enaMi. / as determined by the Chilean Copper Commission; includes fine copper contained in final products. third-party purchases not processed by enaMi differ from SernaGeoMin figures. Fuente / Source: -Servicio nacional de Geología y Minería, excepto cobre / national Geology and Mining Service, save for copper. -Comisión Chilena del Cobre, cifras de cobre. / Copper data by Chilean Copper Commission.
17
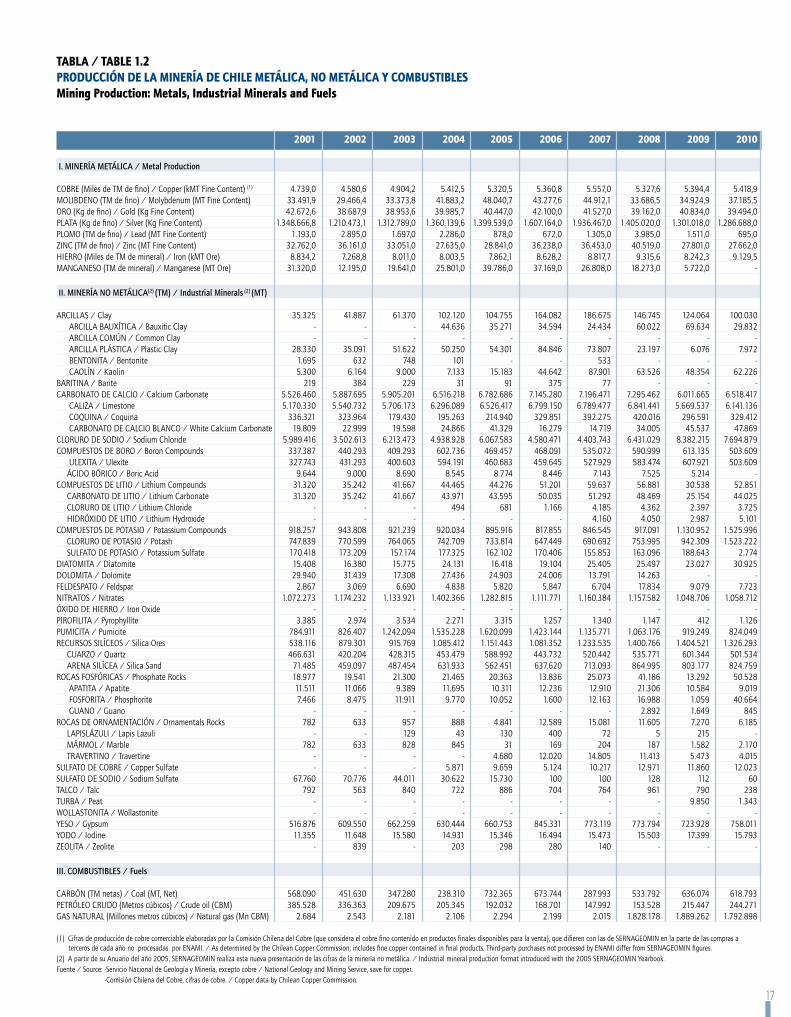
TABLA / TABLE 1.2 PRODUCCIÓN DE LA MINERÍA DE CHILE METÁLICA, NO METÁLICA Y COMBUSTIBLESMining Production: Metals, Industrial Minerals and Fuels
2001 2002 2003 2004 2005 2006 2007 2008 2009 2010
i. MineríA MetÁlicA / Metal Production
Cobre (Miles de tM de fino) / Copper (kMt Fine Content) (1) 4.739,0 4.580,6 4.904,2 5.412,5 5.320,5 5.360,8 5.557,0 5.327,6 5.394,4 5.418,9Molibdeno (tM de fino) / Molybdenum (Mt Fine Content) 33.491,9 29.466,4 33.373,8 41.883,2 48.040,7 43.277,6 44.912,1 33.686,5 34.924,9 37.185,5oro (kg de fino) / Gold (kg Fine Content) 42.672,6 38.687,9 38.953,6 39.985,7 40.447,0 42.100,0 41.527,0 39.162,0 40.834,0 39.494,0plata (kg de fino) / Silver (kg Fine Content) 1.348.666,8 1.210.473,1 1.312.789,0 1.360.139,6 1.399.539,0 1.607.164,0 1.936.467,0 1.405.020,0 1.301.018,0 1.286.688,0ploMo (tM de fino) / lead (Mt Fine Content) 1.193,0 2.895,0 1.697,0 2.286,0 878,0 672,0 1.305,0 3.985,0 1.511,0 695,0ZinC (tM de fino) / Zinc (Mt Fine Content) 32.762,0 36.161,0 33.051,0 27.635,0 28.841,0 36.238,0 36.453,0 40.519,0 27.801,0 27.662,0hierro (Miles de tM de mineral) / iron (kMt ore) 8.834,2 7.268,8 8.011,0 8.003,5 7.862,1 8.628,2 8.817,7 9.315,6 8.242,3 9.129,5ManGaneSo (tM de mineral) / Manganese (Mt ore) 31.320,0 12.195,0 19.641,0 25.801,0 39.786,0 37.169,0 26.808,0 18.273,0 5.722,0 -
ii. MineríA no MetÁlicA(2) (tM) / industrial Minerals (2) (Mt)
arCillaS / Clay 35.325 41.887 61.370 102.120 104.755 164.082 186.675 146.745 124.064 100.030 arCilla baUXÍtiCa / bauxitic Clay - - - 44.636 35.271 34.594 24.434 60.022 69.634 29.832 arCilla CoMÚn / Common Clay - - - - - - - - - - arCilla plÁStiCa / plastic Clay 28.330 35.091 51.622 50.250 54.301 84.846 73.807 23.197 6.076 7.972 bentonita / bentonite 1.695 632 748 101 - - 533 - - - CaolÍn / kaolin 5.300 6.164 9.000 7.133 15.183 44.642 87.901 63.526 48.354 62.226baritina / barite 219 384 229 31 91 375 77 - - -Carbonato de CalCio / Calcium Carbonate 5.526.460 5.887.695 5.905.201 6.516.218 6.782.686 7.145.280 7.196.471 7.295.462 6.011.665 6.518.417 CaliZa / limestone 5.170.330 5.540.732 5.706.173 6.296.089 6.526.417 6.799.150 6.789.477 6.841.441 5.669.537 6.141.136 CoQUina / Coquina 336.321 323.964 179.430 195.263 214.940 329.851 392.275 420.016 296.591 329.412 Carbonato de CalCio blanCo / White Calcium Carbonate 19.809 22.999 19.598 24.866 41.329 16.279 14.719 34.005 45.537 47.869ClorUro de Sodio / Sodium Chloride 5.989.416 3.502.613 6.213.473 4.938.928 6.067.583 4.580.471 4.403.743 6.431.029 8.382.215 7.694.879CoMpUeStoS de boro / boron Compounds 337.387 440.293 409.293 602.736 469.457 468.091 535.072 590.999 613.135 503.609 UleXita / Ulexite 327.743 431.293 400.603 594.191 460.683 459.645 527.929 583.474 607.921 503.609 ÁCido bÓriCo / boric acid 9.644 9.000 8.690 8.545 8.774 8.446 7.143 7.525 5.214 -CoMpUeStoS de litio / lithium Compounds 31.320 35.242 41.667 44.465 44.276 51.201 59.637 56.881 30.538 52.851 Carbonato de litio / lithium Carbonate 31.320 35.242 41.667 43.971 43.595 50.035 51.292 48.469 25.154 44.025 ClorUro de litio / lithium Chloride - - - 494 681 1.166 4.185 4.362 2.397 3.725 hidrÓXido de litio / lithium hydroxide - - - - - - 4.160 4.050 2.987 5.101CoMpUeStoS de potaSio / potassium Compounds 918.257 943.808 921.239 920.034 895.916 817.855 846.545 917.091 1.130.952 1.525.996 ClorUro de potaSio / potash 747.839 770.599 764.065 742.709 733.814 647.449 690.692 753.995 942.309 1.523.222 SUlFato de potaSio / potassium Sulfate 170.418 173.209 157.174 177.325 162.102 170.406 155.853 163.096 188.643 2.774diatoMita / diatomite 15.408 16.380 15.775 24.131 16.418 19.104 25.405 25.497 23.027 30.925doloMita / dolomite 29.940 31.439 17.308 27.436 24.903 24.006 13.791 14.263 - -FeldeSpato / Feldspar 2.867 3.069 6.690 4.838 5.820 5.847 6.704 17.834 9.079 7.723nitratoS / nitrates 1.072.273 1.174.232 1.133.921 1.402.366 1.282.815 1.111.771 1.160.384 1.157.582 1.048.706 1.058.712ÓXido de hierro / iron oxide - - - - - - - - - -piroFilita / pyrophyllite 3.385 2.974 3.534 2.271 3.315 1.257 1.340 1.147 412 1.126pUMiCita / pumicite 784.911 826.407 1.242.094 1.535.228 1.620.099 1.423.144 1.135.771 1.063.176 919.249 824.049reCUrSoS SilÍCeoS / Silica ores 538.116 879.301 915.769 1.085.412 1.151.443 1.081.352 1.233.535 1.400.766 1.404.521 1.326.293 CUarZo / Quartz 466.631 420.204 428.315 453.479 588.992 443.732 520.442 535.771 601.344 501.534 arena SilÍCea / Silica Sand 71.485 459.097 487.454 631.933 562.451 637.620 713.093 864.995 803.177 824.759roCaS FoSFÓriCaS / phosphate rocks 18.977 19.541 21.300 21.465 20.363 13.836 25.073 41.186 13.292 50.528 apatita / apatite 11.511 11.066 9.389 11.695 10.311 12.236 12.910 21.306 10.584 9.019 FoSForita / phosphorite 7.466 8.475 11.911 9.770 10.052 1.600 12.163 16.988 1.059 40.664 GUano / Guano - - - - - - - 2.892 1.649 845roCaS de ornaMentaCiÓn / ornamentals rocks 782 633 957 888 4.841 12.589 15.081 11.605 7.270 6.185 lapiSlÁZUli / lapis lazuli - - 129 43 130 400 72 5 215 - MÁrMol / Marble 782 633 828 845 31 169 204 187 1.582 2.170 traVertino / travertine - - - - 4.680 12.020 14.805 11.413 5.473 4.015SUlFato de Cobre / Copper Sulfate - - - 5.871 9.659 5.124 10.217 12.971 11.860 12.023SUlFato de Sodio / Sodium Sulfate 67.760 70.776 44.011 30.622 15.730 100 100 128 112 60talCo / talc 792 563 840 722 886 704 764 961 790 238tUrba / peat - - - - - - - - 9.850 1.343WollaStonita / Wollastonite - - - - - - - - - -YeSo / Gypsum 516.876 609.550 662.259 630.444 660.753 845.331 773.119 773.794 723.928 758.011Yodo / iodine 11.355 11.648 15.580 14.931 15.346 16.494 15.473 15.503 17.399 15.793Zeolita / Zeolite - 839 - 203 298 280 140 - - -
iii. coMbustibles / Fuels CarbÓn (tM netas) / Coal (Mt, net) 568.090 451.630 347.280 238.310 732.365 673.744 287.993 533.792 636.074 618.793petrÓleo CrUdo (Metros cúbicos) / Crude oil (CbM) 385.528 336.363 209.675 205.345 192.032 168.701 147.992 153.528 215.447 244.271GaS natUral (Millones metros cúbicos) / natural gas (Mn CbM) 2.684 2.543 2.181 2.106 2.294 2.199 2.015 1.828.178 1.889.262 1.792.898
(1) Cifras de producción de cobre comerciable elaboradas por la Comisión Chilena del Cobre (que considera el cobre fino contenido en productos finales disponibles para la venta), que difieren con las de SernaGeoMin en la parte de las compras a terceros de cada año no procesadas por enaMi. / as determined by the Chilean Copper Commission; includes fine copper contained in final products. third-party purchases not processed by enaMi differ from SernaGeoMin figures. (2) a partir de su anuario del año 2005, SernaGeoMin realiza esta nueva presentación de las cifras de la minería no metálica. / industrial mineral production format introduced with the 2005 SernaGeoMin Yearbook. Fuente / Source: -Servicio nacional de Geología y Minería, excepto cobre / national Geology and Mining Service, save for copper. -Comisión Chilena del Cobre, cifras de cobre. / Copper data by Chilean Copper Commission.
18
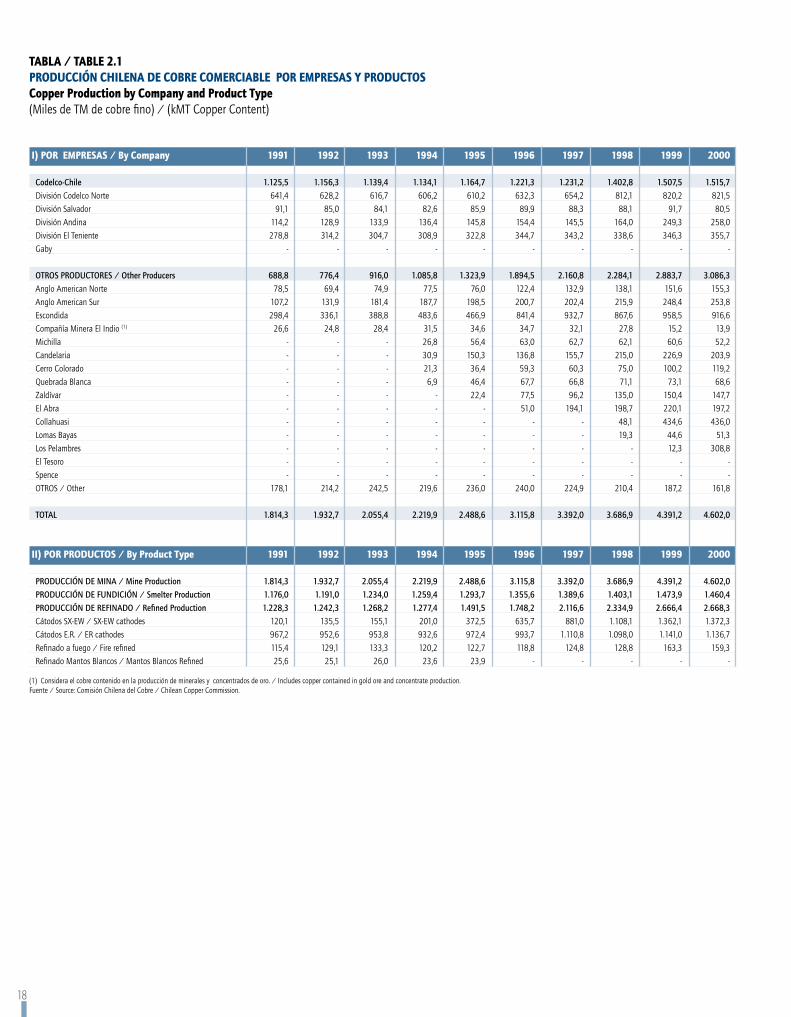
TABLA / TABLE 2.1 PRODUCCIÓN CHILENA DE COBRE COMERCIABLE POR EMPRESAS Y PRODUCTOSCopper Production by Company and Product Type (Miles de tM de cobre fino) / (kMt Copper Content)
I) POR EMPRESAS / By Company 1991 1992 1993 1994 1995 1996 1997 1998 1999 2000
codelco-chile 1.125,5 1.156,3 1.139,4 1.134,1 1.164,7 1.221,3 1.231,2 1.402,8 1.507,5 1.515,7 división Codelco norte 641,4 628,2 616,7 606,2 610,2 632,3 654,2 812,1 820,2 821,5
división Salvador 91,1 85,0 84,1 82,6 85,9 89,9 88,3 88,1 91,7 80,5
división andina 114,2 128,9 133,9 136,4 145,8 154,4 145,5 164,0 249,3 258,0
división el teniente 278,8 314,2 304,7 308,9 322,8 344,7 343,2 338,6 346,3 355,7
Gaby - - - - - - - - - -
otros Productores / other Producers 688,8 776,4 916,0 1.085,8 1.323,9 1.894,5 2.160,8 2.284,1 2.883,7 3.086,3 anglo american norte 78,5 69,4 74,9 77,5 76,0 122,4 132,9 138,1 151,6 155,3
anglo american Sur 107,2 131,9 181,4 187,7 198,5 200,7 202,4 215,9 248,4 253,8
escondida 298,4 336,1 388,8 483,6 466,9 841,4 932,7 867,6 958,5 916,6
Compañía Minera el indio (1) 26,6 24,8 28,4 31,5 34,6 34,7 32,1 27,8 15,2 13,9
Michilla - - - 26,8 56,4 63,0 62,7 62,1 60,6 52,2
Candelaria - - - 30,9 150,3 136,8 155,7 215,0 226,9 203,9
Cerro Colorado - - - 21,3 36,4 59,3 60,3 75,0 100,2 119,2
Quebrada blanca - - - 6,9 46,4 67,7 66,8 71,1 73,1 68,6
Zaldívar - - - - 22,4 77,5 96,2 135,0 150,4 147,7
el abra - - - - - 51,0 194,1 198,7 220,1 197,2
Collahuasi - - - - - - - 48,1 434,6 436,0
lomas bayas - - - - - - - 19,3 44,6 51,3
los pelambres - - - - - - - - 12,3 308,8
el tesoro - - - - - - - - - -
Spence - - - - - - - - - -
otroS / other 178,1 214,2 242,5 219,6 236,0 240,0 224,9 210,4 187,2 161,8
totAl 1.814,3 1.932,7 2.055,4 2.219,9 2.488,6 3.115,8 3.392,0 3.686,9 4.391,2 4.602,0
II) POR PRODUCTOS / By Product Type 1991 1992 1993 1994 1995 1996 1997 1998 1999 2000
ProducciÓn de MinA / Mine Production 1.814,3 1.932,7 2.055,4 2.219,9 2.488,6 3.115,8 3.392,0 3.686,9 4.391,2 4.602,0 ProducciÓn de FundiciÓn / smelter Production 1.176,0 1.191,0 1.234,0 1.259,4 1.293,7 1.355,6 1.389,6 1.403,1 1.473,9 1.460,4 ProducciÓn de reFinAdo / refined Production 1.228,3 1.242,3 1.268,2 1.277,4 1.491,5 1.748,2 2.116,6 2.334,9 2.666,4 2.668,3 Cátodos SX-eW / SX-eW cathodes 120,1 135,5 155,1 201,0 372,5 635,7 881,0 1.108,1 1.362,1 1.372,3
Cátodos e.r. / er cathodes 967,2 952,6 953,8 932,6 972,4 993,7 1.110,8 1.098,0 1.141,0 1.136,7
refinado a fuego / Fire refined 115,4 129,1 133,3 120,2 122,7 118,8 124,8 128,8 163,3 159,3
refinado Mantos blancos / Mantos blancos refined 25,6 25,1 26,0 23,6 23,9 - - - - - (1) Considera el cobre contenido en la producción de minerales y concentrados de oro. / includes copper contained in gold ore and concentrate production.Fuente / Source: Comisión Chilena del Cobre / Chilean Copper Commission.
19
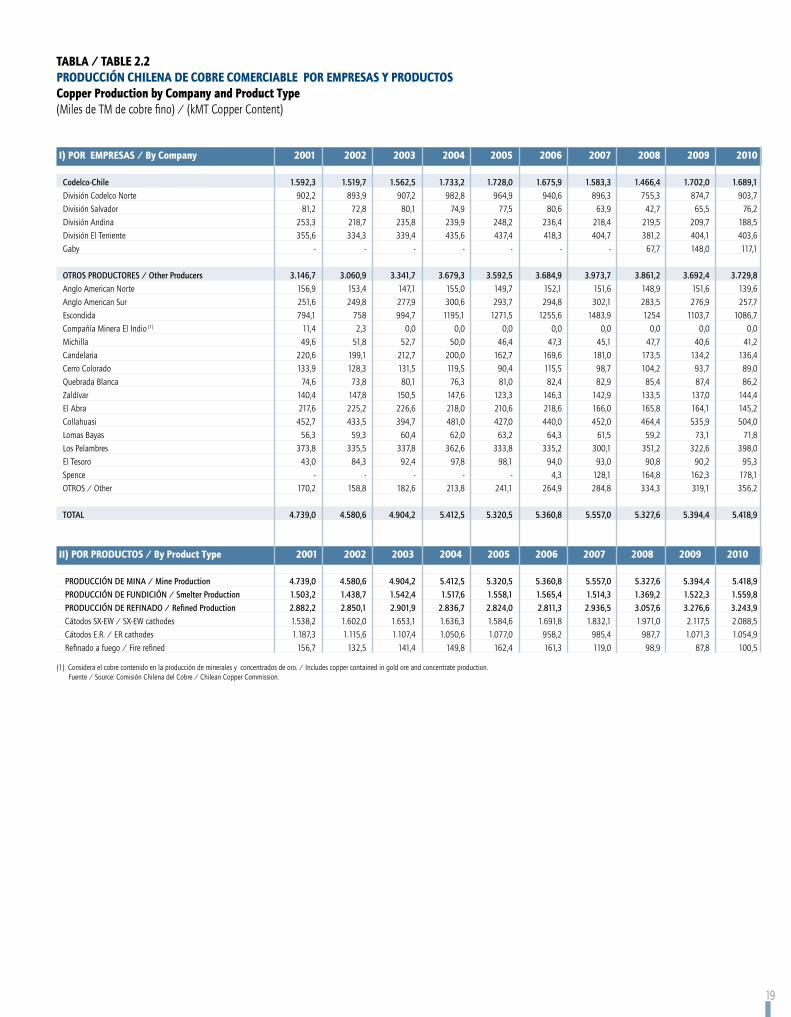
TABLA / TABLE 2.2 PRODUCCIÓN CHILENA DE COBRE COMERCIABLE POR EMPRESAS Y PRODUCTOS Copper Production by Company and Product Type (Miles de tM de cobre fino) / (kMt Copper Content) I) POR EMPRESAS / By Company 2001 2002 2003 2004 2005 2006 2007 2008 2009 2010
codelco-chile 1.592,3 1.519,7 1.562,5 1.733,2 1.728,0 1.675,9 1.583,3 1.466,4 1.702,0 1.689,1 división Codelco norte 902,2 893,9 907,2 982,8 964,9 940,6 896,3 755,3 874,7 903,7
división Salvador 81,2 72,8 80,1 74,9 77,5 80,6 63,9 42,7 65,5 76,2
división andina 253,3 218,7 235,8 239,9 248,2 236,4 218,4 219,5 209,7 188,5
división el teniente 355,6 334,3 339,4 435,6 437,4 418,3 404,7 381,2 404,1 403,6
Gaby - - - - - - - 67,7 148,0 117,1
otros Productores / other Producers 3.146,7 3.060,9 3.341,7 3.679,3 3.592,5 3.684,9 3.973,7 3.861,2 3.692,4 3.729,8 anglo american norte 156,9 153,4 147,1 155,0 149,7 152,1 151,6 148,9 151,6 139,6
anglo american Sur 251,6 249,8 277,9 300,6 293,7 294,8 302,1 283,5 276,9 257,7
escondida 794,1 758 994,7 1195,1 1271,5 1255,6 1483,9 1254 1103,7 1086,7
Compañía Minera el indio (1) 11,4 2,3 0,0 0,0 0,0 0,0 0,0 0,0 0,0 0,0
Michilla 49,6 51,8 52,7 50,0 46,4 47,3 45,1 47,7 40,6 41,2
Candelaria 220,6 199,1 212,7 200,0 162,7 169,6 181,0 173,5 134,2 136,4
Cerro Colorado 133,9 128,3 131,5 119,5 90,4 115,5 98,7 104,2 93,7 89,0
Quebrada blanca 74,6 73,8 80,1 76,3 81,0 82,4 82,9 85,4 87,4 86,2
Zaldívar 140,4 147,8 150,5 147,6 123,3 146,3 142,9 133,5 137,0 144,4
el abra 217,6 225,2 226,6 218,0 210,6 218,6 166,0 165,8 164,1 145,2
Collahuasi 452,7 433,5 394,7 481,0 427,0 440,0 452,0 464,4 535,9 504,0
lomas bayas 56,3 59,3 60,4 62,0 63,2 64,3 61,5 59,2 73,1 71,8
los pelambres 373,8 335,5 337,8 362,6 333,8 335,2 300,1 351,2 322,6 398,0
el tesoro 43,0 84,3 92,4 97,8 98,1 94,0 93,0 90,8 90,2 95,3
Spence - - - - - 4,3 128,1 164,8 162,3 178,1
otroS / other 170,2 158,8 182,6 213,8 241,1 264,9 284,8 334,3 319,1 356,2
totAl 4.739,0 4.580,6 4.904,2 5.412,5 5.320,5 5.360,8 5.557,0 5.327,6 5.394,4 5.418,9
II) POR PRODUCTOS / By Product Type 2001 2002 2003 2004 2005 2006 2007 2008 2009 2010
ProducciÓn de MinA / Mine Production 4.739,0 4.580,6 4.904,2 5.412,5 5.320,5 5.360,8 5.557,0 5.327,6 5.394,4 5.418,9 ProducciÓn de FundiciÓn / smelter Production 1.503,2 1.438,7 1.542,4 1.517,6 1.558,1 1.565,4 1.514,3 1.369,2 1.522,3 1.559,8 ProducciÓn de reFinAdo / refined Production 2.882,2 2.850,1 2.901,9 2.836,7 2.824,0 2.811,3 2.936,5 3.057,6 3.276,6 3.243,9 Cátodos SX-eW / SX-eW cathodes 1.538,2 1.602,0 1.653,1 1.636,3 1.584,6 1.691,8 1.832,1 1.971,0 2.117,5 2.088,5
Cátodos e.r. / er cathodes 1.187,3 1.115,6 1.107,4 1.050,6 1.077,0 958,2 985,4 987,7 1.071,3 1.054,9
refinado a fuego / Fire refined 156,7 132,5 141,4 149,8 162,4 161,3 119,0 98,9 87,8 100,5
(1) Considera el cobre contenido en la producción de minerales y concentrados de oro. / includes copper contained in gold ore and concentrate production. Fuente / Source: Comisión Chilena del Cobre / Chilean Copper Commission.
20
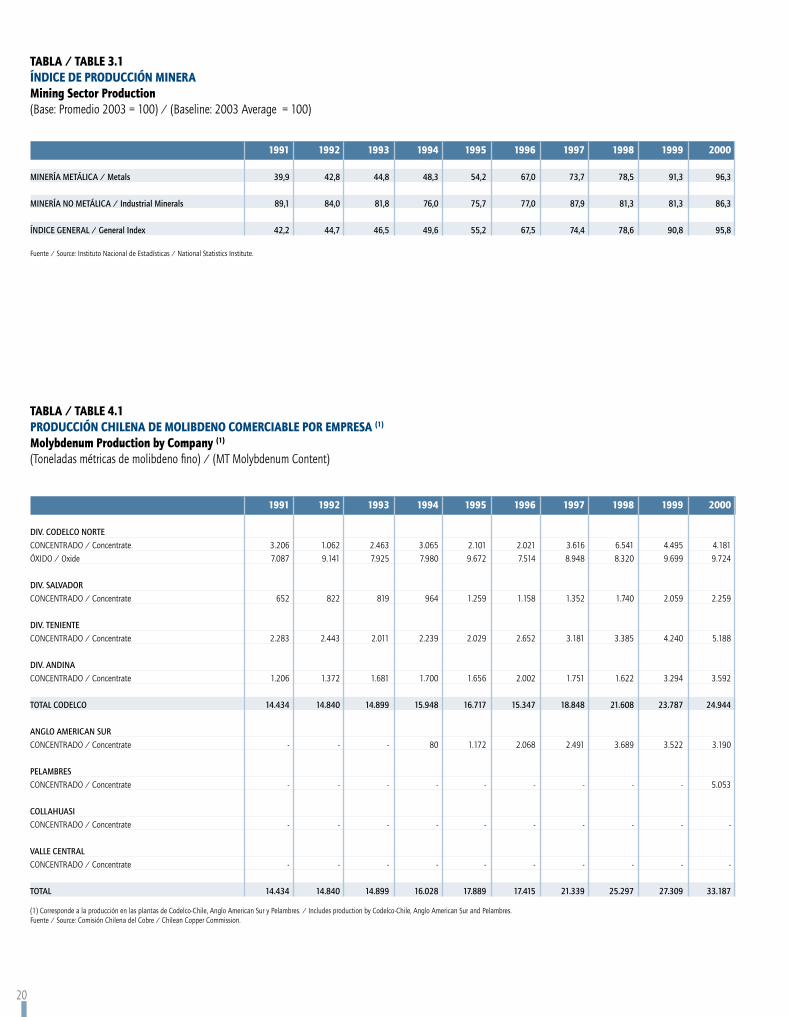
TABLA / TABLE 3.1 ÍNDICE DE PRODUCCIÓN MINERA Mining Sector Production (base: promedio 2003 = 100) / (baseline: 2003 average = 100)
1991 1992 1993 1994 1995 1996 1997 1998 1999 2000
MineríA MetÁlicA / Metals 39,9 42,8 44,8 48,3 54,2 67,0 73,7 78,5 91,3 96,3
MineríA no MetÁlicA / industrial Minerals 89,1 84,0 81,8 76,0 75,7 77,0 87,9 81,3 81,3 86,3
índice GenerAl / General index 42,2 44,7 46,5 49,6 55,2 67,5 74,4 78,6 90,8 95,8 Fuente / Source: instituto nacional de estadísticas / national Statistics institute.
TABLA / TABLE 4.1 PRODUCCIÓN CHILENA DE MOLIBDENO COMERCIABLE POR EMPRESA (1) Molybdenum Production by Company (1) (toneladas métricas de molibdeno fino) / (Mt Molybdenum Content)
1991 1992 1993 1994 1995 1996 1997 1998 1999 2000
diV. codelco norte ConCentrado / Concentrate 3.206 1.062 2.463 3.065 2.101 2.021 3.616 6.541 4.495 4.181
ÓXido / oxide 7.087 9.141 7.925 7.980 9.672 7.514 8.948 8.320 9.699 9.724
diV. sAlVAdor ConCentrado / Concentrate 652 822 819 964 1.259 1.158 1.352 1.740 2.059 2.259
diV. teniente ConCentrado / Concentrate 2.283 2.443 2.011 2.239 2.029 2.652 3.181 3.385 4.240 5.188
diV. AndinA ConCentrado / Concentrate 1.206 1.372 1.681 1.700 1.656 2.002 1.751 1.622 3.294 3.592
totAl codelco 14.434 14.840 14.899 15.948 16.717 15.347 18.848 21.608 23.787 24.944
AnGlo AMericAn sur ConCentrado / Concentrate - - - 80 1.172 2.068 2.491 3.689 3.522 3.190
PelAMbres ConCentrado / Concentrate - - - - - - - - - 5.053
collAHuAsi ConCentrado / Concentrate - - - - - - - - - -
VAlle centrAl ConCentrado / Concentrate - - - - - - - - - -
totAl 14.434 14.840 14.899 16.028 17.889 17.415 21.339 25.297 27.309 33.187 (1) Corresponde a la producción en las plantas de Codelco-Chile, anglo american Sur y pelambres. / includes production by Codelco-Chile, anglo american Sur and pelambres.Fuente / Source: Comisión Chilena del Cobre / Chilean Copper Commission.
21
TABLA / TABLE 4.2 PRODUCCIÓN CHILENA DE MOLIBDENO COMERCIABLE POR EMPRESA (1)
Molybdenum Production by Company (1) (toneladas métricas de molibdeno fino) / (Mt Molybdenum Content)
2001 2002 2003 2004 2005 2006 2007 2008 2009 2010
diV. codelco norte ConCentrado / Concentrate 6.405 5.162 11.034 15.932 17.854 10.583 11.821 7.278 5.934 6.230
ÓXido / oxide 8.813 7.716 5.398 8.339 8.971 7.197 7.244 5.662 7.134 5.885
diV. sAlVAdor ConCentrado / Concentrate 1.575 1.258 1.172 1.154 1.248 1.366 1.214 872 1.148 1.043
diV. teniente ConCentrado / Concentrate 4.720 3.901 3.512 3.919 5.249 4.749 5.053 4.580 5.179 5.617
diV. AndinA ConCentrado / Concentrate 2.724 1.864 2.057 2.980 3.244 3.308 2.525 2.133 2.163 2.900
totAl codelco 24.237 19.901 23.173 32.324 36.566 27.203 27.857 20.525 21.558 21.675
AnGlo AMericAn sur ConCentrado / Concentrate 2.322 1.718 1.513 1.706 2.123 2.549 2.582 2.578 2.768 1.927
PelAMbres ConCentrado / Concentrate 6.933 7.847 8.688 7.853 8.710 9.847 10.156 7.759 7.792 8.759
collAHuAsi ConCentrado / Concentrate - - - - 349 3.362 4.038 2.471 2.541 4.476
VAlle centrAl ConCentrado / Concentrate - - - - 293 316 278 353 266 348
totAl 33.492 29.466 33.374 41.883 48.041 43.278 44.912 33.687 34.925 37.186 (1) Corresponde a la producción en las plantas de Codelco-Chile, anglo american Sur, pelambres, Collahuasi y Valle Central. / includes production by Codelco-Chile, anglo american Sur, pelambres, Collahuasi, and Valle Central.Fuente / Source: Comisión Chilena del Cobre / Chilean Copper Commission.
TABLA / TABLE 3.2 ÍNDICE DE PRODUCCIÓN MINERA Mining Sector Production (base: promedio 2003 = 100) / (baseline: 2003 average = 100)
2001 2002 2003 2004 2005 2006 2007 2008 2009 2010
MineríA MetÁlicA / Metals 97,7 94,2 100,0 110,3 109,5 110,6 115,2 108,6 109,4 109,5
MineríA no MetÁlicA / industrial Minerals 88,7 89,2 100,0 106,8 105,5 101,8 101,2 105,2 98,5 94,9
índice GenerAl / General index 97,3 93,9 100,0 110,1 109,2 110,0 114,3 108,4 108,7 108,5 Fuente / Source: instituto nacional de estadísticas / national Statistics institute.
22
TABLA 5.1 PRODUCCIÓN CHILENA DE ORO SEGÚN ORIGEN Gold Production by Source (kg de oro fino) / (kg Fine Gold)
1991 1992 1993 1994 1995 1996 1997 1998 1999 2000
MineríA del oro / Gold Mining 20.739,7 25.296,3 26.246,4 28.678,3 32.089,8 38.660,4 36.209,9 29.518,4 31.506,3 39.406,8
Grandes empresas / large Producers 0,0 0,0 0,0 0,0 0,0 0,0 0,0 11.554,7 12.992,7 15.492,6Metal doré / dore - - - - - - - 8.503,4 8.189,5 5.665,1
Concentrados / Concentrates - - - - - - - 3.051,3 4.803,2 9.827,5
Medianas empresas / Medium-size Producers 20.035,0 24.536,1 25.581,8 28.092,4 31.645,7 38.128,8 35.749,3 13.016,5 14.840,0 20.948,2 Metal doré / dore 7.673,5 11.299,8 14.117,4 13.279,8 17.106,5 23.371,5 24.150,8 9.924,6 12.141,4 18.024,1
Concentrados / Concentrates 10.742,5 12.166,3 10.304,6 11.955,0 11.553,8 11.471,7 8.645,3 3.091,9 2.698,6 2.845,8
precipitados / precipitates 526,3 440,1 846,0 2.604,9 2.906,7 2.915,7 2.927,3 - - -
oro amalgamado / amalgamated Gold 384,4 360,7 92,3 83,4 43,7 54,7 - - - -
oro en barra / Gold bars 708,3 269,2 221,5 169,3 35,0 315,2 25,9 - - 78,3
Minerales de concentración / Concentrate ores - - - - - - - - - -
Pequeñas empresas / small Producers 704,7 760,2 664,6 585,9 444,1 531,6 460,6 4.947,2 3.673,6 2.966,0 Metal doré / dore - - - - - - - 2.802,9 1.953,5 1.897,4
Concentrados / Concentrates - - - - - - - 773,2 826,9 517,0
precipitados / precipitates - - - - - - - 1.081,1 633,6 233,5
oro en barra / Gold bars - - - - - - - 20,2 48,5 68,0
Minerales de fundición / Smelting ores 169,1 156,1 148,2 118,2 94,1 78,0 83,0 59,7 42,7 22,6
Minerales de cianuración / Cyaniding ores 24,3 13,2 - - - -
Minerales de concentración / Concentrate ores 471,0 564,8 503,6 467,7 350,0 453,6 377,6 210,1 168,4 227,5
oro de lavaderos / placer Gold 40,3 26,1 12,8 - - - - - - -
MineríA del cobre / copper Mining 6.026,2 7.261,3 7.362,5 10.055,9 12.439,1 14.373,4 13.189,0 15.329,8 16.479,5 14.647,1 Grandes empresas / large producers 1.971,2 2.214,4 2.217,3 2.813,9 2.764,2 2.468,3 1.290,5 12.035,7 12.277,9 11.964,9
Medianas empresas / Medium-Size producers 3.489,4 4.564,7 4.711,0 6.886,6 9.367,5 11.732,1 11.696,7 2.011,4 3.763,4 2.170,5
pequeñas empresas / Small producers 565,6 482,2 434,2 355,4 307,4 173,0 201,8 1.282,7 438,2 511,7
MineríA de lA PlAtA / silver Mining 2.100,3 1.912,3 28,6 45,2 35,6 106,2 48,0 68,6 8,9 6,1 Medianas empresas / Medium-Size producers 2.098,2 1.912,2 28,6 45,2 35,6 106,2 - - - -
pequeñas empresas / Small producers 2,1 0,1 - - - - 48,0 68,6 8,9 6,1
MineríA del PloMo y Zinc / lead & Zinc Mining 13,2 2,8 0,0 6,5 20,9 34,1 12,2 62,9 74,1 82,6 Medianas empresas / Medium-Size producers 13,2 2,8 6,5 20,9 34,1 12,2 62,9 74,1 82,6
totAl MineríA MetÁlicA / total Metal Mining 28.879,4 34.472,7 33.637,5 38.785,9 44.585,4 53.174,1 49.459,1 44.979,7 48.068,8 54.142,6 Fuente / Source: Servicio nacional de Geología y Minería / national Geology and Mining Service.
23
TABLA / TABLE 5.2 PRODUCCIÓN CHILENA DE ORO SEGÚN ORIGEN Gold Production by Source (kg de oro fino) / (kg Fine Gold)
2001 2002 2003 2004 2005 2006 2007 2008 2009 2010
MineríA del oro / Gold Mining 29.351,2 23.893,2 23.247,8 23.456,1 24.007,0 26.427,0 26.112,0 24.817,0 26.224,0 24.381,0
Grandes empresas / large Producers 9.118,7 5.988,7 6.218,6 5.779,8 5.205,0 11.468,0 12.639,0 12.241,0 13.207,0 18.027,0 Metal doré / dore 3.644,2 5.988,7 6.218,6 5.779,8 5.205,0 11.468,0 10.641,0 11.148,0 12.146,0 16.864,0
Concentrados / Concentrates 5.474,5 - - - - - 1.998,0 1.093,0 1.061,0 1.163,0
Medianas empresas / Medium-size Producers 18.064,7 14.588,4 14.230,4 16.089,2 17.241,0 13.604,0 12.060,0 11.182,0 10.776,0 4.782,0 Metal doré / dore 16.107,3 12.262,0 12.076,0 13.078,7 13.715,0 10.796,0 11.530,0 10.867,0 10.201,0 4.206,0
Concentrados / Concentrates 1.872,4 2.326,4 2.152,7 2.826,6 3.329,0 2.533,0 311,0 305,0 575,0 576,0
precipitados / precipitates
oro en barra / Gold bars 85,0 - 1,7 183,9 197,0 250,0 219,0 10,0 - -
Minerales de concentración / Concentrate ores - - - - - 25,0 - - - -
Pequeñas empresas / small Producers 2.167,8 3.316,1 2.798,8 1.587,1 1.561,0 1.355,0 1.413,0 1.394,0 2.241,0 1.572,0 Metal doré / dore 1.307,6 2.320,1 1.392,6 568,5 590,0 526,0 595,0 370,0 379,0 338,0
Concentrados / Concentrates 461,6 436,8 645,5 476,0 442,0 278,0 281,0 383,0 455,0 187,0
precipitados / precipitates - - - - - - - - - -
oro en barra / Gold bars 37,7 153,0 335,8 138,5 125,0 153,0 70,0 161,0 334,0 166,0
Minerales de fundición / Smelting ores 34,1 21,2 12,7 20,0 35,0 21,0 31,0 97,0 83,0 17,0
Minerales de concentración / Concentrate ores 326,8 385,0 412,2 384,1 369,0 377,0 436,0 383,0 990,0 864,0
MineríA del cobre / copper Mining 13.224,3 14.735,5 15.667,2 16.272,3 16.049,0 15.341,0 14.967,0 14.037,0 14.250,0 15.069,0 Grandes empresas / large producers 10.923,2 12.181,2 13.105,4 13.694,8 12.690,0 12.109,0 12.578,0 11.624,0 11.568,0 12.934,0
Medianas empresas / Medium-Size producers 1.897,7 2.204,3 2.140,5 1.967,5 2.815,0 2.753,0 1.834,0 1.728,0 1.641,0 1.332,0
pequeñas empresas / Small producers 403,4 350,0 421,3 610,0 544,0 479,0 555,0 685,0 1.041,0 803,0
MineríA de lA PlAtA / silver Mining 5,9 7,3 4,8 1,6 1,0 2,0 2,0 2,0 2,0 1,0 pequeñas empresas / Small producers 5,9 7,3 4,8 1,6 1,0 2,0 2,0 2,0 2,0 1,0
MineríA del PloMo y Zinc / lead & Zinc Mining 91,2 51,9 33,8 255,7 390,0 330,0 446,0 306,0 358,0 43,0 Grandes empresas / large producers - - - - - - - - - 43,0
Medianas empresas / Medium-Size producers 91,2 51,9 33,8 255,7 390,0 330,0 446,0 306,0 358,0 -
totAl MineríA MetÁlicA / total Metal Mining 42.672,6 38.687,9 38.953,6 39.985,7 40.447,0 42.100,0 41.527,0 39.162,0 40.834,0 39.494,0 Fuente / Source: Servicio nacional de Geología y Minería / national Geology and Mining Service.
24
TABLA / TABLE 6.1 PRODUCCIÓN CHILENA DE PLATA SEGÚN ORIGEN Silver Production by Source (kg de plata fina) / (kg Fine Silver)
1991 1992 1993 1994 1995 1996 1997 1998 1999 2000
MineríA de lA PlAtA / silver Mining 18.873,4 17.607,7 13.013,2 25.003,9 17.067,3 8.185,8 3.110,8 4.679,6 1.151,7 349,8
Medianas empresas / Medium-size Producers 18.327,9 17.594,3 13.013,2 25.003,9 17.067,3 8.185,8 3.110,8 0,0 0,0 0,0plata metálica / Silver Metal 93,0 - 5.661,6 17.614,8 5.682,2 - - - - -
precipitados / precipitates 15.173,8 13.581,3 - - - - - - - -
Concentrados / Concentrates 3.061,1 4.013,0 7.351,6 7.389,1 11.385,1 8.185,8 3.110,8 - - -
Pequeñas empresas / small Producers 545,5 13,4 0,0 0,0 0,0 0,0 0,0 4.679,6 1.151,7 349,8Concentrados / Concentrates 4.679,6 1.151,7 349,8
Minerales de concentración / Concentrate ores 541,9 7,9 - - - - - - - -
Minerales de fundición / Smelting ores 3,6 5,5 - - - - - - - -
MineríA del cobre / copper Mining 436.827,2 438.242,8 444.170,2 500.691,7 561.400,2 565.742,7 517.500,2 595.998,3 644.285,1 670.512,2 Grandes empresas / large producers 228.043,0 223.910,0 235.305,0 278.745,0 295.791,0 267.530,0 247.682,0 540.202,9 604.099,6 631.679,4
Medianas empresas / Medium-Size producers 201.348,8 207.787,6 205.901,9 218.836,6 262.822,7 295.984,4 266.603,2 47.183,2 27.332,1 29.856,4
pequeñas empresas / Small producers 7.435,4 6.545,2 2.963,3 3.110,1 2.786,5 2.228,3 3.215,0 8.612,2 12.853,4 8.976,4
MineríA del oro / Gold Mining 216.905,6 565.771,2 510.065,2 452.936,1 459.327,0 569.152,5 567.636,8 738.400,8 733.464,0 565.967,7 Grandes empresas / large producers - - - - - - - 654.988,4 664.521,4 377.216,7
Medianas empresas / Medium-Size producers 216.429,5 564.752,8 509.506,3 452.658,4 459.183,5 569.070,7 567.548,3 73.975,4 63.299,6 184.412,2
pequeñas empresas / Small producers 476,1 1.018,4 558,9 277,7 143,5 81,8 88,5 9.437,0 5.643,0 4.338,8
MineríA del PloMo y Zinc / lead & Zinc Mining 3.732,9 3.201,0 2.819,3 4.373,0 3.303,0 3.921,4 3.063,6 1.120,4 1.810,7 1.785,9 Medianas empresas / Medium-Size producers 3.732,9 3.201,0 2.819,3 4.373,0 3.303,0 3.921,4 3.063,6 1.120,4 1.810,7 1.785,9
totAl MineríA MetÁlicA / total Metal Mining 676.339,1 1.024.822,7 970.067,9 983.004,7 1.041.097,5 1.147.002,4 1.091.311,4 1.340.199,1 1.380.711,5 1.238.615,6
Fuente / Source: Servicio nacional de Geología y Minería / national Geology and Mining Service.
25
TABLA / TABLE 6.2 PRODUCCIÓN CHILENA DE PLATA SEGÚN ORIGEN Silver Production by Source (kg de plata fina) / (kg Fine Silver)
2001 2002 2003 2004 2005 2006 2007 2008 2009 2010
MineríA de lA PlAtA / silver Mining 583,7 796,4 424,1 128,6 133,0 298,0 173,0 200,0 5,0 657,0
Medianas empresas / Medium-size Producers 0,0 0,0 0,0 0,0 0,0 0,0 0,0 0,0 0,0 0,0Concentrados / Concentrates - - - - - - - - - -
Pequeñas empresas / small Producers 583,7 796,4 424,1 128,6 133,0 298,0 173,0 200,0 5,0 657,0Concentrados / Concentrates 583,7 796,4 420,9 121,3 133,0 298,0 173,0 200,0 5,0 657,0
Minerales de concentración / Concentrate ores - - 3,2 7,3 - - - - - -
MineríA del cobre / copper Mining 687.694,6 591.898,7 653.466,6 747.094,5 857.435,0 852.908,0 853.495,0 792.177,0 778.729,0 809.983,0 Grandes empresas / large producers 653.508,7 523.172,2 583.043,4 694.247,7 789.771,0 778.515,0 782.316,0 730.193,0 707.245,0 742.043,0
Medianas empresas / Medium-Size producers 25.651,8 54.855,6 55.280,7 32.364,7 47.304,0 55.340,0 59.171,0 46.941,0 54.336,0 55.329,0
pequeñas empresas / Small producers 8.534,1 13.870,9 15.142,5 20.482,1 20.360,0 19.053,0 12.008,0 15.043,0 17.148,0 12.611,0
MineríA del oro / Gold Mining 656.926,0 614.825,8 655.735,2 609.857,4 539.404,0 752.303,0 1.079.420,0 603.934,0 518.177,0 474.584,0 Grandes empresas / large producers 398.896,2 226.141,4 252.614,3 229.691,0 157.138,0 380.647,0 797.488,0 264.093,0 177.518,0 449.616,0
Medianas empresas / Medium-Size producers 255.453,4 386.062,5 398.509,2 361.037,5 363.473,0 356.220,0 267.951,0 320.598,0 324.525,0 22.367,0
pequeñas empresas / Small producers 2.576,4 2.621,9 4.611,7 19.128,9 18.793,0 15.436,0 13.981,0 19.243,0 16.134,0 2.601,0
MineríA del PloMo y Zinc / lead & Zinc Mining 3.462,5 2.952,2 3.163,1 3.059,1 2.567,0 1.655,0 3.379,0 8.709,0 4.107,0 1.464,0 Grandes empresas / large producers - - - - - - - 8.709,0 4.107,0 1.464,0
Medianas empresas / Medium-Size producers 3.462,5 2.952,2 3.163,1 3.059,1 2.567,0 1.655,0 3.379,0 - - -
totAl MineríA MetÁlicA / total Metal Mining 1.348.666,8 1.210.473,1 1.312.789,0 1.360.139,6 1.399.539,0 1.607.164,0 1.936.467,0 1.405.020,0 1.301.018,0 1.286.688,0
Fuente / Source: Servicio nacional de Geología y Minería / national Geology and Mining Service.

26
27
1.2EXPORTACIONES MINERASMininG eXPorts
28
TABLA / TABLE 7 VALORES DE LOS EMBARQUES DE EXPORTACIÓN DE LA MINERÍA DE CHILE, MINERÍA METÁLICA Y NO METÁLICA Mining Exports, Including Metals and Industrial Minerals (Millones de US$ Fob de cada año) / (US$ Mn Fob)
2001 2002 2003 2004 2005 2006 2007 2008 2009 2010
MineríA MetÁlicA / Metals 7.229,6 7.041,5 8.468,7 16.621,2 22.045,2 37.669,9 43.522,8 41.900,0 29.435,2 43.415,7 Cobre / Copper (total) 6.525,9 6.279,3 7.553,0 14.530,0 17.762,6 33350,6 37.913,2 36.550,2 26.271,1 39.217,1
-Cobre (primario) / Copper (primary) 6.518,0 6.271,7 7.544,8 14.522,5 17.746,9 33.327,0 37.886,1 36.516,4 26.257,1 39.193,9
-Chatarra / Scrap 7,9 7,6 8,2 7,5 15,7 23,5 27,1 33,8 14,0 23,2
oro / Gold (total) 267,1 256,3 301,6 319,8 349,7 532,2 578,1 760,7 910,7 1.047,0 Mineral de oro / Gold mineral 29,7 15,6 19,3 6,5 13,0 9,3 9,2 32,8 26,6 25,6
oro metálico / Metallic gold - - - - 336,7 522,9 568,9 727,9 884,1 1.021,4
Metal doré (oro) / doré 237,4 240,7 282,3 313,3 0,0 0,0 0,0 0,0 0,0 0,0
Molibdeno / Molybdenum (total) 198,7 264,5 373,8 1.485,1 3.487,9 3.006,0 4.036,1 3.618,8 1.360,5 1.627,6 Óxido de molibdeno / Molybdenum oxide 127,9 190,1 238,4 777,2 1.704,1 1.339,9 1.702,3 2.023,4 961,5 947,2
Ferromolibdeno / Ferromolybdenum 11,2 16,0 36,2 141,6 460,8 547,5 705,4 837,8 196,2 305,7
trióxido de molibdeno / Molybdenum trioxide 23,9 19,4 27,9 103,0 221,8 243,6 238,4 266,9 61,3 147,3
Concentrados de molibdeno / Molybdenum concentrates 35,7 39,0 71,3 463,3 1.101,2 875,1 1.390,0 490,7 141,5 227,3
Hierro / iron (total) 135,6 139,9 135,2 160,1 307,6 328,5 402,1 547,5 560,0 1.110,3 hierro granel / bulk iron 40,3 34,5 31,0 42,6 80,0 114,1 165,2 234,5 374,0 669,0
hierro peletizado / pellet iron 95,3 105,4 104,2 117,5 227,6 214,4 236,9 313,0 186,0 441,3
PlAtA / silver (total) 93,8 90,4 93,9 113,4 116,1 326,9 538,4 389,6 313,1 368,6 plata Metálica / Metallic Silver 250,1 463,2 346,6 313,1 368,6
Mineral de plata / Silver Mineral 76,8 75,2 43,0 0,0 0,0
MinerAl de Zinc / Zinc mineral 8,5 11,1 11,2 12,8 21,3 125,7 54,9 33,2 19,7 45,1
MineríA no MetÁlicA / industrial Minerals 298,8 294,2 332,8 370,2 482,3 533,3 636,9 847,8 735,0 856,8 Yodo / iodine 130,2 126,8 143,9 174,6 249,6 276,9 323,2 372,3 361,6 407,5
Salitre / nitrate (total) 62,7 67,5 66,3 79,5 82,8 83,5 82,4 171,2 129,0 156,6
Salitre sódico / Sodium nitrate 30,3 25,7 30,8 32,4 33,8 81,3 70,0 99,5
Salitre potásico / potassium nitrate 32,4 41,8 35,5 47,1 48,6 89,9 59,0 57,1
Carbonato de litio / lithium Carbonate 51,8 56,0 64,0 66,9 89,4 122,5 187,5 221,5 114,7 174,4
Sal Marina Y de MeSa / Salt 37,8 29,1 43,9 37,3 51,8 42,7 32,5 69,4 122,0 112,8
SUlFato de Sodio / Sodium Sulfate 3,5 2,9 1,5 0,0 0,5 0,0 0,0 0,0 0,0 0,0
triÓXido de arSÉniCo / arsenic trioxide 2,0 0,6 0,1 0,0 0,0 0,0 0,0 0,0 0,0 0,0
boratoS natUraleS en brUto / borates 8,0 8,9 10,3 9,8 6,4 4,1 7,2 10,0 5,1 5,5
harinaS SilÍCeaS / Siliceous earths 2,8 2,4 2,8 2,1 1,8 3,6 4,1 3,4 2,6 0,0
otros / other 6,9 17,8 49,7 76,3 102,8 23,6 33,8 98,8 29,0 55,4
totAl eXPortAciones MinerAs total Mining exports 7.535,3 7.353,5 8.851,2 17.067,7 22.630,3 38.226,8 44.193,5 42.846,6 30.199,2 44.327,9
PARTICIPACIÓN DEL SECTOR MINERO EN LAS EXPORTACIONES DEL PAÍS Sector Share of Country Exports (%)
2001 2002 2003 2004 2005 2006 2007 2008 2009 2010
totAl MineríA / total Mining 41,0 40,0 41,5 53,1 56,7 65,1 65,6 61,2 57,7 63,5 Cobre / Copper 35,5 34,1 35,4 45,2 44,5 56,8 56,3 52,2 50,2 56,1
Molibdeno / Molybdenum 1,1 1,4 1,8 4,6 8,7 5,1 6,0 5,2 2,6 2,3
hierro / iron 0,7 0,8 0,6 0,5 0,8 0,6 0,6 0,8 1,1 1,6
oro / Gold 1,5 1,4 1,4 1,0 0,9 0,9 0,9 1,1 1,7 1,5
Yodo / iodine 0,7 0,7 0,7 0,5 0,6 0,5 0,5 0,5 0,7 0,6
plata / Silver 0,5 0,5 0,4 0,4 0,3 0,6 0,8 0,6 0,6 0,5
otroS / other 1,0 1,1 1,2 0,9 0,9 0,6 0,5 0,8 0,8 0,9
Fuente / Source: -banco Central, excepto cobre. / Central bank, save for copper. -Comisión Chilena del Cobre, cifras de cobre. / Copper data by Chilean Copper Commission.
29
TABLA / TABLE 8 EMBARQUES DE EXPORTACIÓN DE LA MINERÍA DE CHILE, METÁLICA Y NO METÁLICA Mining Sector Exports, Including Metals and Industrial Minerals
2001 2002 2003 2004 2005 2006 2007 2008 2009 2010
MineríA MetÁlicA / Metal Mining
Cobre total (Miles de tMFC) / total Copper (kMtFC) 4.649,5 4.502,2 4.687,5 5.485,6 5.337,0 5.234,0 5.673,4 5.405,3 5.420,5 5.442,1
Cobre primario / primary Copper 4.643,3 4.496,9 4.682,5 5.482,5 5.331,2 5.229,3 5.668,4 5.398,9 5.416,1 5.437,9
Chatarra / Scrap 6,2 5,3 5,0 3,1 5,8 4,7 5,0 6,4 4,4 4,2
ÓXido de Molibdeno (tMFC) / Molybdenum oxide (MtFC) 24.754 25.555 22.220 26.893 24.277 24.824 26.173 28.431 35.386 30.017
FerroMolibdeno (tMFC) / Ferro-Molybdenum (MtFC) 1.744 3.157 4.073 5.762 9.248 14.001 14.828 16.918 10.820 12.485
triÓXido de Molibdeno (tMFC) / Molybdenum trioxide (MtFC) 2.602 1.772 2.025 2.880 2.916 4.142 5.097 5.436 3.734 6.076
ConCentradoS de Molibdeno (tMFC) / Molybdenum Concentrates (MtFC) 2.766 6.019 6.998 15.276 18.130 19.793 22.962 7.969 6.505 7.255
MineraleS de ManGaneSo (tMFC) / Manganese ores (MtFC) n.d. n.d. n.d. 2.900 24.500 10.997 0 12 278 33
Mineral de ZinC (tMn) / Zinc ores (net Mt) 57.068 93.458 69.901 59.900 64.314 125.061 64.206 80.313 43.531 63.128
ploMo (tMn) / lead (net Mt) n.d. n.d. n.d. n.d. 1.716 292 0 6.818 1.155 1.380
plata MetÁliCa (knFC) / Silver Metal (net kGFC) 681.998 643.000 615.000 547.000 512.404 680.992 1.096.731 700.846 700.064 599.274
Mineral de plata (tMn) / / Silver ores (net Mt) n.d. 1.495 6.524 9.944 8.393 9.926 8.535 6.083 686 604
Mineral de oro (tMn) / Gold ores (net Mt) 46.360 13.184 9.620 6.093 2.311 2.910 2.967 6.951 9.808 6.717
oro MetÁliCo (knFC) / Gold Metal (net kGFC) n.d. 25.239 24.560 25.309 23.841 27.903 25.816 26.490 29.623 27.111
Metal dorÉ (oro) (knFC) / dore (net kGFC) 35.004 n.d. n.d. n.d. n.d. n.d. n.d. n.d. n.d. n.d.
hierro Granel (Miles de tM) / bulk iron (kMt) 2.889 3.023 1.888 2.161 2.670 2.872 3.585 3.544 6.181 7.038
hierro peletiZado (Miles de tM) / pelletized iron (kMt) 3.292 4.618 3.543 3.155 3.454 2.952 3.122 2.723 2.207 3.156
FerroCroMo (tM) / Ferrochromium (Mt) 9 2 0 0 131 84 193 54 11 184
MineríA no MetÁlicA / industrial Minerals
boratoS natUraleS en brUto (tM) / natural borates, bulk (Mt) 59.060 70.674 81.151 69.309 39.089 21.533 46.145 34.306 20.028 21.240
triÓXido de arSÉniCo (tM) / arsenic trioxide (Mt) 4.927 1.554 430 476 69 0 0 0 0 0
arenaS SilÍCeaS (tM) / Silica Sand (Mt) 7.413 6.105 7.681 5.404 4.902 8.605 9.215 6.986 5.318 70
Carbonato de litio (tM) / lithium Carbonate (Mt) 33.432 38.536 41.066 40.145 41.832 38.682 41.125 42.586 22.443 40.886
Salitre SÓdiCo (tM) / Sodium nitrate (Mt) 193.454 186.693 173.085 149.055 153.676 122.078 112.546 158.324 123.017 168.811
Salitre potÁSiCo (tM) / potassium nitrate (Mt) 172.546 238.350 198.452 243.653 203.773 188.168 186.849 171.661 109.685 133.941
Sal Marina Y de MeSa (Miles de tM) / Salt (kMt) 4.195 2.843 4.740 4.000 4.860 3.637 2.812 5.573 6.827 6.540
SUlFato de Sodio (tM) / Sodium Sulfate (Mt) 46.660 43.122 17.680 715 4.636 379 28 9 541 252
Yodo (tM) / iodine (Mt) 9.375 11.305 11.916 12.898 13.974 13.259 14.078 15.816 13.406 15.401
n.d. información no disponible / not available. Fuente / Source: -banco Central / Central bank. -Comisión Chilena del Cobre, cifras de cobre y concentrados de molibdeno / Chilean Copper Commission, copper and molybdenum concentrate data.
30
TABLA / TABLE 9 VALORES DE LOS EMBARQUES DE EXPORTACIÓN DE LA MINERÍA METÁLICA DE CHILE POR PRODUCTO Y PAÍS DE DESTINO - AÑO 2010 Metal Mining Exports by Product Type and Destination - 2010 (Fob líquido de retorno en millones de dólares) / (US$ Mn Fob)
COBRE/ ORO/ HIERRO/ ÓXIDO DE TRIÓXIDO DE FERRO PLATA/ MINERAL CONCENTRADOS MINERÍA MOLIBDENO/ MOLIBDENO/ MOLIBDENO/ DE ZINC/ DE MOLIBDENO/ METÁLICA/ Copper Gold Iron Molybdenum Molybdenum Ferro- Silver Zinc Molybdenum Metal Oxide Trioxide Molybdenum Ores Concentrates Mining
euroPA / europe 7.056,8 412,8 0,0 375,1 125,8 67,5 131,2 0,0 63,0 8.232,2 alemania / Germany 320,1 43,1 - 4,8 2,0 - 26,2 - - 396,2 austria - - - 0,4 50,9 5,6 - - - 56,8 bélgica / belgium 862,8 - - 53,8 - - - - 18,0 934,6 bulgaria 236,4 - - - - - - - - 236,4 españa / Spain 614,1 - - 13,4 - 3,9 - - - 631,4 Finlandia / Finland 180,5 - - 6,6 - - - - - 187,1 Francia / France 1.009,3 - - - 9,6 - - - - 1.018,9 Grecia / Greece 255,1 - - - - - - - - 255,1 holanda / netherlands 1.325,6 - - 237,2 51,9 51,0 - - 45,0 1.710,8 italia / italy 1.780,4 - - 20,7 - - - - 1.801,1 noruega/ norway 5,3 - - - - - - - - 5,3 portugal - - - - - - - - - - reino Unido / United kingdom 164,5 0,3 - 15,9 - - - - - 180,7 rumania / romania - - 0,9 - - - - 0,9 Suecia / Sweden 184,2 - - 17,4 10,7 6,9 - - - 219,2 Suiza / Switzerland 118,4 369,4 - 3,5 - - 105,0 - - 596,3 otros / other - - - 1,2 - - - - - 1,2 AMÉricA / America 5.230,2 595,7 21,7 48,2 10,4 164,2 237,0 7,0 60,3 6.374,5 argentina 74,1 0,1 - 2,5 2,1 7,2 0,8 - - 86,8 bolivia - - - - - 0,3 - - - 0,3 brasil / brazil 2.291,5 - (a) 26,3 - 53,6 28,7 - - 2.400,2 Canadá / Canada 202,9 354,7 - - - 4,2 151,0 7,0 - 719,8 Colombia 32,6 21,0 - - - 0,1 (a) - - 53,7 ecuador - - - - - - 0,3 - - 0,3 estados Unidos / USa 1.735,4 216,2 16,7 19,2 8,3 95,4 55,7 - 59,6 2.206,6 México / Mexico 707,1 1,0 - - - 3,3 (a) (a) 0,7 712,1 panamá / panama 115,9 2,6 - - - - - - - 118,5 perú / peru 22,8 - 5,0 0,2 - 0,1 (a) - (a) 28,1 Uruguay - - - - - - 0,1 - - 0,1 Venezuela 45,7 - - - - - - - - 45,7 otros / other 2,1 - - - - - 0,4 - - 2,5 - - - - AsiA 24.179,9 36,5 1.077,4 523,9 11,1 61,8 0,0 38,1 44,9 25.973,7 arabia Saudita / Saudi arabia 6,9 - - - - - - - - 6,9 China 12.791,9 24,7 743,6 134,5 - - - 2,0 8,9 13.705,7 Corea del Sur / South korea 2.921,2 - 24,5 33,7 - 3,4 - 36,1 32,4 3.051,4 emiratos Árabes / arab emirates - 11,8 - - - - - - - 11,8 Filipinas / philippines 190,3 - - - - - - - - 190,3 hong kong 21,5 - - - - - - - - 21,5 india 1.495,0 - - 0,8 - 0,5 - - - 1.496,3 indonesia - - 112,7 - - - 112,7 israel - - - - - - - - 0,7 0,7 Japón / Japan 4.619,5 - 136,5 348,6 11,1 48,7 - - - 5.164,4 Malasia / Malaysia 139,7 - 60,1 - - - - - - 199,8 omán / oman 20,8 - - - - - - - - 20,8 Singapur / Singapore 20,9 - - - - - - - - 20,9 tailandia / thailand 135,6 - - - - 1,4 - - 2,9 139,9 taiwán / taiwan 1.473,3 - - 6,4 - 7,7 - - - 1.487,4 turquía / turkey 250,4 - - - - - - - - 250,4 Vietnam 92,7 - - - - - - - - 92,7 otros / other 0,1 - - - - - - - - 0,1 otros / other 2.750,2 2,0 11,2 0,0 0,0 12,2 0,4 0,0 59,1 2.835,2 australia 517,7 - - - - - - - - 517,7 nueva Zelandia / new Zealand - - - - - - - - - 0,0 Sudáfrica / South africa - - - - - 6,3 - - - 6,3 otros / other 2.232,5 2,0 11,2 - - 5,9 0,4 - 59,1 2.311,3 - - - - - - - totAl 39.217,1 1.047,0 1.110,3 947,2 147,3 305,7 368,6 45,1 227,3 43.415,7 (a) Valor inferior a 50 mil dólares / Under US$50,000. Fuente / Source: -banco Central, excepto cobre / Central bank, save for copper. -Comisión Chilena del Cobre, cifras de cobre. / Copper data by Chilean Copper Commission.
31
MINERÍA CARBONATO SAL SALITRE SALITRE BORATOS YODO/ OTROS ABONOS HARINAS OTROS/ MINERÍA TOTAL METÁLICA/ DE LITIO/ MARINA/ SÓDICO/ POTÁSICO/ NATURALES/ MINERALES/ SILÍCEAS/ NO METÁLICA/ MINERÍA/ Metal Lithium Salt Sodium Potassium Borates Iodine Other Mineral Siliceous Other Industrial Total Mining Carbonate Nitrate Nitrate Fertilizers Earths Minerals Mining
euroPA / europe 8.232,2 49,5 3,1 54,1 5,7 0,2 144,9 0,0 0,0 0,0 257,5 8.489,7 alemania / Germany 396,2 19,3 0,3 - - - - - - (a) 19,6 415,8 austria 56,8 - - 1,0 - 0,1 0,5 - - - 1,6 58,4 bélgica / belgium 934,6 21,7 0,1 9,0 0,9 - 112,9 - - - 144,6 1.079,2 bulgaria 236,4 - - - - - - - - - 0,0 236,4 españa / Spain 631,4 4,5 (a) 20,5 4,8 (a) 1,6 - - - 31,4 662,8 Finlandia / Finland 187,1 - - - - - - - - - 0,0 187,1 Francia / France 1.018,9 - - - - - - - - - 0,0 1.018,9 Grecia / Greece 255,1 - - - - - - - - - 0,0 255,1 holanda / netherlands 1.710,8 - 2,2 - - - 23,2 - - - 25,4 1.736,2 italia / italy 1.801,1 4,1 - 0,1 - - 0,5 - - - 4,7 1.805,9 noruega/ norway 5,3 - - - - - 4,0 - - - 4,0 9,3 portugal 0,0 - - 23,5 - - - - - - 23,5 23,5 reino Unido / United kingdom 180,7 - 0,5 - - 0,1 2,2 - - - 2,8 183,6 rumania / romania 0,9 - - - - - - - - - 0,0 0,9 Suecia / Sweden 219,2 - - - - - - - - - 0,0 219,2 Suiza / Switzerland 596,3 - - - - - - - - - 0,0 596,3 otros / other 1,2 - - - - - - - - - 0,0 1,2
AMÉricA / America 6.374,5 11,8 109,7 33,9 49,7 5,0 145,8 39,3 0,1 3,8 399,1 6.773,6 argentina 86,8 - 0,9 2,3 - 0,1 1,4 - 0,1 1,4 6,2 93,0 bolivia 0,3 - 0,2 (a) - - - - - 0,5 0,7 1,0 brasil / brazil 2.400,2 - 12,9 4,8 45,6 3,1 26,5 12,8 - 0,1 105,8 2.505,9 Canadá / Canada 719,8 1,7 0,6 0,1 - - - - - 0,1 2,5 722,3 Colombia 53,7 - 1,0 0,5 - 0,1 0,8 - - 0,2 2,6 56,3 ecuador 0,3 - (a) 0,1 - 0,4 (a) - (a) 0,4 0,9 1,2 estados Unidos / USa 2.206,6 9,1 89,1 21,9 0,4 0,7 111,2 - - 0,1 232,5 2.439,0 México / Mexico 712,1 1,1 1,2 - 3,4 0,3 2,6 26,4 - 0,4 35,4 747,4 panamá / panama 118,5 - (a) 0,2 - - - - - 0,3 0,5 119,0 perú / peru 28,1 - 1,1 2,4 - (a) 0,1 (a) - 0,3 3,9 32,0 Uruguay 0,1 - 2,2 0,1 - - (a) - - (a) 2,3 2,4 Venezuela 45,7 - (a) 0,8 - - 0,2 - - (a) 1,0 46,7 otros / other 2,5 - 0,5 0,6 0,3 0,3 3,0 0,2 - - 4,9 7,4
AsiA 25.973,7 112,9 0,0 10,5 1,6 0,0 115,2 0,0 0,0 10,4 250,5 26.224,2 arabia Saudita / Saudi arabia 6,9 - - - - - 1,2 - - 1,2 8,1 China 13.705,7 19,8 (a) 0,1 - (a) 71,9 - - 10,4 102,2 13.807,9 Corea del Sur / South korea 3.051,4 38,3 2,1 - - 4,8 - (a) (a) 45,1 3.096,5 emiratos Árabes / arab emirates 11,8 - - - - - 2,6 - - - 2,6 14,4 Filipinas / philippines 190,3 - - - - - - - - - 0,0 190,3 hong kong 21,5 - - - - - - - - (a) 0,0 21,5 india 1.496,3 0,4 (a) - - 29,1 - - - 29,5 1.525,8 indonesia 112,7 (a) 0,6 1,1 - - - - - 1,7 114,4 israel 0,7 (a) - - - - - - - 0,0 0,7 Japón / Japan 5.164,4 52,5 (a) 5,9 - - 5,3 - - (a) 63,7 5.228,1 Malasia / Malaysia 199,8 0,5 - 0,5 - (a) - - - - 1,0 200,8 omán / oman 20,8 - - - - - - - - - 0,0 20,8 Singapur / Singapore 20,9 - - - - - (a) - - - 0,0 20,9 tailandia / thailand 139,9 1,4 - 1,2 0,5 - - - 3,1 143,0 taiwán / taiwan 1.487,4 0,1 - 0,1 0,1 - - - 0,3 1.487,7 turquía / turkey 250,4 - - - - - - - - 0,0 250,4 Vietnam 92,7 - - - - - 0,2 - - - 0,2 92,9 otros / other 0,1 - - - - - - - - 0,0 0,1
otros / other 2.835,2 0,3 0,0 1,0 0,1 0,2 1,6 0,0 0,0 1,9 5,1 2.840,4 australia 517,7 - (a) (a) 1,3 - - (a) 1,3 519,0 nueva Zelandia / new Zealand 0,0 - (a) (a) - - 0,3 - - - 0,3 0,3 Sudáfrica / South africa 6,3 0,3 - 1,0 - 0,2 - - - - 1,5 7,8 otros / other 2.311,3 - - - 0,1 - - - - 1,9 2,0 2.313,3
totAl 43.415,7 174,4 112,8 99,5 57,1 5,5 407,5 39,3 0,1 16,1 912,2 44.327,9
(a) Valor inferior a 50 mil dólares / Under US$50,000. Fuente / Source: -banco Central, excepto cobre / Central bank, save for copper. -Comisión Chilena del Cobre, cifras de cobre. / Copper data by Chilean Copper Commission.
TABLA / TABLE 10 VALORES DE LOS EMBARQUES DE EXPORTACIÓN DE LA MINERÍA NO METÁLICA DE CHILE POR PRODUCTO Y PAÍS DE DESTINO-AÑO 2010 Industrial Minerals Exports by Product Type and Destination - 2010(Fob líquido de retorno en millones de dólares) / (US$ Mn Fob)
32
TABLA / TABLE 11.1 EMBARQUES DE EXPORTACIÓN DE COBRE POR EXPORTADOR Copper Exports by Exporter (Miles de tM de cobre fino) / (kMt Copper Content)
1991 1992 1993 1994 1995 1996 1997 1998 1999 2000
A. totAl MineríA de cobre total copper exports 1.727,6 1.936,9 1.983,7 2.081,5 2.411,0 2.953,9 3.297,2 3.575,0 4.268,7 4.473,0
A1. codelco-cHile 991,6 1.041,1 1.001,4 1.001,8 1.088,5 1.097,9 1.261,5 1.400,3 1.549,5 1.566,3
A2. otrAs eMPresAs MinerAs other Mining companies 713,5 869,4 963,8 1.054,8 1.293,3 1.828,0 2.003,6 2.152,6 2.696,8 2.888,6 enami 263,2 269,2 253,0 200,7 189,1 195,9 194,7 170,5 131,3 143,2 anglo american norte 73,7 64,7 60,4 54,5 59,2 100,6 114,2 117,5 127,7 121,3 anglo american Sur 82,6 133,0 148,2 149,5 153,5 165,2 128,3 140,3 179,8 190,4 pudahuel 13,5 14,8 15,0 15,8 13,8 14,7 14,4 12,9 11,7 5,1 Cía. explot. de Minas - - - - - - 2,6 8,9 9,9 9,4 Xstrata Copper Chile S.a. - - 22,6 91,9 90,6 110,9 60,5 54,4 63,4 64,5 C.M.tocopilla 0,8 0,3 - 0,1 - 0,3 0,9 0,1 - 0,3 escondida 265,3 341,1 391,8 432,1 442,8 746,7 792,8 791,0 852,0 765,6 ojos del Salado - 17,9 12,5 11,3 - 9,7 2,7 - - - Minera el Chacay - 14,9 19,2 21,0 - - - - - - los pelambres - - - - - - - - 2,4 288,8 Quebrada blanca - - - 5,6 45,9 63,9 65,2 72,6 74,9 70,6 punta del Cobre - - - 4,9 5,3 7,9 7,8 7,7 7,4 7,5 Cerro Colorado - - - 19,6 37,1 54,4 59,9 72,1 106,7 120,4 Minera Michilla S.a.(1) - - - 30,9 52,4 59,9 62,8 61,2 61,0 55,7 Carolina Michilla (1) 14,4 2,0 22,3 - - - - - - - Cía.Minera lince (1) - 10,5 18,8 - - - - - - - Candelaria - - - 16,6 153,8 143,8 152,5 206,0 201,2 166,0 rayrock ltda. - - - 0,3 8,6 10,5 10,5 9,5 8,7 12,5 el abra - - - - - 41,7 198,5 195,7 222,6 190,1 andacollo - - - - - - 19,8 20,7 20,2 20,4 Zaldívar - - - - 21,6 74,2 92,4 126,0 141,1 145,2 Cerro dominador - - - - - - 0,5 6,9 22,2 15,3 Collahuasi - - - - - - - 37,8 396,6 423,4 C.M. los Maitenes - - - - - - - 1,6 7,9 8,6 lomas bayas - - - - - - - 17,1 41,8 48,6 el tesoro - - - - - - - - - - transamet - - - - - - - - - 3,8 MG Metal Chile - - - - - - - - - 3,0 exp. San luis - - - - - - - - - 1,0 pechiney Chile ltda. - - - - - - 0,5 12,0 0,5 - alliance Copper limited - - - - - - - - - - atacama kozán - - - - - - - - - - haldeman - - - - - - - - - - Montecristo - - - - - - - - - - Grace S.a. - - - - - - - - - - Spence - - - - - - - - - - otroS / other - 1,0 - - 19,6 27,7 22,1 10,1 5,8 7,9
A3. trAnsForMAdores / semi Manufacturers 6,1 6,4 5,2 4,7 7,8 5,7 3,3 3,4 1,2 0,9 Coplasa 6,1 6,4 5,2 4,7 5,2 (a) - - - - Madeco - - - - 2,6 5,7 3,3 3,4 1,2 0,9
A4. eXPortAd. de cHAtArrA / scrap exporters 1,5 0,4 0,6 2,4 1,6 1,1 2,3 1,9 3,8 4,2 Madeco - - - - - 0,1 0,1 0,4 0,8 1,2 dionisio S.a. 0,4 - 0,2 0,5 0,6 - 0,4 0,2 0,4 0,8 Coproin ltda. 0,3 0,2 - - - - - - - - Metales trujillo 0,3 0,1 - - - - - - - - Cocesa 0,3 0,1 0,1 0,5 0,5 0,4 0,1 - - - M. Cerrillos - - - 1,3 0,5 0,6 0,6 0,4 0,2 0,1 F.Manchester - - - - - - 0,5 0,2 0,2 0,2 inesa - - - - - - 0,4 0,3 0,4 0,3 otroS / other 0,2 (a) 0,3 0,1 - - 0,2 0,4 1,8 1,6
A5. coProductores (2) / co-Producers 14,9 19,6 12,7 17,8 19,8 21,2 26,5 16,8 17,4 13,0 Cía. Minera el indio 14,9 19,6 12,7 17,8 19,8 21,2 26,5 16,8 17,4 13,0
(1) Con fecha 31 de diciembre de 1993, Cía. Minera Carolina de Michilla S.a. se fusionó con Cía. Minera lince ltda. dando origen a Minera Michilla S.a. / on 31 december 1993 Cia. Minera Carolina de Michilla S.a. and Cia. Minera lince ltda. merged into Minera Michilla S.a. (2) Cobre contenido en concentrados de minerales de oro y cobre refinado. / Copper contained in gold concentrates and refined copper. (a) Cifra inferior a 50 tM / Under 50 Mt.Fuente / Source: Comisión Chilena del Cobre / Chilean Copper Commission.
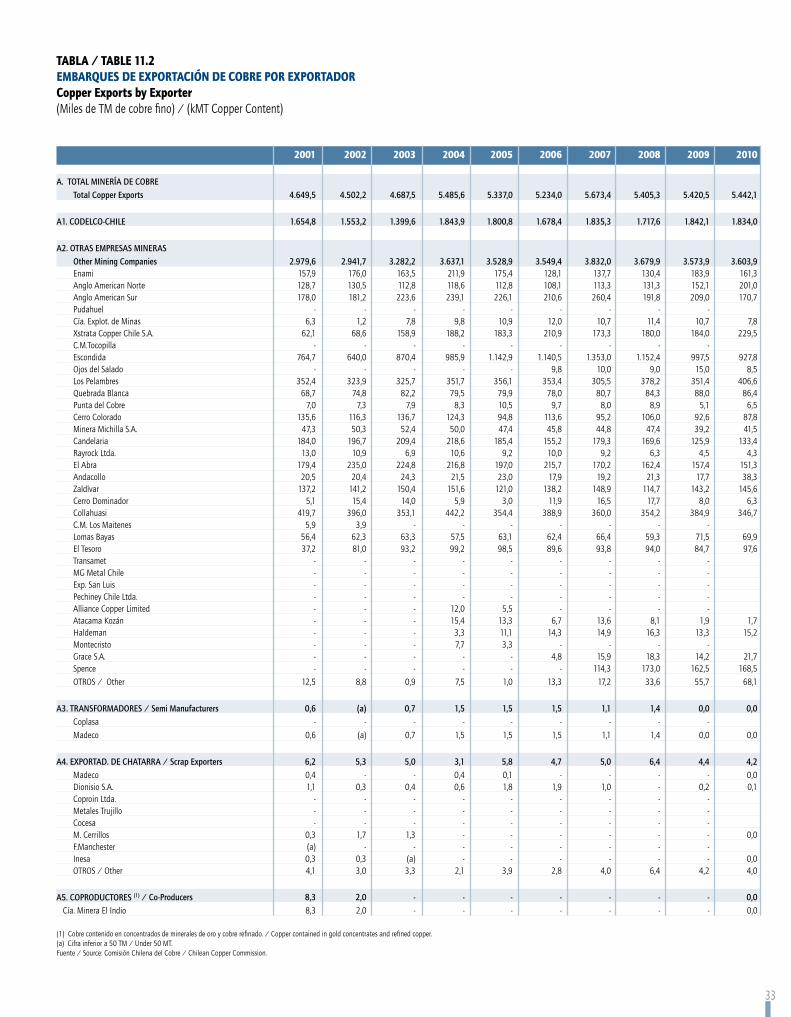
33
TABLA / TABLE 11.2 EMBARQUES DE EXPORTACIÓN DE COBRE POR EXPORTADOR Copper Exports by Exporter (Miles de tM de cobre fino) / (kMt Copper Content)
2001 2002 2003 2004 2005 2006 2007 2008 2009 2010
A. totAl MineríA de cobre total copper exports 4.649,5 4.502,2 4.687,5 5.485,6 5.337,0 5.234,0 5.673,4 5.405,3 5.420,5 5.442,1
A1. codelco-cHile 1.654,8 1.553,2 1.399,6 1.843,9 1.800,8 1.678,4 1.835,3 1.717,6 1.842,1 1.834,0
A2. otrAs eMPresAs MinerAs other Mining companies 2.979,6 2.941,7 3.282,2 3.637,1 3.528,9 3.549,4 3.832,0 3.679,9 3.573,9 3.603,9 enami 157,9 176,0 163,5 211,9 175,4 128,1 137,7 130,4 183,9 161,3 anglo american norte 128,7 130,5 112,8 118,6 112,8 108,1 113,3 131,3 152,1 201,0 anglo american Sur 178,0 181,2 223,6 239,1 226,1 210,6 260,4 191,8 209,0 170,7 pudahuel - - - - - - - - - Cía. explot. de Minas 6,3 1,2 7,8 9,8 10,9 12,0 10,7 11,4 10,7 7,8 Xstrata Copper Chile S.a. 62,1 68,6 158,9 188,2 183,3 210,9 173,3 180,0 184,0 229,5 C.M.tocopilla - - - - - - - - - escondida 764,7 640,0 870,4 985,9 1.142,9 1.140,5 1.353,0 1.152,4 997,5 927,8 ojos del Salado - - - - - 9,8 10,0 9,0 15,0 8,5 los pelambres 352,4 323,9 325,7 351,7 356,1 353,4 305,5 378,2 351,4 406,6 Quebrada blanca 68,7 74,8 82,2 79,5 79,9 78,0 80,7 84,3 88,0 86,4 punta del Cobre 7,0 7,3 7,9 8,3 10,5 9,7 8,0 8,9 5,1 6,5 Cerro Colorado 135,6 116,3 136,7 124,3 94,8 113,6 95,2 106,0 92,6 87,8 Minera Michilla S.a. 47,3 50,3 52,4 50,0 47,4 45,8 44,8 47,4 39,2 41,5 Candelaria 184,0 196,7 209,4 218,6 185,4 155,2 179,3 169,6 125,9 133,4 rayrock ltda. 13,0 10,9 6,9 10,6 9,2 10,0 9,2 6,3 4,5 4,3 el abra 179,4 235,0 224,8 216,8 197,0 215,7 170,2 162,4 157,4 151,3 andacollo 20,5 20,4 24,3 21,5 23,0 17,9 19,2 21,3 17,7 38,3 Zaldívar 137,2 141,2 150,4 151,6 121,0 138,2 148,9 114,7 143,2 145,6 Cerro dominador 5,1 15,4 14,0 5,9 3,0 11,9 16,5 17,7 8,0 6,3 Collahuasi 419,7 396,0 353,1 442,2 354,4 388,9 360,0 354,2 384,9 346,7 C.M. los Maitenes 5,9 3,9 - - - - - - - lomas bayas 56,4 62,3 63,3 57,5 63,1 62,4 66,4 59,3 71,5 69,9 el tesoro 37,2 81,0 93,2 99,2 98,5 89,6 93,8 94,0 84,7 97,6 transamet - - - - - - - - - MG Metal Chile - - - - - - - - - exp. San luis - - - - - - - - - pechiney Chile ltda. - - - - - - - - - alliance Copper limited - - - 12,0 5,5 - - - - atacama kozán - - - 15,4 13,3 6,7 13,6 8,1 1,9 1,7 haldeman - - - 3,3 11,1 14,3 14,9 16,3 13,3 15,2 Montecristo - - - 7,7 3,3 - - - - Grace S.a. - - - - - 4,8 15,9 18,3 14,2 21,7 Spence - - - - - - 114,3 173,0 162,5 168,5
otroS / other 12,5 8,8 0,9 7,5 1,0 13,3 17,2 33,6 55,7 68,1
A3. trAnsForMAdores / semi Manufacturers 0,6 (a) 0,7 1,5 1,5 1,5 1,1 1,4 0,0 0,0 Coplasa - - - - - - - - -
Madeco 0,6 (a) 0,7 1,5 1,5 1,5 1,1 1,4 0,0 0,0
A4. eXPortAd. de cHAtArrA / scrap exporters 6,2 5,3 5,0 3,1 5,8 4,7 5,0 6,4 4,4 4,2 Madeco 0,4 - - 0,4 0,1 - - - - 0,0 dionisio S.a. 1,1 0,3 0,4 0,6 1,8 1,9 1,0 - 0,2 0,1 Coproin ltda. - - - - - - - - - Metales trujillo - - - - - - - - - Cocesa - - - - - - - - - M. Cerrillos 0,3 1,7 1,3 - - - - - - 0,0 F.Manchester (a) - - - - - - - - inesa 0,3 0,3 (a) - - - - - - 0,0 otroS / other 4,1 3,0 3,3 2,1 3,9 2,8 4,0 6,4 4,2 4,0
A5. coProductores (1) / co-Producers 8,3 2,0 - - - - - - - 0,0 Cía. Minera el indio 8,3 2,0 - - - - - - - 0,0
(1) Cobre contenido en concentrados de minerales de oro y cobre refinado. / Copper contained in gold concentrates and refined copper. (a) Cifra inferior a 50 tM / Under 50 Mt.Fuente / Source: Comisión Chilena del Cobre / Chilean Copper Commission.
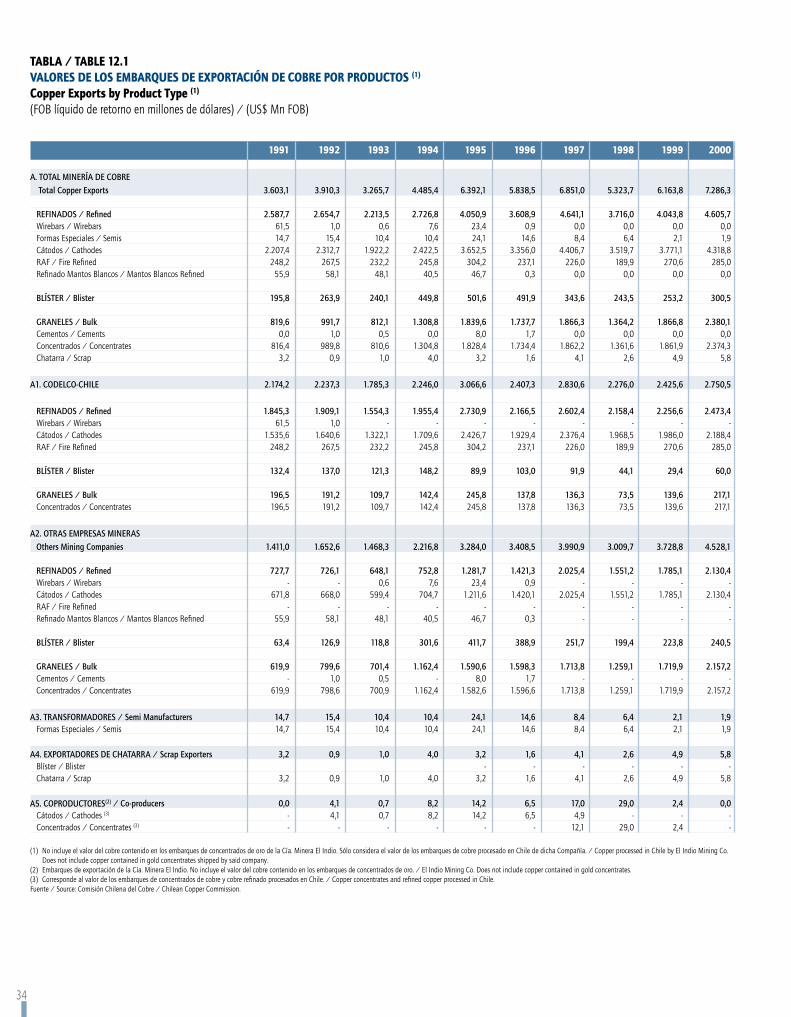
34
TABLA / TABLE 12.1 VALORES DE LOS EMBARQUES DE EXPORTACIÓN DE COBRE POR PRODUCTOS (1) Copper Exports by Product Type (1) (Fob líquido de retorno en millones de dólares) / (US$ Mn Fob)
1991 1992 1993 1994 1995 1996 1997 1998 1999 2000
A. totAl MineríA de cobre total copper exports 3.603,1 3.910,3 3.265,7 4.485,4 6.392,1 5.838,5 6.851,0 5.323,7 6.163,8 7.286,3 reFinAdos / refined 2.587,7 2.654,7 2.213,5 2.726,8 4.050,9 3.608,9 4.641,1 3.716,0 4.043,8 4.605,7 Wirebars / Wirebars 61,5 1,0 0,6 7,6 23,4 0,9 0,0 0,0 0,0 0,0 Formas especiales / Semis 14,7 15,4 10,4 10,4 24,1 14,6 8,4 6,4 2,1 1,9 Cátodos / Cathodes 2.207,4 2.312,7 1.922,2 2.422,5 3.652,5 3.356,0 4.406,7 3.519,7 3.771,1 4.318,8 raF / Fire refined 248,2 267,5 232,2 245,8 304,2 237,1 226,0 189,9 270,6 285,0 refinado Mantos blancos / Mantos blancos refined 55,9 58,1 48,1 40,5 46,7 0,3 0,0 0,0 0,0 0,0 blíster / blister 195,8 263,9 240,1 449,8 501,6 491,9 343,6 243,5 253,2 300,5 GrAneles / bulk 819,6 991,7 812,1 1.308,8 1.839,6 1.737,7 1.866,3 1.364,2 1.866,8 2.380,1 Cementos / Cements 0,0 1,0 0,5 0,0 8,0 1,7 0,0 0,0 0,0 0,0 Concentrados / Concentrates 816,4 989,8 810,6 1.304,8 1.828,4 1.734,4 1.862,2 1.361,6 1.861,9 2.374,3 Chatarra / Scrap 3,2 0,9 1,0 4,0 3,2 1,6 4,1 2,6 4,9 5,8
A1. codelco-cHile 2.174,2 2.237,3 1.785,3 2.246,0 3.066,6 2.407,3 2.830,6 2.276,0 2.425,6 2.750,5
reFinAdos / refined 1.845,3 1.909,1 1.554,3 1.955,4 2.730,9 2.166,5 2.602,4 2.158,4 2.256,6 2.473,4 Wirebars / Wirebars 61,5 1,0 - - - - - - - - Cátodos / Cathodes 1.535,6 1.640,6 1.322,1 1.709,6 2.426,7 1.929,4 2.376,4 1.968,5 1.986,0 2.188,4 raF / Fire refined 248,2 267,5 232,2 245,8 304,2 237,1 226,0 189,9 270,6 285,0 blíster / blister 132,4 137,0 121,3 148,2 89,9 103,0 91,9 44,1 29,4 60,0 GrAneles / bulk 196,5 191,2 109,7 142,4 245,8 137,8 136,3 73,5 139,6 217,1 Concentrados / Concentrates 196,5 191,2 109,7 142,4 245,8 137,8 136,3 73,5 139,6 217,1
A2. otrAs eMPresAs MinerAs others Mining companies 1.411,0 1.652,6 1.468,3 2.216,8 3.284,0 3.408,5 3.990,9 3.009,7 3.728,8 4.528,1 reFinAdos / refined 727,7 726,1 648,1 752,8 1.281,7 1.421,3 2.025,4 1.551,2 1.785,1 2.130,4 Wirebars / Wirebars - - 0,6 7,6 23,4 0,9 - - - - Cátodos / Cathodes 671,8 668,0 599,4 704,7 1.211,6 1.420,1 2.025,4 1.551,2 1.785,1 2.130,4 raF / Fire refined - - - - - - - - - - refinado Mantos blancos / Mantos blancos refined 55,9 58,1 48,1 40,5 46,7 0,3 - - - - blíster / blister 63,4 126,9 118,8 301,6 411,7 388,9 251,7 199,4 223,8 240,5 GrAneles / bulk 619,9 799,6 701,4 1.162,4 1.590,6 1.598,3 1.713,8 1.259,1 1.719,9 2.157,2 Cementos / Cements - 1,0 0,5 - 8,0 1,7 - - - - Concentrados / Concentrates 619,9 798,6 700,9 1.162,4 1.582,6 1.596,6 1.713,8 1.259,1 1.719,9 2.157,2
A3. trAnsForMAdores / semi Manufacturers 14,7 15,4 10,4 10,4 24,1 14,6 8,4 6,4 2,1 1,9 Formas especiales / Semis 14,7 15,4 10,4 10,4 24,1 14,6 8,4 6,4 2,1 1,9
A4. eXPortAdores de cHAtArrA / scrap exporters 3,2 0,9 1,0 4,0 3,2 1,6 4,1 2,6 4,9 5,8 blíster / blister - - - - - - Chatarra / Scrap 3,2 0,9 1,0 4,0 3,2 1,6 4,1 2,6 4,9 5,8
A5. coProductores(2) / co-producers 0,0 4,1 0,7 8,2 14,2 6,5 17,0 29,0 2,4 0,0 Cátodos / Cathodes (3) - 4,1 0,7 8,2 14,2 6,5 4,9 - - - Concentrados / Concentrates (3) - - - - - - 12,1 29,0 2,4 -
(1) no incluye el valor del cobre contenido en los embarques de concentrados de oro de la Cía. Minera el indio. Sólo considera el valor de los embarques de cobre procesado en Chile de dicha Compañía. / Copper processed in Chile by el indio Mining Co. does not include copper contained in gold concentrates shipped by said company.(2) embarques de exportación de la Cía. Minera el indio. no incluye el valor del cobre contenido en los embarques de concentrados de oro. / el indio Mining Co. does not include copper contained in gold concentrates.(3) Corresponde al valor de los embarques de concentrados de cobre y cobre refinado procesados en Chile. / Copper concentrates and refined copper processed in Chile.Fuente / Source: Comisión Chilena del Cobre / Chilean Copper Commission.
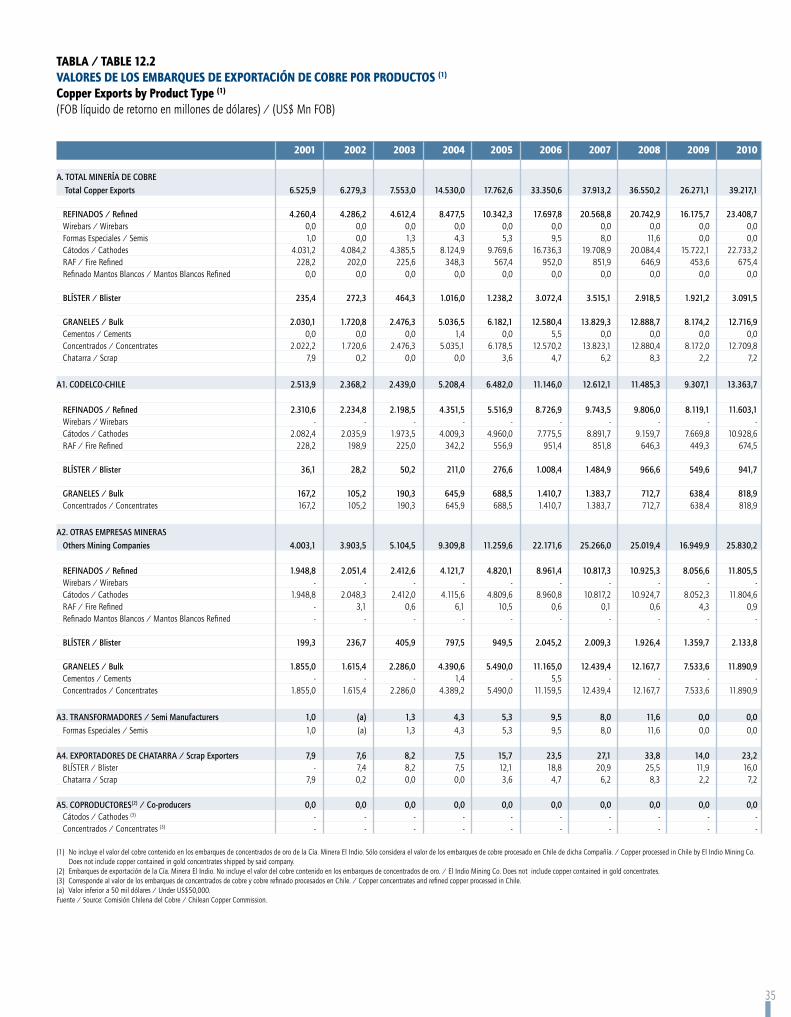
35
TABLA / TABLE 12.2 VALORES DE LOS EMBARQUES DE EXPORTACIÓN DE COBRE POR PRODUCTOS (1)
Copper Exports by Product Type (1) (Fob líquido de retorno en millones de dólares) / (US$ Mn Fob)
2001 2002 2003 2004 2005 2006 2007 2008 2009 2010
A. totAl MineríA de cobre total copper exports 6.525,9 6.279,3 7.553,0 14.530,0 17.762,6 33.350,6 37.913,2 36.550,2 26.271,1 39.217,1 reFinAdos / refined 4.260,4 4.286,2 4.612,4 8.477,5 10.342,3 17.697,8 20.568,8 20.742,9 16.175,7 23.408,7 Wirebars / Wirebars 0,0 0,0 0,0 0,0 0,0 0,0 0,0 0,0 0,0 0,0 Formas especiales / Semis 1,0 0,0 1,3 4,3 5,3 9,5 8,0 11,6 0,0 0,0 Cátodos / Cathodes 4.031,2 4.084,2 4.385,5 8.124,9 9.769,6 16.736,3 19.708,9 20.084,4 15.722,1 22.733,2 raF / Fire refined 228,2 202,0 225,6 348,3 567,4 952,0 851,9 646,9 453,6 675,4 refinado Mantos blancos / Mantos blancos refined 0,0 0,0 0,0 0,0 0,0 0,0 0,0 0,0 0,0 0,0 blíster / blister 235,4 272,3 464,3 1.016,0 1.238,2 3.072,4 3.515,1 2.918,5 1.921,2 3.091,5 GrAneles / bulk 2.030,1 1.720,8 2.476,3 5.036,5 6.182,1 12.580,4 13.829,3 12.888,7 8.174,2 12.716,9 Cementos / Cements 0,0 0,0 0,0 1,4 0,0 5,5 0,0 0,0 0,0 0,0 Concentrados / Concentrates 2.022,2 1.720,6 2.476,3 5.035,1 6.178,5 12.570,2 13.823,1 12.880,4 8.172,0 12.709,8 Chatarra / Scrap 7,9 0,2 0,0 0,0 3,6 4,7 6,2 8,3 2,2 7,2
A1. codelco-cHile 2.513,9 2.368,2 2.439,0 5.208,4 6.482,0 11.146,0 12.612,1 11.485,3 9.307,1 13.363,7 reFinAdos / refined 2.310,6 2.234,8 2.198,5 4.351,5 5.516,9 8.726,9 9.743,5 9.806,0 8.119,1 11.603,1 Wirebars / Wirebars - - - - - - - - - - Cátodos / Cathodes 2.082,4 2.035,9 1.973,5 4.009,3 4.960,0 7.775,5 8.891,7 9.159,7 7.669,8 10.928,6 raF / Fire refined 228,2 198,9 225,0 342,2 556,9 951,4 851,8 646,3 449,3 674,5 blíster / blister 36,1 28,2 50,2 211,0 276,6 1.008,4 1.484,9 966,6 549,6 941,7 GrAneles / bulk 167,2 105,2 190,3 645,9 688,5 1.410,7 1.383,7 712,7 638,4 818,9 Concentrados / Concentrates 167,2 105,2 190,3 645,9 688,5 1.410,7 1.383,7 712,7 638,4 818,9
A2. otrAs eMPresAs MinerAs others Mining companies 4.003,1 3.903,5 5.104,5 9.309,8 11.259,6 22.171,6 25.266,0 25.019,4 16.949,9 25.830,2 reFinAdos / refined 1.948,8 2.051,4 2.412,6 4.121,7 4.820,1 8.961,4 10.817,3 10.925,3 8.056,6 11.805,5 Wirebars / Wirebars - - - - - - - - - - Cátodos / Cathodes 1.948,8 2.048,3 2.412,0 4.115,6 4.809,6 8.960,8 10.817,2 10.924,7 8.052,3 11.804,6 raF / Fire refined - 3,1 0,6 6,1 10,5 0,6 0,1 0,6 4,3 0,9 refinado Mantos blancos / Mantos blancos refined - - - - - - - - - - blíster / blister 199,3 236,7 405,9 797,5 949,5 2.045,2 2.009,3 1.926,4 1.359,7 2.133,8 GrAneles / bulk 1.855,0 1.615,4 2.286,0 4.390,6 5.490,0 11.165,0 12.439,4 12.167,7 7.533,6 11.890,9 Cementos / Cements - - - 1,4 - 5,5 - - - - Concentrados / Concentrates 1.855,0 1.615,4 2.286,0 4.389,2 5.490,0 11.159,5 12.439,4 12.167,7 7.533,6 11.890,9
A3. trAnsForMAdores / semi Manufacturers 1,0 (a) 1,3 4,3 5,3 9,5 8,0 11,6 0,0 0,0 Formas especiales / Semis 1,0 (a) 1,3 4,3 5,3 9,5 8,0 11,6 0,0 0,0
A4. eXPortAdores de cHAtArrA / scrap exporters 7,9 7,6 8,2 7,5 15,7 23,5 27,1 33,8 14,0 23,2 blÍSter / blister - 7,4 8,2 7,5 12,1 18,8 20,9 25,5 11,9 16,0 Chatarra / Scrap 7,9 0,2 0,0 0,0 3,6 4,7 6,2 8,3 2,2 7,2
A5. coProductores(2) / co-producers 0,0 0,0 0,0 0,0 0,0 0,0 0,0 0,0 0,0 0,0 Cátodos / Cathodes (3) - - - - - - - - - - Concentrados / Concentrates (3) - - - - - - - - - -
(1) no incluye el valor del cobre contenido en los embarques de concentrados de oro de la Cía. Minera el indio. Sólo considera el valor de los embarques de cobre procesado en Chile de dicha Compañía. / Copper processed in Chile by el indio Mining Co. does not include copper contained in gold concentrates shipped by said company. (2) embarques de exportación de la Cía. Minera el indio. no incluye el valor del cobre contenido en los embarques de concentrados de oro. / el indio Mining Co. does not include copper contained in gold concentrates. (3) Corresponde al valor de los embarques de concentrados de cobre y cobre refinado procesados en Chile. / Copper concentrates and refined copper processed in Chile.(a) Valor inferior a 50 mil dólares / Under US$50,000. Fuente / Source: Comisión Chilena del Cobre / Chilean Copper Commission.
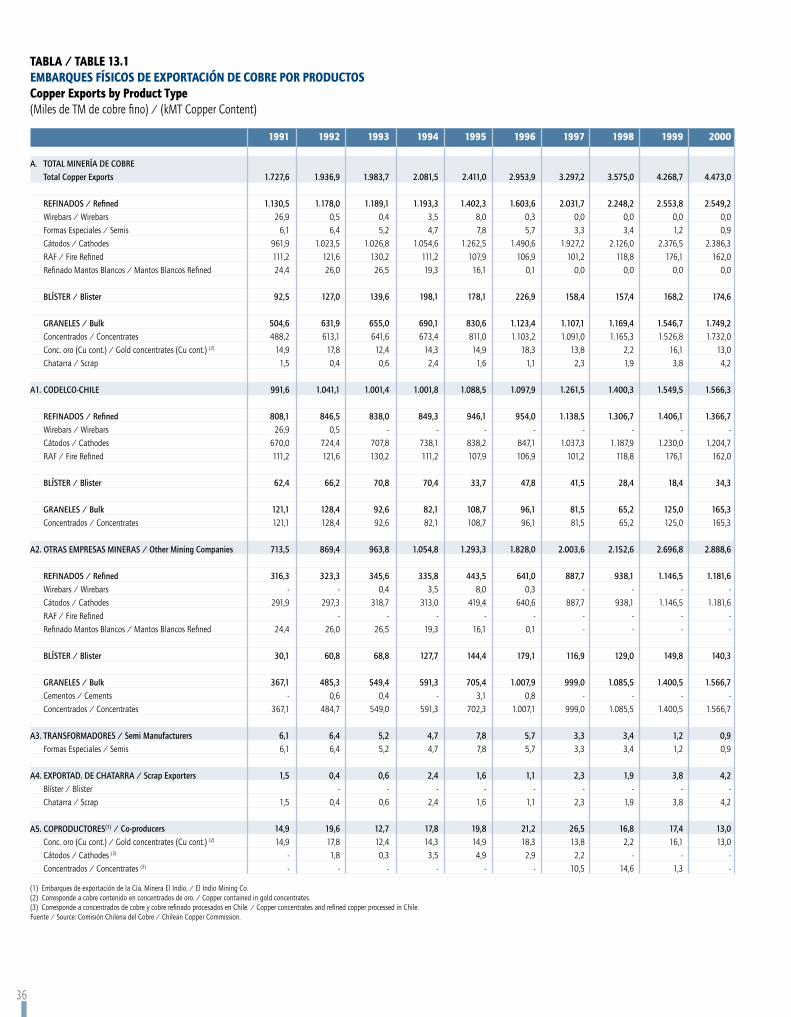
36
TABLA / TABLE 13.1 EMBARQUES FÍSICOS DE EXPORTACIÓN DE COBRE POR PRODUCTOS Copper Exports by Product Type (Miles de tM de cobre fino) / (kMt Copper Content)
1991 1992 1993 1994 1995 1996 1997 1998 1999 2000
A. totAl MineríA de cobre total copper exports 1.727,6 1.936,9 1.983,7 2.081,5 2.411,0 2.953,9 3.297,2 3.575,0 4.268,7 4.473,0
reFinAdos / refined 1.130,5 1.178,0 1.189,1 1.193,3 1.402,3 1.603,6 2.031,7 2.248,2 2.553,8 2.549,2 Wirebars / Wirebars 26,9 0,5 0,4 3,5 8,0 0,3 0,0 0,0 0,0 0,0
Formas especiales / Semis 6,1 6,4 5,2 4,7 7,8 5,7 3,3 3,4 1,2 0,9
Cátodos / Cathodes 961,9 1.023,5 1.026,8 1.054,6 1.262,5 1.490,6 1.927,2 2.126,0 2.376,5 2.386,3
raF / Fire refined 111,2 121,6 130,2 111,2 107,9 106,9 101,2 118,8 176,1 162,0
refinado Mantos blancos / Mantos blancos refined 24,4 26,0 26,5 19,3 16,1 0,1 0,0 0,0 0,0 0,0
blíster / blister 92,5 127,0 139,6 198,1 178,1 226,9 158,4 157,4 168,2 174,6
GrAneles / bulk 504,6 631,9 655,0 690,1 830,6 1.123,4 1.107,1 1.169,4 1.546,7 1.749,2 Concentrados / Concentrates 488,2 613,1 641,6 673,4 811,0 1.103,2 1.091,0 1.165,3 1.526,8 1.732,0
Conc. oro (Cu cont.) / Gold concentrates (Cu cont.) (2) 14,9 17,8 12,4 14,3 14,9 18,3 13,8 2,2 16,1 13,0
Chatarra / Scrap 1,5 0,4 0,6 2,4 1,6 1,1 2,3 1,9 3,8 4,2
A1. codelco-cHile 991,6 1.041,1 1.001,4 1.001,8 1.088,5 1.097,9 1.261,5 1.400,3 1.549,5 1.566,3
reFinAdos / refined 808,1 846,5 838,0 849,3 946,1 954,0 1.138,5 1.306,7 1.406,1 1.366,7 Wirebars / Wirebars 26,9 0,5 - - - - - - - -
Cátodos / Cathodes 670,0 724,4 707,8 738,1 838,2 847,1 1.037,3 1.187,9 1.230,0 1.204,7
raF / Fire refined 111,2 121,6 130,2 111,2 107,9 106,9 101,2 118,8 176,1 162,0
blíster / blister 62,4 66,2 70,8 70,4 33,7 47,8 41,5 28,4 18,4 34,3
GrAneles / bulk 121,1 128,4 92,6 82,1 108,7 96,1 81,5 65,2 125,0 165,3 Concentrados / Concentrates 121,1 128,4 92,6 82,1 108,7 96,1 81,5 65,2 125,0 165,3
A2. otrAs eMPresAs MinerAs / other Mining companies 713,5 869,4 963,8 1.054,8 1.293,3 1.828,0 2.003,6 2.152,6 2.696,8 2.888,6
reFinAdos / refined 316,3 323,3 345,6 335,8 443,5 641,0 887,7 938,1 1.146,5 1.181,6 Wirebars / Wirebars - - 0,4 3,5 8,0 0,3 - - - -
Cátodos / Cathodes 291,9 297,3 318,7 313,0 419,4 640,6 887,7 938,1 1.146,5 1.181,6
raF / Fire refined - - - - - - - - -
refinado Mantos blancos / Mantos blancos refined 24,4 26,0 26,5 19,3 16,1 0,1 - - - -
blíster / blister 30,1 60,8 68,8 127,7 144,4 179,1 116,9 129,0 149,8 140,3
GrAneles / bulk 367,1 485,3 549,4 591,3 705,4 1.007,9 999,0 1.085,5 1.400,5 1.566,7 Cementos / Cements - 0,6 0,4 - 3,1 0,8 - - - -
Concentrados / Concentrates 367,1 484,7 549,0 591,3 702,3 1.007,1 999,0 1.085,5 1.400,5 1.566,7
A3. trAnsForMAdores / semi Manufacturers 6,1 6,4 5,2 4,7 7,8 5,7 3,3 3,4 1,2 0,9 Formas especiales / Semis 6,1 6,4 5,2 4,7 7,8 5,7 3,3 3,4 1,2 0,9
A4. eXPortAd. de cHAtArrA / scrap exporters 1,5 0,4 0,6 2,4 1,6 1,1 2,3 1,9 3,8 4,2 blíster / blister - - - - - - - - -
Chatarra / Scrap 1,5 0,4 0,6 2,4 1,6 1,1 2,3 1,9 3,8 4,2
A5. coProductores(1) / co-producers 14,9 19,6 12,7 17,8 19,8 21,2 26,5 16,8 17,4 13,0 Conc. oro (Cu cont.) / Gold concentrates (Cu cont.) (2) 14,9 17,8 12,4 14,3 14,9 18,3 13,8 2,2 16,1 13,0
Cátodos / Cathodes (3) - 1,8 0,3 3,5 4,9 2,9 2,2 - - -
Concentrados / Concentrates (3) - - - - - - 10,5 14,6 1,3 -
(1) embarques de exportación de la Cía. Minera el indio. / el indio Mining Co. (2) Corresponde a cobre contenido en concentrados de oro. / Copper contained in gold concentrates. (3) Corresponde a concentrados de cobre y cobre refinado procesados en Chile. / Copper concentrates and refined copper processed in Chile. Fuente / Source: Comisión Chilena del Cobre / Chilean Copper Commission.
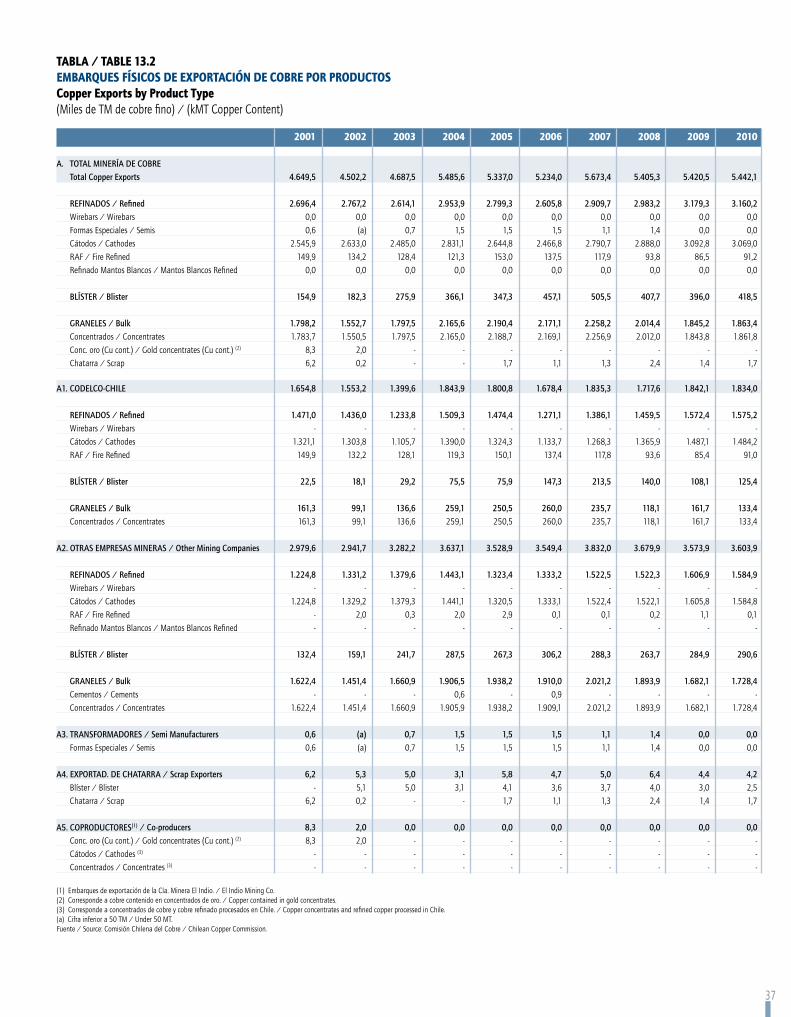
37
TABLA / TABLE 13.2 EMBARQUES FÍSICOS DE EXPORTACIÓN DE COBRE POR PRODUCTOS Copper Exports by Product Type(Miles de tM de cobre fino) / (kMt Copper Content)
2001 2002 2003 2004 2005 2006 2007 2008 2009 2010
A. totAl MineríA de cobre total copper exports 4.649,5 4.502,2 4.687,5 5.485,6 5.337,0 5.234,0 5.673,4 5.405,3 5.420,5 5.442,1
reFinAdos / refined 2.696,4 2.767,2 2.614,1 2.953,9 2.799,3 2.605,8 2.909,7 2.983,2 3.179,3 3.160,2 Wirebars / Wirebars 0,0 0,0 0,0 0,0 0,0 0,0 0,0 0,0 0,0 0,0
Formas especiales / Semis 0,6 (a) 0,7 1,5 1,5 1,5 1,1 1,4 0,0 0,0
Cátodos / Cathodes 2.545,9 2.633,0 2.485,0 2.831,1 2.644,8 2.466,8 2.790,7 2.888,0 3.092,8 3.069,0
raF / Fire refined 149,9 134,2 128,4 121,3 153,0 137,5 117,9 93,8 86,5 91,2
refinado Mantos blancos / Mantos blancos refined 0,0 0,0 0,0 0,0 0,0 0,0 0,0 0,0 0,0 0,0
blíster / blister 154,9 182,3 275,9 366,1 347,3 457,1 505,5 407,7 396,0 418,5
GrAneles / bulk 1.798,2 1.552,7 1.797,5 2.165,6 2.190,4 2.171,1 2.258,2 2.014,4 1.845,2 1.863,4 Concentrados / Concentrates 1.783,7 1.550,5 1.797,5 2.165,0 2.188,7 2.169,1 2.256,9 2.012,0 1.843,8 1.861,8
Conc. oro (Cu cont.) / Gold concentrates (Cu cont.) (2) 8,3 2,0 - - - - - - - -
Chatarra / Scrap 6,2 0,2 - - 1,7 1,1 1,3 2,4 1,4 1,7
A1. codelco-cHile 1.654,8 1.553,2 1.399,6 1.843,9 1.800,8 1.678,4 1.835,3 1.717,6 1.842,1 1.834,0
reFinAdos / refined 1.471,0 1.436,0 1.233,8 1.509,3 1.474,4 1.271,1 1.386,1 1.459,5 1.572,4 1.575,2 Wirebars / Wirebars - - - - - - - - - -
Cátodos / Cathodes 1.321,1 1.303,8 1.105,7 1.390,0 1.324,3 1.133,7 1.268,3 1.365,9 1.487,1 1.484,2
raF / Fire refined 149,9 132,2 128,1 119,3 150,1 137,4 117,8 93,6 85,4 91,0
blíster / blister 22,5 18,1 29,2 75,5 75,9 147,3 213,5 140,0 108,1 125,4
GrAneles / bulk 161,3 99,1 136,6 259,1 250,5 260,0 235,7 118,1 161,7 133,4 Concentrados / Concentrates 161,3 99,1 136,6 259,1 250,5 260,0 235,7 118,1 161,7 133,4
A2. otrAs eMPresAs MinerAs / other Mining companies 2.979,6 2.941,7 3.282,2 3.637,1 3.528,9 3.549,4 3.832,0 3.679,9 3.573,9 3.603,9
reFinAdos / refined 1.224,8 1.331,2 1.379,6 1.443,1 1.323,4 1.333,2 1.522,5 1.522,3 1.606,9 1.584,9 Wirebars / Wirebars - - - - - - - - - -
Cátodos / Cathodes 1.224,8 1.329,2 1.379,3 1.441,1 1.320,5 1.333,1 1.522,4 1.522,1 1.605,8 1.584,8
raF / Fire refined - 2,0 0,3 2,0 2,9 0,1 0,1 0,2 1,1 0,1
refinado Mantos blancos / Mantos blancos refined - - - - - - - - - -
blíster / blister 132,4 159,1 241,7 287,5 267,3 306,2 288,3 263,7 284,9 290,6
GrAneles / bulk 1.622,4 1.451,4 1.660,9 1.906,5 1.938,2 1.910,0 2.021,2 1.893,9 1.682,1 1.728,4 Cementos / Cements - - - 0,6 - 0,9 - - - -
Concentrados / Concentrates 1.622,4 1.451,4 1.660,9 1.905,9 1.938,2 1.909,1 2.021,2 1.893,9 1.682,1 1.728,4
A3. trAnsForMAdores / semi Manufacturers 0,6 (a) 0,7 1,5 1,5 1,5 1,1 1,4 0,0 0,0 Formas especiales / Semis 0,6 (a) 0,7 1,5 1,5 1,5 1,1 1,4 0,0 0,0
A4. eXPortAd. de cHAtArrA / scrap exporters 6,2 5,3 5,0 3,1 5,8 4,7 5,0 6,4 4,4 4,2 blíster / blister - 5,1 5,0 3,1 4,1 3,6 3,7 4,0 3,0 2,5
Chatarra / Scrap 6,2 0,2 - - 1,7 1,1 1,3 2,4 1,4 1,7
A5. coProductores(1) / co-producers 8,3 2,0 0,0 0,0 0,0 0,0 0,0 0,0 0,0 0,0 Conc. oro (Cu cont.) / Gold concentrates (Cu cont.) (2) 8,3 2,0 - - - - - - - -
Cátodos / Cathodes (3) - - - - - - - - - -
Concentrados / Concentrates (3) - - - - - - - - - -
(1) embarques de exportación de la Cía. Minera el indio. / el indio Mining Co. (2) Corresponde a cobre contenido en concentrados de oro. / Copper contained in gold concentrates. (3) Corresponde a concentrados de cobre y cobre refinado procesados en Chile. / Copper concentrates and refined copper processed in Chile.(a) Cifra inferior a 50 tM / Under 50 Mt. Fuente / Source: Comisión Chilena del Cobre / Chilean Copper Commission.
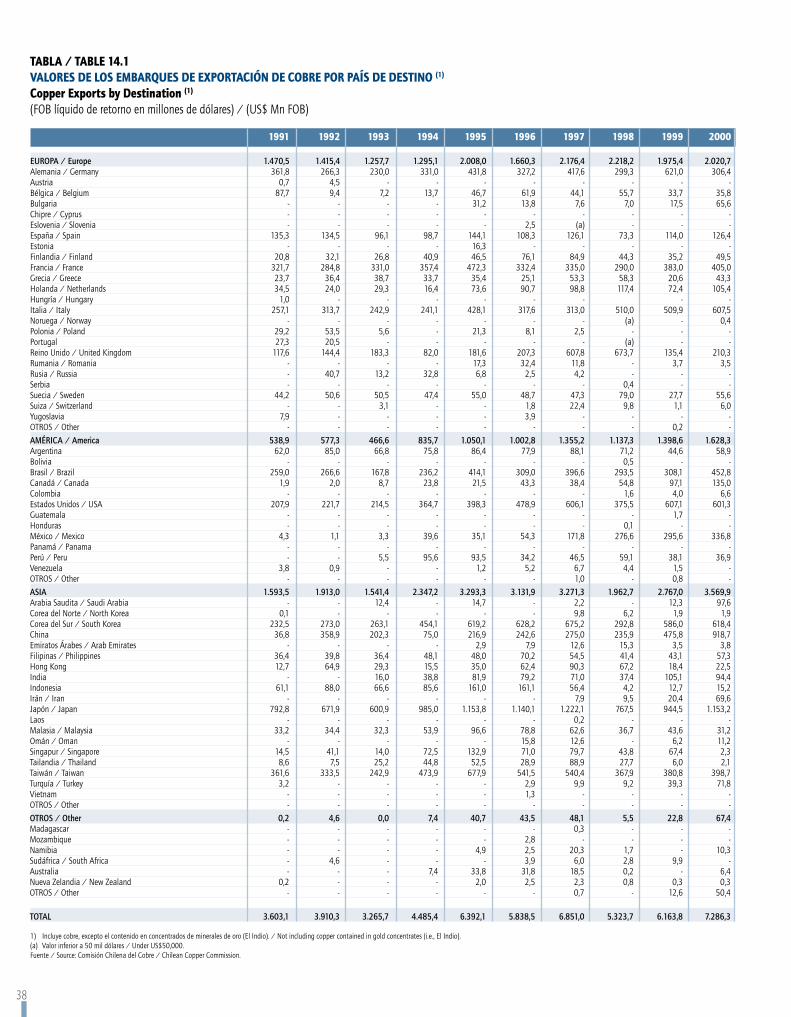
38
TABLA / TABLE 14.1 VALORES DE LOS EMBARQUES DE EXPORTACIÓN DE COBRE POR PAÍS DE DESTINO (1) Copper Exports by Destination (1)
(Fob líquido de retorno en millones de dólares) / (US$ Mn Fob)
1991 1992 1993 1994 1995 1996 1997 1998 1999 2000
euroPA / europe 1.470,5 1.415,4 1.257,7 1.295,1 2.008,0 1.660,3 2.176,4 2.218,2 1.975,4 2.020,7 alemania / Germany 361,8 266,3 230,0 331,0 431,8 327,2 417,6 299,3 621,0 306,4austria 0,7 4,5 - - - - - - - -bélgica / belgium 87,7 9,4 7,2 13,7 46,7 61,9 44,1 55,7 33,7 35,8bulgaria - - - - 31,2 13,8 7,6 7,0 17,5 65,6Chipre / Cyprus - - - - - - - - - -eslovenia / Slovenia - - - - - 2,5 (a) - - -españa / Spain 135,3 134,5 96,1 98,7 144,1 108,3 126,1 73,3 114,0 126,4estonia - - - - 16,3 - - - - -Finlandia / Finland 20,8 32,1 26,8 40,9 46,5 76,1 84,9 44,3 35,2 49,5Francia / France 321,7 284,8 331,0 357,4 472,3 332,4 335,0 290,0 383,0 405,0Grecia / Greece 23,7 36,4 38,7 33,7 35,4 25,1 53,3 58,3 20,6 43,3holanda / netherlands 34,5 24,0 29,3 16,4 73,6 90,7 98,8 117,4 72,4 105,4hungría / hungary 1,0 - - - - - - - -italia / italy 257,1 313,7 242,9 241,1 428,1 317,6 313,0 510,0 509,9 607,5noruega / norway - - - - - - - (a) - 0,4polonia / poland 29,2 53,5 5,6 - 21,3 8,1 2,5 - - -portugal 27,3 20,5 - - - - - (a) - -reino Unido / United kingdom 117,6 144,4 183,3 82,0 181,6 207,3 607,8 673,7 135,4 210,3rumania / romania - - - - 17,3 32,4 11,8 - 3,7 3,5rusia / russia - 40,7 13,2 32,8 6,8 2,5 4,2 - - -Serbia - - - - - - - 0,4 - -Suecia / Sweden 44,2 50,6 50,5 47,4 55,0 48,7 47,3 79,0 27,7 55,6Suiza / Switzerland - - 3,1 - - 1,8 22,4 9,8 1,1 6,0Yugoslavia 7,9 - - - - 3,9 - - - -otroS / other - - - - - - - - 0,2 -
AMÉricA / America 538,9 577,3 466,6 835,7 1.050,1 1.002,8 1.355,2 1.137,3 1.398,6 1.628,3 argentina 62,0 85,0 66,8 75,8 86,4 77,9 88,1 71,2 44,6 58,9bolivia - - - - - - - 0,5 - -brasil / brazil 259,0 266,6 167,8 236,2 414,1 309,0 396,6 293,5 308,1 452,8Canadá / Canada 1,9 2,0 8,7 23,8 21,5 43,3 38,4 54,8 97,1 135,0Colombia - - - - - - - 1,6 4,0 6,6estados Unidos / USa 207,9 221,7 214,5 364,7 398,3 478,9 606,1 375,5 607,1 601,3Guatemala - - - - - - - - 1,7 -honduras - - - - - - - 0,1 - -México / Mexico 4,3 1,1 3,3 39,6 35,1 54,3 171,8 276,6 295,6 336,8panamá / panama - - - - - - - - - -perú / peru - - 5,5 95,6 93,5 34,2 46,5 59,1 38,1 36,9Venezuela 3,8 0,9 - - 1,2 5,2 6,7 4,4 1,5 -otroS / other - - - - - - 1,0 - 0,8 -
AsiA 1.593,5 1.913,0 1.541,4 2.347,2 3.293,3 3.131,9 3.271,3 1.962,7 2.767,0 3.569,9 arabia Saudita / Saudi arabia - - 12,4 - 14,7 - 2,2 - 12,3 97,6Corea del norte / north korea 0,1 - - - - - 9,8 6,2 1,9 1,9Corea del Sur / South korea 232,5 273,0 263,1 454,1 619,2 628,2 675,2 292,8 586,0 618,4China 36,8 358,9 202,3 75,0 216,9 242,6 275,0 235,9 475,8 918,7emiratos Árabes / arab emirates - - - - 2,9 7,9 12,6 15,3 3,5 3,8Filipinas / philippines 36,4 39,8 36,4 48,1 48,0 70,2 54,5 41,4 43,1 57,3hong kong 12,7 64,9 29,3 15,5 35,0 62,4 90,3 67,2 18,4 22,5india - - 16,0 38,8 81,9 79,2 71,0 37,4 105,1 94,4indonesia 61,1 88,0 66,6 85,6 161,0 161,1 56,4 4,2 12,7 15,2irán / iran - - - - - - 7,9 9,5 20,4 69,6Japón / Japan 792,8 671,9 600,9 985,0 1.153,8 1.140,1 1.222,1 767,5 944,5 1.153,2laos - - - - - - 0,2 - - -Malasia / Malaysia 33,2 34,4 32,3 53,9 96,6 78,8 62,6 36,7 43,6 31,2omán / oman - - - - - 15,8 12,6 - 6,2 11,2Singapur / Singapore 14,5 41,1 14,0 72,5 132,9 71,0 79,7 43,8 67,4 2,3tailandia / thailand 8,6 7,5 25,2 44,8 52,5 28,9 88,9 27,7 6,0 2,1taiwán / taiwan 361,6 333,5 242,9 473,9 677,9 541,5 540,4 367,9 380,8 398,7turquía / turkey 3,2 - - - - 2,9 9,9 9,2 39,3 71,8Vietnam - - - - - 1,3 - - - -otroS / other - - - - - - - - - -
otros / other 0,2 4,6 0,0 7,4 40,7 43,5 48,1 5,5 22,8 67,4 Madagascar - - - - - - 0,3 - - -Mozambique - - - - - 2,8 - - - -namibia - - - - 4,9 2,5 20,3 1,7 - 10,3Sudáfrica / South africa - 4,6 - - - 3,9 6,0 2,8 9,9 -australia - - - 7,4 33,8 31,8 18,5 0,2 - 6,4nueva Zelandia / new Zealand 0,2 - - - 2,0 2,5 2,3 0,8 0,3 0,3otroS / other - - - - - - 0,7 - 12,6 50,4
totAl 3.603,1 3.910,3 3.265,7 4.485,4 6.392,1 5.838,5 6.851,0 5.323,7 6.163,8 7.286,3
1) incluye cobre, excepto el contenido en concentrados de minerales de oro (el indio). / not including copper contained in gold concentrates (i.e., el indio). (a) Valor inferior a 50 mil dólares / Under US$50,000. Fuente / Source: Comisión Chilena del Cobre / Chilean Copper Commission.
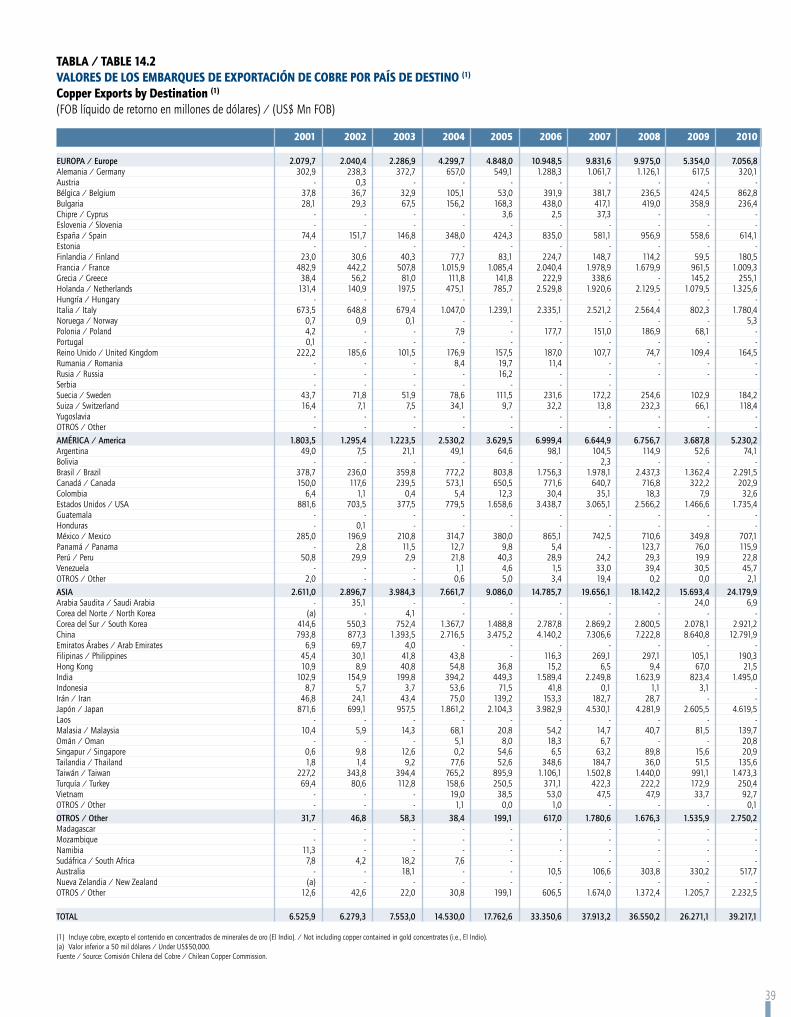
39
TABLA / TABLE 14.2VALORES DE LOS EMBARQUES DE EXPORTACIÓN DE COBRE POR PAÍS DE DESTINO (1)
Copper Exports by Destination (1) (Fob líquido de retorno en millones de dólares) / (US$ Mn Fob)
2001 2002 2003 2004 2005 2006 2007 2008 2009 2010
euroPA / europe 2.079,7 2.040,4 2.286,9 4.299,7 4.848,0 10.948,5 9.831,6 9.975,0 5.354,0 7.056,8 alemania / Germany 302,9 238,3 372,7 657,0 549,1 1.288,3 1.061,7 1.126,1 617,5 320,1austria - 0,3 - - - - - - - -bélgica / belgium 37,8 36,7 32,9 105,1 53,0 391,9 381,7 236,5 424,5 862,8bulgaria 28,1 29,3 67,5 156,2 168,3 438,0 417,1 419,0 358,9 236,4Chipre / Cyprus - - - - 3,6 2,5 37,3 - - -eslovenia / Slovenia - - - - - - - - - -españa / Spain 74,4 151,7 146,8 348,0 424,3 835,0 581,1 956,9 558,6 614,1estonia - - - - - - - - - -Finlandia / Finland 23,0 30,6 40,3 77,7 83,1 224,7 148,7 114,2 59,5 180,5Francia / France 482,9 442,2 507,8 1.015,9 1.085,4 2.040,4 1.978,9 1.679,9 961,5 1.009,3Grecia / Greece 38,4 56,2 81,0 111,8 141,8 222,9 338,6 - 145,2 255,1holanda / netherlands 131,4 140,9 197,5 475,1 785,7 2.529,8 1.920,6 2.129,5 1.079,5 1.325,6hungría / hungary - - - - - - - - - -italia / italy 673,5 648,8 679,4 1.047,0 1.239,1 2.335,1 2.521,2 2.564,4 802,3 1.780,4noruega / norway 0,7 0,9 0,1 - - - - - - 5,3polonia / poland 4,2 - - 7,9 - 177,7 151,0 186,9 68,1 -portugal 0,1 - - - - - - - - -reino Unido / United kingdom 222,2 185,6 101,5 176,9 157,5 187,0 107,7 74,7 109,4 164,5rumania / romania - - - 8,4 19,7 11,4 - - - -rusia / russia - - - - 16,2 - - - - -Serbia - - - - - - - Suecia / Sweden 43,7 71,8 51,9 78,6 111,5 231,6 172,2 254,6 102,9 184,2Suiza / Switzerland 16,4 7,1 7,5 34,1 9,7 32,2 13,8 232,3 66,1 118,4Yugoslavia - - - - - - - - - -otroS / other - - - - - - - - - -
AMÉricA / America 1.803,5 1.295,4 1.223,5 2.530,2 3.629,5 6.999,4 6.644,9 6.756,7 3.687,8 5.230,2 argentina 49,0 7,5 21,1 49,1 64,6 98,1 104,5 114,9 52,6 74,1bolivia - - - - - - 2,3 - - -brasil / brazil 378,7 236,0 359,8 772,2 803,8 1.756,3 1.978,1 2.437,3 1.362,4 2.291,5Canadá / Canada 150,0 117,6 239,5 573,1 650,5 771,6 640,7 716,8 322,2 202,9Colombia 6,4 1,1 0,4 5,4 12,3 30,4 35,1 18,3 7,9 32,6estados Unidos / USa 881,6 703,5 377,5 779,5 1.658,6 3.438,7 3.065,1 2.566,2 1.466,6 1.735,4Guatemala - - - - - - - - - -honduras - 0,1 - - - - - - - -México / Mexico 285,0 196,9 210,8 314,7 380,0 865,1 742,5 710,6 349,8 707,1panamá / panama - 2,8 11,5 12,7 9,8 5,4 - 123,7 76,0 115,9perú / peru 50,8 29,9 2,9 21,8 40,3 28,9 24,2 29,3 19,9 22,8Venezuela - - - 1,1 4,6 1,5 33,0 39,4 30,5 45,7otroS / other 2,0 - - 0,6 5,0 3,4 19,4 0,2 0,0 2,1
AsiA 2.611,0 2.896,7 3.984,3 7.661,7 9.086,0 14.785,7 19.656,1 18.142,2 15.693,4 24.179,9 arabia Saudita / Saudi arabia - 35,1 - - - - - - 24,0 6,9Corea del norte / north korea (a) - 4,1 - - - - - - -Corea del Sur / South korea 414,6 550,3 752,4 1.367,7 1.488,8 2.787,8 2.869,2 2.800,5 2.078,1 2.921,2China 793,8 877,3 1.393,5 2.716,5 3.475,2 4.140,2 7.306,6 7.222,8 8.640,8 12.791,9emiratos Árabes / arab emirates 6,9 69,7 4,0 - - - - - - -Filipinas / philippines 45,4 30,1 41,8 43,8 - 116,3 269,1 297,1 105,1 190,3hong kong 10,9 8,9 40,8 54,8 36,8 15,2 6,5 9,4 67,0 21,5india 102,9 154,9 199,8 394,2 449,3 1.589,4 2.249,8 1.623,9 823,4 1.495,0indonesia 8,7 5,7 3,7 53,6 71,5 41,8 0,1 1,1 3,1 -irán / iran 46,8 24,1 43,4 75,0 139,2 153,3 182,7 28,7 - -Japón / Japan 871,6 699,1 957,5 1.861,2 2.104,3 3.982,9 4.530,1 4.281,9 2.605,5 4.619,5laos - - - - - - - - - -Malasia / Malaysia 10,4 5,9 14,3 68,1 20,8 54,2 14,7 40,7 81,5 139,7omán / oman - - - 5,1 8,0 18,3 6,7 - - 20,8Singapur / Singapore 0,6 9,8 12,6 0,2 54,6 6,5 63,2 89,8 15,6 20,9tailandia / thailand 1,8 1,4 9,2 77,6 52,6 348,6 184,7 36,0 51,5 135,6taiwán / taiwan 227,2 343,8 394,4 765,2 895,9 1.106,1 1.502,8 1.440,0 991,1 1.473,3turquía / turkey 69,4 80,6 112,8 158,6 250,5 371,1 422,3 222,2 172,9 250,4Vietnam - - - 19,0 38,5 53,0 47,5 47,9 33,7 92,7otroS / other - - - 1,1 0,0 1,0 - - - 0,1
otros / other 31,7 46,8 58,3 38,4 199,1 617,0 1.780,6 1.676,3 1.535,9 2.750,2 Madagascar - - - - - - - - - -Mozambique - - - - - - - - - -namibia 11,3 - - - - - - - - -Sudáfrica / South africa 7,8 4,2 18,2 7,6 - - - - - -australia - - 18,1 - - 10,5 106,6 303,8 330,2 517,7nueva Zelandia / new Zealand (a) - - - - - - - - -otroS / other 12,6 42,6 22,0 30,8 199,1 606,5 1.674,0 1.372,4 1.205,7 2.232,5
totAl 6.525,9 6.279,3 7.553,0 14.530,0 17.762,6 33.350,6 37.913,2 36.550,2 26.271,1 39.217,1
(1) incluye cobre, excepto el contenido en concentrados de minerales de oro (el indio). / not including copper contained in gold concentrates (i.e., el indio).(a) Valor inferior a 50 mil dólares / Under US$50,000.Fuente / Source: Comisión Chilena del Cobre / Chilean Copper Commission.
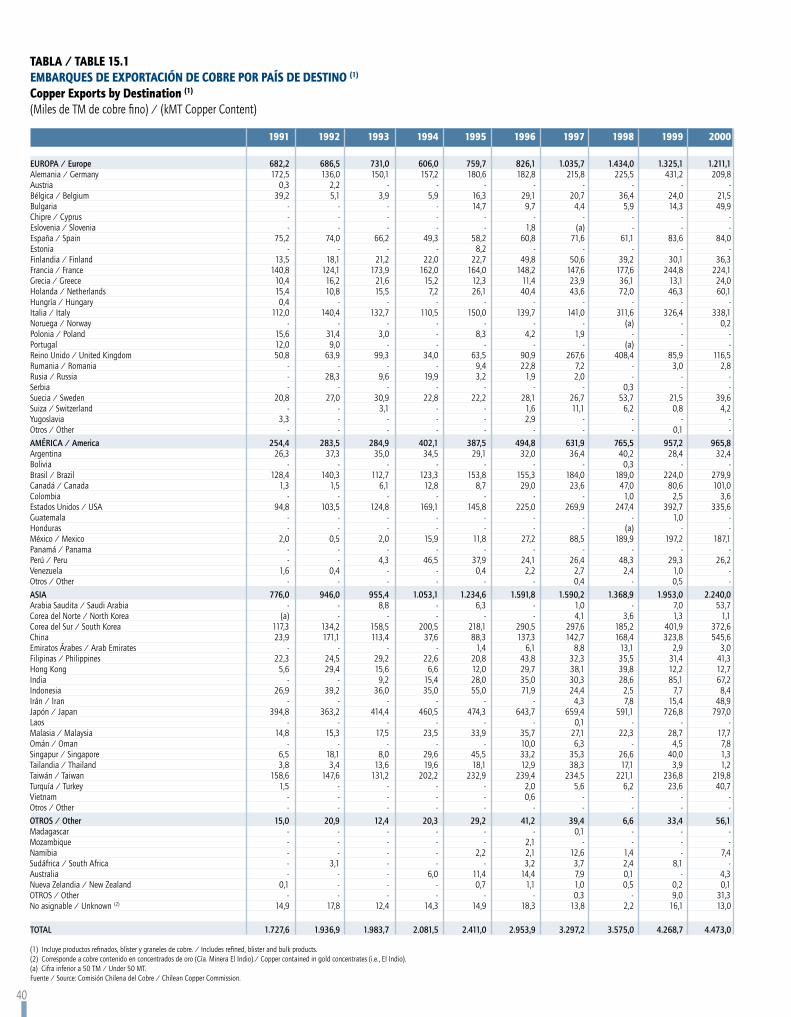
40
TABLA / TABLE 15.1 EMBARQUES DE EXPORTACIÓN DE COBRE POR PAÍS DE DESTINO (1) Copper Exports by Destination (1) (Miles de tM de cobre fino) / (kMt Copper Content)
1991 1992 1993 1994 1995 1996 1997 1998 1999 2000
euroPA / europe 682,2 686,5 731,0 606,0 759,7 826,1 1.035,7 1.434,0 1.325,1 1.211,1 alemania / Germany 172,5 136,0 150,1 157,2 180,6 182,8 215,8 225,5 431,2 209,8austria 0,3 2,2 - - - - - - - -bélgica / belgium 39,2 5,1 3,9 5,9 16,3 29,1 20,7 36,4 24,0 21,5bulgaria - - - - 14,7 9,7 4,4 5,9 14,3 49,9Chipre / Cyprus - - - - - - - - - -eslovenia / Slovenia - - - - - 1,8 (a) - - -españa / Spain 75,2 74,0 66,2 49,3 58,2 60,8 71,6 61,1 83,6 84,0estonia - - - - 8,2 - - - - -Finlandia / Finland 13,5 18,1 21,2 22,0 22,7 49,8 50,6 39,2 30,1 36,3Francia / France 140,8 124,1 173,9 162,0 164,0 148,2 147,6 177,6 244,8 224,1Grecia / Greece 10,4 16,2 21,6 15,2 12,3 11,4 23,9 36,1 13,1 24,0holanda / netherlands 15,4 10,8 15,5 7,2 26,1 40,4 43,6 72,0 46,3 60,1hungría / hungary 0,4 - - - - - - - - -italia / italy 112,0 140,4 132,7 110,5 150,0 139,7 141,0 311,6 326,4 338,1noruega / norway - - - - - - - (a) - 0,2polonia / poland 15,6 31,4 3,0 - 8,3 4,2 1,9 - - -portugal 12,0 9,0 - - - - - (a) - -reino Unido / United kingdom 50,8 63,9 99,3 34,0 63,5 90,9 267,6 408,4 85,9 116,5rumania / romania - - - - 9,4 22,8 7,2 - 3,0 2,8rusia / russia - 28,3 9,6 19,9 3,2 1,9 2,0 - - -Serbia - - - - - - - 0,3 - -Suecia / Sweden 20,8 27,0 30,9 22,8 22,2 28,1 26,7 53,7 21,5 39,6Suiza / Switzerland - - 3,1 - - 1,6 11,1 6,2 0,8 4,2Yugoslavia 3,3 - - - - 2,9 - - - -otros / other - - - - - - - - 0,1 -
AMÉricA / America 254,4 283,5 284,9 402,1 387,5 494,8 631,9 765,5 957,2 965,8 argentina 26,3 37,3 35,0 34,5 29,1 32,0 36,4 40,2 28,4 32,4bolivia - - - - - - - 0,3 - -brasil / brazil 128,4 140,3 112,7 123,3 153,8 155,3 184,0 189,0 224,0 279,9Canadá / Canada 1,3 1,5 6,1 12,8 8,7 29,0 23,6 47,0 80,6 101,0Colombia - - - - - - - 1,0 2,5 3,6estados Unidos / USa 94,8 103,5 124,8 169,1 145,8 225,0 269,9 247,4 392,7 335,6Guatemala - - - - - - - - 1,0 -honduras - - - - - - - (a) - -México / Mexico 2,0 0,5 2,0 15,9 11,8 27,2 88,5 189,9 197,2 187,1panamá / panama - - - - - - - - - -perú / peru - - 4,3 46,5 37,9 24,1 26,4 48,3 29,3 26,2Venezuela 1,6 0,4 - - 0,4 2,2 2,7 2,4 1,0 -otros / other - - - - - - 0,4 - 0,5 -
AsiA 776,0 946,0 955,4 1.053,1 1.234,6 1.591,8 1.590,2 1.368,9 1.953,0 2.240,0 arabia Saudita / Saudi arabia - - 8,8 - 6,3 - 1,0 - 7,0 53,7Corea del norte / north korea (a) - - - - - 4,1 3,6 1,3 1,1Corea del Sur / South korea 117,3 134,2 158,5 200,5 218,1 290,5 297,6 185,2 401,9 372,6China 23,9 171,1 113,4 37,6 88,3 137,3 142,7 168,4 323,8 545,6emiratos Árabes / arab emirates - - - - 1,4 6,1 8,8 13,1 2,9 3,0Filipinas / philippines 22,3 24,5 29,2 22,6 20,8 43,8 32,3 35,5 31,4 41,3hong kong 5,6 29,4 15,6 6,6 12,0 29,7 38,1 39,8 12,2 12,7india - - 9,2 15,4 28,0 35,0 30,3 28,6 85,1 67,2indonesia 26,9 39,2 36,0 35,0 55,0 71,9 24,4 2,5 7,7 8,4irán / iran - - - - - - 4,3 7,8 15,4 48,9Japón / Japan 394,8 363,2 414,4 460,5 474,3 643,7 659,4 591,1 726,8 797,0laos - - - - - - 0,1 - - -Malasia / Malaysia 14,8 15,3 17,5 23,5 33,9 35,7 27,1 22,3 28,7 17,7omán / oman - - - - - 10,0 6,3 - 4,5 7,8Singapur / Singapore 6,5 18,1 8,0 29,6 45,5 33,2 35,3 26,6 40,0 1,3tailandia / thailand 3,8 3,4 13,6 19,6 18,1 12,9 38,3 17,1 3,9 1,2taiwán / taiwan 158,6 147,6 131,2 202,2 232,9 239,4 234,5 221,1 236,8 219,8turquía / turkey 1,5 - - - - 2,0 5,6 6,2 23,6 40,7Vietnam - - - - - 0,6 - - - -otros / other - - - - - - - - - -
otros / other 15,0 20,9 12,4 20,3 29,2 41,2 39,4 6,6 33,4 56,1 Madagascar - - - - - - 0,1 - - -Mozambique - - - - - 2,1 - - - -namibia - - - - 2,2 2,1 12,6 1,4 - 7,4Sudáfrica / South africa - 3,1 - - - 3,2 3,7 2,4 8,1 -australia - - - 6,0 11,4 14,4 7,9 0,1 - 4,3nueva Zelandia / new Zealand 0,1 - - - 0,7 1,1 1,0 0,5 0,2 0,1otroS / other - - - - - - 0,3 - 9,0 31,3no asignable / Unknown (2) 14,9 17,8 12,4 14,3 14,9 18,3 13,8 2,2 16,1 13,0
totAl 1.727,6 1.936,9 1.983,7 2.081,5 2.411,0 2.953,9 3.297,2 3.575,0 4.268,7 4.473,0
(1) incluye productos refinados, blíster y graneles de cobre. / includes refined, blister and bulk products. (2) Corresponde a cobre contenido en concentrados de oro (Cía. Minera el indio)./ Copper contained in gold concentrates (i.e., el indio). (a) Cifra inferior a 50 tM / Under 50 Mt. Fuente / Source: Comisión Chilena del Cobre / Chilean Copper Commission.
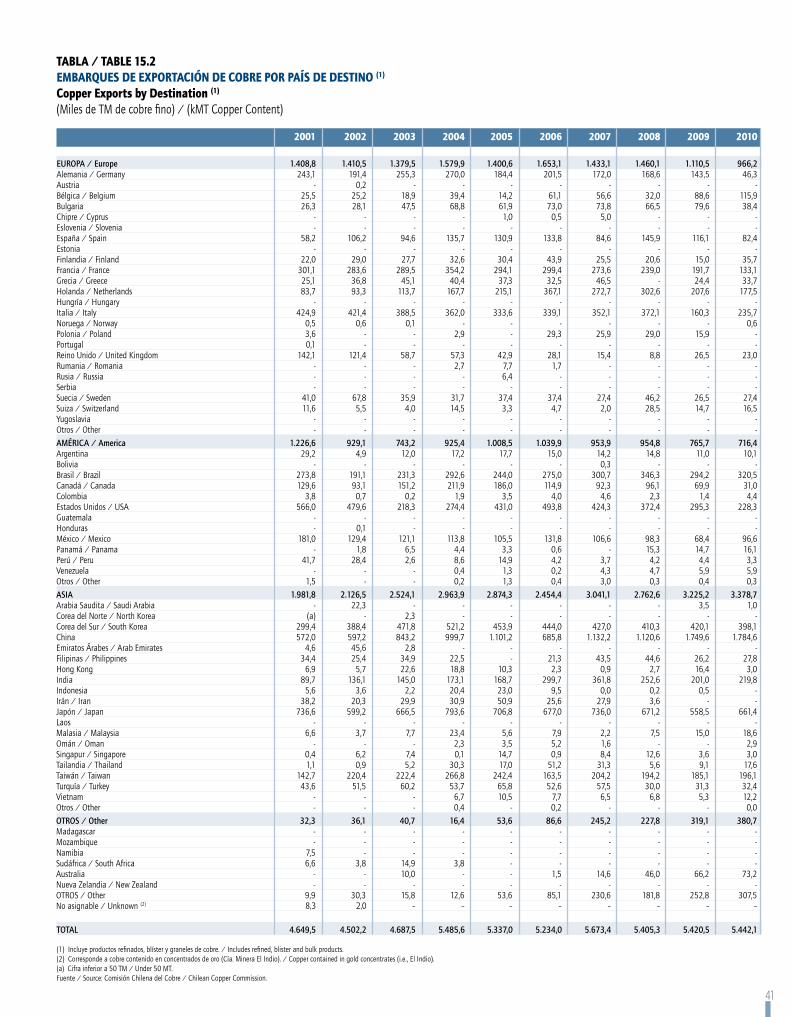
41
TABLA / TABLE 15.2EMBARQUES DE EXPORTACIÓN DE COBRE POR PAÍS DE DESTINO (1) Copper Exports by Destination (1) (Miles de tM de cobre fino) / (kMt Copper Content)
2001 2002 2003 2004 2005 2006 2007 2008 2009 2010
euroPA / europe 1.408,8 1.410,5 1.379,5 1.579,9 1.400,6 1.653,1 1.433,1 1.460,1 1.110,5 966,2 alemania / Germany 243,1 191,4 255,3 270,0 184,4 201,5 172,0 168,6 143,5 46,3austria - 0,2 - - - - - - - -bélgica / belgium 25,5 25,2 18,9 39,4 14,2 61,1 56,6 32,0 88,6 115,9bulgaria 26,3 28,1 47,5 68,8 61,9 73,0 73,8 66,5 79,6 38,4Chipre / Cyprus - - - - 1,0 0,5 5,0 - - -eslovenia / Slovenia - - - - - - - - - -españa / Spain 58,2 106,2 94,6 135,7 130,9 133,8 84,6 145,9 116,1 82,4estonia - - - - - - - - - -Finlandia / Finland 22,0 29,0 27,7 32,6 30,4 43,9 25,5 20,6 15,0 35,7Francia / France 301,1 283,6 289,5 354,2 294,1 299,4 273,6 239,0 191,7 133,1Grecia / Greece 25,1 36,8 45,1 40,4 37,3 32,5 46,5 - 24,4 33,7holanda / netherlands 83,7 93,3 113,7 167,7 215,1 367,1 272,7 302,6 207,6 177,5hungría / hungary - - - - - - - - - -italia / italy 424,9 421,4 388,5 362,0 333,6 339,1 352,1 372,1 160,3 235,7noruega / norway 0,5 0,6 0,1 - - - - - - 0,6polonia / poland 3,6 - - 2,9 - 29,3 25,9 29,0 15,9 -portugal 0,1 - - - - - - - - -reino Unido / United kingdom 142,1 121,4 58,7 57,3 42,9 28,1 15,4 8,8 26,5 23,0rumania / romania - - - 2,7 7,7 1,7 - - - -rusia / russia - - - - 6,4 - - - - -Serbia - - - - - - - - - -Suecia / Sweden 41,0 67,8 35,9 31,7 37,4 37,4 27,4 46,2 26,5 27,4Suiza / Switzerland 11,6 5,5 4,0 14,5 3,3 4,7 2,0 28,5 14,7 16,5Yugoslavia - - - - - - - - - -otros / other - - - - - - - - - -
AMÉricA / America 1.226,6 929,1 743,2 925,4 1.008,5 1.039,9 953,9 954,8 765,7 716,4 argentina 29,2 4,9 12,0 17,2 17,7 15,0 14,2 14,8 11,0 10,1bolivia - - - - - - 0,3 - - -brasil / brazil 273,8 191,1 231,3 292,6 244,0 275,0 300,7 346,3 294,2 320,5Canadá / Canada 129,6 93,1 151,2 211,9 186,0 114,9 92,3 96,1 69,9 31,0Colombia 3,8 0,7 0,2 1,9 3,5 4,0 4,6 2,3 1,4 4,4estados Unidos / USa 566,0 479,6 218,3 274,4 431,0 493,8 424,3 372,4 295,3 228,3Guatemala - - - - - - - - - -honduras - 0,1 - - - - - - - -México / Mexico 181,0 129,4 121,1 113,8 105,5 131,8 106,6 98,3 68,4 96,6panamá / panama - 1,8 6,5 4,4 3,3 0,6 - 15,3 14,7 16,1perú / peru 41,7 28,4 2,6 8,6 14,9 4,2 3,7 4,2 4,4 3,3Venezuela - - - 0,4 1,3 0,2 4,3 4,7 5,9 5,9otros / other 1,5 - - 0,2 1,3 0,4 3,0 0,3 0,4 0,3
AsiA 1.981,8 2.126,5 2.524,1 2.963,9 2.874,3 2.454,4 3.041,1 2.762,6 3.225,2 3.378,7 arabia Saudita / Saudi arabia - 22,3 - - - - - - 3,5 1,0Corea del norte / north korea (a) - 2,3 - - - - - - -Corea del Sur / South korea 299,4 388,4 471,8 521,2 453,9 444,0 427,0 410,3 420,1 398,1China 572,0 597,2 843,2 999,7 1.101,2 685,8 1.132,2 1.120,6 1.749,6 1.784,6emiratos Árabes / arab emirates 4,6 45,6 2,8 - - - - - - -Filipinas / philippines 34,4 25,4 34,9 22,5 - 21,3 43,5 44,6 26,2 27,8hong kong 6,9 5,7 22,6 18,8 10,3 2,3 0,9 2,7 16,4 3,0india 89,7 136,1 145,0 173,1 168,7 299,7 361,8 252,6 201,0 219,8indonesia 5,6 3,6 2,2 20,4 23,0 9,5 0,0 0,2 0,5 -irán / iran 38,2 20,3 29,9 30,9 50,9 25,6 27,9 3,6 - -Japón / Japan 736,6 599,2 666,5 793,6 706,8 677,0 736,0 671,2 558,5 661,4laos - - - - - - - - - -Malasia / Malaysia 6,6 3,7 7,7 23,4 5,6 7,9 2,2 7,5 15,0 18,6omán / oman - - - 2,3 3,5 5,2 1,6 - - 2,9Singapur / Singapore 0,4 6,2 7,4 0,1 14,7 0,9 8,4 12,6 3,6 3,0tailandia / thailand 1,1 0,9 5,2 30,3 17,0 51,2 31,3 5,6 9,1 17,6taiwán / taiwan 142,7 220,4 222,4 266,8 242,4 163,5 204,2 194,2 185,1 196,1turquía / turkey 43,6 51,5 60,2 53,7 65,8 52,6 57,5 30,0 31,3 32,4Vietnam - - - 6,7 10,5 7,7 6,5 6,8 5,3 12,2otros / other - - - 0,4 - 0,2 - - - 0,0
otros / other 32,3 36,1 40,7 16,4 53,6 86,6 245,2 227,8 319,1 380,7 Madagascar - - - - - - - - - -Mozambique - - - - - - - - - -namibia 7,5 - - - - - - - - -Sudáfrica / South africa 6,6 3,8 14,9 3,8 - - - - - -australia - - 10,0 - - 1,5 14,6 46,0 66,2 73,2nueva Zelandia / new Zealand - - - - - - - - - -otroS / other 9,9 30,3 15,8 12,6 53,6 85,1 230,6 181,8 252,8 307,5no asignable / Unknown (2) 8,3 2,0 - - - - - - - -
totAl 4.649,5 4.502,2 4.687,5 5.485,6 5.337,0 5.234,0 5.673,4 5.405,3 5.420,5 5.442,1
(1) incluye productos refinados, blíster y graneles de cobre. / includes refined, blister and bulk products. (2) Corresponde a cobre contenido en concentrados de oro (Cía. Minera el indio). / Copper contained in gold concentrates (i.e., el indio). (a) Cifra inferior a 50 tM / Under 50 Mt. Fuente / Source: Comisión Chilena del Cobre / Chilean Copper Commission.
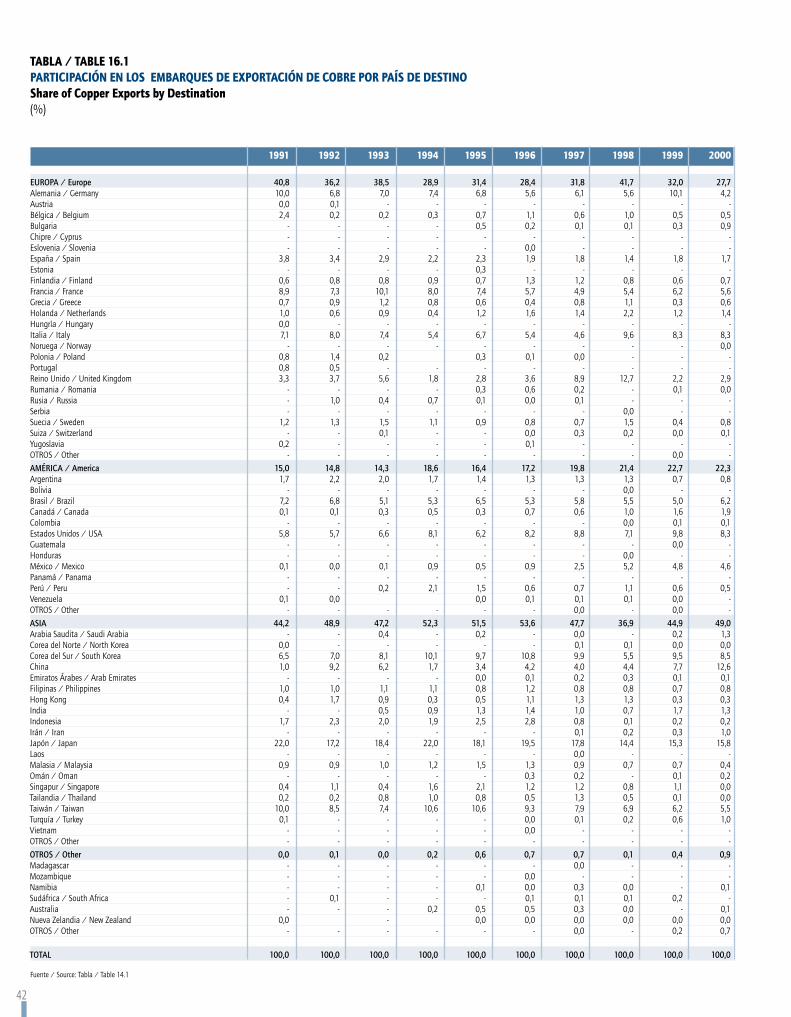
42
TABLA / TABLE 16.1PARTICIPACIÓN EN LOS EMBARQUES DE EXPORTACIÓN DE COBRE POR PAÍS DE DESTINO Share of Copper Exports by Destination(%)
1991 1992 1993 1994 1995 1996 1997 1998 1999 2000
euroPA / europe 40,8 36,2 38,5 28,9 31,4 28,4 31,8 41,7 32,0 27,7 alemania / Germany 10,0 6,8 7,0 7,4 6,8 5,6 6,1 5,6 10,1 4,2austria 0,0 0,1 - - - - - - - -bélgica / belgium 2,4 0,2 0,2 0,3 0,7 1,1 0,6 1,0 0,5 0,5bulgaria - - - - 0,5 0,2 0,1 0,1 0,3 0,9Chipre / Cyprus - - - - - - - - - -eslovenia / Slovenia - - - - - 0,0 - - - -españa / Spain 3,8 3,4 2,9 2,2 2,3 1,9 1,8 1,4 1,8 1,7estonia - - - - 0,3 - - - - -Finlandia / Finland 0,6 0,8 0,8 0,9 0,7 1,3 1,2 0,8 0,6 0,7Francia / France 8,9 7,3 10,1 8,0 7,4 5,7 4,9 5,4 6,2 5,6Grecia / Greece 0,7 0,9 1,2 0,8 0,6 0,4 0,8 1,1 0,3 0,6holanda / netherlands 1,0 0,6 0,9 0,4 1,2 1,6 1,4 2,2 1,2 1,4hungría / hungary 0,0 - - - - - - - - -italia / italy 7,1 8,0 7,4 5,4 6,7 5,4 4,6 9,6 8,3 8,3noruega / norway - - - - - - - - - 0,0polonia / poland 0,8 1,4 0,2 0,3 0,1 0,0 - - -portugal 0,8 0,5 - - - - - - - -reino Unido / United kingdom 3,3 3,7 5,6 1,8 2,8 3,6 8,9 12,7 2,2 2,9rumania / romania - - - - 0,3 0,6 0,2 - 0,1 0,0rusia / russia - 1,0 0,4 0,7 0,1 0,0 0,1 - - -Serbia - - - - - - - 0,0 - -Suecia / Sweden 1,2 1,3 1,5 1,1 0,9 0,8 0,7 1,5 0,4 0,8Suiza / Switzerland - - 0,1 - - 0,0 0,3 0,2 0,0 0,1Yugoslavia 0,2 - - - - 0,1 - - - -otroS / other - - - - - - - - 0,0 -
AMÉricA / America 15,0 14,8 14,3 18,6 16,4 17,2 19,8 21,4 22,7 22,3 argentina 1,7 2,2 2,0 1,7 1,4 1,3 1,3 1,3 0,7 0,8bolivia - - - - - - - 0,0 - -brasil / brazil 7,2 6,8 5,1 5,3 6,5 5,3 5,8 5,5 5,0 6,2Canadá / Canada 0,1 0,1 0,3 0,5 0,3 0,7 0,6 1,0 1,6 1,9Colombia - - - - - - - 0,0 0,1 0,1estados Unidos / USa 5,8 5,7 6,6 8,1 6,2 8,2 8,8 7,1 9,8 8,3Guatemala - - - - - - - - 0,0 -honduras - - - - - - - 0,0 - -México / Mexico 0,1 0,0 0,1 0,9 0,5 0,9 2,5 5,2 4,8 4,6panamá / panama - - - - - - - - - -perú / peru - - 0,2 2,1 1,5 0,6 0,7 1,1 0,6 0,5Venezuela 0,1 0,0 0,0 0,1 0,1 0,1 0,0 -otroS / other - - - - - - 0,0 - 0,0 -
AsiA 44,2 48,9 47,2 52,3 51,5 53,6 47,7 36,9 44,9 49,0 arabia Saudita / Saudi arabia - - 0,4 - 0,2 - 0,0 - 0,2 1,3Corea del norte / north korea 0,0 - - - - - 0,1 0,1 0,0 0,0Corea del Sur / South korea 6,5 7,0 8,1 10,1 9,7 10,8 9,9 5,5 9,5 8,5China 1,0 9,2 6,2 1,7 3,4 4,2 4,0 4,4 7,7 12,6emiratos Árabes / arab emirates - - - - 0,0 0,1 0,2 0,3 0,1 0,1Filipinas / philippines 1,0 1,0 1,1 1,1 0,8 1,2 0,8 0,8 0,7 0,8hong kong 0,4 1,7 0,9 0,3 0,5 1,1 1,3 1,3 0,3 0,3india - - 0,5 0,9 1,3 1,4 1,0 0,7 1,7 1,3indonesia 1,7 2,3 2,0 1,9 2,5 2,8 0,8 0,1 0,2 0,2irán / iran - - - - - - 0,1 0,2 0,3 1,0Japón / Japan 22,0 17,2 18,4 22,0 18,1 19,5 17,8 14,4 15,3 15,8laos - - - - - - 0,0 - - -Malasia / Malaysia 0,9 0,9 1,0 1,2 1,5 1,3 0,9 0,7 0,7 0,4omán / oman - - - - - 0,3 0,2 - 0,1 0,2Singapur / Singapore 0,4 1,1 0,4 1,6 2,1 1,2 1,2 0,8 1,1 0,0tailandia / thailand 0,2 0,2 0,8 1,0 0,8 0,5 1,3 0,5 0,1 0,0taiwán / taiwan 10,0 8,5 7,4 10,6 10,6 9,3 7,9 6,9 6,2 5,5turquía / turkey 0,1 - - - - 0,0 0,1 0,2 0,6 1,0Vietnam - - - - - 0,0 - - - -otroS / other - - - - - - - - - -
otros / other 0,0 0,1 0,0 0,2 0,6 0,7 0,7 0,1 0,4 0,9 Madagascar - - - - - - 0,0 - - -Mozambique - - - - - 0,0 - - - -namibia - - - - 0,1 0,0 0,3 0,0 - 0,1Sudáfrica / South africa - 0,1 - - - 0,1 0,1 0,1 0,2 -australia - - - 0,2 0,5 0,5 0,3 0,0 - 0,1nueva Zelandia / new Zealand 0,0 - 0,0 0,0 0,0 0,0 0,0 0,0otroS / other - - - - - - 0,0 - 0,2 0,7
totAl 100,0 100,0 100,0 100,0 100,0 100,0 100,0 100,0 100,0 100,0
Fuente / Source: tabla / table 14.1
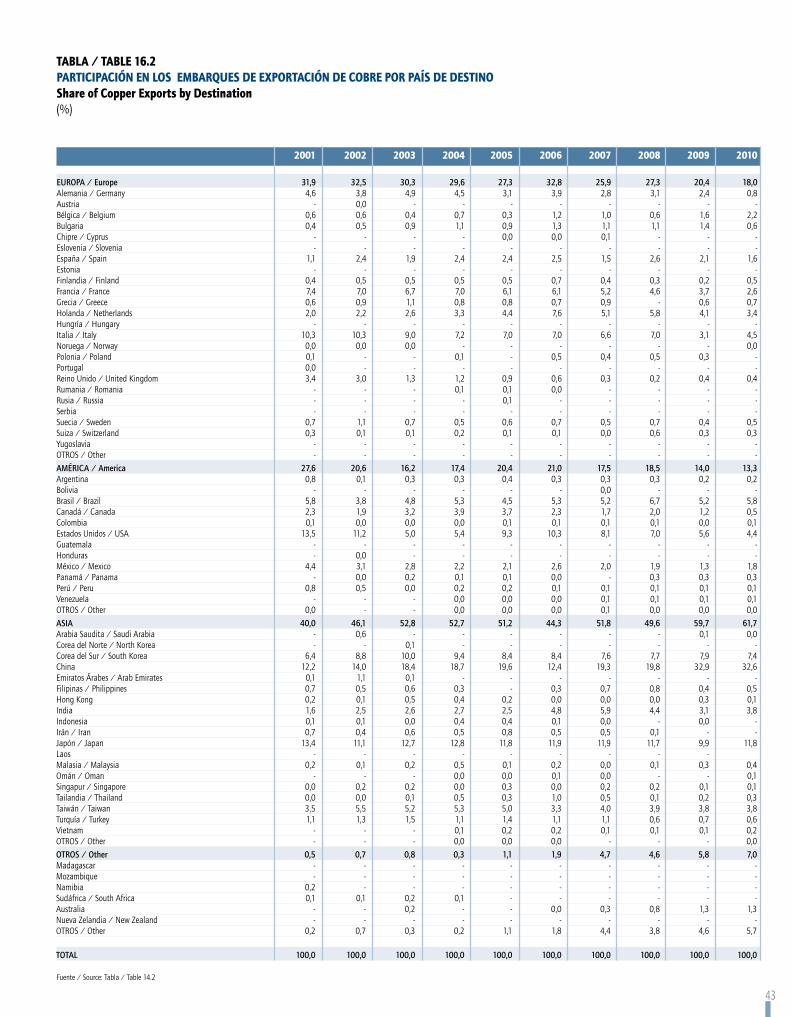
43
TABLA / TABLE 16.2PARTICIPACIÓN EN LOS EMBARQUES DE EXPORTACIÓN DE COBRE POR PAÍS DE DESTINOShare of Copper Exports by Destination(%)
2001 2002 2003 2004 2005 2006 2007 2008 2009 2010
euroPA / europe 31,9 32,5 30,3 29,6 27,3 32,8 25,9 27,3 20,4 18,0 alemania / Germany 4,6 3,8 4,9 4,5 3,1 3,9 2,8 3,1 2,4 0,8austria - 0,0 - - - - - - - -bélgica / belgium 0,6 0,6 0,4 0,7 0,3 1,2 1,0 0,6 1,6 2,2bulgaria 0,4 0,5 0,9 1,1 0,9 1,3 1,1 1,1 1,4 0,6Chipre / Cyprus - - - - 0,0 0,0 0,1 - - -eslovenia / Slovenia - - - - - - - - - -españa / Spain 1,1 2,4 1,9 2,4 2,4 2,5 1,5 2,6 2,1 1,6estonia - - - - - - - - - -Finlandia / Finland 0,4 0,5 0,5 0,5 0,5 0,7 0,4 0,3 0,2 0,5Francia / France 7,4 7,0 6,7 7,0 6,1 6,1 5,2 4,6 3,7 2,6Grecia / Greece 0,6 0,9 1,1 0,8 0,8 0,7 0,9 - 0,6 0,7holanda / netherlands 2,0 2,2 2,6 3,3 4,4 7,6 5,1 5,8 4,1 3,4hungría / hungary - - - - - - - - - -italia / italy 10,3 10,3 9,0 7,2 7,0 7,0 6,6 7,0 3,1 4,5noruega / norway 0,0 0,0 0,0 - - - - - - 0,0polonia / poland 0,1 - - 0,1 - 0,5 0,4 0,5 0,3 -portugal 0,0 - - - - - - - - -reino Unido / United kingdom 3,4 3,0 1,3 1,2 0,9 0,6 0,3 0,2 0,4 0,4rumania / romania - - - 0,1 0,1 0,0 - - - -rusia / russia - - - - 0,1 - - - - -Serbia - - - - - - - - - -Suecia / Sweden 0,7 1,1 0,7 0,5 0,6 0,7 0,5 0,7 0,4 0,5Suiza / Switzerland 0,3 0,1 0,1 0,2 0,1 0,1 0,0 0,6 0,3 0,3Yugoslavia - - - - - - - - - -otroS / other - - - - - - - - - -
AMÉricA / America 27,6 20,6 16,2 17,4 20,4 21,0 17,5 18,5 14,0 13,3 argentina 0,8 0,1 0,3 0,3 0,4 0,3 0,3 0,3 0,2 0,2bolivia - - - - - - 0,0 - - -brasil / brazil 5,8 3,8 4,8 5,3 4,5 5,3 5,2 6,7 5,2 5,8Canadá / Canada 2,3 1,9 3,2 3,9 3,7 2,3 1,7 2,0 1,2 0,5Colombia 0,1 0,0 0,0 0,0 0,1 0,1 0,1 0,1 0,0 0,1estados Unidos / USa 13,5 11,2 5,0 5,4 9,3 10,3 8,1 7,0 5,6 4,4Guatemala - - - - - - - - - -honduras - 0,0 - - - - - - - -México / Mexico 4,4 3,1 2,8 2,2 2,1 2,6 2,0 1,9 1,3 1,8panamá / panama - 0,0 0,2 0,1 0,1 0,0 - 0,3 0,3 0,3perú / peru 0,8 0,5 0,0 0,2 0,2 0,1 0,1 0,1 0,1 0,1Venezuela - - - 0,0 0,0 0,0 0,1 0,1 0,1 0,1otroS / other 0,0 - - 0,0 0,0 0,0 0,1 0,0 0,0 0,0
AsiA 40,0 46,1 52,8 52,7 51,2 44,3 51,8 49,6 59,7 61,7 arabia Saudita / Saudi arabia - 0,6 - - - - - - 0,1 0,0Corea del norte / north korea - - 0,1 - - - - - - -Corea del Sur / South korea 6,4 8,8 10,0 9,4 8,4 8,4 7,6 7,7 7,9 7,4China 12,2 14,0 18,4 18,7 19,6 12,4 19,3 19,8 32,9 32,6emiratos Árabes / arab emirates 0,1 1,1 0,1 - - - - - - -Filipinas / philippines 0,7 0,5 0,6 0,3 - 0,3 0,7 0,8 0,4 0,5hong kong 0,2 0,1 0,5 0,4 0,2 0,0 0,0 0,0 0,3 0,1india 1,6 2,5 2,6 2,7 2,5 4,8 5,9 4,4 3,1 3,8indonesia 0,1 0,1 0,0 0,4 0,4 0,1 0,0 - 0,0 -irán / iran 0,7 0,4 0,6 0,5 0,8 0,5 0,5 0,1 - -Japón / Japan 13,4 11,1 12,7 12,8 11,8 11,9 11,9 11,7 9,9 11,8laos - - - - - - - - - Malasia / Malaysia 0,2 0,1 0,2 0,5 0,1 0,2 0,0 0,1 0,3 0,4omán / oman - - - 0,0 0,0 0,1 0,0 - - 0,1Singapur / Singapore 0,0 0,2 0,2 0,0 0,3 0,0 0,2 0,2 0,1 0,1tailandia / thailand 0,0 0,0 0,1 0,5 0,3 1,0 0,5 0,1 0,2 0,3taiwán / taiwan 3,5 5,5 5,2 5,3 5,0 3,3 4,0 3,9 3,8 3,8turquía / turkey 1,1 1,3 1,5 1,1 1,4 1,1 1,1 0,6 0,7 0,6Vietnam - - - 0,1 0,2 0,2 0,1 0,1 0,1 0,2otroS / other - - - 0,0 0,0 0,0 - - - 0,0
otros / other 0,5 0,7 0,8 0,3 1,1 1,9 4,7 4,6 5,8 7,0 Madagascar - - - - - - - - - -Mozambique - - - - - - - - - -namibia 0,2 - - - - - - - - -Sudáfrica / South africa 0,1 0,1 0,2 0,1 - - - - - -australia - - 0,2 - - 0,0 0,3 0,8 1,3 1,3nueva Zelandia / new Zealand - - - - - - - - - -otroS / other 0,2 0,7 0,3 0,2 1,1 1,8 4,4 3,8 4,6 5,7
totAl 100,0 100,0 100,0 100,0 100,0 100,0 100,0 100,0 100,0 100,0
Fuente / Source: tabla / table 14.2
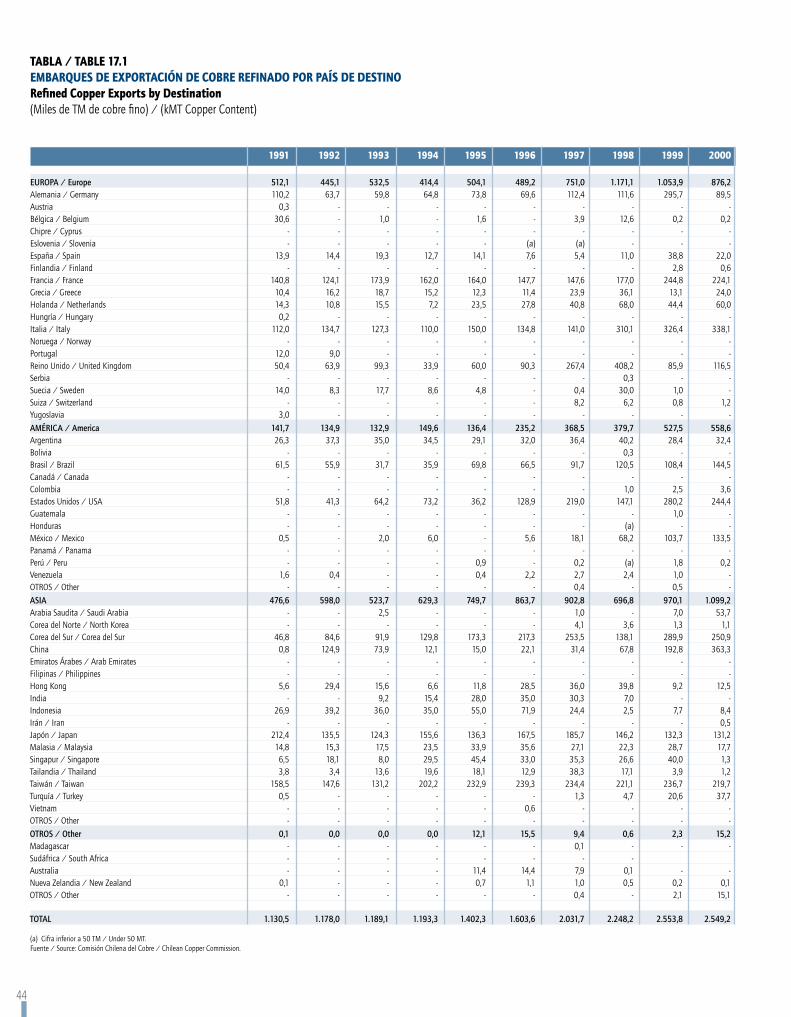
44
TABLA / TABLE 17.1 EMBARQUES DE EXPORTACIÓN DE COBRE REFINADO POR PAÍS DE DESTINORefined Copper Exports by Destination (Miles de tM de cobre fino) / (kMt Copper Content)
1991 1992 1993 1994 1995 1996 1997 1998 1999 2000
euroPA / europe 512,1 445,1 532,5 414,4 504,1 489,2 751,0 1.171,1 1.053,9 876,2 alemania / Germany 110,2 63,7 59,8 64,8 73,8 69,6 112,4 111,6 295,7 89,5austria 0,3 - - - - - - - - -bélgica / belgium 30,6 - 1,0 - 1,6 - 3,9 12,6 0,2 0,2Chipre / Cyprus - - - - - - - - - -eslovenia / Slovenia - - - - - (a) (a) - - -españa / Spain 13,9 14,4 19,3 12,7 14,1 7,6 5,4 11,0 38,8 22,0Finlandia / Finland - - - - - - - - 2,8 0,6Francia / France 140,8 124,1 173,9 162,0 164,0 147,7 147,6 177,0 244,8 224,1Grecia / Greece 10,4 16,2 18,7 15,2 12,3 11,4 23,9 36,1 13,1 24,0holanda / netherlands 14,3 10,8 15,5 7,2 23,5 27,8 40,8 68,0 44,4 60,0hungría / hungary 0,2 - - - - - - - - -italia / italy 112,0 134,7 127,3 110,0 150,0 134,8 141,0 310,1 326,4 338,1noruega / norway - - - - - - - - - -portugal 12,0 9,0 - - - - - - - -reino Unido / United kingdom 50,4 63,9 99,3 33,9 60,0 90,3 267,4 408,2 85,9 116,5Serbia - - - - - - - 0,3 - -Suecia / Sweden 14,0 8,3 17,7 8,6 4,8 - 0,4 30,0 1,0 -Suiza / Switzerland - - - - - - 8,2 6,2 0,8 1,2Yugoslavia 3,0 - - - - - - - - -
AMÉricA / America 141,7 134,9 132,9 149,6 136,4 235,2 368,5 379,7 527,5 558,6 argentina 26,3 37,3 35,0 34,5 29,1 32,0 36,4 40,2 28,4 32,4bolivia - - - - - - - 0,3 - -brasil / brazil 61,5 55,9 31,7 35,9 69,8 66,5 91,7 120,5 108,4 144,5Canadá / Canada - - - - - - - - - -Colombia - - - - - - - 1,0 2,5 3,6estados Unidos / USa 51,8 41,3 64,2 73,2 36,2 128,9 219,0 147,1 280,2 244,4Guatemala - - - - - - - - 1,0 -honduras - - - - - - - (a) - -México / Mexico 0,5 - 2,0 6,0 - 5,6 18,1 68,2 103,7 133,5panamá / panama - - - - - - - - - -perú / peru - - - - 0,9 - 0,2 (a) 1,8 0,2Venezuela 1,6 0,4 - - 0,4 2,2 2,7 2,4 1,0 -otroS / other - - - - - - 0,4 - 0,5 -
AsiA 476,6 598,0 523,7 629,3 749,7 863,7 902,8 696,8 970,1 1.099,2 arabia Saudita / Saudi arabia - - 2,5 - - - 1,0 - 7,0 53,7Corea del norte / north korea - - - - - - 4,1 3,6 1,3 1,1Corea del Sur / Corea del Sur 46,8 84,6 91,9 129,8 173,3 217,3 253,5 138,1 289,9 250,9China 0,8 124,9 73,9 12,1 15,0 22,1 31,4 67,8 192,8 363,3emiratos Árabes / arab emirates - - - - - - - - - -Filipinas / philippines - - - - - - - - - -hong kong 5,6 29,4 15,6 6,6 11,8 28,5 36,0 39,8 9,2 12,5india - - 9,2 15,4 28,0 35,0 30,3 7,0 - -indonesia 26,9 39,2 36,0 35,0 55,0 71,9 24,4 2,5 7,7 8,4irán / iran - - - - - - - - - 0,5Japón / Japan 212,4 135,5 124,3 155,6 136,3 167,5 185,7 146,2 132,3 131,2Malasia / Malaysia 14,8 15,3 17,5 23,5 33,9 35,6 27,1 22,3 28,7 17,7Singapur / Singapore 6,5 18,1 8,0 29,5 45,4 33,0 35,3 26,6 40,0 1,3tailandia / thailand 3,8 3,4 13,6 19,6 18,1 12,9 38,3 17,1 3,9 1,2taiwán / taiwan 158,5 147,6 131,2 202,2 232,9 239,3 234,4 221,1 236,7 219,7turquía / turkey 0,5 - - - - - 1,3 4,7 20,6 37,7Vietnam - - - - - 0,6 - - - -otroS / other - - - - - - - - - -
otros / other 0,1 0,0 0,0 0,0 12,1 15,5 9,4 0,6 2,3 15,2 Madagascar - - - - - - 0,1 - - -Sudáfrica / South africa - - - - - - - - australia - - - - 11,4 14,4 7,9 0,1 - -nueva Zelandia / new Zealand 0,1 - - - 0,7 1,1 1,0 0,5 0,2 0,1otroS / other - - - - - - 0,4 - 2,1 15,1
totAl 1.130,5 1.178,0 1.189,1 1.193,3 1.402,3 1.603,6 2.031,7 2.248,2 2.553,8 2.549,2
(a) Cifra inferior a 50 tM / Under 50 Mt. Fuente / Source: Comisión Chilena del Cobre / Chilean Copper Commission.
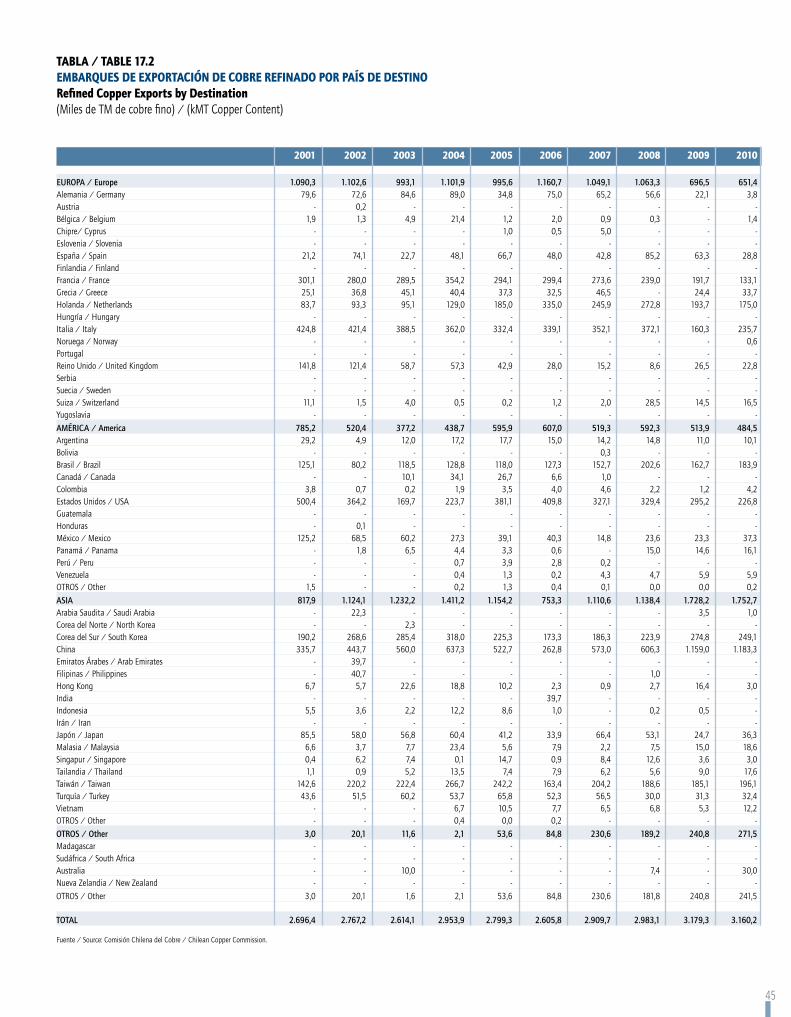
45
TABLA / TABLE 17.2EMBARQUES DE EXPORTACIÓN DE COBRE REFINADO POR PAÍS DE DESTINORefined Copper Exports by Destination(Miles de tM de cobre fino) / (kMt Copper Content)
2001 2002 2003 2004 2005 2006 2007 2008 2009 2010
euroPA / europe 1.090,3 1.102,6 993,1 1.101,9 995,6 1.160,7 1.049,1 1.063,3 696,5 651,4 alemania / Germany 79,6 72,6 84,6 89,0 34,8 75,0 65,2 56,6 22,1 3,8austria - 0,2 - - - - - - - -bélgica / belgium 1,9 1,3 4,9 21,4 1,2 2,0 0,9 0,3 - 1,4Chipre/ Cyprus - - - - 1,0 0,5 5,0 - - -eslovenia / Slovenia - - - - - - - - - -españa / Spain 21,2 74,1 22,7 48,1 66,7 48,0 42,8 85,2 63,3 28,8Finlandia / Finland - - - - - - - - - -Francia / France 301,1 280,0 289,5 354,2 294,1 299,4 273,6 239,0 191,7 133,1Grecia / Greece 25,1 36,8 45,1 40,4 37,3 32,5 46,5 - 24,4 33,7holanda / netherlands 83,7 93,3 95,1 129,0 185,0 335,0 245,9 272,8 193,7 175,0hungría / hungary - - - - - - - - - -italia / italy 424,8 421,4 388,5 362,0 332,4 339,1 352,1 372,1 160,3 235,7noruega / norway - - - - - - - - - 0,6portugal - - - - - - - - - -reino Unido / United kingdom 141,8 121,4 58,7 57,3 42,9 28,0 15,2 8,6 26,5 22,8Serbia - - - - - - - - - -Suecia / Sweden - - - - - - - - - -Suiza / Switzerland 11,1 1,5 4,0 0,5 0,2 1,2 2,0 28,5 14,5 16,5Yugoslavia - - - - - - - - - -
AMÉricA / America 785,2 520,4 377,2 438,7 595,9 607,0 519,3 592,3 513,9 484,5 argentina 29,2 4,9 12,0 17,2 17,7 15,0 14,2 14,8 11,0 10,1bolivia - - - - - - 0,3 - - -brasil / brazil 125,1 80,2 118,5 128,8 118,0 127,3 152,7 202,6 162,7 183,9Canadá / Canada - - 10,1 34,1 26,7 6,6 1,0 - - -Colombia 3,8 0,7 0,2 1,9 3,5 4,0 4,6 2,2 1,2 4,2estados Unidos / USa 500,4 364,2 169,7 223,7 381,1 409,8 327,1 329,4 295,2 226,8Guatemala - - - - - - - - - -honduras - 0,1 - - - - - - - -México / Mexico 125,2 68,5 60,2 27,3 39,1 40,3 14,8 23,6 23,3 37,3panamá / panama - 1,8 6,5 4,4 3,3 0,6 - 15,0 14,6 16,1perú / peru - - - 0,7 3,9 2,8 0,2 - - -Venezuela - - - 0,4 1,3 0,2 4,3 4,7 5,9 5,9otroS / other 1,5 - - 0,2 1,3 0,4 0,1 0,0 0,0 0,2
AsiA 817,9 1.124,1 1.232,2 1.411,2 1.154,2 753,3 1.110,6 1.138,4 1.728,2 1.752,7 arabia Saudita / Saudi arabia - 22,3 - - - - - - 3,5 1,0Corea del norte / north korea - - 2,3 - - - - - - -Corea del Sur / South korea 190,2 268,6 285,4 318,0 225,3 173,3 186,3 223,9 274,8 249,1China 335,7 443,7 560,0 637,3 522,7 262,8 573,0 606,3 1.159,0 1.183,3emiratos Árabes / arab emirates - 39,7 - - - - - - - -Filipinas / philippines - 40,7 - - - - - 1,0 - -hong kong 6,7 5,7 22,6 18,8 10,2 2,3 0,9 2,7 16,4 3,0india - - - - - 39,7 - - - -indonesia 5,5 3,6 2,2 12,2 8,6 1,0 - 0,2 0,5 -irán / iran - - - - - - - - - -Japón / Japan 85,5 58,0 56,8 60,4 41,2 33,9 66,4 53,1 24,7 36,3Malasia / Malaysia 6,6 3,7 7,7 23,4 5,6 7,9 2,2 7,5 15,0 18,6Singapur / Singapore 0,4 6,2 7,4 0,1 14,7 0,9 8,4 12,6 3,6 3,0tailandia / thailand 1,1 0,9 5,2 13,5 7,4 7,9 6,2 5,6 9,0 17,6taiwán / taiwan 142,6 220,2 222,4 266,7 242,2 163,4 204,2 188,6 185,1 196,1turquía / turkey 43,6 51,5 60,2 53,7 65,8 52,3 56,5 30,0 31,3 32,4Vietnam - - - 6,7 10,5 7,7 6,5 6,8 5,3 12,2otroS / other - - - 0,4 0,0 0,2 - - - -
otros / other 3,0 20,1 11,6 2,1 53,6 84,8 230,6 189,2 240,8 271,5 Madagascar - - - - - - - - - -Sudáfrica / South africa - - - - - - - - - -australia - - 10,0 - - - - 7,4 - 30,0nueva Zelandia / new Zealand - - - - - - - - - -
otroS / other 3,0 20,1 1,6 2,1 53,6 84,8 230,6 181,8 240,8 241,5
totAl 2.696,4 2.767,2 2.614,1 2.953,9 2.799,3 2.605,8 2.909,7 2.983,1 3.179,3 3.160,2
Fuente / Source: Comisión Chilena del Cobre / Chilean Copper Commission.
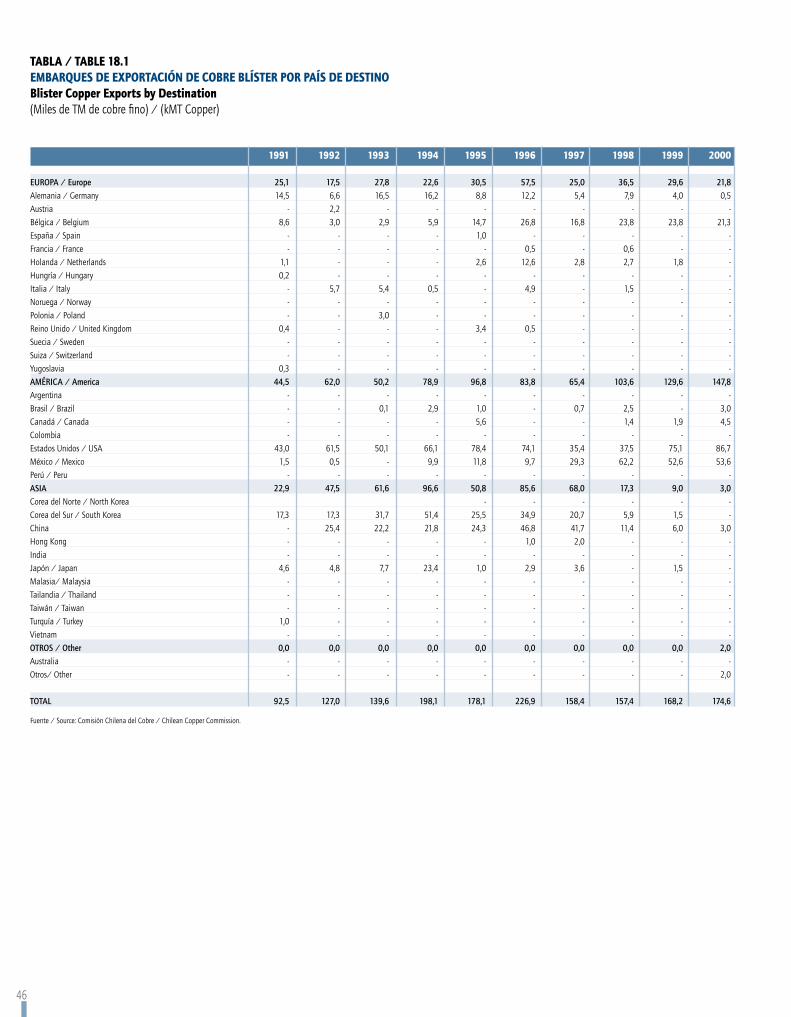
46
TABLA / TABLE 18.1EMBARQUES DE EXPORTACIÓN DE COBRE BLÍSTER POR PAÍS DE DESTINOBlister Copper Exports by Destination(Miles de tM de cobre fino) / (kMt Copper)
1991 1992 1993 1994 1995 1996 1997 1998 1999 2000
euroPA / europe 25,1 17,5 27,8 22,6 30,5 57,5 25,0 36,5 29,6 21,8 alemania / Germany 14,5 6,6 16,5 16,2 8,8 12,2 5,4 7,9 4,0 0,5
austria - 2,2 - - - - - - - -
bélgica / belgium 8,6 3,0 2,9 5,9 14,7 26,8 16,8 23,8 23,8 21,3
españa / Spain - - - - 1,0 - - - - -
Francia / France - - - - - 0,5 - 0,6 - -
holanda / netherlands 1,1 - - - 2,6 12,6 2,8 2,7 1,8 -
hungría / hungary 0,2 - - - - - - - - -
italia / italy - 5,7 5,4 0,5 - 4,9 - 1,5 - -
noruega / norway - - - - - - - - - -
polonia / poland - - 3,0 - - - - - - -
reino Unido / United kingdom 0,4 - - - 3,4 0,5 - - - -
Suecia / Sweden - - - - - - - - - -
Suiza / Switzerland - - - - - - - - - -
Yugoslavia 0,3 - - - - - - - - -
AMÉricA / America 44,5 62,0 50,2 78,9 96,8 83,8 65,4 103,6 129,6 147,8 argentina - - - - - - - - - -
brasil / brazil - - 0,1 2,9 1,0 - 0,7 2,5 - 3,0
Canadá / Canada - - - - 5,6 - - 1,4 1,9 4,5
Colombia - - - - - - - - - -
estados Unidos / USa 43,0 61,5 50,1 66,1 78,4 74,1 35,4 37,5 75,1 86,7
México / Mexico 1,5 0,5 - 9,9 11,8 9,7 29,3 62,2 52,6 53,6
perú / peru - - - - - - - - - -
AsiA 22,9 47,5 61,6 96,6 50,8 85,6 68,0 17,3 9,0 3,0 Corea del norte / north korea - - - - - -
Corea del Sur / South korea 17,3 17,3 31,7 51,4 25,5 34,9 20,7 5,9 1,5 -
China - 25,4 22,2 21,8 24,3 46,8 41,7 11,4 6,0 3,0
hong kong - - - - - 1,0 2,0 - - -
india - - - - - - - - - -
Japón / Japan 4,6 4,8 7,7 23,4 1,0 2,9 3,6 - 1,5 -
Malasia/ Malaysia - - - - - - - - - -
tailandia / thailand - - - - - - - - - -
taiwán / taiwan - - - - - - - - - -
turquía / turkey 1,0 - - - - - - - - -
Vietnam - - - - - - - - - -
otros / other 0,0 0,0 0,0 0,0 0,0 0,0 0,0 0,0 0,0 2,0 australia - - - - - - - - - -
otros/ other - - - - - - - - - 2,0
totAl 92,5 127,0 139,6 198,1 178,1 226,9 158,4 157,4 168,2 174,6
Fuente / Source: Comisión Chilena del Cobre / Chilean Copper Commission.
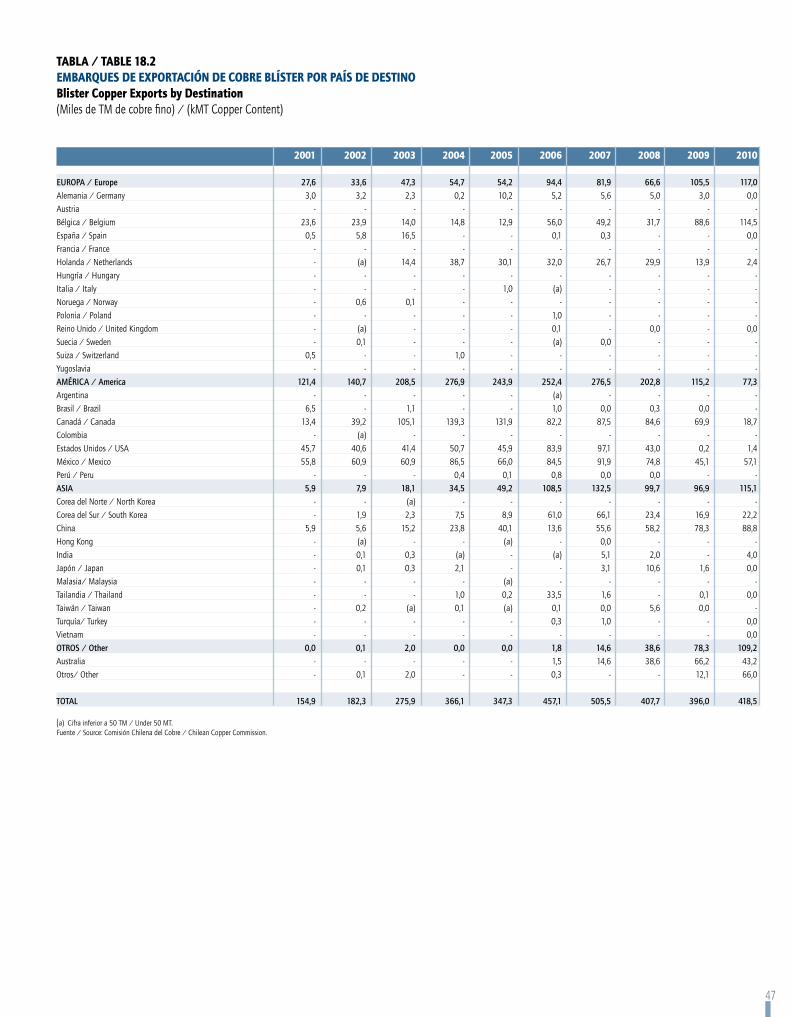
47
TABLA / TABLE 18.2EMBARQUES DE EXPORTACIÓN DE COBRE BLÍSTER POR PAÍS DE DESTINOBlister Copper Exports by Destination(Miles de tM de cobre fino) / (kMt Copper Content)
2001 2002 2003 2004 2005 2006 2007 2008 2009 2010
euroPA / europe 27,6 33,6 47,3 54,7 54,2 94,4 81,9 66,6 105,5 117,0 alemania / Germany 3,0 3,2 2,3 0,2 10,2 5,2 5,6 5,0 3,0 0,0
austria - - - - - - - - - -
bélgica / belgium 23,6 23,9 14,0 14,8 12,9 56,0 49,2 31,7 88,6 114,5
españa / Spain 0,5 5,8 16,5 - - 0,1 0,3 - - 0,0
Francia / France - - - - - - - - - -
holanda / netherlands - (a) 14,4 38,7 30,1 32,0 26,7 29,9 13,9 2,4
hungría / hungary - - - - - - - - - -
italia / italy - - - - 1,0 (a) - - - -
noruega / norway - 0,6 0,1 - - - - - - -
polonia / poland - - - - - 1,0 - - - -
reino Unido / United kingdom - (a) - - - 0,1 - 0,0 - 0,0
Suecia / Sweden - 0,1 - - - (a) 0,0 - - -
Suiza / Switzerland 0,5 - - 1,0 - - - - - -
Yugoslavia - - - - - - - - - -
AMÉricA / America 121,4 140,7 208,5 276,9 243,9 252,4 276,5 202,8 115,2 77,3 argentina - - - - - (a) - - - -
brasil / brazil 6,5 - 1,1 - - 1,0 0,0 0,3 0,0 -
Canadá / Canada 13,4 39,2 105,1 139,3 131,9 82,2 87,5 84,6 69,9 18,7
Colombia - (a) - - - - - - - -
estados Unidos / USa 45,7 40,6 41,4 50,7 45,9 83,9 97,1 43,0 0,2 1,4
México / Mexico 55,8 60,9 60,9 86,5 66,0 84,5 91,9 74,8 45,1 57,1
perú / peru - - - 0,4 0,1 0,8 0,0 0,0 - -
AsiA 5,9 7,9 18,1 34,5 49,2 108,5 132,5 99,7 96,9 115,1 Corea del norte / north korea - - (a) - - - - - - -
Corea del Sur / South korea - 1,9 2,3 7,5 8,9 61,0 66,1 23,4 16,9 22,2
China 5,9 5,6 15,2 23,8 40,1 13,6 55,6 58,2 78,3 88,8
hong kong - (a) - - (a) - 0,0 - - -
india - 0,1 0,3 (a) - (a) 5,1 2,0 - 4,0
Japón / Japan - 0,1 0,3 2,1 - - 3,1 10,6 1,6 0,0
Malasia/ Malaysia - - - - (a) - - - - -
tailandia / thailand - - - 1,0 0,2 33,5 1,6 - 0,1 0,0
taiwán / taiwan - 0,2 (a) 0,1 (a) 0,1 0,0 5,6 0,0 -
turquía/ turkey - - - - - 0,3 1,0 - - 0,0
Vietnam - - - - - - - - - 0,0
otros / other 0,0 0,1 2,0 0,0 0,0 1,8 14,6 38,6 78,3 109,2 australia - - - - - 1,5 14,6 38,6 66,2 43,2
otros/ other - 0,1 2,0 - - 0,3 - - 12,1 66,0
totAl 154,9 182,3 275,9 366,1 347,3 457,1 505,5 407,7 396,0 418,5
(a) Cifra inferior a 50 tM / Under 50 Mt. Fuente / Source: Comisión Chilena del Cobre / Chilean Copper Commission.
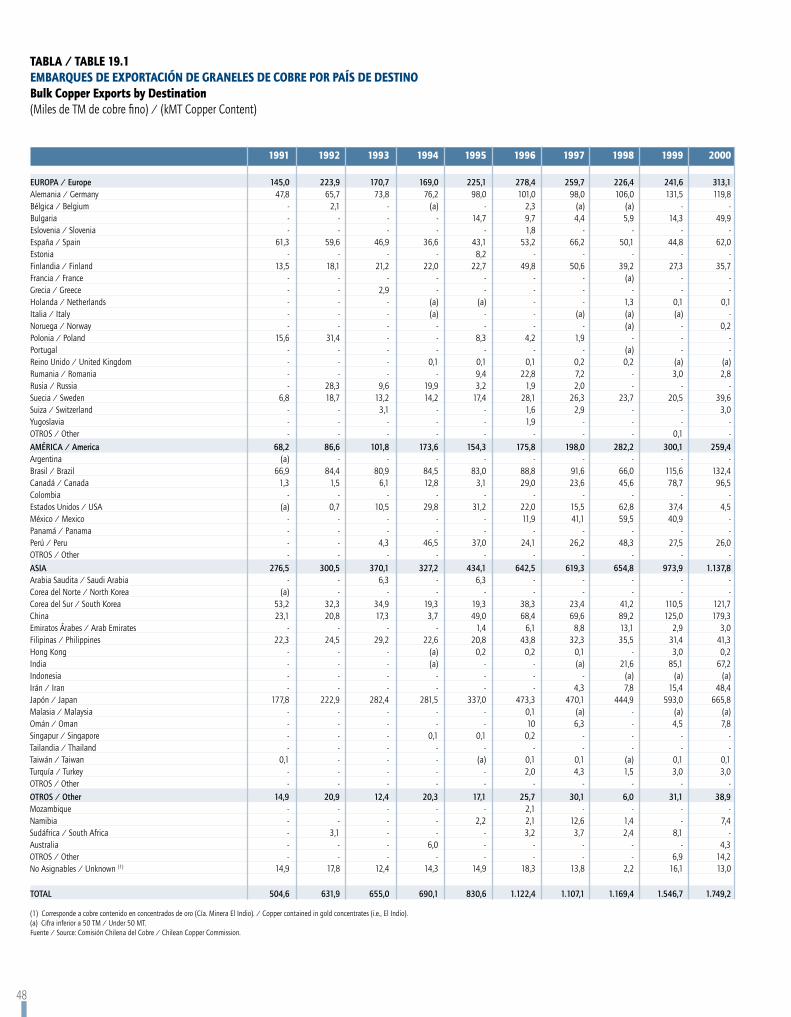
48
TABLA / TABLE 19.1EMBARQUES DE EXPORTACIÓN DE GRANELES DE COBRE POR PAÍS DE DESTINOBulk Copper Exports by Destination(Miles de tM de cobre fino) / (kMt Copper Content)
1991 1992 1993 1994 1995 1996 1997 1998 1999 2000
euroPA / europe 145,0 223,9 170,7 169,0 225,1 278,4 259,7 226,4 241,6 313,1 alemania / Germany 47,8 65,7 73,8 76,2 98,0 101,0 98,0 106,0 131,5 119,8bélgica / belgium - 2,1 - (a) - 2,3 (a) (a) - -bulgaria - - - - 14,7 9,7 4,4 5,9 14,3 49,9eslovenia / Slovenia - - - - - 1,8 - - - -españa / Spain 61,3 59,6 46,9 36,6 43,1 53,2 66,2 50,1 44,8 62,0estonia - - - - 8,2 - - - - -Finlandia / Finland 13,5 18,1 21,2 22,0 22,7 49,8 50,6 39,2 27,3 35,7Francia / France - - - - - - - (a) - -Grecia / Greece - - 2,9 - - - - - - -holanda / netherlands - - - (a) (a) - - 1,3 0,1 0,1italia / italy - - - (a) - - (a) (a) (a) -noruega / norway - - - - - - - (a) - 0,2polonia / poland 15,6 31,4 - - 8,3 4,2 1,9 - - -portugal - - - - - - - (a) - -reino Unido / United kingdom - - - 0,1 0,1 0,1 0,2 0,2 (a) (a)rumania / romania - - - - 9,4 22,8 7,2 - 3,0 2,8rusia / russia - 28,3 9,6 19,9 3,2 1,9 2,0 - - -Suecia / Sweden 6,8 18,7 13,2 14,2 17,4 28,1 26,3 23,7 20,5 39,6Suiza / Switzerland - - 3,1 - - 1,6 2,9 - - 3,0Yugoslavia - - - - - 1,9 - - - -otroS / other - - - - - - - - 0,1 -
AMÉricA / America 68,2 86,6 101,8 173,6 154,3 175,8 198,0 282,2 300,1 259,4 argentina (a) - - - - - - - - -brasil / brazil 66,9 84,4 80,9 84,5 83,0 88,8 91,6 66,0 115,6 132,4Canadá / Canada 1,3 1,5 6,1 12,8 3,1 29,0 23,6 45,6 78,7 96,5Colombia - - - - - - - - - -estados Unidos / USa (a) 0,7 10,5 29,8 31,2 22,0 15,5 62,8 37,4 4,5México / Mexico - - - - - 11,9 41,1 59,5 40,9 -panamá / panama - - - - - - - - - -perú / peru - - 4,3 46,5 37,0 24,1 26,2 48,3 27,5 26,0otroS / other - - - - - - - - - -
AsiA 276,5 300,5 370,1 327,2 434,1 642,5 619,3 654,8 973,9 1.137,8 arabia Saudita / Saudi arabia - - 6,3 - 6,3 - - - - -Corea del norte / north korea (a) - - - - - - - - -Corea del Sur / South korea 53,2 32,3 34,9 19,3 19,3 38,3 23,4 41,2 110,5 121,7China 23,1 20,8 17,3 3,7 49,0 68,4 69,6 89,2 125,0 179,3emiratos Árabes / arab emirates - - - - 1,4 6,1 8,8 13,1 2,9 3,0Filipinas / philippines 22,3 24,5 29,2 22,6 20,8 43,8 32,3 35,5 31,4 41,3hong kong - - - (a) 0,2 0,2 0,1 - 3,0 0,2india - - - (a) - - (a) 21,6 85,1 67,2indonesia - - - - - - - (a) (a) (a)irán / iran - - - - - - 4,3 7,8 15,4 48,4Japón / Japan 177,8 222,9 282,4 281,5 337,0 473,3 470,1 444,9 593,0 665,8Malasia / Malaysia - - - - - 0,1 (a) - (a) (a)omán / oman - - - - - 10 6,3 - 4,5 7,8Singapur / Singapore - - - 0,1 0,1 0,2 - - - -tailandia / thailand - - - - - - - - - -taiwán / taiwan 0,1 - - - (a) 0,1 0,1 (a) 0,1 0,1turquía / turkey - - - - - 2,0 4,3 1,5 3,0 3,0otroS / other - - - - - - - - - -
otros / other 14,9 20,9 12,4 20,3 17,1 25,7 30,1 6,0 31,1 38,9 Mozambique - - - - - 2,1 - - - -namibia - - - - 2,2 2,1 12,6 1,4 - 7,4Sudáfrica / South africa - 3,1 - - - 3,2 3,7 2,4 8,1 -australia - - - 6,0 - - - - - 4,3otroS / other - - - - - - - - 6,9 14,2no asignables / Unknown (1) 14,9 17,8 12,4 14,3 14,9 18,3 13,8 2,2 16,1 13,0 totAl 504,6 631,9 655,0 690,1 830,6 1.122,4 1.107,1 1.169,4 1.546,7 1.749,2 (1) Corresponde a cobre contenido en concentrados de oro (Cía. Minera el indio). / Copper contained in gold concentrates (i.e., el indio).(a) Cifra inferior a 50 tM / Under 50 Mt. Fuente / Source: Comisión Chilena del Cobre / Chilean Copper Commission.
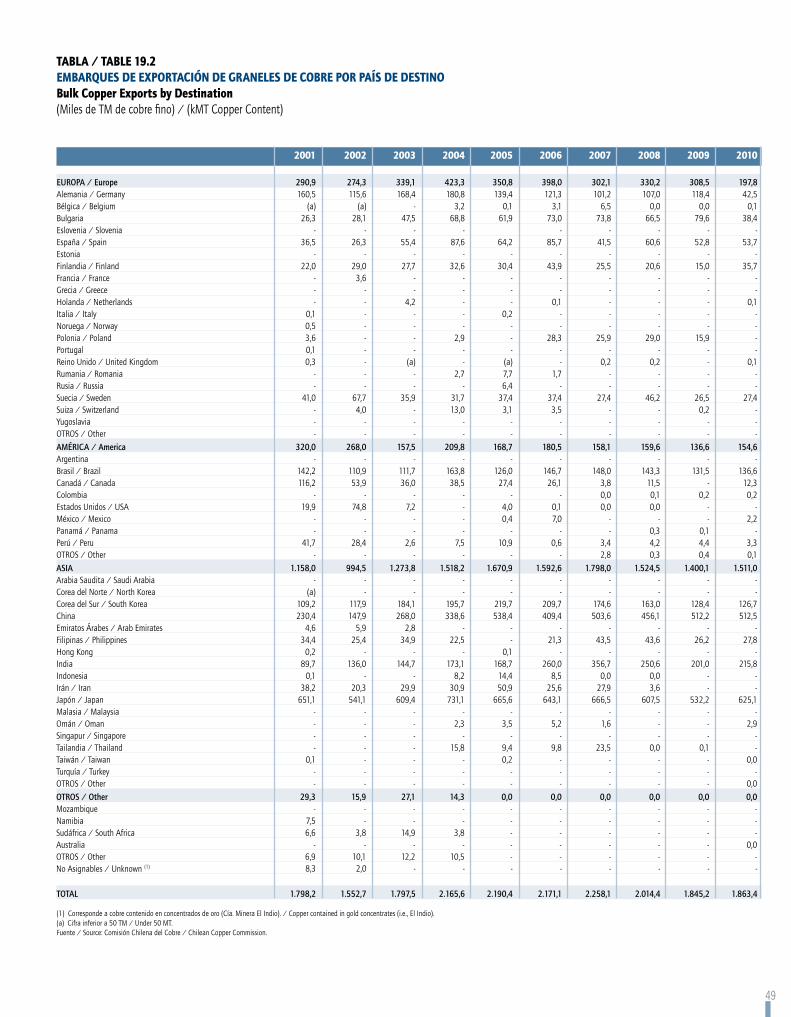
49
TABLA / TABLE 19.2 EMBARQUES DE EXPORTACIÓN DE GRANELES DE COBRE POR PAÍS DE DESTINO Bulk Copper Exports by Destination (Miles de tM de cobre fino) / (kMt Copper Content) 2001 2002 2003 2004 2005 2006 2007 2008 2009 2010
euroPA / europe 290,9 274,3 339,1 423,3 350,8 398,0 302,1 330,2 308,5 197,8 alemania / Germany 160,5 115,6 168,4 180,8 139,4 121,3 101,2 107,0 118,4 42,5bélgica / belgium (a) (a) - 3,2 0,1 3,1 6,5 0,0 0,0 0,1bulgaria 26,3 28,1 47,5 68,8 61,9 73,0 73,8 66,5 79,6 38,4eslovenia / Slovenia - - - - - - - - -españa / Spain 36,5 26,3 55,4 87,6 64,2 85,7 41,5 60,6 52,8 53,7estonia - - - - - - - - - -Finlandia / Finland 22,0 29,0 27,7 32,6 30,4 43,9 25,5 20,6 15,0 35,7Francia / France - 3,6 - - - - - - - -Grecia / Greece - - - - - - - - - -holanda / netherlands - - 4,2 - - 0,1 - - - 0,1italia / italy 0,1 - - - 0,2 - - - - -noruega / norway 0,5 - - - - - - - - -polonia / poland 3,6 - - 2,9 - 28,3 25,9 29,0 15,9 -portugal 0,1 - - - - - - - - -reino Unido / United kingdom 0,3 - (a) - (a) - 0,2 0,2 - 0,1rumania / romania - - - 2,7 7,7 1,7 - - - -rusia / russia - - - - 6,4 - - - - -Suecia / Sweden 41,0 67,7 35,9 31,7 37,4 37,4 27,4 46,2 26,5 27,4Suiza / Switzerland - 4,0 - 13,0 3,1 3,5 - - 0,2 -Yugoslavia - - - - - - - - - -otroS / other - - - - - - - - - -
AMÉricA / America 320,0 268,0 157,5 209,8 168,7 180,5 158,1 159,6 136,6 154,6 argentina - - - - - - - - - -brasil / brazil 142,2 110,9 111,7 163,8 126,0 146,7 148,0 143,3 131,5 136,6Canadá / Canada 116,2 53,9 36,0 38,5 27,4 26,1 3,8 11,5 - 12,3Colombia - - - - - - 0,0 0,1 0,2 0,2estados Unidos / USa 19,9 74,8 7,2 - 4,0 0,1 0,0 0,0 - -México / Mexico - - - - 0,4 7,0 - - - 2,2panamá / panama - - - - - - - 0,3 0,1 -perú / peru 41,7 28,4 2,6 7,5 10,9 0,6 3,4 4,2 4,4 3,3otroS / other - - - - - - 2,8 0,3 0,4 0,1
AsiA 1.158,0 994,5 1.273,8 1.518,2 1.670,9 1.592,6 1.798,0 1.524,5 1.400,1 1.511,0 arabia Saudita / Saudi arabia - - - - - - - - - -Corea del norte / north korea (a) - - - - - - - - -Corea del Sur / South korea 109,2 117,9 184,1 195,7 219,7 209,7 174,6 163,0 128,4 126,7China 230,4 147,9 268,0 338,6 538,4 409,4 503,6 456,1 512,2 512,5emiratos Árabes / arab emirates 4,6 5,9 2,8 - - - - - - -Filipinas / philippines 34,4 25,4 34,9 22,5 - 21,3 43,5 43,6 26,2 27,8hong kong 0,2 - - - 0,1 - - - - -india 89,7 136,0 144,7 173,1 168,7 260,0 356,7 250,6 201,0 215,8indonesia 0,1 - - 8,2 14,4 8,5 0,0 0,0 - -irán / iran 38,2 20,3 29,9 30,9 50,9 25,6 27,9 3,6 - -Japón / Japan 651,1 541,1 609,4 731,1 665,6 643,1 666,5 607,5 532,2 625,1Malasia / Malaysia - - - - - - - - - -omán / oman - - - 2,3 3,5 5,2 1,6 - - 2,9Singapur / Singapore - - - - - - - - - -tailandia / thailand - - - 15,8 9,4 9,8 23,5 0,0 0,1 -taiwán / taiwan 0,1 - - - 0,2 - - - - 0,0turquía / turkey - - - - - - - - - -otroS / other - - - - - - - - - 0,0
otros / other 29,3 15,9 27,1 14,3 0,0 0,0 0,0 0,0 0,0 0,0 Mozambique - - - - - - - - - -namibia 7,5 - - - - - - - - -Sudáfrica / South africa 6,6 3,8 14,9 3,8 - - - - - -australia - - - - - - - - - 0,0otroS / other 6,9 10,1 12,2 10,5 - - - - - -no asignables / Unknown (1) 8,3 2,0 - - - - - - - -
totAl 1.798,2 1.552,7 1.797,5 2.165,6 2.190,4 2.171,1 2.258,1 2.014,4 1.845,2 1.863,4 (1) Corresponde a cobre contenido en concentrados de oro (Cía. Minera el indio). / Copper contained in gold concentrates (i.e., el indio).(a) Cifra inferior a 50 tM / Under 50 Mt. Fuente / Source: Comisión Chilena del Cobre / Chilean Copper Commission.
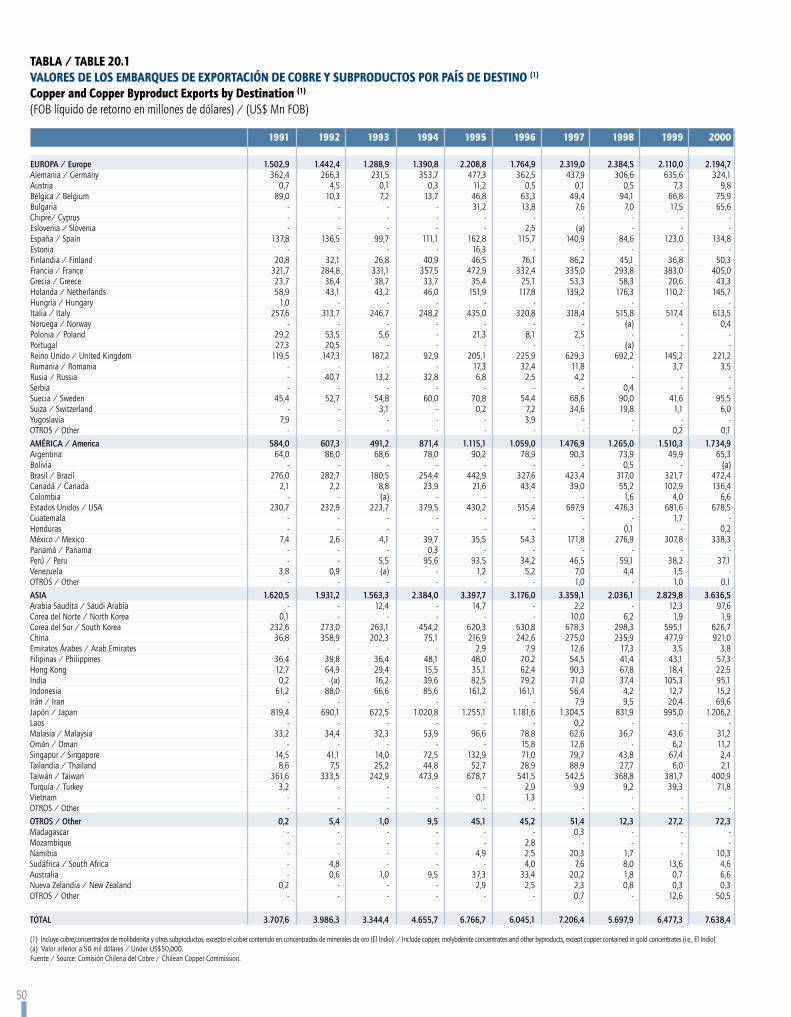
50
TABLA / TABLE 20.1VALORES DE LOS EMBARQUES DE EXPORTACIÓN DE COBRE Y SUBPRODUCTOS POR PAÍS DE DESTINO (1)
Copper and Copper Byproduct Exports by Destination (1)
(Fob líquido de retorno en millones de dólares) / (US$ Mn Fob)
1991 1992 1993 1994 1995 1996 1997 1998 1999 2000
euroPA / europe 1.502,9 1.442,4 1.288,9 1.390,8 2.208,8 1.764,9 2.319,0 2.384,5 2.110,0 2.194,7 alemania / Germany 362,4 266,3 231,5 353,7 477,3 362,5 437,9 306,6 635,6 324,1austria 0,7 4,5 0,1 0,3 11,2 0,5 0,1 0,5 7,3 9,8bélgica / belgium 89,0 10,3 7,2 13,7 46,8 63,3 49,4 94,1 66,8 75,9bulgaria - - - - 31,2 13,8 7,6 7,0 17,5 65,6Chipre/ Cyprus - - - - - - - - - -eslovenia / Slovenia - - - - - 2,5 (a) - - -españa / Spain 137,8 136,5 99,7 111,1 162,8 115,7 140,9 84,6 123,0 134,8estonia - - - - 16,3 - - - - -Finlandia / Finland 20,8 32,1 26,8 40,9 46,5 76,1 86,2 45,1 36,8 50,3Francia / France 321,7 284,8 331,1 357,5 472,9 332,4 335,0 293,8 383,0 405,0Grecia / Greece 23,7 36,4 38,7 33,7 35,4 25,1 53,3 58,3 20,6 43,3holanda / netherlands 58,9 43,1 43,2 46,0 151,9 117,8 139,2 176,3 110,2 145,7hungría / hungary 1,0 - - - - - - - - -italia / italy 257,6 313,7 246,7 248,2 435,0 320,8 318,4 515,8 517,4 613,5noruega / norway - - - - - - - (a) - 0,4polonia / poland 29,2 53,5 5,6 - 21,3 8,1 2,5 - - -portugal 27,3 20,5 - - - - - (a) - -reino Unido / United kingdom 119,5 147,3 187,2 92,9 205,1 225,9 629,3 692,2 145,2 221,2rumania / romania - - - - 17,3 32,4 11,8 - 3,7 3,5rusia / russia - 40,7 13,2 32,8 6,8 2,5 4,2 - - -Serbia - - - - - - - 0,4 - -Suecia / Sweden 45,4 52,7 54,8 60,0 70,8 54,4 68,6 90,0 41,6 95,5Suiza / Switzerland - - 3,1 - 0,2 7,2 34,6 19,8 1,1 6,0Yugoslavia 7,9 - - - - 3,9 - - - -otroS / other - - - - - - - - 0,2 0,1
AMÉricA / America 584,0 607,3 491,2 871,4 1.115,1 1.059,0 1.476,9 1.265,0 1.510,3 1.734,9 argentina 64,0 86,0 68,6 78,0 90,2 78,9 90,3 73,9 49,9 65,3bolivia - - - - - - - 0,5 - (a)brasil / brazil 276,0 282,7 180,5 254,4 442,9 327,6 423,4 317,0 321,7 472,4Canadá / Canada 2,1 2,2 8,8 23,9 21,6 43,4 39,0 55,2 102,9 136,4Colombia - - (a) - - - - 1,6 4,0 6,6estados Unidos / USa 230,7 232,9 223,7 379,5 430,2 515,4 697,9 476,3 681,6 678,5Guatemala - - - - - - - - 1,7 -honduras - - - - - - - 0,1 - 0,2México / Mexico 7,4 2,6 4,1 39,7 35,5 54,3 171,8 276,9 307,8 338,3panamá / panama - - - 0,3 - - - - - -perú / peru - - 5,5 95,6 93,5 34,2 46,5 59,1 38,2 37,1Venezuela 3,8 0,9 (a) - 1,2 5,2 7,0 4,4 1,5 -otroS / other - - - - - - 1,0 - 1,0 0,1
AsiA 1.620,5 1.931,2 1.563,3 2.384,0 3.397,7 3.176,0 3.359,1 2.036,1 2.829,8 3.636,5 arabia Saudita / Saudi arabia - - 12,4 - 14,7 - 2,2 - 12,3 97,6Corea del norte / north korea 0,1 - - - - - 10,0 6,2 1,9 1,9Corea del Sur / South korea 232,6 273,0 263,1 454,2 620,3 630,8 678,3 298,3 595,1 626,7China 36,8 358,9 202,3 75,1 216,9 242,6 275,0 235,9 477,9 921,0emiratos Árabes / arab emirates - - - - 2,9 7,9 12,6 17,3 3,5 3,8Filipinas / philippines 36,4 39,8 36,4 48,1 48,0 70,2 54,5 41,4 43,1 57,3hong kong 12,7 64,9 29,4 15,5 35,1 62,4 90,3 67,8 18,4 22,5india 0,2 (a) 16,2 39,6 82,5 79,2 71,0 37,4 105,3 95,1indonesia 61,2 88,0 66,6 85,6 161,2 161,1 56,4 4,2 12,7 15,2irán / iran - - - - - - 7,9 9,5 20,4 69,6Japón / Japan 819,4 690,1 622,5 1.020,8 1.255,1 1.181,6 1.304,5 831,9 995,0 1.206,2laos - - - - - - 0,2 - - -Malasia / Malaysia 33,2 34,4 32,3 53,9 96,6 78,8 62,6 36,7 43,6 31,2omán / oman - - - - - 15,8 12,6 - 6,2 11,2Singapur / Singapore 14,5 41,1 14,0 72,5 132,9 71,0 79,7 43,8 67,4 2,4tailandia / thailand 8,6 7,5 25,2 44,8 52,7 28,9 88,9 27,7 6,0 2,1taiwán / taiwan 361,6 333,5 242,9 473,9 678,7 541,5 542,5 368,8 381,7 400,9turquía / turkey 3,2 - - - - 2,9 9,9 9,2 39,3 71,8Vietnam - - - - 0,1 1,3 - - - -otroS / other - - - - - - - - - -
otros / other 0,2 5,4 1,0 9,5 45,1 45,2 51,4 12,3 27,2 72,3 Madagascar - - - - - - 0,3 - - -Mozambique - - - - - 2,8 - - - -namibia - - - - 4,9 2,5 20,3 1,7 - 10,3Sudáfrica / South africa - 4,8 - - - 4,0 7,6 8,0 13,6 4,6australia - 0,6 1,0 9,5 37,3 33,4 20,2 1,8 0,7 6,6nueva Zelandia / new Zealand 0,2 - - - 2,9 2,5 2,3 0,8 0,3 0,3otroS / other - - - - - - 0,7 - 12,6 50,5
totAl 3.707,6 3.986,3 3.344,4 4.655,7 6.766,7 6.045,1 7.206,4 5.697,9 6.477,3 7.638,4
(1) incluye cobre,concentrados de molibdenita y otros subproductos, excepto el cobre contenido en concentrados de minerales de oro (el indio). / include copper, molybdenite concentrates and other byproducts, except copper contained in gold concentrates (i.e., el indio). (a) Valor inferior a 50 mil dólares / Under US$50,000. Fuente / Source: Comisión Chilena del Cobre / Chilean Copper Commission.
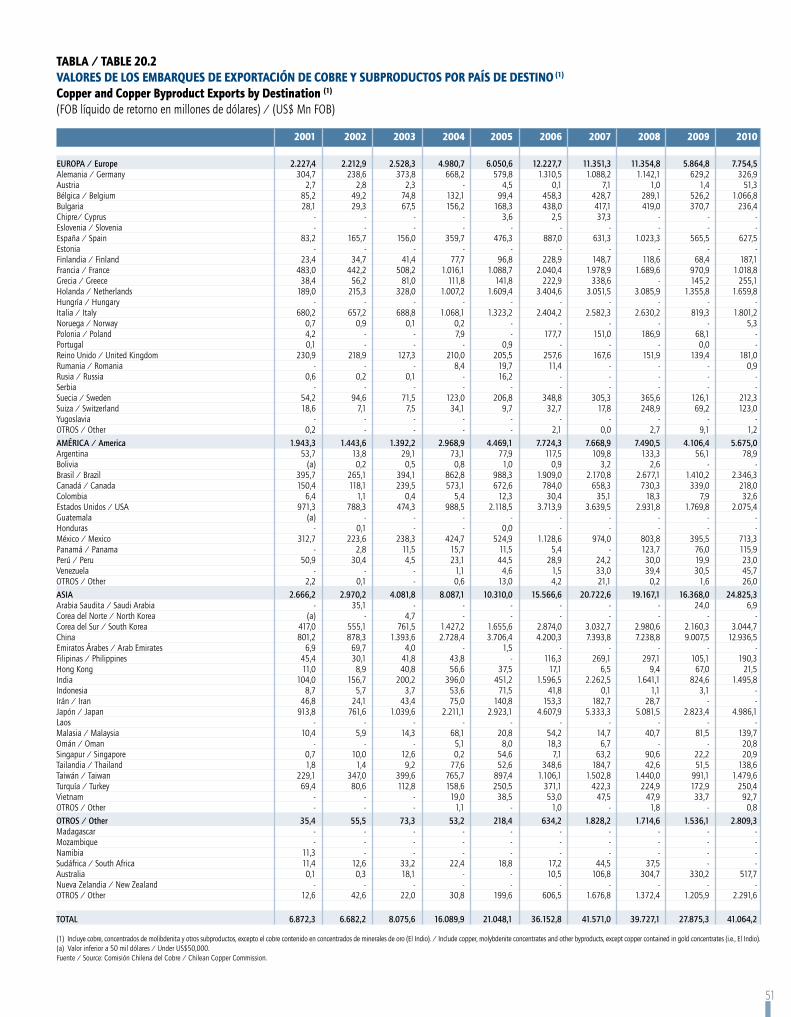
51
TABLA / TABLE 20.2VALORES DE LOS EMBARQUES DE EXPORTACIÓN DE COBRE Y SUBPRODUCTOS POR PAÍS DE DESTINO (1)
Copper and Copper Byproduct Exports by Destination (1)
(Fob líquido de retorno en millones de dólares) / (US$ Mn Fob) 2001 2002 2003 2004 2005 2006 2007 2008 2009 2010
euroPA / europe 2.227,4 2.212,9 2.528,3 4.980,7 6.050,6 12.227,7 11.351,3 11.354,8 5.864,8 7.754,5 alemania / Germany 304,7 238,6 373,8 668,2 579,8 1.310,5 1.088,2 1.142,1 629,2 326,9austria 2,7 2,8 2,3 - 4,5 0,1 7,1 1,0 1,4 51,3bélgica / belgium 85,2 49,2 74,8 132,1 99,4 458,3 428,7 289,1 526,2 1.066,8bulgaria 28,1 29,3 67,5 156,2 168,3 438,0 417,1 419,0 370,7 236,4Chipre/ Cyprus - - - - 3,6 2,5 37,3 - - -eslovenia / Slovenia - - - - - - - - - -españa / Spain 83,2 165,7 156,0 359,7 476,3 887,0 631,3 1.023,3 565,5 627,5estonia - - - - - - - - - -Finlandia / Finland 23,4 34,7 41,4 77,7 96,8 228,9 148,7 118,6 68,4 187,1Francia / France 483,0 442,2 508,2 1.016,1 1.088,7 2.040,4 1.978,9 1.689,6 970,9 1.018,8Grecia / Greece 38,4 56,2 81,0 111,8 141,8 222,9 338,6 - 145,2 255,1holanda / netherlands 189,0 215,3 328,0 1.007,2 1.609,4 3.404,6 3.051,5 3.085,9 1.355,8 1.659,8hungría / hungary - - - - - - - - - -italia / italy 680,2 657,2 688,8 1.068,1 1.323,2 2.404,2 2.582,3 2.630,2 819,3 1.801,2noruega / norway 0,7 0,9 0,1 0,2 - - - - - 5,3polonia / poland 4,2 - - 7,9 - 177,7 151,0 186,9 68,1 -portugal 0,1 - - - 0,9 - - - 0,0 -reino Unido / United kingdom 230,9 218,9 127,3 210,0 205,5 257,6 167,6 151,9 139,4 181,0rumania / romania - - - 8,4 19,7 11,4 - - - 0,9rusia / russia 0,6 0,2 0,1 - 16,2 - - - - -Serbia - - - - - - - - - -Suecia / Sweden 54,2 94,6 71,5 123,0 206,8 348,8 305,3 365,6 126,1 212,3Suiza / Switzerland 18,6 7,1 7,5 34,1 9,7 32,7 17,8 248,9 69,2 123,0Yugoslavia - - - - - - - - - -otroS / other 0,2 - - - - 2,1 0,0 2,7 9,1 1,2
AMÉricA / America 1.943,3 1.443,6 1.392,2 2.968,9 4.469,1 7.724,3 7.668,9 7.490,5 4.106,4 5.675,0 argentina 53,7 13,8 29,1 73,1 77,9 117,5 109,8 133,3 56,1 78,9bolivia (a) 0,2 0,5 0,8 1,0 0,9 3,2 2,6 - -brasil / brazil 395,7 265,1 394,1 862,8 988,3 1.909,0 2.170,8 2.677,1 1.410,2 2.346,3Canadá / Canada 150,4 118,1 239,5 573,1 672,6 784,0 658,3 730,3 339,0 218,0Colombia 6,4 1,1 0,4 5,4 12,3 30,4 35,1 18,3 7,9 32,6estados Unidos / USa 971,3 788,3 474,3 988,5 2.118,5 3.713,9 3.639,5 2.931,8 1.769,8 2.075,4Guatemala (a) - - - - - - - - -honduras - 0,1 - - 0,0 - - - - -México / Mexico 312,7 223,6 238,3 424,7 524,9 1.128,6 974,0 803,8 395,5 713,3panamá / panama - 2,8 11,5 15,7 11,5 5,4 - 123,7 76,0 115,9perú / peru 50,9 30,4 4,5 23,1 44,5 28,9 24,2 30,0 19,9 23,0Venezuela - - - 1,1 4,6 1,5 33,0 39,4 30,5 45,7otroS / other 2,2 0,1 - 0,6 13,0 4,2 21,1 0,2 1,6 26,0
AsiA 2.666,2 2.970,2 4.081,8 8.087,1 10.310,0 15.566,6 20.722,6 19.167,1 16.368,0 24.825,3 arabia Saudita / Saudi arabia - 35,1 - - - - - - 24,0 6,9Corea del norte / north korea (a) - 4,7 - - - - - - -Corea del Sur / South korea 417,0 555,1 761,5 1.427,2 1.655,6 2.874,0 3.032,7 2.980,6 2.160,3 3.044,7China 801,2 878,3 1.393,6 2.728,4 3.706,4 4.200,3 7.393,8 7.238,8 9.007,5 12.936,5emiratos Árabes / arab emirates 6,9 69,7 4,0 - 1,5 - - - - -Filipinas / philippines 45,4 30,1 41,8 43,8 - 116,3 269,1 297,1 105,1 190,3hong kong 11,0 8,9 40,8 56,6 37,5 17,1 6,5 9,4 67,0 21,5india 104,0 156,7 200,2 396,0 451,2 1.596,5 2.262,5 1.641,1 824,6 1.495,8indonesia 8,7 5,7 3,7 53,6 71,5 41,8 0,1 1,1 3,1 -irán / iran 46,8 24,1 43,4 75,0 140,8 153,3 182,7 28,7 - -Japón / Japan 913,8 761,6 1.039,6 2.211,1 2.923,1 4.607,9 5.333,3 5.081,5 2.823,4 4.986,1laos - - - - - - - - - -Malasia / Malaysia 10,4 5,9 14,3 68,1 20,8 54,2 14,7 40,7 81,5 139,7omán / oman - - - 5,1 8,0 18,3 6,7 - - 20,8Singapur / Singapore 0,7 10,0 12,6 0,2 54,6 7,1 63,2 90,6 22,2 20,9tailandia / thailand 1,8 1,4 9,2 77,6 52,6 348,6 184,7 42,6 51,5 138,6taiwán / taiwan 229,1 347,0 399,6 765,7 897,4 1.106,1 1.502,8 1.440,0 991,1 1.479,6turquía / turkey 69,4 80,6 112,8 158,6 250,5 371,1 422,3 224,9 172,9 250,4Vietnam - - - 19,0 38,5 53,0 47,5 47,9 33,7 92,7otroS / other - - - 1,1 - 1,0 - 1,8 - 0,8
otros / other 35,4 55,5 73,3 53,2 218,4 634,2 1.828,2 1.714,6 1.536,1 2.809,3 Madagascar - - - - - - - - - -Mozambique - - - - - - - - - -namibia 11,3 - - - - - - - - -Sudáfrica / South africa 11,4 12,6 33,2 22,4 18,8 17,2 44,5 37,5 - -australia 0,1 0,3 18,1 - - 10,5 106,8 304,7 330,2 517,7nueva Zelandia / new Zealand - - - - - - - - - -otroS / other 12,6 42,6 22,0 30,8 199,6 606,5 1.676,8 1.372,4 1.205,9 2.291,6
totAl 6.872,3 6.682,2 8.075,6 16.089,9 21.048,1 36.152,8 41.571,0 39.727,1 27.875,3 41.064,2 (1) incluye cobre, concentrados de molibdenita y otros subproductos, excepto el cobre contenido en concentrados de minerales de oro (el indio). / include copper, molybdenite concentrates and other byproducts, except copper contained in gold concentrates (i.e., el indio). (a) Valor inferior a 50 mil dólares / Under US$50,000. Fuente / Source: Comisión Chilena del Cobre / Chilean Copper Commission.
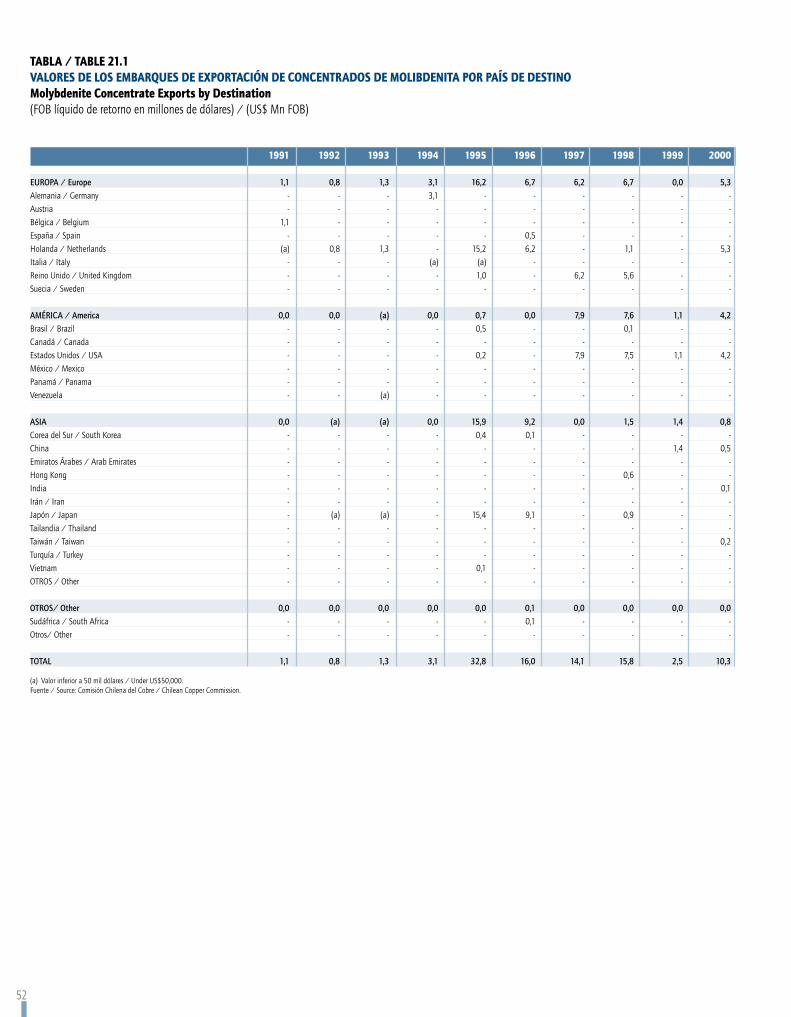
52
TABLA / TABLE 21.1VALORES DE LOS EMBARQUES DE EXPORTACIÓN DE CONCENTRADOS DE MOLIBDENITA POR PAÍS DE DESTINOMolybdenite Concentrate Exports by Destination(Fob líquido de retorno en millones de dólares) / (US$ Mn Fob)
1991 1992 1993 1994 1995 1996 1997 1998 1999 2000
euroPA / europe 1,1 0,8 1,3 3,1 16,2 6,7 6,2 6,7 0,0 5,3 alemania / Germany - - - 3,1 - - - - - -
austria - - - - - - - - - -
bélgica / belgium 1,1 - - - - - - - - -
españa / Spain - - - - - 0,5 - - - -
holanda / netherlands (a) 0,8 1,3 - 15,2 6,2 - 1,1 - 5,3
italia / italy - - - (a) (a) - - - - -
reino Unido / United kingdom - - - - 1,0 - 6,2 5,6 - -
Suecia / Sweden - - - - - - - - - -
AMÉricA / America 0,0 0,0 (a) 0,0 0,7 0,0 7,9 7,6 1,1 4,2 brasil / brazil - - - - 0,5 - - 0,1 - -
Canadá / Canada - - - - - - - - - -
estados Unidos / USa - - - - 0,2 - 7,9 7,5 1,1 4,2
México / Mexico - - - - - - - - - -
panamá / panama - - - - - - - - - -
Venezuela - - (a) - - - - - - -
AsiA 0,0 (a) (a) 0,0 15,9 9,2 0,0 1,5 1,4 0,8 Corea del Sur / South korea - - - - 0,4 0,1 - - - -
China - - - - - - - - 1,4 0,5
emiratos Árabes / arab emirates - - - - - - - - - -
hong kong - - - - - - - 0,6 - -
india - - - - - - - - - 0,1
irán / iran - - - - - - - - - -
Japón / Japan - (a) (a) - 15,4 9,1 - 0,9 - -
tailandia / thailand - - - - - - - - - -
taiwán / taiwan - - - - - - - - - 0,2
turquía / turkey - - - - - - - - - -
Vietnam - - - - 0,1 - - - - -
otroS / other - - - - - - - - - -
otros/ other 0,0 0,0 0,0 0,0 0,0 0,1 0,0 0,0 0,0 0,0 Sudáfrica / South africa - - - - - 0,1 - - - -
otros/ other - - - - - - - - - -
totAl 1,1 0,8 1,3 3,1 32,8 16,0 14,1 15,8 2,5 10,3 (a) Valor inferior a 50 mil dólares / Under US$50,000. Fuente / Source: Comisión Chilena del Cobre / Chilean Copper Commission.
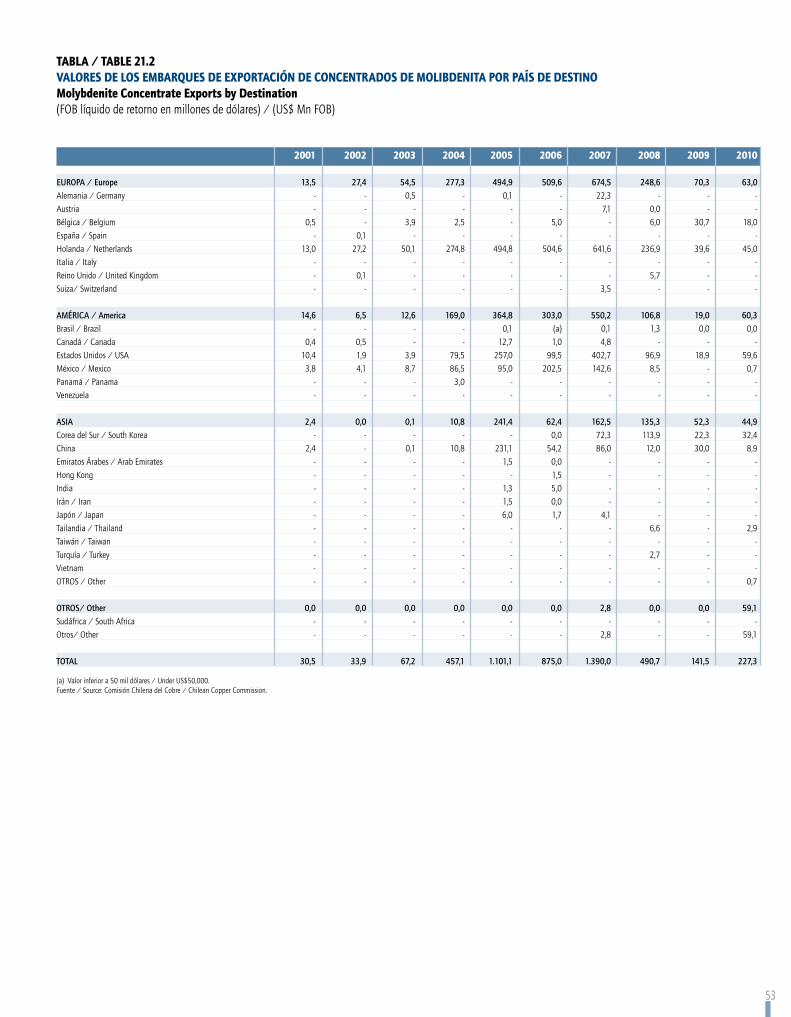
53
TABLA / TABLE 21.2VALORES DE LOS EMBARQUES DE EXPORTACIÓN DE CONCENTRADOS DE MOLIBDENITA POR PAÍS DE DESTINOMolybdenite Concentrate Exports by Destination(Fob líquido de retorno en millones de dólares) / (US$ Mn Fob)
2001 2002 2003 2004 2005 2006 2007 2008 2009 2010
euroPA / europe 13,5 27,4 54,5 277,3 494,9 509,6 674,5 248,6 70,3 63,0 alemania / Germany - - 0,5 - 0,1 - 22,3 - - -
austria - - - - - - 7,1 0,0 - -
bélgica / belgium 0,5 - 3,9 2,5 - 5,0 - 6,0 30,7 18,0
españa / Spain - 0,1 - - - - - - - -
holanda / netherlands 13,0 27,2 50,1 274,8 494,8 504,6 641,6 236,9 39,6 45,0
italia / italy - - - - - - - - - -
reino Unido / United kingdom - 0,1 - - - - - 5,7 - -
Suiza/ Switzerland - - - - - - 3,5 - - -
AMÉricA / America 14,6 6,5 12,6 169,0 364,8 303,0 550,2 106,8 19,0 60,3 brasil / brazil - - - - 0,1 (a) 0,1 1,3 0,0 0,0
Canadá / Canada 0,4 0,5 - - 12,7 1,0 4,8 - - -
estados Unidos / USa 10,4 1,9 3,9 79,5 257,0 99,5 402,7 96,9 18,9 59,6
México / Mexico 3,8 4,1 8,7 86,5 95,0 202,5 142,6 8,5 - 0,7
panamá / panama - - - 3,0 - - - - - -
Venezuela - - - - - - - - - -
AsiA 2,4 0,0 0,1 10,8 241,4 62,4 162,5 135,3 52,3 44,9 Corea del Sur / South korea - - - - - 0,0 72,3 113,9 22,3 32,4
China 2,4 - 0,1 10,8 231,1 54,2 86,0 12,0 30,0 8,9
emiratos Árabes / arab emirates - - - - 1,5 0,0 - - - -
hong kong - - - - - 1,5 - - - -
india - - - - 1,3 5,0 - - - -
irán / iran - - - - 1,5 0,0 - - - -
Japón / Japan - - - - 6,0 1,7 4,1 - - -
tailandia / thailand - - - - - - - 6,6 - 2,9
taiwán / taiwan - - - - - - - - - -
turquía / turkey - - - - - - - 2,7 - -
Vietnam - - - - - - - - - -
otroS / other - - - - - - - - - 0,7
otros/ other 0,0 0,0 0,0 0,0 0,0 0,0 2,8 0,0 0,0 59,1 Sudáfrica / South africa - - - - - - - - - -
otros/ other - - - - - - 2,8 - - 59,1
totAl 30,5 33,9 67,2 457,1 1.101,1 875,0 1.390,0 490,7 141,5 227,3 (a) Valor inferior a 50 mil dólares / Under US$50,000. Fuente / Source: Comisión Chilena del Cobre / Chilean Copper Commission.
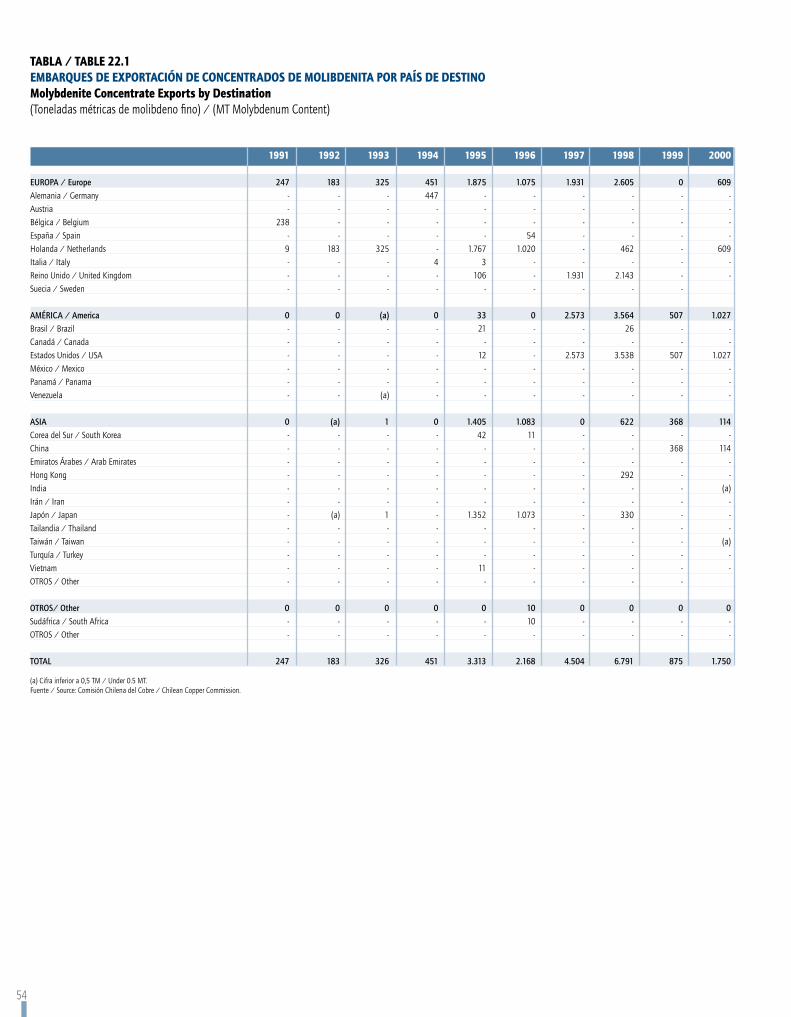
54
TABLA / TABLE 22.1EMBARQUES DE EXPORTACIÓN DE CONCENTRADOS DE MOLIBDENITA POR PAÍS DE DESTINOMolybdenite Concentrate Exports by Destination(toneladas métricas de molibdeno fino) / (Mt Molybdenum Content) 1991 1992 1993 1994 1995 1996 1997 1998 1999 2000
euroPA / europe 247 183 325 451 1.875 1.075 1.931 2.605 0 609 alemania / Germany - - - 447 - - - - - -
austria - - - - - - - - - -
bélgica / belgium 238 - - - - - - - - -
españa / Spain - - - - - 54 - - - -
holanda / netherlands 9 183 325 - 1.767 1.020 - 462 - 609
italia / italy - - - 4 3 - - - - -
reino Unido / United kingdom - - - - 106 - 1.931 2.143 - -
Suecia / Sweden - - - - - - - - -
AMÉricA / America 0 0 (a) 0 33 0 2.573 3.564 507 1.027 brasil / brazil - - - - 21 - - 26 - -
Canadá / Canada - - - - - - - - - -
estados Unidos / USa - - - - 12 - 2.573 3.538 507 1.027
México / Mexico - - - - - - - - - -
panamá / panama - - - - - - - - - -
Venezuela - - (a) - - - - - - -
AsiA 0 (a) 1 0 1.405 1.083 0 622 368 114 Corea del Sur / South korea - - - - 42 11 - - - -
China - - - - - - - - 368 114
emiratos Árabes / arab emirates - - - - - - - - - -
hong kong - - - - - - - 292 - -
india - - - - - - - - - (a)
irán / iran - - - - - - - - - -
Japón / Japan - (a) 1 - 1.352 1.073 - 330 - -
tailandia / thailand - - - - - - - - - -
taiwán / taiwan - - - - - - - - - (a)
turquía / turkey - - - - - - - - - -
Vietnam - - - - 11 - - - - -
otroS / other - - - - - - - - -
otros/ other 0 0 0 0 0 10 0 0 0 0 Sudáfrica / South africa - - - - - 10 - - - -
otroS / other - - - - - - - - - -
totAl 247 183 326 451 3.313 2.168 4.504 6.791 875 1.750 (a) Cifra inferior a 0,5 tM / Under 0.5 Mt. Fuente / Source: Comisión Chilena del Cobre / Chilean Copper Commission.
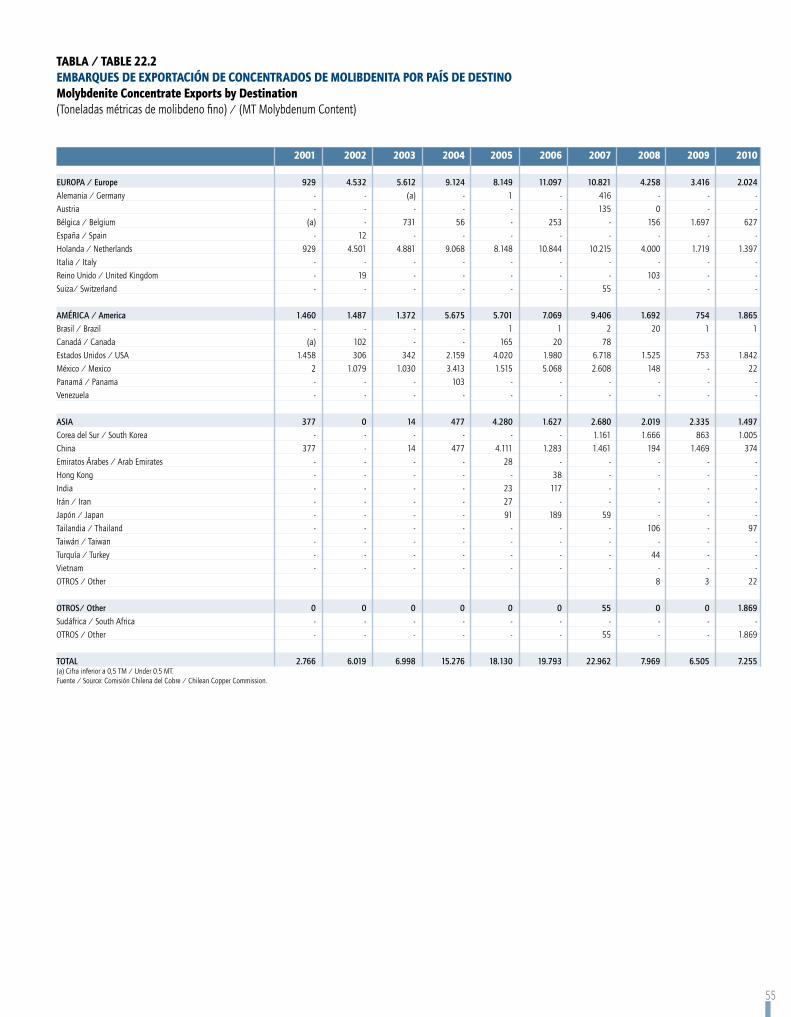
55
TABLA / TABLE 22.2 EMBARQUES DE EXPORTACIÓN DE CONCENTRADOS DE MOLIBDENITA POR PAÍS DE DESTINOMolybdenite Concentrate Exports by Destination(toneladas métricas de molibdeno fino) / (Mt Molybdenum Content)
2001 2002 2003 2004 2005 2006 2007 2008 2009 2010
euroPA / europe 929 4.532 5.612 9.124 8.149 11.097 10.821 4.258 3.416 2.024 alemania / Germany - - (a) - 1 - 416 - - -
austria - - - - - - 135 0 - -
bélgica / belgium (a) - 731 56 - 253 - 156 1.697 627
españa / Spain - 12 - - - - - - - -
holanda / netherlands 929 4.501 4.881 9.068 8.148 10.844 10.215 4.000 1.719 1.397
italia / italy - - - - - - - - - -
reino Unido / United kingdom - 19 - - - - - 103 - -
Suiza/ Switzerland - - - - - - 55 - - -
AMÉricA / America 1.460 1.487 1.372 5.675 5.701 7.069 9.406 1.692 754 1.865 brasil / brazil - - - - 1 1 2 20 1 1
Canadá / Canada (a) 102 - - 165 20 78
estados Unidos / USa 1.458 306 342 2.159 4.020 1.980 6.718 1.525 753 1.842
México / Mexico 2 1.079 1.030 3.413 1.515 5.068 2.608 148 - 22
panamá / panama - - - 103 - - - - - -
Venezuela - - - - - - - - - -
AsiA 377 0 14 477 4.280 1.627 2.680 2.019 2.335 1.497 Corea del Sur / South korea - - - - - - 1.161 1.666 863 1.005
China 377 - 14 477 4.111 1.283 1.461 194 1.469 374
emiratos Árabes / arab emirates - - - - 28 - - - - -
hong kong - - - - - 38 - - - -
india - - - - 23 117 - - - -
irán / iran - - - - 27 - - - - -
Japón / Japan - - - - 91 189 59 - - -
tailandia / thailand - - - - - - - 106 - 97
taiwán / taiwan - - - - - - - - - -
turquía / turkey - - - - - - - 44 - -
Vietnam - - - - - - - - - -
otroS / other 8 3 22
otros/ other 0 0 0 0 0 0 55 0 0 1.869 Sudáfrica / South africa - - - - - - - - - -
otroS / other - - - - - - 55 - - 1.869
totAl 2.766 6.019 6.998 15.276 18.130 19.793 22.962 7.969 6.505 7.255 (a) Cifra inferior a 0,5 tM / Under 0.5 Mt. Fuente / Source: Comisión Chilena del Cobre / Chilean Copper Commission.
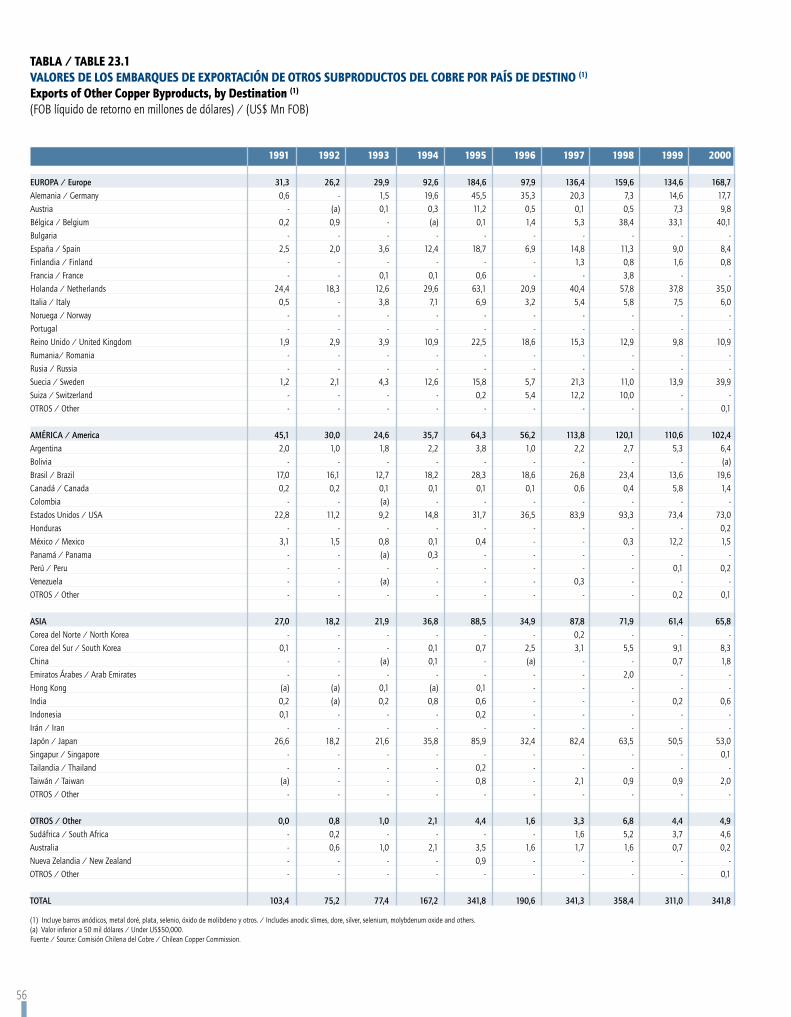
56
TABLA / TABLE 23.1VALORES DE LOS EMBARQUES DE EXPORTACIÓN DE OTROS SUBPRODUCTOS DEL COBRE POR PAÍS DE DESTINO (1)
Exports of Other Copper Byproducts, by Destination (1)
(Fob líquido de retorno en millones de dólares) / (US$ Mn Fob) 1991 1992 1993 1994 1995 1996 1997 1998 1999 2000
euroPA / europe 31,3 26,2 29,9 92,6 184,6 97,9 136,4 159,6 134,6 168,7 alemania / Germany 0,6 - 1,5 19,6 45,5 35,3 20,3 7,3 14,6 17,7
austria - (a) 0,1 0,3 11,2 0,5 0,1 0,5 7,3 9,8
bélgica / belgium 0,2 0,9 - (a) 0,1 1,4 5,3 38,4 33,1 40,1
bulgaria - - - - - - - - - -
españa / Spain 2,5 2,0 3,6 12,4 18,7 6,9 14,8 11,3 9,0 8,4
Finlandia / Finland - - - - - - 1,3 0,8 1,6 0,8
Francia / France - - 0,1 0,1 0,6 - - 3,8 - -
holanda / netherlands 24,4 18,3 12,6 29,6 63,1 20,9 40,4 57,8 37,8 35,0
italia / italy 0,5 - 3,8 7,1 6,9 3,2 5,4 5,8 7,5 6,0
noruega / norway - - - - - - - - - -
portugal - - - - - - - - - -
reino Unido / United kingdom 1,9 2,9 3,9 10,9 22,5 18,6 15,3 12,9 9,8 10,9
rumania/ romania - - - - - - - - - -
rusia / russia - - - - - - - - - -
Suecia / Sweden 1,2 2,1 4,3 12,6 15,8 5,7 21,3 11,0 13,9 39,9
Suiza / Switzerland - - - - 0,2 5,4 12,2 10,0 - -
otroS / other - - - - - - - - - 0,1
AMÉricA / America 45,1 30,0 24,6 35,7 64,3 56,2 113,8 120,1 110,6 102,4 argentina 2,0 1,0 1,8 2,2 3,8 1,0 2,2 2,7 5,3 6,4
bolivia - - - - - - - - - (a)
brasil / brazil 17,0 16,1 12,7 18,2 28,3 18,6 26,8 23,4 13,6 19,6
Canadá / Canada 0,2 0,2 0,1 0,1 0,1 0,1 0,6 0,4 5,8 1,4
Colombia - - (a) - - - - - - -
estados Unidos / USa 22,8 11,2 9,2 14,8 31,7 36,5 83,9 93,3 73,4 73,0
honduras - - - - - - - - - 0,2
México / Mexico 3,1 1,5 0,8 0,1 0,4 - - 0,3 12,2 1,5
panamá / panama - - (a) 0,3 - - - - - -
perú / peru - - - - - - - - 0,1 0,2
Venezuela - - (a) - - - 0,3 - - -
otroS / other - - - - - - - - 0,2 0,1
AsiA 27,0 18,2 21,9 36,8 88,5 34,9 87,8 71,9 61,4 65,8 Corea del norte / north korea - - - - - - 0,2 - - -
Corea del Sur / South korea 0,1 - - 0,1 0,7 2,5 3,1 5,5 9,1 8,3
China - - (a) 0,1 - (a) - - 0,7 1,8
emiratos Árabes / arab emirates - - - - - - - 2,0 - -
hong kong (a) (a) 0,1 (a) 0,1 - - - - -
india 0,2 (a) 0,2 0,8 0,6 - - - 0,2 0,6
indonesia 0,1 - - - 0,2 - - - - -
irán / iran - - - - - - - - - -
Japón / Japan 26,6 18,2 21,6 35,8 85,9 32,4 82,4 63,5 50,5 53,0
Singapur / Singapore - - - - - - - - - 0,1
tailandia / thailand - - - - 0,2 - - - - -
taiwán / taiwan (a) - - - 0,8 - 2,1 0,9 0,9 2,0
otroS / other - - - - - - - - - -
otros / other 0,0 0,8 1,0 2,1 4,4 1,6 3,3 6,8 4,4 4,9 Sudáfrica / South africa - 0,2 - - - - 1,6 5,2 3,7 4,6
australia - 0,6 1,0 2,1 3,5 1,6 1,7 1,6 0,7 0,2
nueva Zelandia / new Zealand - - - - 0,9 - - - - -
otroS / other - - - - - - - - - 0,1
totAl 103,4 75,2 77,4 167,2 341,8 190,6 341,3 358,4 311,0 341,8
(1) incluye barros anódicos, metal doré, plata, selenio, óxido de molibdeno y otros. / includes anodic slimes, dore, silver, selenium, molybdenum oxide and others. (a) Valor inferior a 50 mil dólares / Under US$50,000. Fuente / Source: Comisión Chilena del Cobre / Chilean Copper Commission.
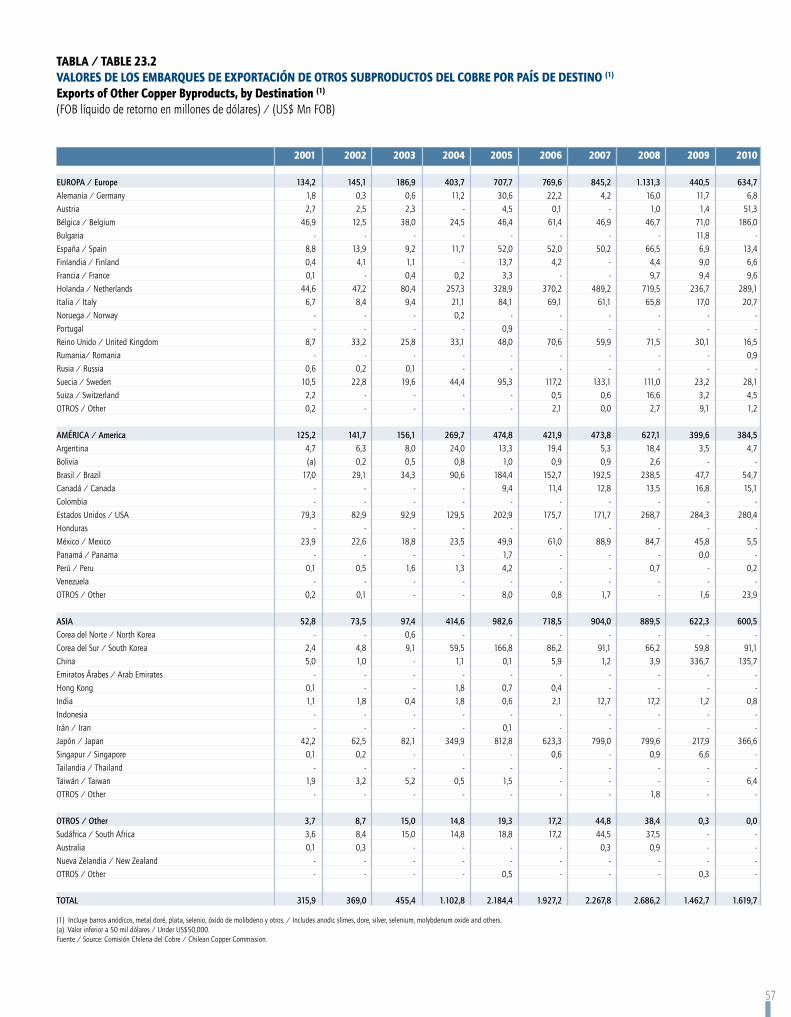
57
TABLA / TABLE 23.2VALORES DE LOS EMBARQUES DE EXPORTACIÓN DE OTROS SUBPRODUCTOS DEL COBRE POR PAÍS DE DESTINO (1)
Exports of Other Copper Byproducts, by Destination (1)
(Fob líquido de retorno en millones de dólares) / (US$ Mn Fob)
2001 2002 2003 2004 2005 2006 2007 2008 2009 2010
euroPA / europe 134,2 145,1 186,9 403,7 707,7 769,6 845,2 1.131,3 440,5 634,7 alemania / Germany 1,8 0,3 0,6 11,2 30,6 22,2 4,2 16,0 11,7 6,8
austria 2,7 2,5 2,3 - 4,5 0,1 - 1,0 1,4 51,3
bélgica / belgium 46,9 12,5 38,0 24,5 46,4 61,4 46,9 46,7 71,0 186,0
bulgaria - - - - - - - - 11,8 -
españa / Spain 8,8 13,9 9,2 11,7 52,0 52,0 50,2 66,5 6,9 13,4
Finlandia / Finland 0,4 4,1 1,1 - 13,7 4,2 - 4,4 9,0 6,6
Francia / France 0,1 - 0,4 0,2 3,3 - - 9,7 9,4 9,6
holanda / netherlands 44,6 47,2 80,4 257,3 328,9 370,2 489,2 719,5 236,7 289,1
italia / italy 6,7 8,4 9,4 21,1 84,1 69,1 61,1 65,8 17,0 20,7
noruega / norway - - - 0,2 - - - - - -
portugal - - - - 0,9 - - - - -
reino Unido / United kingdom 8,7 33,2 25,8 33,1 48,0 70,6 59,9 71,5 30,1 16,5
rumania/ romania - - - - - - - - - 0,9
rusia / russia 0,6 0,2 0,1 - - - - - - -
Suecia / Sweden 10,5 22,8 19,6 44,4 95,3 117,2 133,1 111,0 23,2 28,1
Suiza / Switzerland 2,2 - - - - 0,5 0,6 16,6 3,2 4,5
otroS / other 0,2 - - - - 2,1 0,0 2,7 9,1 1,2
AMÉricA / America 125,2 141,7 156,1 269,7 474,8 421,9 473,8 627,1 399,6 384,5 argentina 4,7 6,3 8,0 24,0 13,3 19,4 5,3 18,4 3,5 4,7
bolivia (a) 0,2 0,5 0,8 1,0 0,9 0,9 2,6 - -
brasil / brazil 17,0 29,1 34,3 90,6 184,4 152,7 192,5 238,5 47,7 54,7
Canadá / Canada - - - - 9,4 11,4 12,8 13,5 16,8 15,1
Colombia - - - - - - - - - -
estados Unidos / USa 79,3 82,9 92,9 129,5 202,9 175,7 171,7 268,7 284,3 280,4
honduras - - - - - - - - - -
México / Mexico 23,9 22,6 18,8 23,5 49,9 61,0 88,9 84,7 45,8 5,5
panamá / panama - - - - 1,7 - - - 0,0 -
perú / peru 0,1 0,5 1,6 1,3 4,2 - - 0,7 - 0,2
Venezuela - - - - - - - - - -
otroS / other 0,2 0,1 - - 8,0 0,8 1,7 - 1,6 23,9
AsiA 52,8 73,5 97,4 414,6 982,6 718,5 904,0 889,5 622,3 600,5 Corea del norte / north korea - - 0,6 - - - - - - -
Corea del Sur / South korea 2,4 4,8 9,1 59,5 166,8 86,2 91,1 66,2 59,8 91,1
China 5,0 1,0 - 1,1 0,1 5,9 1,2 3,9 336,7 135,7
emiratos Árabes / arab emirates - - - - - - - - - -
hong kong 0,1 - - 1,8 0,7 0,4 - - - -
india 1,1 1,8 0,4 1,8 0,6 2,1 12,7 17,2 1,2 0,8
indonesia - - - - - - - - - -
irán / iran - - - - 0,1 - - - - -
Japón / Japan 42,2 62,5 82,1 349,9 812,8 623,3 799,0 799,6 217,9 366,6
Singapur / Singapore 0,1 0,2 - - - 0,6 - 0,9 6,6 -
tailandia / thailand - - - - - - - - - -
taiwán / taiwan 1,9 3,2 5,2 0,5 1,5 - - - - 6,4
otroS / other - - - - - - - 1,8 - -
otros / other 3,7 8,7 15,0 14,8 19,3 17,2 44,8 38,4 0,3 0,0 Sudáfrica / South africa 3,6 8,4 15,0 14,8 18,8 17,2 44,5 37,5 - -
australia 0,1 0,3 - - - - 0,3 0,9 - -
nueva Zelandia / new Zealand - - - - - - - - - -
otroS / other - - - - 0,5 - - - 0,3 - totAl 315,9 369,0 455,4 1.102,8 2.184,4 1.927,2 2.267,8 2.686,2 1.462,7 1.619,7
(1) incluye barros anódicos, metal doré, plata, selenio, óxido de molibdeno y otros. / includes anodic slimes, dore, silver, selenium, molybdenum oxide and others.(a) Valor inferior a 50 mil dólares / Under US$50,000. Fuente / Source: Comisión Chilena del Cobre / Chilean Copper Commission.
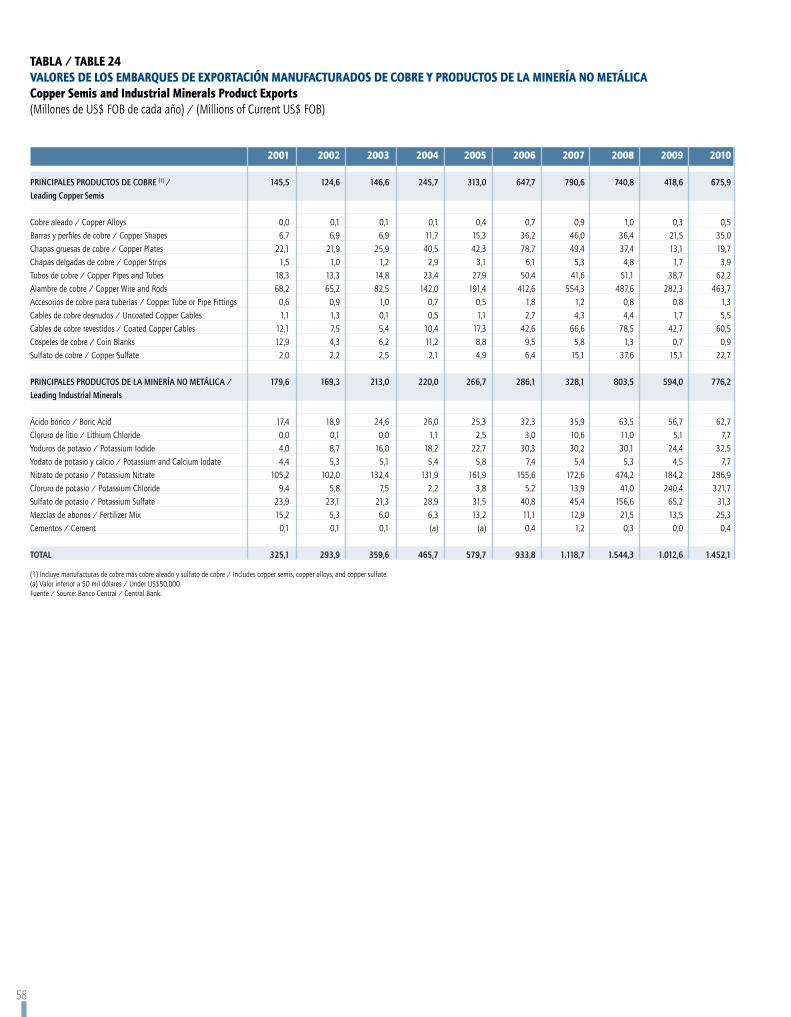
58
TABLA / TABLE 24VALORES DE LOS EMBARQUES DE EXPORTACIÓN MANUFACTURADOS DE COBRE Y PRODUCTOS DE LA MINERÍA NO METÁLICA Copper Semis and Industrial Minerals Product Exports (Millones de US$ Fob de cada año) / (Millions of Current US$ Fob)
2001 2002 2003 2004 2005 2006 2007 2008 2009 2010
PrinciPAles Productos de cobre (1) / 145,5 124,6 146,6 245,7 313,0 647,7 790,6 740,8 418,6 675,9 leading copper semis
Cobre aleado / Copper alloys 0,0 0,1 0,1 0,1 0,4 0,7 0,9 1,0 0,3 0,5
barras y perfiles de cobre / Copper Shapes 6,7 6,9 6,9 11,7 15,3 36,2 46,0 36,4 21,5 35,0
Chapas gruesas de cobre / Copper plates 22,1 21,9 25,9 40,5 42,3 78,7 49,4 37,4 13,1 19,7
Chapas delgadas de cobre / Copper Strips 1,5 1,0 1,2 2,9 3,1 6,1 5,3 4,8 1,7 3,9
tubos de cobre / Copper pipes and tubes 18,3 13,3 14,8 23,4 27,9 50,4 41,6 51,1 38,7 62,2
alambre de cobre / Copper Wire and rods 68,2 65,2 82,5 142,0 191,4 412,6 554,3 487,6 282,3 463,7
accesorios de cobre para tuberías / Copper tube or pipe Fittings 0,6 0,9 1,0 0,7 0,5 1,8 1,2 0,8 0,8 1,3
Cables de cobre desnudos / Uncoated Copper Cables 1,1 1,3 0,1 0,5 1,1 2,7 4,3 4,4 1,7 5,5
Cables de cobre revestidos / Coated Copper Cables 12,1 7,5 5,4 10,4 17,3 42,6 66,6 78,5 42,7 60,5
Cospeles de cobre / Coin blanks 12,9 4,3 6,2 11,2 8,8 9,5 5,8 1,3 0,7 0,9
Sulfato de cobre / Copper Sulfate 2,0 2,2 2,5 2,1 4,9 6,4 15,1 37,6 15,1 22,7
PrinciPAles Productos de lA MineríA no MetÁlicA / 179,6 169,3 213,0 220,0 266,7 286,1 328,1 803,5 594,0 776,2 leading industrial Minerals
Ácido bórico / boric acid 17,4 18,9 24,6 26,0 25,3 32,3 35,9 63,5 56,7 62,7
Cloruro de litio / lithium Chloride 0,0 0,1 0,0 1,1 2,5 3,0 10,6 11,0 5,1 7,7
Yoduros de potasio / potassium iodide 4,0 8,7 16,0 18,2 22,7 30,3 30,2 30,1 24,4 32,5
Yodato de potasio y calcio / potassium and Calcium iodate 4,4 5,3 5,1 5,4 5,8 7,4 5,4 5,3 4,5 7,7
nitrato de potasio / potassium nitrate 105,2 102,0 132,4 131,9 161,9 155,6 172,6 474,2 184,2 286,9
Cloruro de potasio / potassium Chloride 9,4 5,8 7,5 2,2 3,8 5,2 13,9 41,0 240,4 321,7
Sulfato de potasio / potassium Sulfate 23,9 23,1 21,3 28,9 31,5 40,8 45,4 156,6 65,2 31,3
Mezclas de abonos / Fertilizer Mix 15,2 5,3 6,0 6,3 13,2 11,1 12,9 21,5 13,5 25,3
Cementos / Cement 0,1 0,1 0,1 (a) (a) 0,4 1,2 0,3 0,0 0,4
totAl 325,1 293,9 359,6 465,7 579,7 933,8 1.118,7 1.544,3 1.012,6 1.452,1
(1) incluye manufacturas de cobre más cobre aleado y sulfato de cobre / includes copper semis, copper alloys, and copper sulfate.(a) Valor inferior a 50 mil dólares / Under US$50,000. Fuente / Source: banco Central / Central bank.
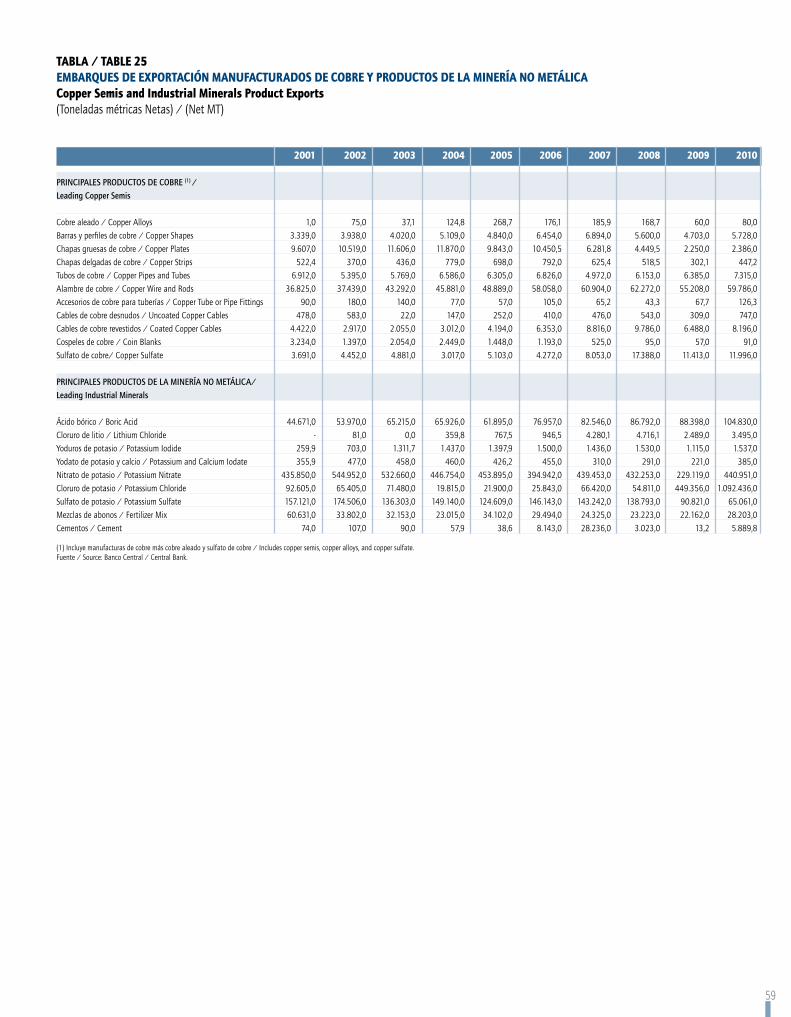
59
TABLA / TABLE 25 EMBARQUES DE EXPORTACIÓN MANUFACTURADOS DE COBRE Y PRODUCTOS DE LA MINERÍA NO METÁLICA Copper Semis and Industrial Minerals Product Exports(toneladas métricas netas) / (net Mt)
2001 2002 2003 2004 2005 2006 2007 2008 2009 2010
PrinciPAles Productos de cobre (1) / leading copper semis
Cobre aleado / Copper alloys 1,0 75,0 37,1 124,8 268,7 176,1 185,9 168,7 60,0 80,0
barras y perfiles de cobre / Copper Shapes 3.339,0 3.938,0 4.020,0 5.109,0 4.840,0 6.454,0 6.894,0 5.600,0 4.703,0 5.728,0
Chapas gruesas de cobre / Copper plates 9.607,0 10.519,0 11.606,0 11.870,0 9.843,0 10.450,5 6.281,8 4.449,5 2.250,0 2.386,0
Chapas delgadas de cobre / Copper Strips 522,4 370,0 436,0 779,0 698,0 792,0 625,4 518,5 302,1 447,2
tubos de cobre / Copper pipes and tubes 6.912,0 5.395,0 5.769,0 6.586,0 6.305,0 6.826,0 4.972,0 6.153,0 6.385,0 7.315,0
alambre de cobre / Copper Wire and rods 36.825,0 37.439,0 43.292,0 45.881,0 48.889,0 58.058,0 60.904,0 62.272,0 55.208,0 59.786,0
accesorios de cobre para tuberías / Copper tube or pipe Fittings 90,0 180,0 140,0 77,0 57,0 105,0 65,2 43,3 67,7 126,3
Cables de cobre desnudos / Uncoated Copper Cables 478,0 583,0 22,0 147,0 252,0 410,0 476,0 543,0 309,0 747,0
Cables de cobre revestidos / Coated Copper Cables 4.422,0 2.917,0 2.055,0 3.012,0 4.194,0 6.353,0 8.816,0 9.786,0 6.488,0 8.196,0
Cospeles de cobre / Coin blanks 3.234,0 1.397,0 2.054,0 2.449,0 1.448,0 1.193,0 525,0 95,0 57,0 91,0
Sulfato de cobre/ Copper Sulfate 3.691,0 4.452,0 4.881,0 3.017,0 5.103,0 4.272,0 8.053,0 17.388,0 11.413,0 11.996,0
PrinciPAles Productos de lA MineríA no MetÁlicA/ leading industrial Minerals
Ácido bórico / boric acid 44.671,0 53.970,0 65.215,0 65.926,0 61.895,0 76.957,0 82.546,0 86.792,0 88.398,0 104.830,0
Cloruro de litio / lithium Chloride - 81,0 0,0 359,8 767,5 946,5 4.280,1 4.716,1 2.489,0 3.495,0
Yoduros de potasio / potassium iodide 259,9 703,0 1.311,7 1.437,0 1.397,9 1.500,0 1.436,0 1.530,0 1.115,0 1.537,0
Yodato de potasio y calcio / potassium and Calcium iodate 355,9 477,0 458,0 460,0 426,2 455,0 310,0 291,0 221,0 385,0
nitrato de potasio / potassium nitrate 435.850,0 544.952,0 532.660,0 446.754,0 453.895,0 394.942,0 439.453,0 432.253,0 229.119,0 440.951,0
Cloruro de potasio / potassium Chloride 92.605,0 65.405,0 71.480,0 19.815,0 21.900,0 25.843,0 66.420,0 54.811,0 449.356,0 1.092.436,0
Sulfato de potasio / potassium Sulfate 157.121,0 174.506,0 136.303,0 149.140,0 124.609,0 146.143,0 143.242,0 138.793,0 90.821,0 65.061,0
Mezclas de abonos / Fertilizer Mix 60.631,0 33.802,0 32.153,0 23.015,0 34.102,0 29.494,0 24.325,0 23.223,0 22.162,0 28.203,0
Cementos / Cement 74,0 107,0 90,0 57,9 38,6 8.143,0 28.236,0 3.023,0 13,2 5.889,8
(1) incluye manufacturas de cobre más cobre aleado y sulfato de cobre / includes copper semis, copper alloys, and copper sulfate. Fuente / Source: banco Central / Central bank.

60

61
1.3ANTECEDENTES DE LOS CONTRATOS DE EXPORTACIONES CHILENAS DE COBRE AÑO 2010cHileAn coPPer eXPort contrActs - 2010
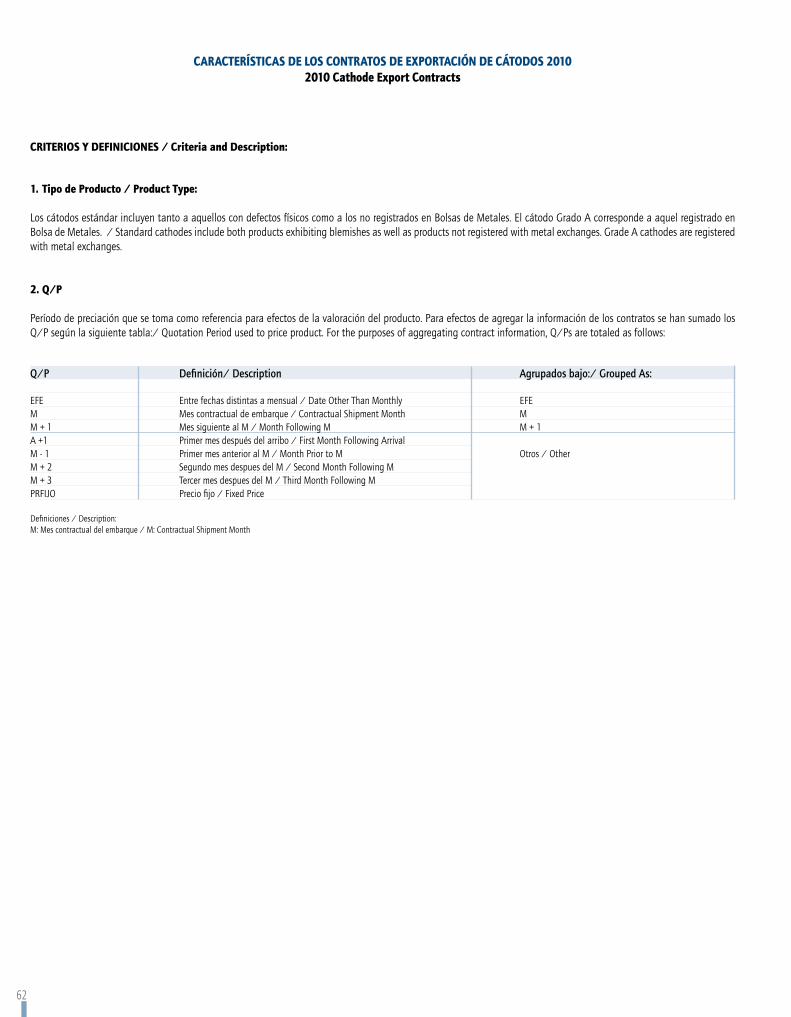
62
CARACTERÍSTICAS DE LOS CONTRATOS DE EXPORTACIÓN DE CÁTODOS 20102010 Cathode Export Contracts
CRITERIOS Y DEFINICIONES / Criteria and Description:
1. Tipo de Producto / Product Type:
los cátodos estándar incluyen tanto a aquellos con defectos físicos como a los no registrados en bolsas de Metales. el cátodo Grado a corresponde a aquel registrado en bolsa de Metales. / Standard cathodes include both products exhibiting blemishes as well as products not registered with metal exchanges. Grade a cathodes are registered with metal exchanges.
2. Q/P
período de preciación que se toma como referencia para efectos de la valoración del producto. para efectos de agregar la información de los contratos se han sumado los Q/p según la siguiente tabla:/ Quotation period used to price product. For the purposes of aggregating contract information, Q/ps are totaled as follows:
Q/P definición/ description Agrupados bajo:/ Grouped As:
eFe entre fechas distintas a mensual / date other than Monthly eFeM Mes contractual de embarque / Contractual Shipment Month MM + 1 Mes siguiente al M / Month Following M M + 1a +1 primer mes después del arribo / First Month Following arrival M - 1 primer mes anterior al M / Month prior to M otros / otherM + 2 Segundo mes despues del M / Second Month Following M M + 3 tercer mes despues del M / third Month Following M prFiJo precio fijo / Fixed price
definiciones / description:M: Mes contractual del embarque / M: Contractual Shipment Month
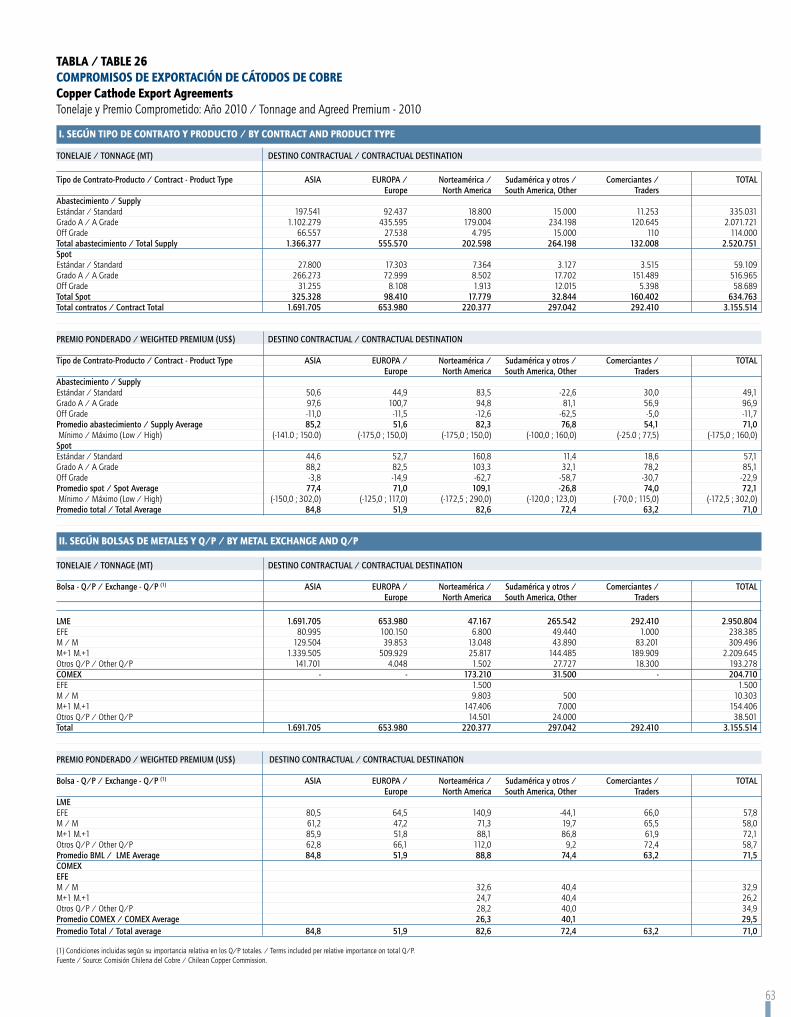
63
TABLA / TABLE 26 COMPROMISOS DE EXPORTACIÓN DE CÁTODOS DE COBRE Copper Cathode Export Agreements tonelaje y premio Comprometido: año 2010 / tonnage and agreed premium - 2010
I. SEGÚN TIPO DE CONTRATO Y PRODUCTO / BY CONTRACT AND PRODUCT TYPE tonelAJe / tonnAGe (Mt) destino contrActuAl / contrActuAl destinAtion
tipo de contrato-Producto / contract - Product type AsiA euroPA / norteamérica / sudamérica y otros / comerciantes / totAl europe north America south America, other traders Abastecimiento / supply estándar / Standard 197.541 92.437 18.800 15.000 11.253 335.031 Grado a / a Grade 1.102.279 435.595 179.004 234.198 120.645 2.071.721 off Grade 66.557 27.538 4.795 15.000 110 114.000 total abastecimiento / total supply 1.366.377 555.570 202.598 264.198 132.008 2.520.751 spot estándar / Standard 27.800 17.303 7.364 3.127 3.515 59.109 Grado a / a Grade 266.273 72.999 8.502 17.702 151.489 516.965 off Grade 31.255 8.108 1.913 12.015 5.398 58.689 total spot 325.328 98.410 17.779 32.844 160.402 634.763 total contratos / contract total 1.691.705 653.980 220.377 297.042 292.410 3.155.514 PreMio PonderAdo / WeiGHted PreMiuM (us$) destino contrActuAl / contrActuAl destinAtion tipo de contrato-Producto / contract - Product type AsiA euroPA / norteamérica / sudamérica y otros / comerciantes / totAl europe north America south America, other traders Abastecimiento / supply estándar / Standard 50,6 44,9 83,5 -22,6 30,0 49,1Grado a / a Grade 97,6 100,7 94,8 81,1 56,9 96,9off Grade -11,0 -11,5 -12,6 -62,5 -5,0 -11,7Promedio abastecimiento / supply Average 85,2 51,6 82,3 76,8 54,1 71,0 Mínimo / Máximo (low / high) (-141.0 ; 150.0) (-175,0 ; 150,0) (-175,0 ; 150,0) (-100,0 ; 160,0) (-25.0 ; 77,5) (-175,0 ; 160,0)spot estándar / Standard 44,6 52,7 160,8 11,4 18,6 57,1Grado a / a Grade 88,2 82,5 103,3 32,1 78,2 85,1off Grade -3,8 -14,9 -62,7 -58,7 -30,7 -22,9Promedio spot / spot Average 77,4 71,0 109,1 -26,8 74,0 72,1 Mínimo / Máximo (low / high) (-150,0 ; 302,0) (-125,0 ; 117,0) (-172,5 ; 290,0) (-120,0 ; 123,0) (-70,0 ; 115,0) (-172,5 ; 302,0)Promedio total / total Average 84,8 51,9 82,6 72,4 63,2 71,0 II. SEGÚN BOLSAS DE METALES Y Q/P / BY METAL EXCHANGE AND Q/P
tonelAJe / tonnAGe (Mt) destino contrActuAl / contrActuAl destinAtion
bolsa - Q/P / exchange - Q/P (1) AsiA euroPA / norteamérica / sudamérica y otros / comerciantes / totAl europe north America south America, other traders
lMe 1.691.705 653.980 47.167 265.542 292.410 2.950.804 eFe 80.995 100.150 6.800 49.440 1.000 238.385 M / M 129.504 39.853 13.048 43.890 83.201 309.496 M+1 M.+1 1.339.505 509.929 25.817 144.485 189.909 2.209.645 otros Q/p / other Q/p 141.701 4.048 1.502 27.727 18.300 193.278 coMeX - - 173.210 31.500 - 204.710 eFe 1.500 1.500 M / M 9.803 500 10.303 M+1 M.+1 147.406 7.000 154.406 otros Q/p / other Q/p 14.501 24.000 38.501 total 1.691.705 653.980 220.377 297.042 292.410 3.155.514 PreMio PonderAdo / WeiGHted PreMiuM (us$) destino contrActuAl / contrActuAl destinAtion bolsa - Q/P / exchange - Q/P (1) AsiA euroPA / norteamérica / sudamérica y otros / comerciantes / totAl europe north America south America, other traderslMe eFe 80,5 64,5 140,9 -44,1 66,0 57,8M / M 61,2 47,2 71,3 19,7 65,5 58,0M+1 M.+1 85,9 51,8 88,1 86,8 61,9 72,1otros Q/p / other Q/p 62,8 66,1 112,0 9,2 72,4 58,7Promedio bMl / lMe Average 84,8 51,9 88,8 74,4 63,2 71,5coMeX eFe M / M 32,6 40,4 32,9M+1 M.+1 24,7 40,4 26,2otros Q/p / other Q/p 28,2 40,0 34,9Promedio coMeX / coMeX Average 26,3 40,1 29,5Promedio total / total average 84,8 51,9 82,6 72,4 63,2 71,0
(1) Condiciones incluidas según su importancia relativa en los Q/p totales. / terms included per relative importance on total Q/p. Fuente / Source: Comisión Chilena del Cobre / Chilean Copper Commission.
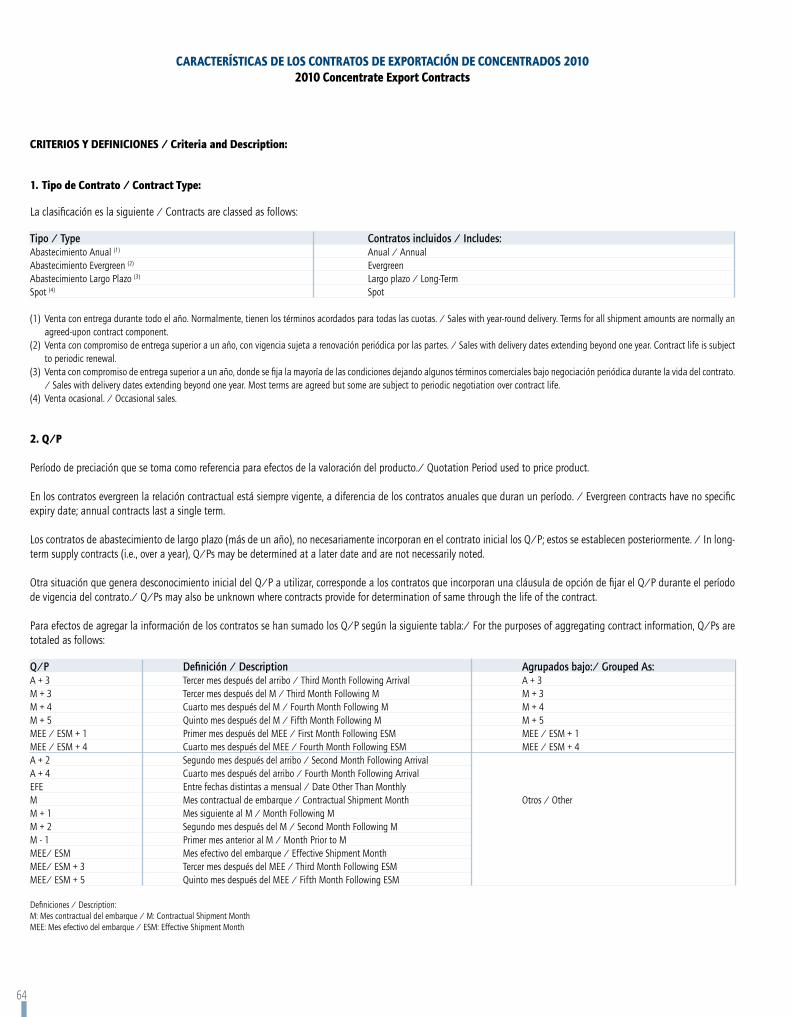
64
CARACTERÍSTICAS DE LOS CONTRATOS DE EXPORTACIÓN DE CONCENTRADOS 20102010 Concentrate Export Contracts
CRITERIOS Y DEFINICIONES / Criteria and Description:
1. Tipo de Contrato / Contract Type:
la clasificación es la siguiente / Contracts are classed as follows:
tipo / type contratos incluidos / includes: abastecimiento anual (1) anual / annualabastecimiento evergreen (2) evergreenabastecimiento largo plazo (3) largo plazo / long-termSpot (4) Spot
(1) Venta con entrega durante todo el año. normalmente, tienen los términos acordados para todas las cuotas. / Sales with year-round delivery. terms for all shipment amounts are normally an agreed-upon contract component.
(2) Venta con compromiso de entrega superior a un año, con vigencia sujeta a renovación periódica por las partes. / Sales with delivery dates extending beyond one year. Contract life is subject to periodic renewal.
(3) Venta con compromiso de entrega superior a un año, donde se fija la mayoría de las condiciones dejando algunos términos comerciales bajo negociación periódica durante la vida del contrato. / Sales with delivery dates extending beyond one year. Most terms are agreed but some are subject to periodic negotiation over contract life.
(4) Venta ocasional. / occasional sales.
2. Q/P
período de preciación que se toma como referencia para efectos de la valoración del producto./ Quotation period used to price product.
en los contratos evergreen la relación contractual está siempre vigente, a diferencia de los contratos anuales que duran un período. / evergreen contracts have no specific expiry date; annual contracts last a single term.
los contratos de abastecimiento de largo plazo (más de un año), no necesariamente incorporan en el contrato inicial los Q/p; estos se establecen posteriormente. / in long-term supply contracts (i.e., over a year), Q/ps may be determined at a later date and are not necessarily noted.
otra situación que genera desconocimiento inicial del Q/p a utilizar, corresponde a los contratos que incorporan una cláusula de opción de fijar el Q/p durante el período de vigencia del contrato./ Q/ps may also be unknown where contracts provide for determination of same through the life of the contract.
para efectos de agregar la información de los contratos se han sumado los Q/p según la siguiente tabla:/ For the purposes of aggregating contract information, Q/ps are totaled as follows: Q/P definición / description Agrupados bajo:/ Grouped As: a + 3 tercer mes después del arribo / third Month Following arrival a + 3M + 3 tercer mes después del M / third Month Following M M + 3M + 4 Cuarto mes después del M / Fourth Month Following M M + 4M + 5 Quinto mes después del M / Fifth Month Following M M + 5Mee / eSM + 1 primer mes después del Mee / First Month Following eSM Mee / eSM + 1Mee / eSM + 4 Cuarto mes después del Mee / Fourth Month Following eSM Mee / eSM + 4a + 2 Segundo mes después del arribo / Second Month Following arrivala + 4 Cuarto mes después del arribo / Fourth Month Following arrivaleFe entre fechas distintas a mensual / date other than MonthlyM Mes contractual de embarque / Contractual Shipment Month otros / otherM + 1 Mes siguiente al M / Month Following MM + 2 Segundo mes después del M / Second Month Following MM - 1 primer mes anterior al M / Month prior to MMee/ eSM Mes efectivo del embarque / effective Shipment Month Mee/ eSM + 3 tercer mes después del Mee / third Month Following eSMMee/ eSM + 5 Quinto mes después del Mee / Fifth Month Following eSM
definiciones / description:M: Mes contractual del embarque / M: Contractual Shipment MonthMee: Mes efectivo del embarque / eSM: effective Shipment Month
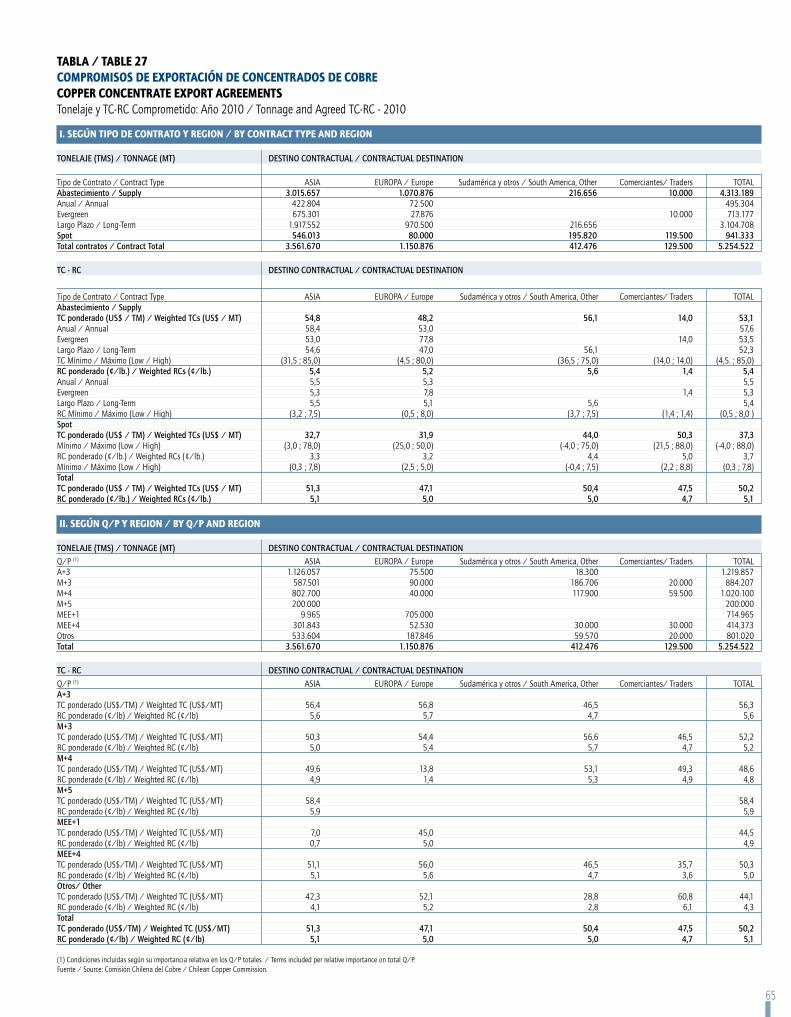
65
TABLA / TABLE 27
COMPROMISOS DE EXPORTACIÓN DE CONCENTRADOS DE COBRE
COPPER CONCENTRATE EXPORT AGREEMENTS
tonelaje y tC-rC Comprometido: año 2010 / tonnage and agreed tC-rC - 2010
I. SEGÚN TIPO DE CONTRATO Y REGION / BY CONTRACT TYPE AND REGION
tonelAJe (tMs) / tonnAGe (Mt) destino contrActuAl / contrActuAl destinAtion
tipo de Contrato / Contract type aSia eUropa / europe Sudamérica y otros / South america, other Comerciantes/ traders total Abastecimiento / supply 3.015.657 1.070.876 216.656 10.000 4.313.189 anual / annual 422.804 72.500 495.304 evergreen 675.301 27.876 10.000 713.177 largo plazo / long-term 1.917.552 970.500 216.656 3.104.708 spot 546.013 80.000 195.820 119.500 941.333 total contratos / contract total 3.561.670 1.150.876 412.476 129.500 5.254.522
tc - rc destino contrActuAl / contrActuAl destinAtion
tipo de Contrato / Contract type aSia eUropa / europe Sudamérica y otros / South america, other Comerciantes/ traders total Abastecimiento / supply tc ponderado (us$ / tM) / Weighted tcs (us$ / Mt) 54,8 48,2 56,1 14,0 53,1anual / annual 58,4 53,0 57,6evergreen 53,0 77,8 14,0 53,5largo plazo / long-term 54,6 47,0 56,1 52,3tC Mínimo / Máximo (low / high) (31,5 ; 85,0) (4,5 ; 80,0) (36,5 ; 75,0) (14,0 ; 14,0) (4,5. ; 85,0)rc ponderado (¢/lb.) / Weighted rcs (¢/lb.) 5,4 5,2 5,6 1,4 5,4anual / annual 5,5 5,3 5,5evergreen 5,3 7,8 1,4 5,3largo plazo / long-term 5,5 5,1 5,6 5,4rC Mínimo / Máximo (low / high) (3,2 ; 7,5) (0,5 ; 8,0) (3,7 ; 7,5) (1,4 ; 1,4) (0,5 ; 8,0 )spot tc ponderado (us$ / tM) / Weighted tcs (us$ / Mt) 32,7 31,9 44,0 50,3 37,3Mínimo / Máximo (low / high) (3,0 ; 78,0) (25,0 ; 50,0) (-4,0 ; 75,0) (21,5 ; 88,0) (-4,0 ; 88,0)rC ponderado (¢/lb.) / Weighted rCs (¢/lb.) 3,3 3,2 4,4 5,0 3,7Mínimo / Máximo (low / high) (0,3 ; 7,8) (2,5 ; 5,0) (-0,4 ; 7,5) (2,2 ; 8,8) (0,3 ; 7,8)total tc ponderado (us$ / tM) / Weighted tcs (us$ / Mt) 51,3 47,1 50,4 47,5 50,2rc ponderado (¢/lb.) / Weighted rcs (¢/lb.) 5,1 5,0 5,0 4,7 5,1
II. SEGÚN Q/P Y REGION / BY Q/P AND REGION
tonelAJe (tMs) / tonnAGe (Mt) destino contrActuAl / contrActuAl destinAtion Q/p (1) aSia eUropa / europe Sudamérica y otros / South america, other Comerciantes/ traders total a+3 1.126.057 75.500 18.300 1.219.857 M+3 587.501 90.000 186.706 20.000 884.207 M+4 802.700 40.000 117.900 59.500 1.020.100 M+5 200.000 200.000 Mee+1 9.965 705.000 714.965 Mee+4 301.843 52.530 30.000 30.000 414.373 otros 533.604 187.846 59.570 20.000 801.020 total 3.561.670 1.150.876 412.476 129.500 5.254.522
tc - rc destino contrActuAl / contrActuAl destinAtion Q/p (1) aSia eUropa / europe Sudamérica y otros / South america, other Comerciantes/ traders totalA+3 tC ponderado (US$/tM) / Weighted tC (US$/Mt) 56,4 56,8 46,5 56,3rC ponderado (¢/lb) / Weighted rC (¢/lb) 5,6 5,7 4,7 5,6M+3 tC ponderado (US$/tM) / Weighted tC (US$/Mt) 50,3 54,4 56,6 46,5 52,2rC ponderado (¢/lb) / Weighted rC (¢/lb) 5,0 5,4 5,7 4,7 5,2M+4 tC ponderado (US$/tM) / Weighted tC (US$/Mt) 49,6 13,8 53,1 49,3 48,6rC ponderado (¢/lb) / Weighted rC (¢/lb) 4,9 1,4 5,3 4,9 4,8M+5 tC ponderado (US$/tM) / Weighted tC (US$/Mt) 58,4 58,4rC ponderado (¢/lb) / Weighted rC (¢/lb) 5,9 5,9Mee+1 tC ponderado (US$/tM) / Weighted tC (US$/Mt) 7,0 45,0 44,5rC ponderado (¢/lb) / Weighted rC (¢/lb) 0,7 5,0 4,9Mee+4 tC ponderado (US$/tM) / Weighted tC (US$/Mt) 51,1 56,0 46,5 35,7 50,3rC ponderado (¢/lb) / Weighted rC (¢/lb) 5,1 5,6 4,7 3,6 5,0otros/ other tC ponderado (US$/tM) / Weighted tC (US$/Mt) 42,3 52,1 28,8 60,8 44,1rC ponderado (¢/lb) / Weighted rC (¢/lb) 4,1 5,2 2,8 6,1 4,3total tc ponderado (us$/tM) / Weighted tc (us$/Mt) 51,3 47,1 50,4 47,5 50,2rc ponderado (¢/lb) / Weighted rc (¢/lb) 5,1 5,0 5,0 4,7 5,1
(1) Condiciones incluidas según su importancia relativa en los Q/p totales. / terms included per relative importance on total Q/p. Fuente / Source: Comisión Chilena del Cobre / Chilean Copper Commission.

66

67
1.4EL SECTOR MINERO Y LA ECONOMÍA CHILENAcHileAn MininG sector And econoMy
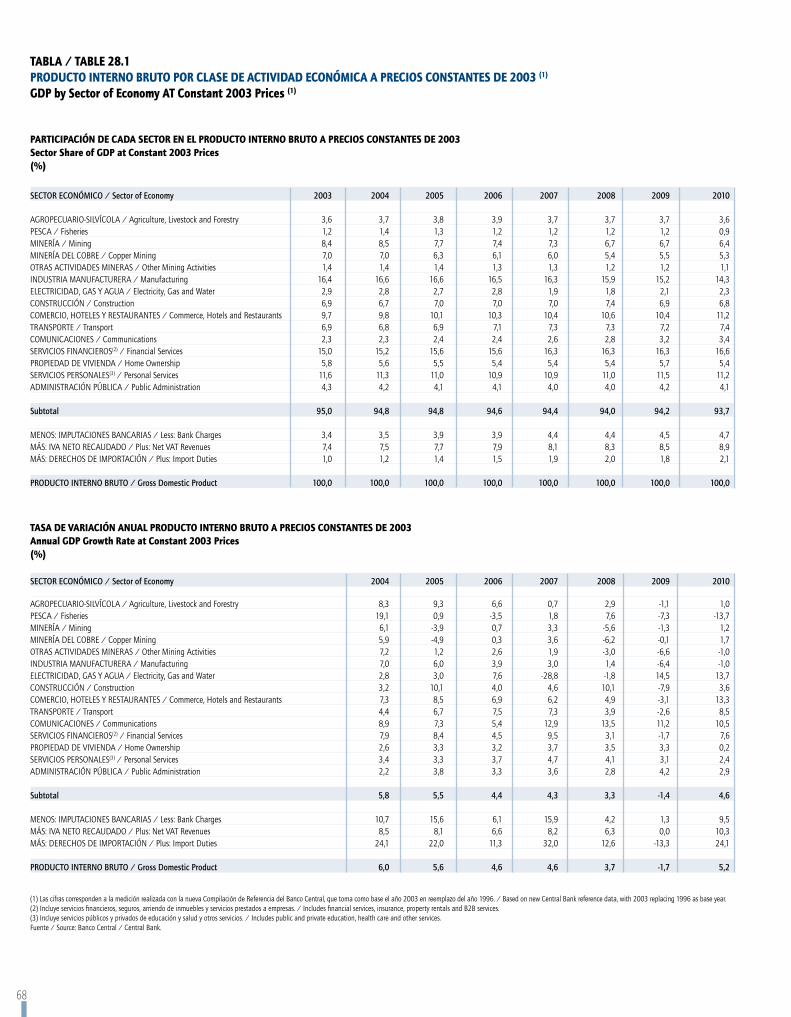
68
TABLA / TABLE 28.1 PRODUCTO INTERNO BRUTO POR CLASE DE ACTIVIDAD ECONÓMICA A PRECIOS CONSTANTES DE 2003 (1)
GDP by Sector of Economy AT Constant 2003 Prices (1)
PARTICIPACIÓN DE CADA SECTOR EN EL PRODUCTO INTERNO BRUTO A PRECIOS CONSTANTES DE 2003 Sector Share of GDP at Constant 2003 Prices (%)
sector econÓMico / sector of economy 2003 2004 2005 2006 2007 2008 2009 2010
aGropeCUario-SilVÍCola / agriculture, livestock and Forestry 3,6 3,7 3,8 3,9 3,7 3,7 3,7 3,6peSCa / Fisheries 1,2 1,4 1,3 1,2 1,2 1,2 1,2 0,9MinerÍa / Mining 8,4 8,5 7,7 7,4 7,3 6,7 6,7 6,4MinerÍa del Cobre / Copper Mining 7,0 7,0 6,3 6,1 6,0 5,4 5,5 5,3otraS aCtiVidadeS MineraS / other Mining activities 1,4 1,4 1,4 1,3 1,3 1,2 1,2 1,1indUStria ManUFaCtUrera / Manufacturing 16,4 16,6 16,6 16,5 16,3 15,9 15,2 14,3eleCtriCidad, GaS Y aGUa / electricity, Gas and Water 2,9 2,8 2,7 2,8 1,9 1,8 2,1 2,3ConStrUCCiÓn / Construction 6,9 6,7 7,0 7,0 7,0 7,4 6,9 6,8CoMerCio, hoteleS Y reStaUranteS / Commerce, hotels and restaurants 9,7 9,8 10,1 10,3 10,4 10,6 10,4 11,2tranSporte / transport 6,9 6,8 6,9 7,1 7,3 7,3 7,2 7,4CoMUniCaCioneS / Communications 2,3 2,3 2,4 2,4 2,6 2,8 3,2 3,4SerViCioS FinanCieroS(2) / Financial Services 15,0 15,2 15,6 15,6 16,3 16,3 16,3 16,6propiedad de ViVienda / home ownership 5,8 5,6 5,5 5,4 5,4 5,4 5,7 5,4SerViCioS perSonaleS(3) / personal Services 11,6 11,3 11,0 10,9 10,9 11,0 11,5 11,2adMiniStraCiÓn pÚbliCa / public administration 4,3 4,2 4,1 4,1 4,0 4,0 4,2 4,1 subtotal 95,0 94,8 94,8 94,6 94,4 94,0 94,2 93,7
MenoS: iMpUtaCioneS banCariaS / less: bank Charges 3,4 3,5 3,9 3,9 4,4 4,4 4,5 4,7MÁS: iVa neto reCaUdado / plus: net Vat revenues 7,4 7,5 7,7 7,9 8,1 8,3 8,5 8,9MÁS: dereChoS de iMportaCiÓn / plus: import duties 1,0 1,2 1,4 1,5 1,9 2,0 1,8 2,1 Producto interno bruto / Gross domestic Product 100,0 100,0 100,0 100,0 100,0 100,0 100,0 100,0
TASA DE VARIACIÓN ANUAL PRODUCTO INTERNO BRUTO A PRECIOS CONSTANTES DE 2003Annual GDP Growth Rate at Constant 2003 Prices (%)
sector econÓMico / sector of economy 2004 2005 2006 2007 2008 2009 2010
aGropeCUario-SilVÍCola / agriculture, livestock and Forestry 8,3 9,3 6,6 0,7 2,9 -1,1 1,0peSCa / Fisheries 19,1 0,9 -3,5 1,8 7,6 -7,3 -13,7MinerÍa / Mining 6,1 -3,9 0,7 3,3 -5,6 -1,3 1,2MinerÍa del Cobre / Copper Mining 5,9 -4,9 0,3 3,6 -6,2 -0,1 1,7otraS aCtiVidadeS MineraS / other Mining activities 7,2 1,2 2,6 1,9 -3,0 -6,6 -1,0indUStria ManUFaCtUrera / Manufacturing 7,0 6,0 3,9 3,0 1,4 -6,4 -1,0eleCtriCidad, GaS Y aGUa / electricity, Gas and Water 2,8 3,0 7,6 -28,8 -1,8 14,5 13,7ConStrUCCiÓn / Construction 3,2 10,1 4,0 4,6 10,1 -7,9 3,6CoMerCio, hoteleS Y reStaUranteS / Commerce, hotels and restaurants 7,3 8,5 6,9 6,2 4,9 -3,1 13,3tranSporte / transport 4,4 6,7 7,5 7,3 3,9 -2,6 8,5CoMUniCaCioneS / Communications 8,9 7,3 5,4 12,9 13,5 11,2 10,5SerViCioS FinanCieroS(2) / Financial Services 7,9 8,4 4,5 9,5 3,1 -1,7 7,6propiedad de ViVienda / home ownership 2,6 3,3 3,2 3,7 3,5 3,3 0,2SerViCioS perSonaleS(3) / personal Services 3,4 3,3 3,7 4,7 4,1 3,1 2,4adMiniStraCiÓn pÚbliCa / public administration 2,2 3,8 3,3 3,6 2,8 4,2 2,9
subtotal 5,8 5,5 4,4 4,3 3,3 -1,4 4,6 MenoS: iMpUtaCioneS banCariaS / less: bank Charges 10,7 15,6 6,1 15,9 4,2 1,3 9,5MÁS: iVa neto reCaUdado / plus: net Vat revenues 8,5 8,1 6,6 8,2 6,3 0,0 10,3MÁS: dereChoS de iMportaCiÓn / plus: import duties 24,1 22,0 11,3 32,0 12,6 -13,3 24,1 Producto interno bruto / Gross domestic Product 6,0 5,6 4,6 4,6 3,7 -1,7 5,2
(1) las cifras corresponden a la medición realizada con la nueva Compilación de referencia del banco Central, que toma como base el año 2003 en reemplazo del año 1996. / based on new Central bank reference data, with 2003 replacing 1996 as base year. (2) incluye servicios financieros, seguros, arriendo de inmuebles y servicios prestados a empresas. / includes financial services, insurance, property rentals and b2b services. (3) incluye servicios públicos y privados de educación y salud y otros servicios. / includes public and private education, health care and other services.Fuente / Source: banco Central / Central bank.
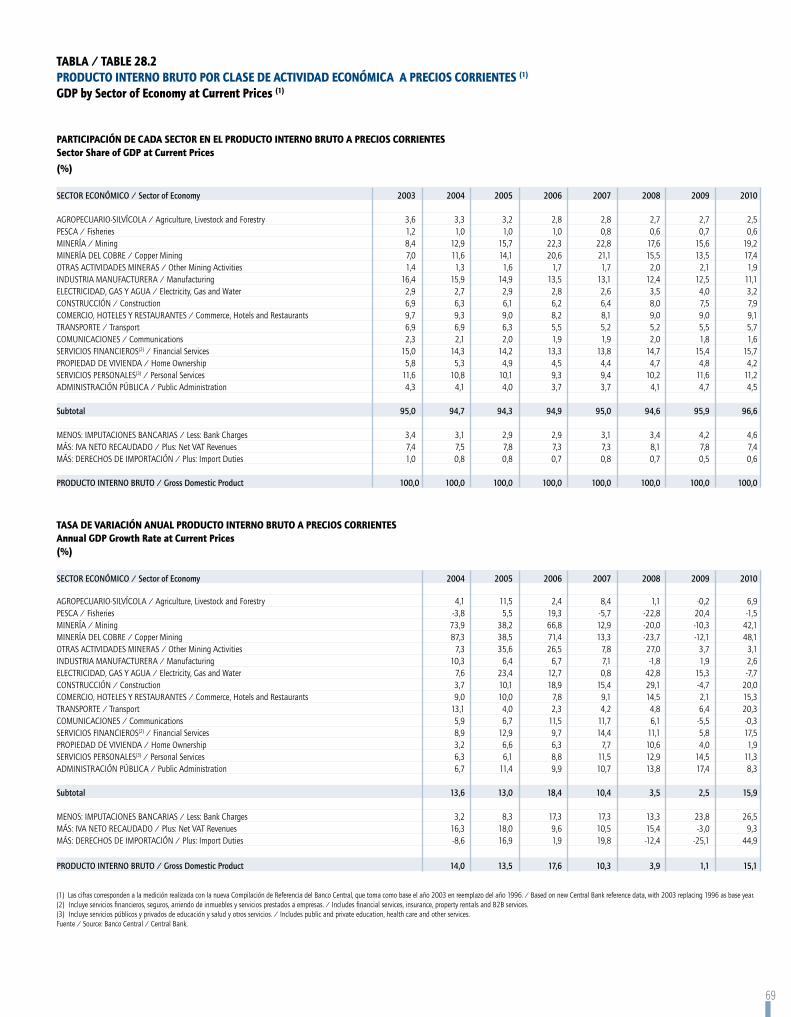
69
TABLA / TABLE 28.2 PRODUCTO INTERNO BRUTO POR CLASE DE ACTIVIDAD ECONÓMICA A PRECIOS CORRIENTES (1)
GDP by Sector of Economy at Current Prices (1)
PARTICIPACIÓN DE CADA SECTOR EN EL PRODUCTO INTERNO BRUTO A PRECIOS CORRIENTESSector Share of GDP at Current Prices
(%)
sector econÓMico / sector of economy 2003 2004 2005 2006 2007 2008 2009 2010
aGropeCUario-SilVÍCola / agriculture, livestock and Forestry 3,6 3,3 3,2 2,8 2,8 2,7 2,7 2,5peSCa / Fisheries 1,2 1,0 1,0 1,0 0,8 0,6 0,7 0,6MinerÍa / Mining 8,4 12,9 15,7 22,3 22,8 17,6 15,6 19,2MinerÍa del Cobre / Copper Mining 7,0 11,6 14,1 20,6 21,1 15,5 13,5 17,4otraS aCtiVidadeS MineraS / other Mining activities 1,4 1,3 1,6 1,7 1,7 2,0 2,1 1,9indUStria ManUFaCtUrera / Manufacturing 16,4 15,9 14,9 13,5 13,1 12,4 12,5 11,1eleCtriCidad, GaS Y aGUa / electricity, Gas and Water 2,9 2,7 2,9 2,8 2,6 3,5 4,0 3,2ConStrUCCiÓn / Construction 6,9 6,3 6,1 6,2 6,4 8,0 7,5 7,9CoMerCio, hoteleS Y reStaUranteS / Commerce, hotels and restaurants 9,7 9,3 9,0 8,2 8,1 9,0 9,0 9,1tranSporte / transport 6,9 6,9 6,3 5,5 5,2 5,2 5,5 5,7CoMUniCaCioneS / Communications 2,3 2,1 2,0 1,9 1,9 2,0 1,8 1,6SerViCioS FinanCieroS(2) / Financial Services 15,0 14,3 14,2 13,3 13,8 14,7 15,4 15,7propiedad de ViVienda / home ownership 5,8 5,3 4,9 4,5 4,4 4,7 4,8 4,2SerViCioS perSonaleS(3) / personal Services 11,6 10,8 10,1 9,3 9,4 10,2 11,6 11,2adMiniStraCiÓn pÚbliCa / public administration 4,3 4,1 4,0 3,7 3,7 4,1 4,7 4,5 subtotal 95,0 94,7 94,3 94,9 95,0 94,6 95,9 96,6 MenoS: iMpUtaCioneS banCariaS / less: bank Charges 3,4 3,1 2,9 2,9 3,1 3,4 4,2 4,6MÁS: iVa neto reCaUdado / plus: net Vat revenues 7,4 7,5 7,8 7,3 7,3 8,1 7,8 7,4MÁS: dereChoS de iMportaCiÓn / plus: import duties 1,0 0,8 0,8 0,7 0,8 0,7 0,5 0,6 Producto interno bruto / Gross domestic Product 100,0 100,0 100,0 100,0 100,0 100,0 100,0 100,0
TASA DE VARIACIÓN ANUAL PRODUCTO INTERNO BRUTO A PRECIOS CORRIENTESAnnual GDP Growth Rate at Current Prices(%)
sector econÓMico / sector of economy 2004 2005 2006 2007 2008 2009 2010
aGropeCUario-SilVÍCola / agriculture, livestock and Forestry 4,1 11,5 2,4 8,4 1,1 -0,2 6,9peSCa / Fisheries -3,8 5,5 19,3 -5,7 -22,8 20,4 -1,5MinerÍa / Mining 73,9 38,2 66,8 12,9 -20,0 -10,3 42,1MinerÍa del Cobre / Copper Mining 87,3 38,5 71,4 13,3 -23,7 -12,1 48,1otraS aCtiVidadeS MineraS / other Mining activities 7,3 35,6 26,5 7,8 27,0 3,7 3,1indUStria ManUFaCtUrera / Manufacturing 10,3 6,4 6,7 7,1 -1,8 1,9 2,6eleCtriCidad, GaS Y aGUa / electricity, Gas and Water 7,6 23,4 12,7 0,8 42,8 15,3 -7,7ConStrUCCiÓn / Construction 3,7 10,1 18,9 15,4 29,1 -4,7 20,0CoMerCio, hoteleS Y reStaUranteS / Commerce, hotels and restaurants 9,0 10,0 7,8 9,1 14,5 2,1 15,3tranSporte / transport 13,1 4,0 2,3 4,2 4,8 6,4 20,3CoMUniCaCioneS / Communications 5,9 6,7 11,5 11,7 6,1 -5,5 -0,3SerViCioS FinanCieroS(2) / Financial Services 8,9 12,9 9,7 14,4 11,1 5,8 17,5propiedad de ViVienda / home ownership 3,2 6,6 6,3 7,7 10,6 4,0 1,9SerViCioS perSonaleS(3) / personal Services 6,3 6,1 8,8 11,5 12,9 14,5 11,3adMiniStraCiÓn pÚbliCa / public administration 6,7 11,4 9,9 10,7 13,8 17,4 8,3
subtotal 13,6 13,0 18,4 10,4 3,5 2,5 15,9
MenoS: iMpUtaCioneS banCariaS / less: bank Charges 3,2 8,3 17,3 17,3 13,3 23,8 26,5MÁS: iVa neto reCaUdado / plus: net Vat revenues 16,3 18,0 9,6 10,5 15,4 -3,0 9,3MÁS: dereChoS de iMportaCiÓn / plus: import duties -8,6 16,9 1,9 19,8 -12,4 -25,1 44,9
Producto interno bruto / Gross domestic Product 14,0 13,5 17,6 10,3 3,9 1,1 15,1 (1) las cifras corresponden a la medición realizada con la nueva Compilación de referencia del banco Central, que toma como base el año 2003 en reemplazo del año 1996. / based on new Central bank reference data, with 2003 replacing 1996 as base year. (2) incluye servicios financieros, seguros, arriendo de inmuebles y servicios prestados a empresas. / includes financial services, insurance, property rentals and b2b services. (3) incluye servicios públicos y privados de educación y salud y otros servicios. / includes public and private education, health care and other services. Fuente / Source: banco Central / Central bank.
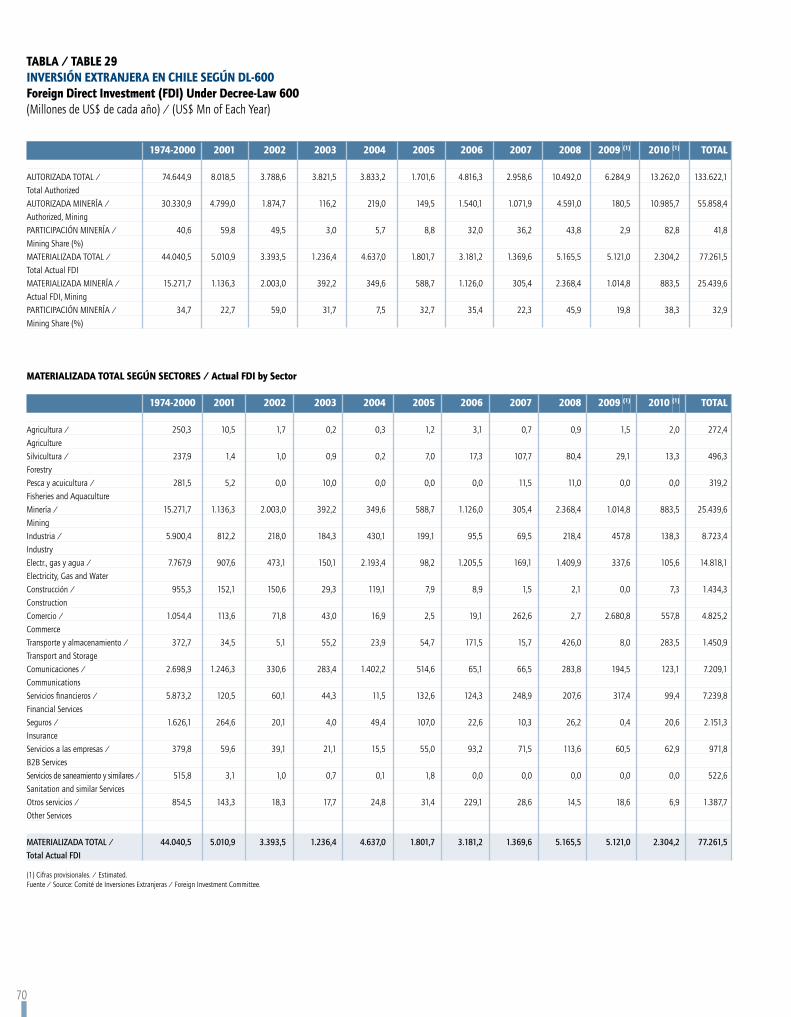
70
TABLA / TABLE 29 INVERSIÓN EXTRANJERA EN CHILE SEGÚN DL-600 Foreign Direct Investment (FDI) Under Decree-Law 600 (Millones de US$ de cada año) / (US$ Mn of each Year) 1974-2000 2001 2002 2003 2004 2005 2006 2007 2008 2009 (1) 2010 (1) TOTAL
aUtoriZada total / 74.644,9 8.018,5 3.788,6 3.821,5 3.833,2 1.701,6 4.816,3 2.958,6 10.492,0 6.284,9 13.262,0 133.622,1
total authorized
aUtoriZada MinerÍa / 30.330,9 4.799,0 1.874,7 116,2 219,0 149,5 1.540,1 1.071,9 4.591,0 180,5 10.985,7 55.858,4
authorized, Mining
partiCipaCiÓn MinerÍa / 40,6 59,8 49,5 3,0 5,7 8,8 32,0 36,2 43,8 2,9 82,8 41,8
Mining Share (%)
MaterialiZada total / 44.040,5 5.010,9 3.393,5 1.236,4 4.637,0 1.801,7 3.181,2 1.369,6 5.165,5 5.121,0 2.304,2 77.261,5
total actual Fdi
MaterialiZada MinerÍa / 15.271,7 1.136,3 2.003,0 392,2 349,6 588,7 1.126,0 305,4 2.368,4 1.014,8 883,5 25.439,6
actual Fdi, Mining
partiCipaCiÓn MinerÍa / 34,7 22,7 59,0 31,7 7,5 32,7 35,4 22,3 45,9 19,8 38,3 32,9
Mining Share (%)
MATERIALIZADA TOTAL SEGÚN SECTORES / Actual FDI by Sector
1974-2000 2001 2002 2003 2004 2005 2006 2007 2008 2009 (1) 2010 (1) TOTAL
agricultura / 250,3 10,5 1,7 0,2 0,3 1,2 3,1 0,7 0,9 1,5 2,0 272,4
agriculture
Silvicultura / 237,9 1,4 1,0 0,9 0,2 7,0 17,3 107,7 80,4 29,1 13,3 496,3
Forestry
pesca y acuicultura / 281,5 5,2 0,0 10,0 0,0 0,0 0,0 11,5 11,0 0,0 0,0 319,2
Fisheries and aquaculture
Minería / 15.271,7 1.136,3 2.003,0 392,2 349,6 588,7 1.126,0 305,4 2.368,4 1.014,8 883,5 25.439,6
Mining
industria / 5.900,4 812,2 218,0 184,3 430,1 199,1 95,5 69,5 218,4 457,8 138,3 8.723,4
industry
electr., gas y agua / 7.767,9 907,6 473,1 150,1 2.193,4 98,2 1.205,5 169,1 1.409,9 337,6 105,6 14.818,1
electricity, Gas and Water
Construcción / 955,3 152,1 150,6 29,3 119,1 7,9 8,9 1,5 2,1 0,0 7,3 1.434,3
Construction
Comercio / 1.054,4 113,6 71,8 43,0 16,9 2,5 19,1 262,6 2,7 2.680,8 557,8 4.825,2
Commerce
transporte y almacenamiento / 372,7 34,5 5,1 55,2 23,9 54,7 171,5 15,7 426,0 8,0 283,5 1.450,9
transport and Storage
Comunicaciones / 2.698,9 1.246,3 330,6 283,4 1.402,2 514,6 65,1 66,5 283,8 194,5 123,1 7.209,1
Communications
Servicios financieros / 5.873,2 120,5 60,1 44,3 11,5 132,6 124,3 248,9 207,6 317,4 99,4 7.239,8
Financial Services
Seguros / 1.626,1 264,6 20,1 4,0 49,4 107,0 22,6 10,3 26,2 0,4 20,6 2.151,3
insurance
Servicios a las empresas / 379,8 59,6 39,1 21,1 15,5 55,0 93,2 71,5 113,6 60,5 62,9 971,8
b2b Services
Servicios de saneamiento y similares / 515,8 3,1 1,0 0,7 0,1 1,8 0,0 0,0 0,0 0,0 0,0 522,6
Sanitation and similar Services
otros servicios / 854,5 143,3 18,3 17,7 24,8 31,4 229,1 28,6 14,5 18,6 6,9 1.387,7
other Services
MAteriAliZAdA totAl / 44.040,5 5.010,9 3.393,5 1.236,4 4.637,0 1.801,7 3.181,2 1.369,6 5.165,5 5.121,0 2.304,2 77.261,5 total Actual Fdi
(1) Cifras provisionales. / estimated.Fuente / Source: Comité de inversiones extranjeras / Foreign investment Committee.
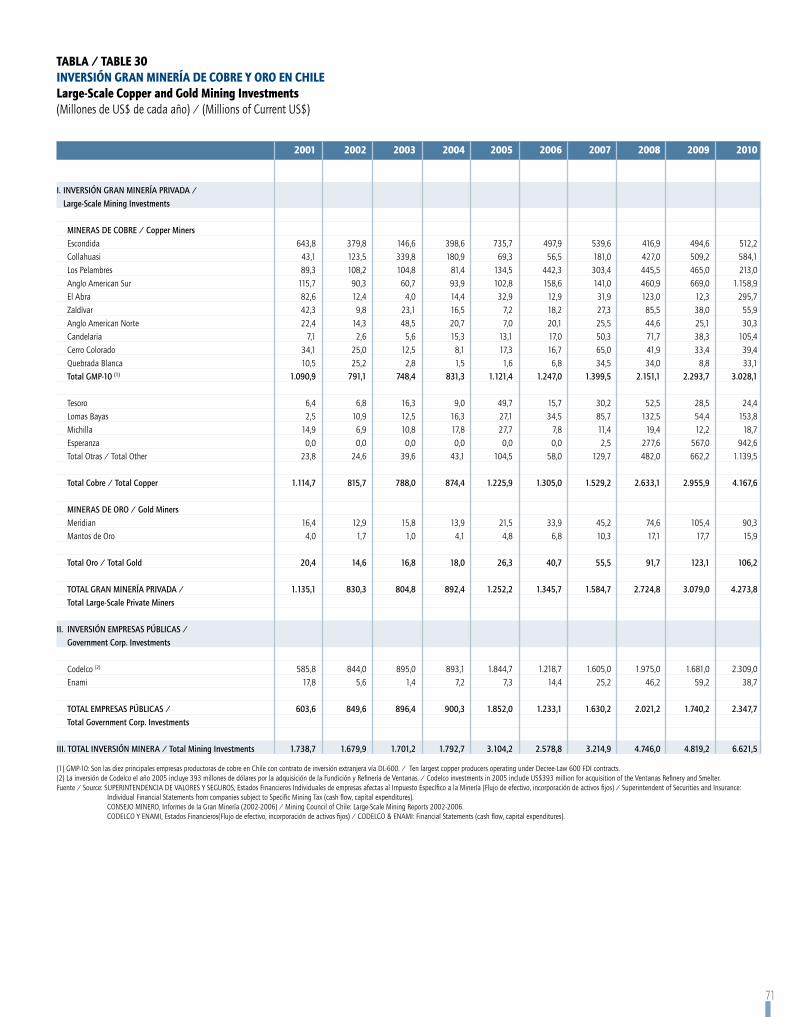
71
TABLA / TABLE 30 INVERSIÓN GRAN MINERÍA DE COBRE Y ORO EN CHILE Large-Scale Copper and Gold Mining Investments (Millones de US$ de cada año) / (Millions of Current US$)
2001 2002 2003 2004 2005 2006 2007 2008 2009 2010
i. inVersiÓn GrAn MineríA PriVAdA / large-scale Mining investments
MinerAs de cobre / copper Miners escondida 643,8 379,8 146,6 398,6 735,7 497,9 539,6 416,9 494,6 512,2
Collahuasi 43,1 123,5 339,8 180,9 69,3 56,5 181,0 427,0 509,2 584,1
los pelambres 89,3 108,2 104,8 81,4 134,5 442,3 303,4 445,5 465,0 213,0
anglo american Sur 115,7 90,3 60,7 93,9 102,8 158,6 141,0 460,9 669,0 1.158,9
el abra 82,6 12,4 4,0 14,4 32,9 12,9 31,9 123,0 12,3 295,7
Zaldívar 42,3 9,8 23,1 16,5 7,2 18,2 27,3 85,5 38,0 55,9
anglo american norte 22,4 14,3 48,5 20,7 7,0 20,1 25,5 44,6 25,1 30,3
Candelaria 7,1 2,6 5,6 15,3 13,1 17,0 50,3 71,7 38,3 105,4
Cerro Colorado 34,1 25,0 12,5 8,1 17,3 16,7 65,0 41,9 33,4 39,4
Quebrada blanca 10,5 25,2 2,8 1,5 1,6 6,8 34,5 34,0 8,8 33,1
total GMP-10 (1) 1.090,9 791,1 748,4 831,3 1.121,4 1.247,0 1.399,5 2.151,1 2.293,7 3.028,1
tesoro 6,4 6,8 16,3 9,0 49,7 15,7 30,2 52,5 28,5 24,4
lomas bayas 2,5 10,9 12,5 16,3 27,1 34,5 85,7 132,5 54,4 153,8
Michilla 14,9 6,9 10,8 17,8 27,7 7,8 11,4 19,4 12,2 18,7
esperanza 0,0 0,0 0,0 0,0 0,0 0,0 2,5 277,6 567,0 942,6
total otras / total other 23,8 24,6 39,6 43,1 104,5 58,0 129,7 482,0 662,2 1.139,5
total cobre / total copper 1.114,7 815,7 788,0 874,4 1.225,9 1.305,0 1.529,2 2.633,1 2.955,9 4.167,6
MinerAs de oro / Gold Miners Meridian 16,4 12,9 15,8 13,9 21,5 33,9 45,2 74,6 105,4 90,3
Mantos de oro 4,0 1,7 1,0 4,1 4,8 6,8 10,3 17,1 17,7 15,9
total oro / total Gold 20,4 14,6 16,8 18,0 26,3 40,7 55,5 91,7 123,1 106,2
totAl GrAn MineríA PriVAdA / 1.135,1 830,3 804,8 892,4 1.252,2 1.345,7 1.584,7 2.724,8 3.079,0 4.273,8 total large-scale Private Miners
ii. inVersiÓn eMPresAs PÚblicAs / Government corp. investments
Codelco (2) 585,8 844,0 895,0 893,1 1.844,7 1.218,7 1.605,0 1.975,0 1.681,0 2.309,0
enami 17,8 5,6 1,4 7,2 7,3 14,4 25,2 46,2 59,2 38,7
totAl eMPresAs PÚblicAs / 603,6 849,6 896,4 900,3 1.852,0 1.233,1 1.630,2 2.021,2 1.740,2 2.347,7 total Government corp. investments
iii. totAl inVersiÓn MinerA / total Mining investments 1.738,7 1.679,9 1.701,2 1.792,7 3.104,2 2.578,8 3.214,9 4.746,0 4.819,2 6.621,5
(1) GMp-10: Son las diez principales empresas productoras de cobre en Chile con contrato de inversión extranjera vía dl-600. / ten largest copper producers operating under decree-law 600 Fdi contracts.(2) la inversión de Codelco el año 2005 incluye 393 millones de dólares por la adquisición de la Fundición y refinería de Ventanas. / Codelco investments in 2005 include US$393 million for acquisition of the Ventanas refinery and Smelter.Fuente / Source: SUperintendenCia de ValoreS Y SeGUroS, estados Financieros individuales de empresas afectas al impuesto específico a la Minería (Flujo de efectivo, incorporación de activos fijos) / Superintendent of Securities and insurance: individual Financial Statements from companies subject to Specific Mining tax (cash flow, capital expenditures). ConSeJo Minero, informes de la Gran Minería (2002-2006) / Mining Council of Chile: large-Scale Mining reports 2002-2006. CodelCo Y enaMi, estados Financieros(Flujo de efectivo, incorporación de activos fijos) / CodelCo & enaMi: Financial Statements (cash flow, capital expenditures).
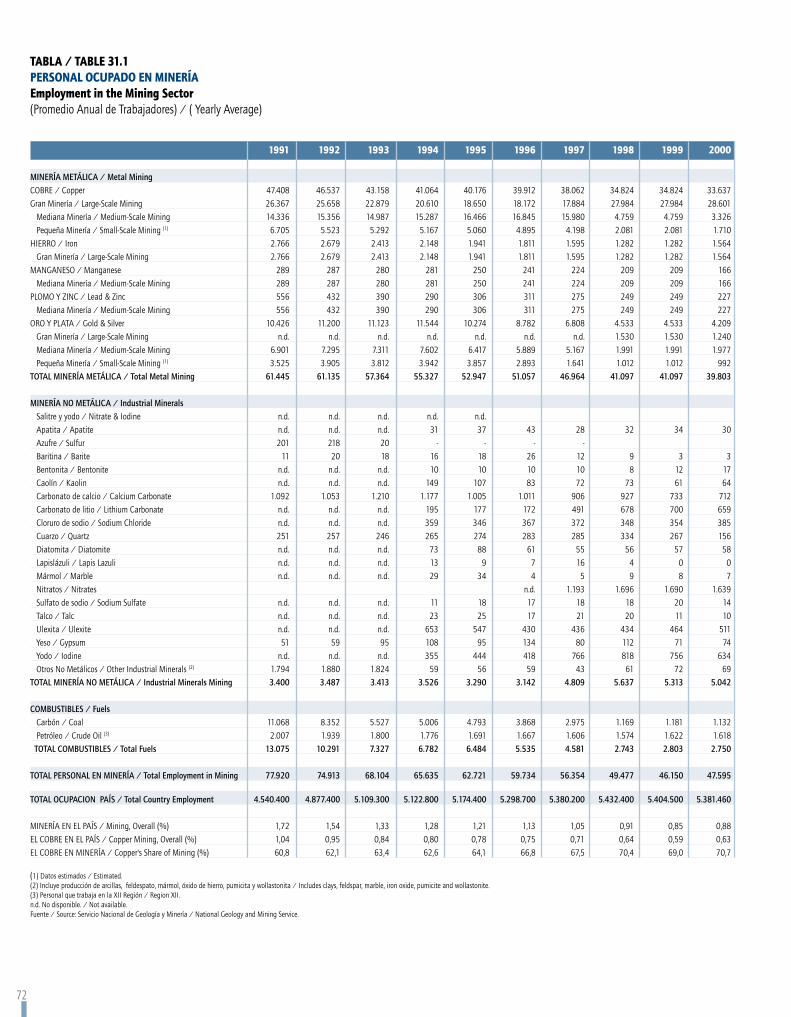
72
TABLA / TABLE 31.1 PERSONAL OCUPADO EN MINERÍA Employment in the Mining Sector (promedio anual de trabajadores) / ( Yearly average)
1991 1992 1993 1994 1995 1996 1997 1998 1999 2000
MineríA MetÁlicA / Metal Mining Cobre / Copper 47.408 46.537 43.158 41.064 40.176 39.912 38.062 34.824 34.824 33.637
Gran Minería / large-Scale Mining 26.367 25.658 22.879 20.610 18.650 18.172 17.884 27.984 27.984 28.601
Mediana Minería / Medium-Scale Mining 14.336 15.356 14.987 15.287 16.466 16.845 15.980 4.759 4.759 3.326
pequeña Minería / Small-Scale Mining (1) 6.705 5.523 5.292 5.167 5.060 4.895 4.198 2.081 2.081 1.710
hierro / iron 2.766 2.679 2.413 2.148 1.941 1.811 1.595 1.282 1.282 1.564
Gran Minería / large-Scale Mining 2.766 2.679 2.413 2.148 1.941 1.811 1.595 1.282 1.282 1.564
ManGaneSo / Manganese 289 287 280 281 250 241 224 209 209 166
Mediana Minería / Medium-Scale Mining 289 287 280 281 250 241 224 209 209 166
ploMo Y ZinC / lead & Zinc 556 432 390 290 306 311 275 249 249 227
Mediana Minería / Medium-Scale Mining 556 432 390 290 306 311 275 249 249 227
oro Y plata / Gold & Silver 10.426 11.200 11.123 11.544 10.274 8.782 6.808 4.533 4.533 4.209
Gran Minería / large-Scale Mining n.d. n.d. n.d. n.d. n.d. n.d. n.d. 1.530 1.530 1.240
Mediana Minería / Medium-Scale Mining 6.901 7.295 7.311 7.602 6.417 5.889 5.167 1.991 1.991 1.977
pequeña Minería / Small-Scale Mining (1) 3.525 3.905 3.812 3.942 3.857 2.893 1.641 1.012 1.012 992
totAl MineríA MetÁlicA / total Metal Mining 61.445 61.135 57.364 55.327 52.947 51.057 46.964 41.097 41.097 39.803
MineríA no MetÁlicA / industrial Minerals Salitre y yodo / nitrate & iodine n.d. n.d. n.d. n.d. n.d.
apatita / apatite n.d. n.d. n.d. 31 37 43 28 32 34 30
azufre / Sulfur 201 218 20 - - - -
baritina / barite 11 20 18 16 18 26 12 9 3 3
bentonita / bentonite n.d. n.d. n.d. 10 10 10 10 8 12 17
Caolín / kaolin n.d. n.d. n.d. 149 107 83 72 73 61 64
Carbonato de calcio / Calcium Carbonate 1.092 1.053 1.210 1.177 1.005 1.011 906 927 733 712
Carbonato de litio / lithium Carbonate n.d. n.d. n.d. 195 177 172 491 678 700 659
Cloruro de sodio / Sodium Chloride n.d. n.d. n.d. 359 346 367 372 348 354 385
Cuarzo / Quartz 251 257 246 265 274 283 285 334 267 156
diatomita / diatomite n.d. n.d. n.d. 73 88 61 55 56 57 58
lapislázuli / lapis lazuli n.d. n.d. n.d. 13 9 7 16 4 0 0
Mármol / Marble n.d. n.d. n.d. 29 34 4 5 9 8 7
nitratos / nitrates n.d. 1.193 1.696 1.690 1.639
Sulfato de sodio / Sodium Sulfate n.d. n.d. n.d. 11 18 17 18 18 20 14
talco / talc n.d. n.d. n.d. 23 25 17 21 20 11 10
Ulexita / Ulexite n.d. n.d. n.d. 653 547 430 436 434 464 511
Yeso / Gypsum 51 59 95 108 95 134 80 112 71 74
Yodo / iodine n.d. n.d. n.d. 355 444 418 766 818 756 634
otros no Metálicos / other industrial Minerals (2) 1.794 1.880 1.824 59 56 59 43 61 72 69
totAl MineríA no MetÁlicA / industrial Minerals Mining 3.400 3.487 3.413 3.526 3.290 3.142 4.809 5.637 5.313 5.042
coMbustibles / Fuels Carbón / Coal 11.068 8.352 5.527 5.006 4.793 3.868 2.975 1.169 1.181 1.132
petróleo / Crude oil (3) 2.007 1.939 1.800 1.776 1.691 1.667 1.606 1.574 1.622 1.618
totAl coMbustibles / total Fuels 13.075 10.291 7.327 6.782 6.484 5.535 4.581 2.743 2.803 2.750
totAl PersonAl en MineríA / total employment in Mining 77.920 74.913 68.104 65.635 62.721 59.734 56.354 49.477 46.150 47.595
totAl ocuPAcion PAís / total country employment 4.540.400 4.877.400 5.109.300 5.122.800 5.174.400 5.298.700 5.380.200 5.432.400 5.404.500 5.381.460
MinerÍa en el paÍS / Mining, overall (%) 1,72 1,54 1,33 1,28 1,21 1,13 1,05 0,91 0,85 0,88
el Cobre en el paÍS / Copper Mining, overall (%) 1,04 0,95 0,84 0,80 0,78 0,75 0,71 0,64 0,59 0,63
el Cobre en MinerÍa / Copper's Share of Mining (%) 60,8 62,1 63,4 62,6 64,1 66,8 67,5 70,4 69,0 70,7
(1) datos estimados / estimated. (2) incluye producción de arcillas, feldespato, mármol, óxido de hierro, pumicita y wollastonita / includes clays, feldspar, marble, iron oxide, pumicite and wollastonite. (3) personal que trabaja en la Xii región / region Xii.n.d. no disponible. / not available. Fuente / Source: Servicio nacional de Geología y Minería / national Geology and Mining Service.
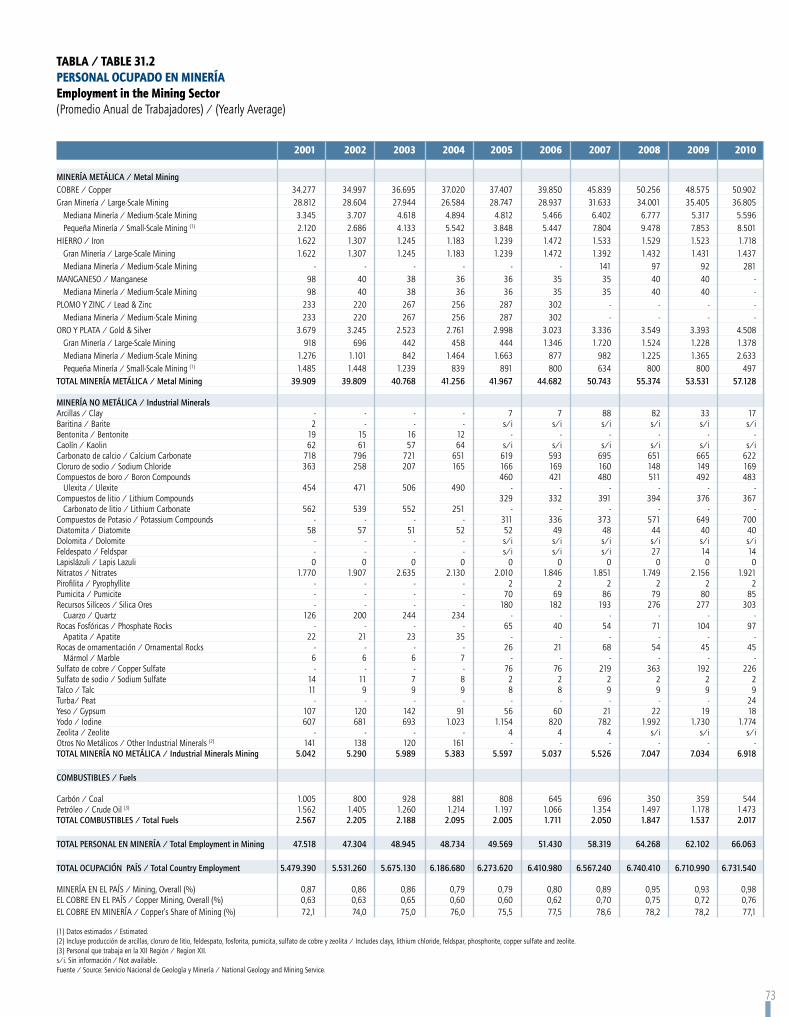
73
TABLA / TABLE 31.2 PERSONAL OCUPADO EN MINERÍA Employment in the Mining Sector (promedio anual de trabajadores) / (Yearly average)
2001 2002 2003 2004 2005 2006 2007 2008 2009 2010
MineríA MetÁlicA / Metal Mining Cobre / Copper 34.277 34.997 36.695 37.020 37.407 39.850 45.839 50.256 48.575 50.902Gran Minería / large-Scale Mining 28.812 28.604 27.944 26.584 28.747 28.937 31.633 34.001 35.405 36.805 Mediana Minería / Medium-Scale Mining 3.345 3.707 4.618 4.894 4.812 5.466 6.402 6.777 5.317 5.596 pequeña Minería / Small-Scale Mining (1) 2.120 2.686 4.133 5.542 3.848 5.447 7.804 9.478 7.853 8.501hierro / iron 1.622 1.307 1.245 1.183 1.239 1.472 1.533 1.529 1.523 1.718 Gran Minería / large-Scale Mining 1.622 1.307 1.245 1.183 1.239 1.472 1.392 1.432 1.431 1.437 Mediana Minería / Medium-Scale Mining - - - - - - 141 97 92 281ManGaneSo / Manganese 98 40 38 36 36 35 35 40 40 - Mediana Minería / Medium-Scale Mining 98 40 38 36 36 35 35 40 40 -ploMo Y ZinC / lead & Zinc 233 220 267 256 287 302 - - - - Mediana Minería / Medium-Scale Mining 233 220 267 256 287 302 - - - -oro Y plata / Gold & Silver 3.679 3.245 2.523 2.761 2.998 3.023 3.336 3.549 3.393 4.508 Gran Minería / large-Scale Mining 918 696 442 458 444 1.346 1.720 1.524 1.228 1.378 Mediana Minería / Medium-Scale Mining 1.276 1.101 842 1.464 1.663 877 982 1.225 1.365 2.633 pequeña Minería / Small-Scale Mining (1) 1.485 1.448 1.239 839 891 800 634 800 800 497totAl MineríA MetÁlicA / Metal Mining 39.909 39.809 40.768 41.256 41.967 44.682 50.743 55.374 53.531 57.128 MineríA no MetÁlicA / industrial Minerals arcillas / Clay - - - - 7 7 88 82 33 17baritina / barite 2 - - - s/i s/i s/i s/i s/i s/ibentonita / bentonite 19 15 16 12 - - - - - -Caolín / kaolin 62 61 57 64 s/i s/i s/i s/i s/i s/iCarbonato de calcio / Calcium Carbonate 718 796 721 651 619 593 695 651 665 622Cloruro de sodio / Sodium Chloride 363 258 207 165 166 169 160 148 149 169Compuestos de boro / boron Compounds 460 421 480 511 492 483 Ulexita / Ulexite 454 471 506 490 - - - - - -Compuestos de litio / lithium Compounds 329 332 391 394 376 367 Carbonato de litio / lithium Carbonate 562 539 552 251 - - - - - -Compuestos de potasio / potassium Compounds - - - - 311 336 373 571 649 700diatomita / diatomite 58 57 51 52 52 49 48 44 40 40dolomita / dolomite - - - - s/i s/i s/i s/i s/i s/iFeldespato / Feldspar - - - - s/i s/i s/i 27 14 14lapislázuli / lapis lazuli 0 0 0 0 0 0 0 0 0 0nitratos / nitrates 1.770 1.907 2.635 2.130 2.010 1.846 1.851 1.749 2.156 1.921pirofilita / pyrophyllite - - - - 2 2 2 2 2 2pumicita / pumicite - - - - 70 69 86 79 80 85recursos Silíceos / Silica ores - - - - 180 182 193 276 277 303 Cuarzo / Quartz 126 200 244 234 - - - - - -rocas Fosfóricas / phosphate rocks - - - - 65 40 54 71 104 97 apatita / apatite 22 21 23 35 - - - - - -rocas de ornamentación / ornamental rocks - - - - 26 21 68 54 45 45 Mármol / Marble 6 6 6 7 - - - - - -Sulfato de cobre / Copper Sulfate - - - - 76 76 219 363 192 226Sulfato de sodio / Sodium Sulfate 14 11 7 8 2 2 2 2 2 2talco / talc 11 9 9 9 8 8 9 9 9 9turba/ peat - - - - - - - - - 24Yeso / Gypsum 107 120 142 91 56 60 21 22 19 18Yodo / iodine 607 681 693 1.023 1.154 820 782 1.992 1.730 1.774Zeolita / Zeolite - - - - 4 4 4 s/i s/i s/iotros no Metálicos / other industrial Minerals (2) 141 138 120 161 - - - - - -totAl MineríA no MetÁlicA / industrial Minerals Mining 5.042 5.290 5.989 5.383 5.597 5.037 5.526 7.047 7.034 6.918
coMbustibles / Fuels Carbón / Coal 1.005 800 928 881 808 645 696 350 359 544petróleo / Crude oil (3) 1.562 1.405 1.260 1.214 1.197 1.066 1.354 1.497 1.178 1.473totAl coMbustibles / total Fuels 2.567 2.205 2.188 2.095 2.005 1.711 2.050 1.847 1.537 2.017
totAl PersonAl en MineríA / total employment in Mining 47.518 47.304 48.945 48.734 49.569 51.430 58.319 64.268 62.102 66.063
totAl ocuPAciÓn PAís / total country employment 5.479.390 5.531.260 5.675.130 6.186.680 6.273.620 6.410.980 6.567.240 6.740.410 6.710.990 6.731.540 MinerÍa en el paÍS / Mining, overall (%) 0,87 0,86 0,86 0,79 0,79 0,80 0,89 0,95 0,93 0,98el Cobre en el paÍS / Copper Mining, overall (%) 0,63 0,63 0,65 0,60 0,60 0,62 0,70 0,75 0,72 0,76el Cobre en MinerÍa / Copper’s Share of Mining (%) 72,1 74,0 75,0 76,0 75,5 77,5 78,6 78,2 78,2 77,1 (1) datos estimados / estimated. (2) incluye producción de arcillas, cloruro de litio, feldespato, fosforita, pumicita, sulfato de cobre y zeolita / includes clays, lithium chloride, feldspar, phosphorite, copper sulfate and zeolite. (3) personal que trabaja en la Xii región / region Xii. s/i. Sin información / not available.Fuente / Source: Servicio nacional de Geología y Minería / national Geology and Mining Service.
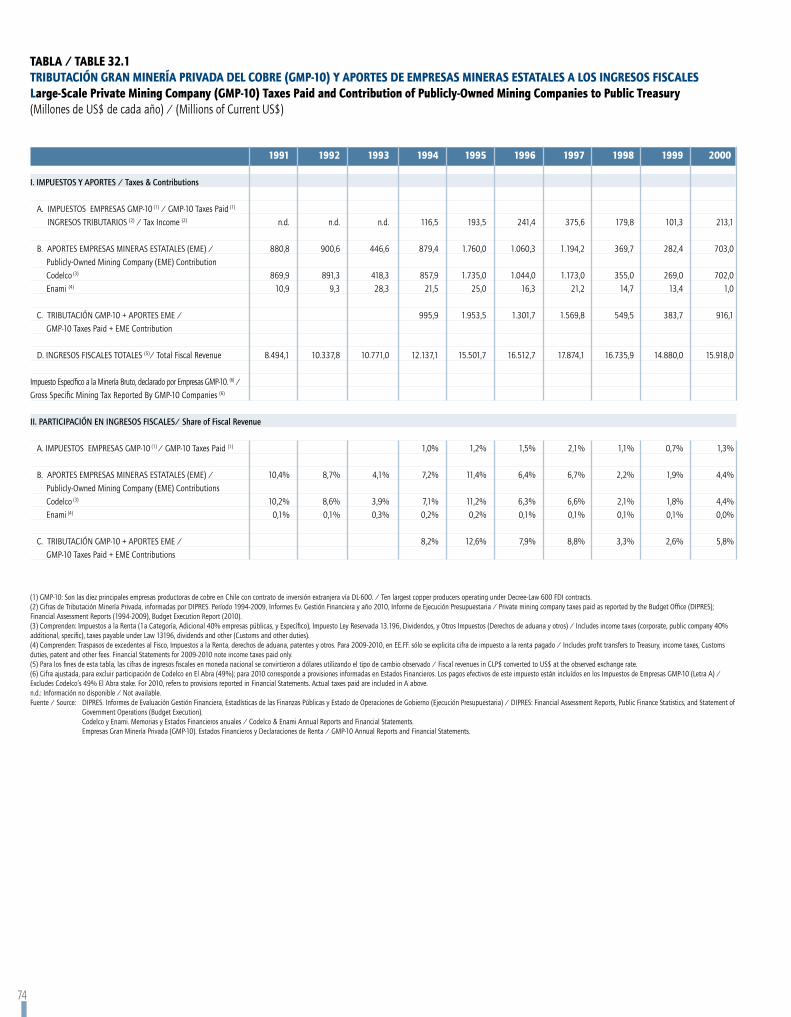
74
TABLA / TABLE 32.1TRIBUTACIÓN GRAN MINERÍA PRIVADA DEL COBRE (GMP-10) Y APORTES DE EMPRESAS MINERAS ESTATALES A LOS INGRESOS FISCALES Large-Scale Private Mining Company (GMP-10) Taxes Paid and Contribution of Publicly-Owned Mining Companies to Public Treasury (Millones de US$ de cada año) / (Millions of Current US$)
1991 1992 1993 1994 1995 1996 1997 1998 1999 2000
i. iMPuestos y APortes / taxes & contributions
a. iMpUeStoS eMpreSaS GMp-10 (1) / GMp-10 taxes paid (1)
inGreSoS tribUtarioS (2) / tax income (2) n.d. n.d. n.d. 116,5 193,5 241,4 375,6 179,8 101,3 213,1
b. aporteS eMpreSaS MineraS eStataleS (eMe) / 880,8 900,6 446,6 879,4 1.760,0 1.060,3 1.194,2 369,7 282,4 703,0
publicly-owned Mining Company (eMe) Contribution
Codelco (3) 869,9 891,3 418,3 857,9 1.735,0 1.044,0 1.173,0 355,0 269,0 702,0
enami (4) 10,9 9,3 28,3 21,5 25,0 16,3 21,2 14,7 13,4 1,0
C. tribUtaCiÓn GMp-10 + aporteS eMe / 995,9 1.953,5 1.301,7 1.569,8 549,5 383,7 916,1
GMp-10 taxes paid + eMe Contribution
d. inGreSoS FiSCaleS totaleS (5)/ total Fiscal revenue 8.494,1 10.337,8 10.771,0 12.137,1 15.501,7 16.512,7 17.874,1 16.735,9 14.880,0 15.918,0
impuesto específico a la Minería bruto, declarado por empresas GMp-10. (6) /
Gross Specific Mining tax reported by GMp-10 Companies (6)
ii. PArticiPAciÓn en inGresos FiscAles/ share of Fiscal revenue
a. iMpUeStoS eMpreSaS GMp-10 (1) / GMp-10 taxes paid (1) 1,0% 1,2% 1,5% 2,1% 1,1% 0,7% 1,3%
b. aporteS eMpreSaS MineraS eStataleS (eMe) / 10,4% 8,7% 4,1% 7,2% 11,4% 6,4% 6,7% 2,2% 1,9% 4,4%
publicly-owned Mining Company (eMe) Contributions
Codelco (3) 10,2% 8,6% 3,9% 7,1% 11,2% 6,3% 6,6% 2,1% 1,8% 4,4%
enami (4) 0,1% 0,1% 0,3% 0,2% 0,2% 0,1% 0,1% 0,1% 0,1% 0,0%
C. tribUtaCiÓn GMp-10 + aporteS eMe / 8,2% 12,6% 7,9% 8,8% 3,3% 2,6% 5,8%
GMp-10 taxes paid + eMe Contributions
(1) GMp-10: Son las diez principales empresas productoras de cobre en Chile con contrato de inversión extranjera vía dl-600. / ten largest copper producers operating under decree-law 600 Fdi contracts.(2) Cifras de tributación Minería privada, informadas por dipreS. período 1994-2009, informes ev. Gestión Financiera y año 2010, informe de ejecución presupuestaria / private mining company taxes paid as reported by the budget office (dipreS); Financial assessment reports (1994-2009), budget execution report (2010).(3) Comprenden: impuestos a la renta (1a Categoría, adicional 40% empresas públicas, y específico), impuesto ley reservada 13.196, dividendos, y otros impuestos (derechos de aduana y otros) / includes income taxes (corporate, public company 40% additional, specific), taxes payable under law 13196, dividends and other (Customs and other duties).(4) Comprenden: traspasos de excedentes al Fisco, impuestos a la renta, derechos de aduana, patentes y otros. para 2009-2010, en ee.FF. sólo se explicita cifra de impuesto a la renta pagado / includes profit transfers to treasury, income taxes, Customs duties, patent and other fees. Financial Statements for 2009-2010 note income taxes paid only.(5) para los fines de esta tabla, las cifras de ingresos fiscales en moneda nacional se convirtieron a dólares utilizando el tipo de cambio observado / Fiscal revenues in Clp$ converted to US$ at the observed exchange rate.(6) Cifra ajustada, para excluir participación de Codelco en el abra (49%); para 2010 corresponde a provisiones informadas en estados Financieros. los pagos efectivos de este impuesto están incluídos en los impuestos de empresas GMp-10 (letra a) / excludes Codelco’s 49% el abra stake. For 2010, refers to provisions reported in Financial Statements. actual taxes paid are included in a above. n.d.: información no disponible / not available. Fuente / Source: dipreS. informes de evaluación Gestión Financiera, estadísticas de las Finanzas públicas y estado de operaciones de Gobierno (ejecución presupuestaria) / dipreS: Financial assessment reports, public Finance Statistics, and Statement of Government operations (budget execution). Codelco y enami. Memorias y estados Financieros anuales / Codelco & enami annual reports and Financial Statements. empresas Gran Minería privada (GMp-10). estados Financieros y declaraciones de renta / GMp-10 annual reports and Financial Statements.
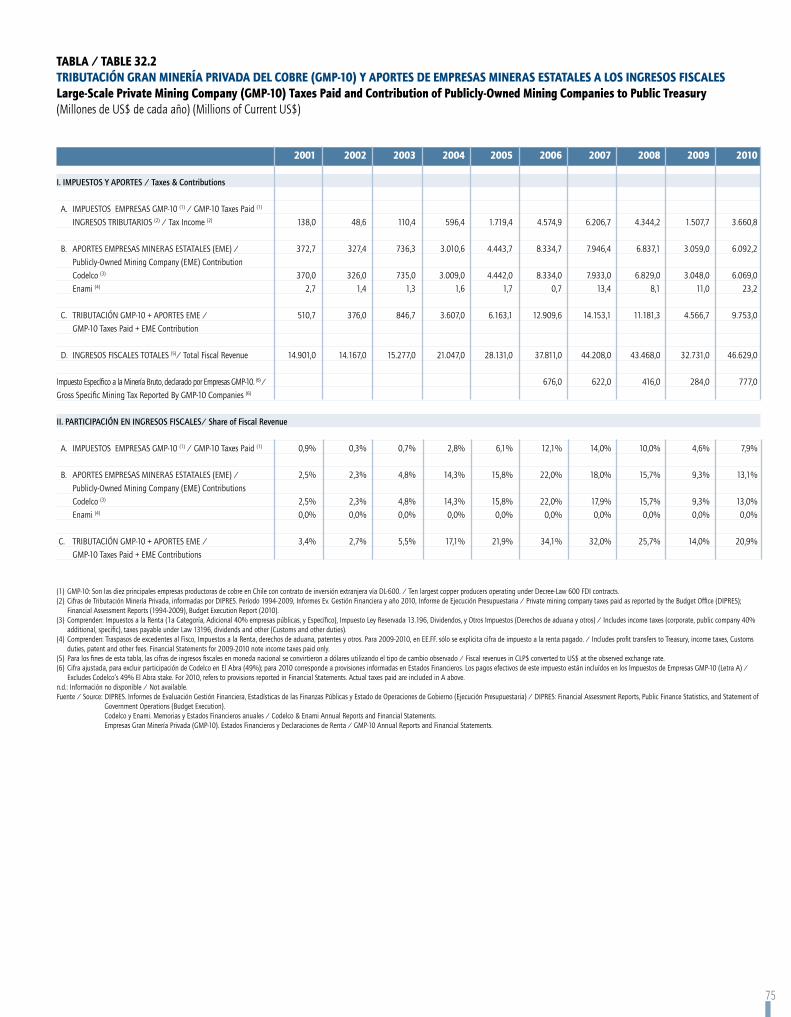
75
TABLA / TABLE 32.2TRIBUTACIÓN GRAN MINERÍA PRIVADA DEL COBRE (GMP-10) Y APORTES DE EMPRESAS MINERAS ESTATALES A LOS INGRESOS FISCALESLarge-Scale Private Mining Company (GMP-10) Taxes Paid and Contribution of Publicly-Owned Mining Companies to Public Treasury(Millones de US$ de cada año) (Millions of Current US$)
2001 2002 2003 2004 2005 2006 2007 2008 2009 2010
i. iMPuestos y APortes / taxes & contributions
a. iMpUeStoS eMpreSaS GMp-10 (1) / GMp-10 taxes paid (1)
inGreSoS tribUtarioS (2) / tax income (2) 138,0 48,6 110,4 596,4 1.719,4 4.574,9 6.206,7 4.344,2 1.507,7 3.660,8
b. aporteS eMpreSaS MineraS eStataleS (eMe) / 372,7 327,4 736,3 3.010,6 4.443,7 8.334,7 7.946,4 6.837,1 3.059,0 6.092,2
publicly-owned Mining Company (eMe) Contribution
Codelco (3) 370,0 326,0 735,0 3.009,0 4.442,0 8.334,0 7.933,0 6.829,0 3.048,0 6.069,0
enami (4) 2,7 1,4 1,3 1,6 1,7 0,7 13,4 8,1 11,0 23,2
C. tribUtaCiÓn GMp-10 + aporteS eMe / 510,7 376,0 846,7 3.607,0 6.163,1 12.909,6 14.153,1 11.181,3 4.566,7 9.753,0
GMp-10 taxes paid + eMe Contribution
d. inGreSoS FiSCaleS totaleS (5)/ total Fiscal revenue 14.901,0 14.167,0 15.277,0 21.047,0 28.131,0 37.811,0 44.208,0 43.468,0 32.731,0 46.629,0
impuesto específico a la Minería bruto, declarado por empresas GMp-10. (6) / 676,0 622,0 416,0 284,0 777,0
Gross Specific Mining tax reported by GMp-10 Companies (6)
ii. PArticiPAciÓn en inGresos FiscAles/ share of Fiscal revenue
a. iMpUeStoS eMpreSaS GMp-10 (1) / GMp-10 taxes paid (1) 0,9% 0,3% 0,7% 2,8% 6,1% 12,1% 14,0% 10,0% 4,6% 7,9%
b. aporteS eMpreSaS MineraS eStataleS (eMe) / 2,5% 2,3% 4,8% 14,3% 15,8% 22,0% 18,0% 15,7% 9,3% 13,1%
publicly-owned Mining Company (eMe) Contributions
Codelco (3) 2,5% 2,3% 4,8% 14,3% 15,8% 22,0% 17,9% 15,7% 9,3% 13,0%
enami (4) 0,0% 0,0% 0,0% 0,0% 0,0% 0,0% 0,0% 0,0% 0,0% 0,0%
C. tribUtaCiÓn GMp-10 + aporteS eMe / 3,4% 2,7% 5,5% 17,1% 21,9% 34,1% 32,0% 25,7% 14,0% 20,9%
GMp-10 taxes paid + eMe Contributions
(1) GMp-10: Son las diez principales empresas productoras de cobre en Chile con contrato de inversión extranjera vía dl-600. / ten largest copper producers operating under decree-law 600 Fdi contracts. (2) Cifras de tributación Minería privada, informadas por dipreS. período 1994-2009, informes ev. Gestión Financiera y año 2010, informe de ejecución presupuestaria / private mining company taxes paid as reported by the budget office (dipreS);
Financial assessment reports (1994-2009), budget execution report (2010). (3) Comprenden: impuestos a la renta (1a Categoría, adicional 40% empresas públicas, y específico), impuesto ley reservada 13.196, dividendos, y otros impuestos (derechos de aduana y otros) / includes income taxes (corporate, public company 40%
additional, specific), taxes payable under law 13196, dividends and other (Customs and other duties). (4) Comprenden: traspasos de excedentes al Fisco, impuestos a la renta, derechos de aduana, patentes y otros. para 2009-2010, en ee.FF. sólo se explicita cifra de impuesto a la renta pagado. / includes profit transfers to treasury, income taxes, Customs
duties, patent and other fees. Financial Statements for 2009-2010 note income taxes paid only. (5) para los fines de esta tabla, las cifras de ingresos fiscales en moneda nacional se convirtieron a dólares utilizando el tipo de cambio observado / Fiscal revenues in Clp$ converted to US$ at the observed exchange rate. (6) Cifra ajustada, para excluir participación de Codelco en el abra (49%); para 2010 corresponde a provisiones informadas en estados Financieros. los pagos efectivos de este impuesto están incluídos en los impuestos de empresas GMp-10 (letra a) /
excludes Codelco’s 49% el abra stake. For 2010, refers to provisions reported in Financial Statements. actual taxes paid are included in a above. n.d.: información no disponible / not available. Fuente / Source: dipreS. informes de evaluación Gestión Financiera, estadísticas de las Finanzas públicas y estado de operaciones de Gobierno (ejecución presupuestaria) / dipreS: Financial assessment reports, public Finance Statistics, and Statement of
Government operations (budget execution). Codelco y enami. Memorias y estados Financieros anuales / Codelco & enami annual reports and Financial Statements.
empresas Gran Minería privada (GMp-10). estados Financieros y declaraciones de renta / GMp-10 annual reports and Financial Statements.
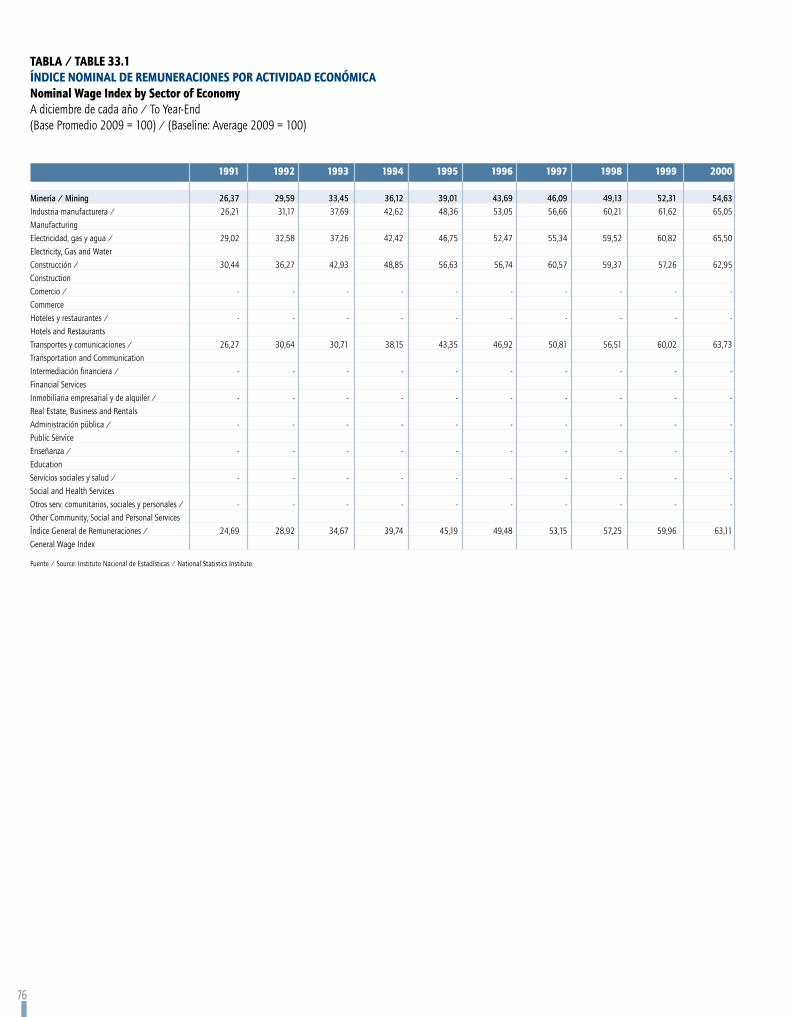
76
TABLA / TABLE 33.1ÍNDICE NOMINAL DE REMUNERACIONES POR ACTIVIDAD ECONÓMICANominal Wage Index by Sector of Economya diciembre de cada año / to Year-end(base promedio 2009 = 100) / (baseline: average 2009 = 100)
1991 1992 1993 1994 1995 1996 1997 1998 1999 2000
Minería / Mining 26,37 29,59 33,45 36,12 39,01 43,69 46,09 49,13 52,31 54,63 industria manufacturera / 26,21 31,17 37,69 42,62 48,36 53,05 56,66 60,21 61,62 65,05
Manufacturing
electricidad, gas y agua / 29,02 32,58 37,26 42,42 46,75 52,47 55,34 59,52 60,82 65,50
electricity, Gas and Water
Construcción / 30,44 36,27 42,93 48,85 56,63 56,74 60,57 59,37 57,26 62,95
Construction
Comercio / - - - - - - - - - -
Commerce
hoteles y restaurantes / - - - - - - - - - -
hotels and restaurants
transportes y comunicaciones / 26,27 30,64 30,71 38,15 43,35 46,92 50,81 56,51 60,02 63,73
transportation and Communication
intermediación financiera / - - - - - - - - - -
Financial Services
inmobiliaria empresarial y de alquiler / - - - - - - - - - -
real estate, business and rentals
administración pública / - - - - - - - - - -
public Service
enseñanza / - - - - - - - - - -
education
Servicios sociales y salud / - - - - - - - - - -
Social and health Services
otros serv. comunitarios, sociales y personales / - - - - - - - - - -
other Community, Social and personal Services
Índice General de remuneraciones / 24,69 28,92 34,67 39,74 45,19 49,48 53,15 57,25 59,96 63,11
General Wage index
Fuente / Source: instituto nacional de estadísticas / national Statistics institute.
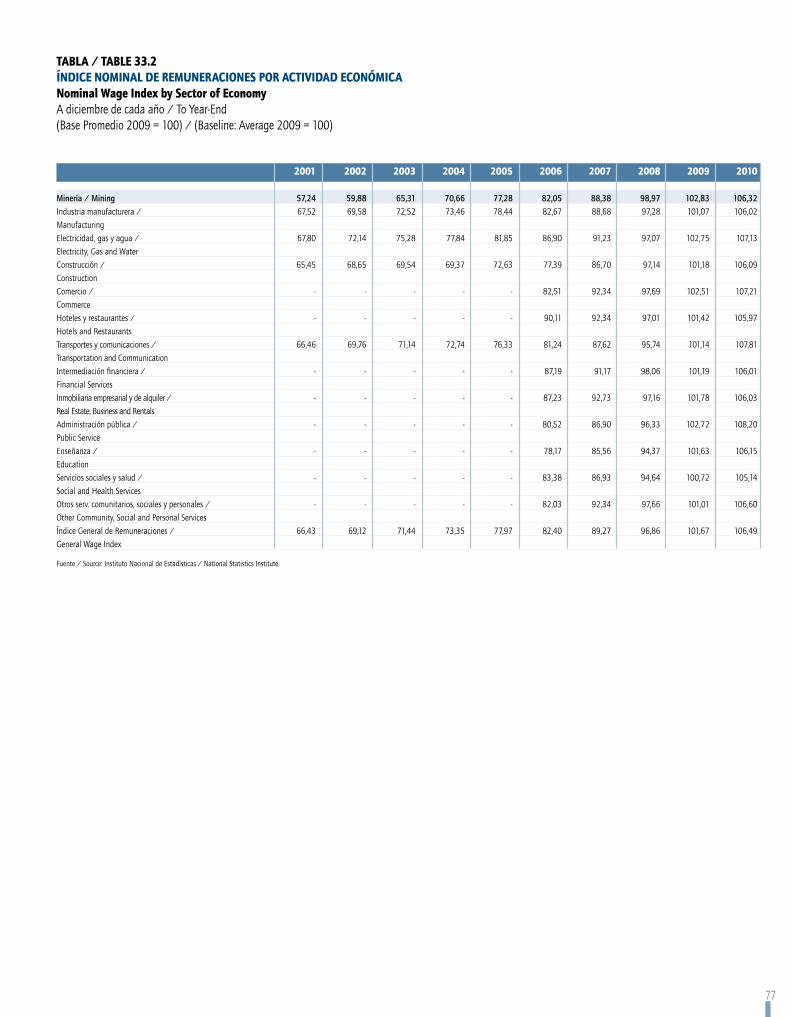
77
TABLA / TABLE 33.2 ÍNDICE NOMINAL DE REMUNERACIONES POR ACTIVIDAD ECONÓMICA Nominal Wage Index by Sector of Economya diciembre de cada año / to Year-end(base promedio 2009 = 100) / (baseline: average 2009 = 100)
2001 2002 2003 2004 2005 2006 2007 2008 2009 2010
Minería / Mining 57,24 59,88 65,31 70,66 77,28 82,05 88,38 98,97 102,83 106,32 industria manufacturera / 67,52 69,58 72,52 73,46 78,44 82,67 88,68 97,28 101,07 106,02
Manufacturing
electricidad, gas y agua / 67,80 72,14 75,28 77,84 81,85 86,90 91,23 97,07 102,75 107,13
electricity, Gas and Water
Construcción / 65,45 68,65 69,54 69,37 72,63 77,39 86,70 97,14 101,18 106,09
Construction
Comercio / - - - - - 82,51 92,34 97,69 102,51 107,21
Commerce
hoteles y restaurantes / - - - - - 90,11 92,34 97,01 101,42 105,97
hotels and restaurants
transportes y comunicaciones / 66,46 69,76 71,14 72,74 76,33 81,24 87,62 95,74 101,14 107,81
transportation and Communication
intermediación financiera / - - - - - 87,19 91,17 98,06 101,19 106,01
Financial Services
inmobiliaria empresarial y de alquiler / - - - - - 87,23 92,73 97,16 101,78 106,03
real estate, business and rentals
administración pública / - - - - - 80,52 86,90 96,33 102,72 108,20
public Service
enseñanza / - - - - - 78,17 85,56 94,37 101,63 106,15
education
Servicios sociales y salud / - - - - - 83,38 86,93 94,64 100,72 105,14
Social and health Services
otros serv. comunitarios, sociales y personales / - - - - - 82,03 92,34 97,66 101,01 106,60
other Community, Social and personal Services
Índice General de remuneraciones / 66,43 69,12 71,44 73,35 77,97 82,40 89,27 96,86 101,67 106,49
General Wage index
Fuente / Source: instituto nacional de estadísticas / national Statistics institute.

78

79
1.5INSUMOS ESTRATÉGICOS PARA LA MINERÍA CHILENAcHileAn MininG: strAteGic suPPlies
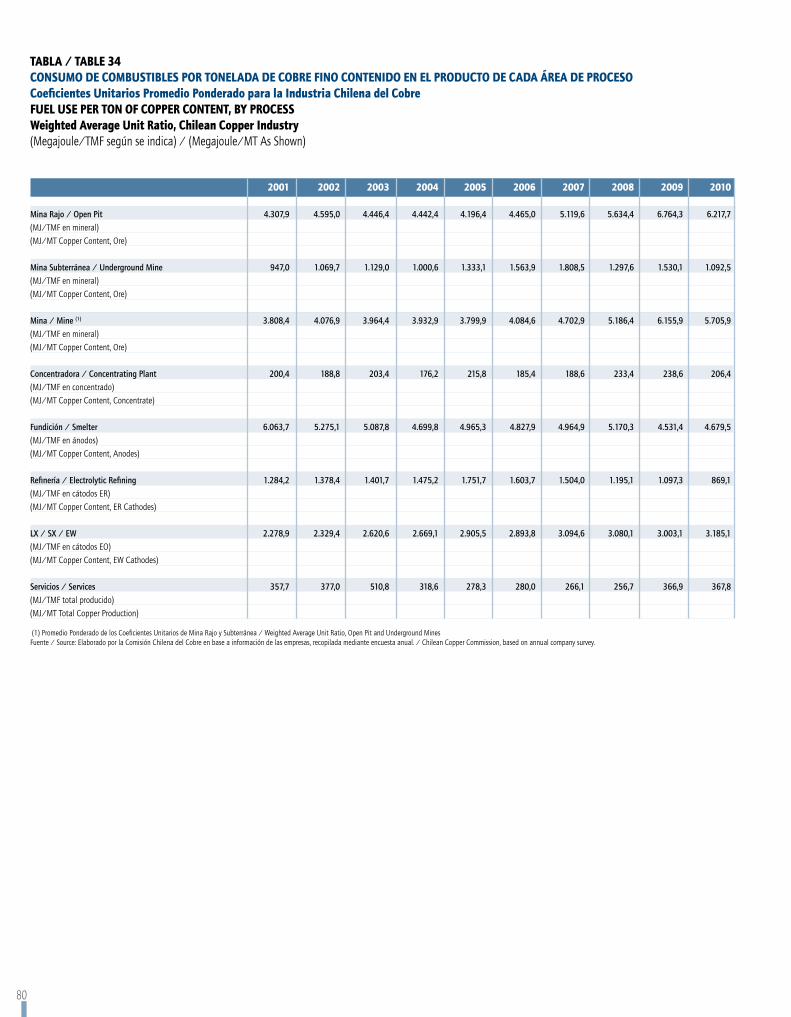
80
TABLA / TABLE 34CONSUMO DE COMBUSTIBLES POR TONELADA DE COBRE FINO CONTENIDO EN EL PRODUCTO DE CADA ÁREA DE PROCESOCoeficientes Unitarios Promedio Ponderado para la Industria Chilena del Cobre FUEL USE PER TON OF COPPER CONTENT, BY PROCESSWeighted Average Unit Ratio, Chilean Copper Industry(Megajoule/tMF según se indica) / (Megajoule/Mt as Shown)
2001 2002 2003 2004 2005 2006 2007 2008 2009 2010
Mina rajo / open Pit 4.307,9 4.595,0 4.446,4 4.442,4 4.196,4 4.465,0 5.119,6 5.634,4 6.764,3 6.217,7 (MJ/tMF en mineral)
(MJ/Mt Copper Content, ore)
Mina subterránea / underground Mine 947,0 1.069,7 1.129,0 1.000,6 1.333,1 1.563,9 1.808,5 1.297,6 1.530,1 1.092,5 (MJ/tMF en mineral)
(MJ/Mt Copper Content, ore)
Mina / Mine (1) 3.808,4 4.076,9 3.964,4 3.932,9 3.799,9 4.084,6 4.702,9 5.186,4 6.155,9 5.705,9 (MJ/tMF en mineral)
(MJ/Mt Copper Content, ore)
concentradora / concentrating Plant 200,4 188,8 203,4 176,2 215,8 185,4 188,6 233,4 238,6 206,4 (MJ/tMF en concentrado)
(MJ/Mt Copper Content, Concentrate)
Fundición / smelter 6.063,7 5.275,1 5.087,8 4.699,8 4.965,3 4.827,9 4.964,9 5.170,3 4.531,4 4.679,5 (MJ/tMF en ánodos)
(MJ/Mt Copper Content, anodes)
refinería / electrolytic refining 1.284,2 1.378,4 1.401,7 1.475,2 1.751,7 1.603,7 1.504,0 1.195,1 1.097,3 869,1 (MJ/tMF en cátodos er)
(MJ/Mt Copper Content, er Cathodes)
lX / sX / eW 2.278,9 2.329,4 2.620,6 2.669,1 2.905,5 2.893,8 3.094,6 3.080,1 3.003,1 3.185,1 (MJ/tMF en cátodos eo)
(MJ/Mt Copper Content, eW Cathodes)
servicios / services 357,7 377,0 510,8 318,6 278,3 280,0 266,1 256,7 366,9 367,8 (MJ/tMF total producido)
(MJ/Mt total Copper production)
(1) promedio ponderado de los Coeficientes Unitarios de Mina rajo y Subterránea / Weighted average Unit ratio, open pit and Underground MinesFuente / Source: elaborado por la Comisión Chilena del Cobre en base a información de las empresas, recopilada mediante encuesta anual. / Chilean Copper Commission, based on annual company survey.
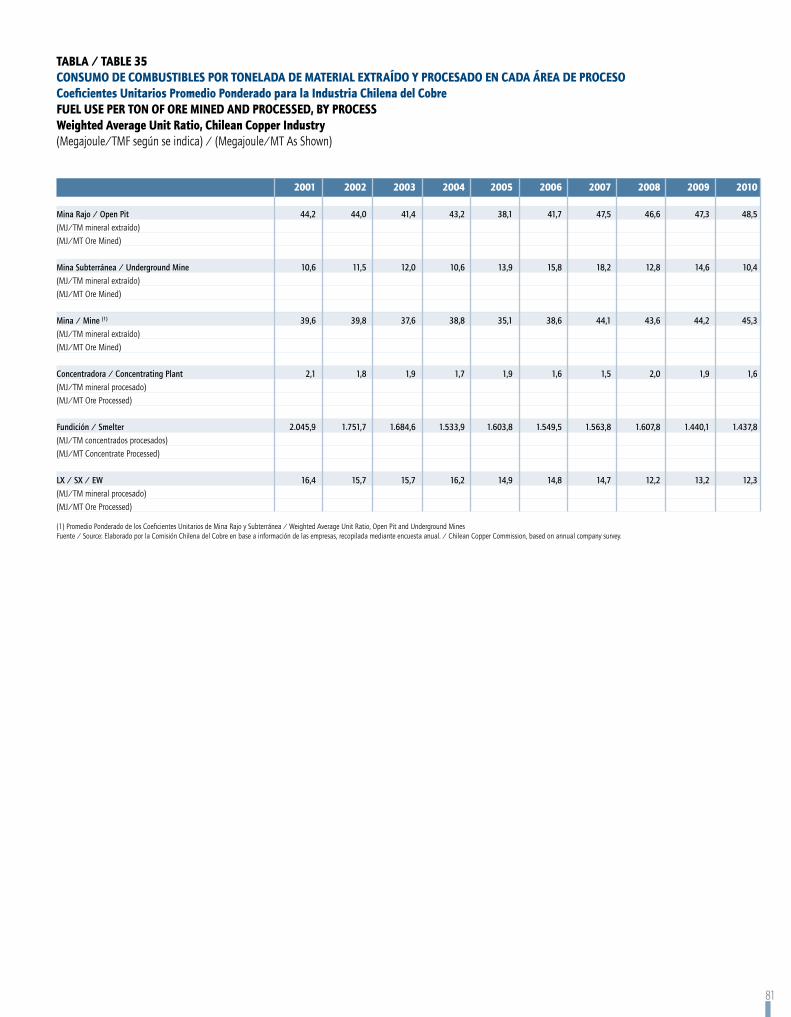
81
TABLA / TABLE 35 CONSUMO DE COMBUSTIBLES POR TONELADA DE MATERIAL EXTRAÍDO Y PROCESADO EN CADA ÁREA DE PROCESOCoeficientes Unitarios Promedio Ponderado para la Industria Chilena del Cobre FUEL USE PER TON OF ORE MINED AND PROCESSED, BY PROCESSWeighted Average Unit Ratio, Chilean Copper Industry(Megajoule/tMF según se indica) / (Megajoule/Mt as Shown)
2001 2002 2003 2004 2005 2006 2007 2008 2009 2010
Mina rajo / open Pit 44,2 44,0 41,4 43,2 38,1 41,7 47,5 46,6 47,3 48,5 (MJ/tM mineral extraído)
(MJ/Mt ore Mined)
Mina subterránea / underground Mine 10,6 11,5 12,0 10,6 13,9 15,8 18,2 12,8 14,6 10,4 (MJ/tM mineral extraído)
(MJ/Mt ore Mined)
Mina / Mine (1) 39,6 39,8 37,6 38,8 35,1 38,6 44,1 43,6 44,2 45,3 (MJ/tM mineral extraído)
(MJ/Mt ore Mined)
concentradora / concentrating Plant 2,1 1,8 1,9 1,7 1,9 1,6 1,5 2,0 1,9 1,6 (MJ/tM mineral procesado)
(MJ/Mt ore processed)
Fundición / smelter 2.045,9 1.751,7 1.684,6 1.533,9 1.603,8 1.549,5 1.563,8 1.607,8 1.440,1 1.437,8 (MJ/tM concentrados procesados)
(MJ/Mt Concentrate processed)
lX / sX / eW 16,4 15,7 15,7 16,2 14,9 14,8 14,7 12,2 13,2 12,3 (MJ/tM mineral procesado)
(MJ/Mt ore processed)
(1) promedio ponderado de los Coeficientes Unitarios de Mina rajo y Subterránea / Weighted average Unit ratio, open pit and Underground MinesFuente / Source: elaborado por la Comisión Chilena del Cobre en base a información de las empresas, recopilada mediante encuesta anual. / Chilean Copper Commission, based on annual company survey.
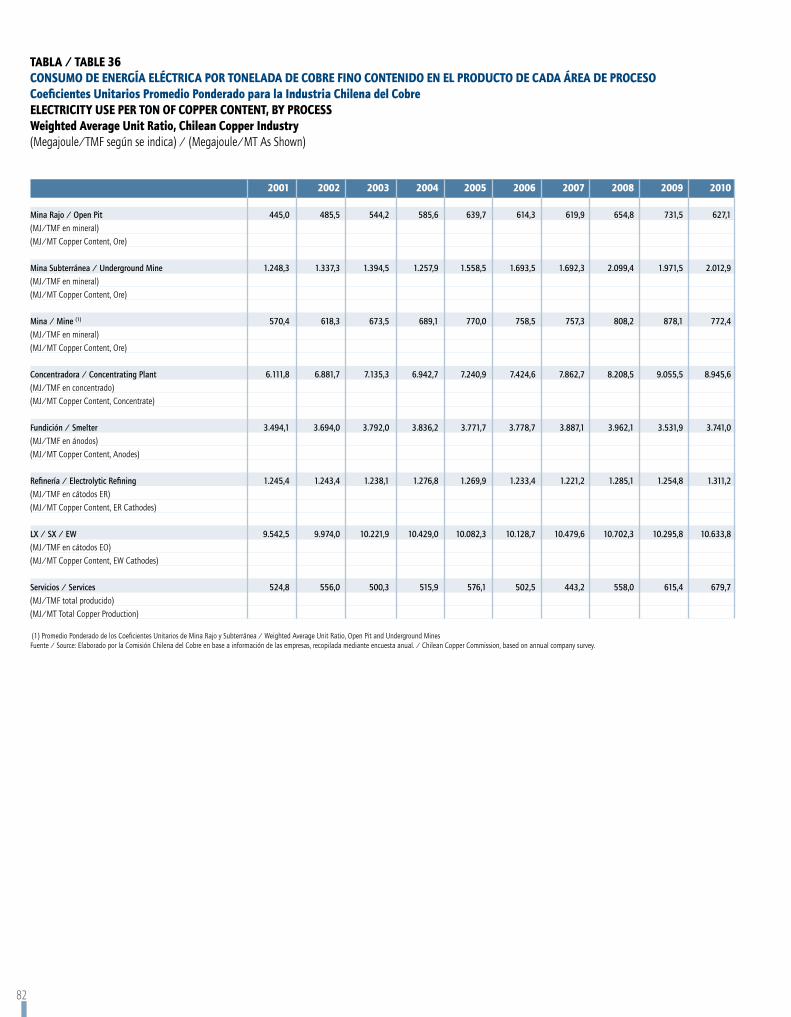
82
TABLA / TABLE 36 CONSUMO DE ENERGÍA ELÉCTRICA POR TONELADA DE COBRE FINO CONTENIDO EN EL PRODUCTO DE CADA ÁREA DE PROCESO Coeficientes Unitarios Promedio Ponderado para la Industria Chilena del Cobre ELECTRICITY USE PER TON OF COPPER CONTENT, BY PROCESS Weighted Average Unit Ratio, Chilean Copper Industry (Megajoule/tMF según se indica) / (Megajoule/Mt as Shown) 2001 2002 2003 2004 2005 2006 2007 2008 2009 2010
Mina rajo / open Pit 445,0 485,5 544,2 585,6 639,7 614,3 619,9 654,8 731,5 627,1 (MJ/tMF en mineral)
(MJ/Mt Copper Content, ore)
Mina subterránea / underground Mine 1.248,3 1.337,3 1.394,5 1.257,9 1.558,5 1.693,5 1.692,3 2.099,4 1.971,5 2.012,9 (MJ/tMF en mineral)
(MJ/Mt Copper Content, ore)
Mina / Mine (1) 570,4 618,3 673,5 689,1 770,0 758,5 757,3 808,2 878,1 772,4 (MJ/tMF en mineral)
(MJ/Mt Copper Content, ore)
concentradora / concentrating Plant 6.111,8 6.881,7 7.135,3 6.942,7 7.240,9 7.424,6 7.862,7 8.208,5 9.055,5 8.945,6 (MJ/tMF en concentrado)
(MJ/Mt Copper Content, Concentrate)
Fundición / smelter 3.494,1 3.694,0 3.792,0 3.836,2 3.771,7 3.778,7 3.887,1 3.962,1 3.531,9 3.741,0 (MJ/tMF en ánodos)
(MJ/Mt Copper Content, anodes)
refinería / electrolytic refining 1.245,4 1.243,4 1.238,1 1.276,8 1.269,9 1.233,4 1.221,2 1.285,1 1.254,8 1.311,2 (MJ/tMF en cátodos er)
(MJ/Mt Copper Content, er Cathodes)
lX / sX / eW 9.542,5 9.974,0 10.221,9 10.429,0 10.082,3 10.128,7 10.479,6 10.702,3 10.295,8 10.633,8 (MJ/tMF en cátodos eo)
(MJ/Mt Copper Content, eW Cathodes)
servicios / services 524,8 556,0 500,3 515,9 576,1 502,5 443,2 558,0 615,4 679,7 (MJ/tMF total producido)
(MJ/Mt total Copper production)
(1) promedio ponderado de los Coeficientes Unitarios de Mina rajo y Subterránea / Weighted average Unit ratio, open pit and Underground Mines Fuente / Source: elaborado por la Comisión Chilena del Cobre en base a información de las empresas, recopilada mediante encuesta anual. / Chilean Copper Commission, based on annual company survey.
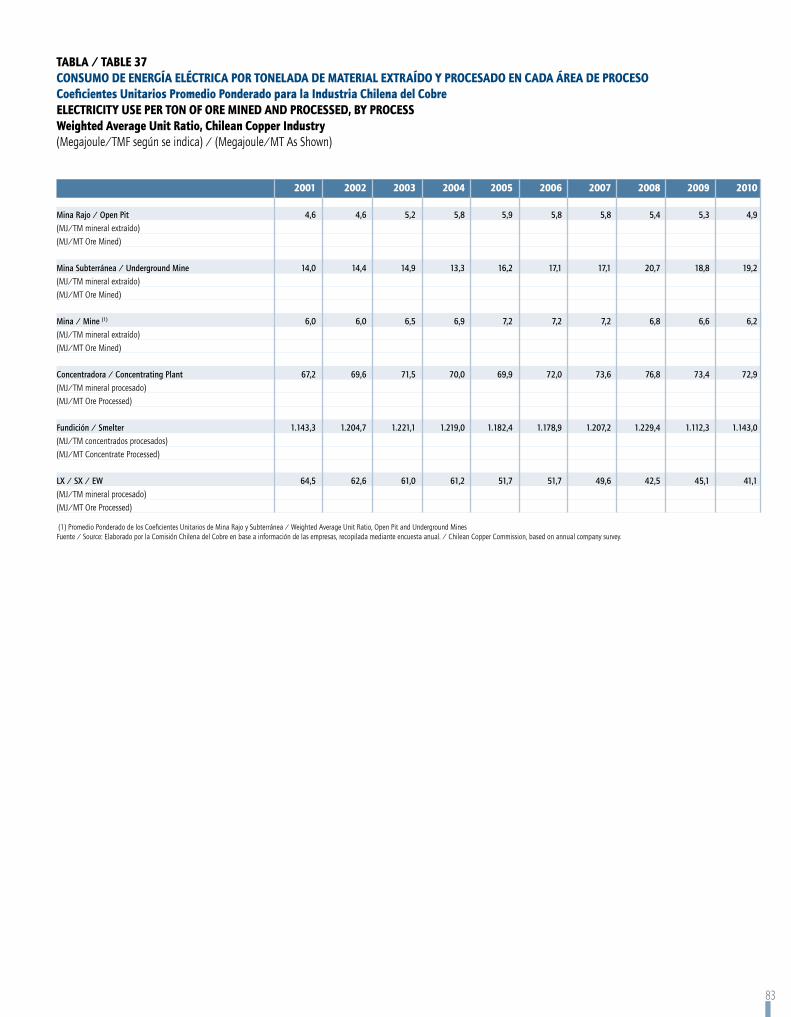
83
TABLA / TABLE 37 CONSUMO DE ENERGÍA ELÉCTRICA POR TONELADA DE MATERIAL EXTRAÍDO Y PROCESADO EN CADA ÁREA DE PROCESO Coeficientes Unitarios Promedio Ponderado para la Industria Chilena del Cobre ELECTRICITY USE PER TON OF ORE MINED AND PROCESSED, BY PROCESS Weighted Average Unit Ratio, Chilean Copper Industry (Megajoule/tMF según se indica) / (Megajoule/Mt as Shown)
2001 2002 2003 2004 2005 2006 2007 2008 2009 2010 Mina rajo / open Pit 4,6 4,6 5,2 5,8 5,9 5,8 5,8 5,4 5,3 4,9 (MJ/tM mineral extraído)
(MJ/Mt ore Mined)
Mina subterránea / underground Mine 14,0 14,4 14,9 13,3 16,2 17,1 17,1 20,7 18,8 19,2 (MJ/tM mineral extraído)
(MJ/Mt ore Mined)
Mina / Mine (1) 6,0 6,0 6,5 6,9 7,2 7,2 7,2 6,8 6,6 6,2 (MJ/tM mineral extraído)
(MJ/Mt ore Mined)
concentradora / concentrating Plant 67,2 69,6 71,5 70,0 69,9 72,0 73,6 76,8 73,4 72,9 (MJ/tM mineral procesado)
(MJ/Mt ore processed)
Fundición / smelter 1.143,3 1.204,7 1.221,1 1.219,0 1.182,4 1.178,9 1.207,2 1.229,4 1.112,3 1.143,0 (MJ/tM concentrados procesados)
(MJ/Mt Concentrate processed)
lX / sX / eW 64,5 62,6 61,0 61,2 51,7 51,7 49,6 42,5 45,1 41,1 (MJ/tM mineral procesado)
(MJ/Mt ore processed)
(1) promedio ponderado de los Coeficientes Unitarios de Mina rajo y Subterránea / Weighted average Unit ratio, open pit and Underground Mines Fuente / Source: elaborado por la Comisión Chilena del Cobre en base a información de las empresas, recopilada mediante encuesta anual. / Chilean Copper Commission, based on annual company survey.
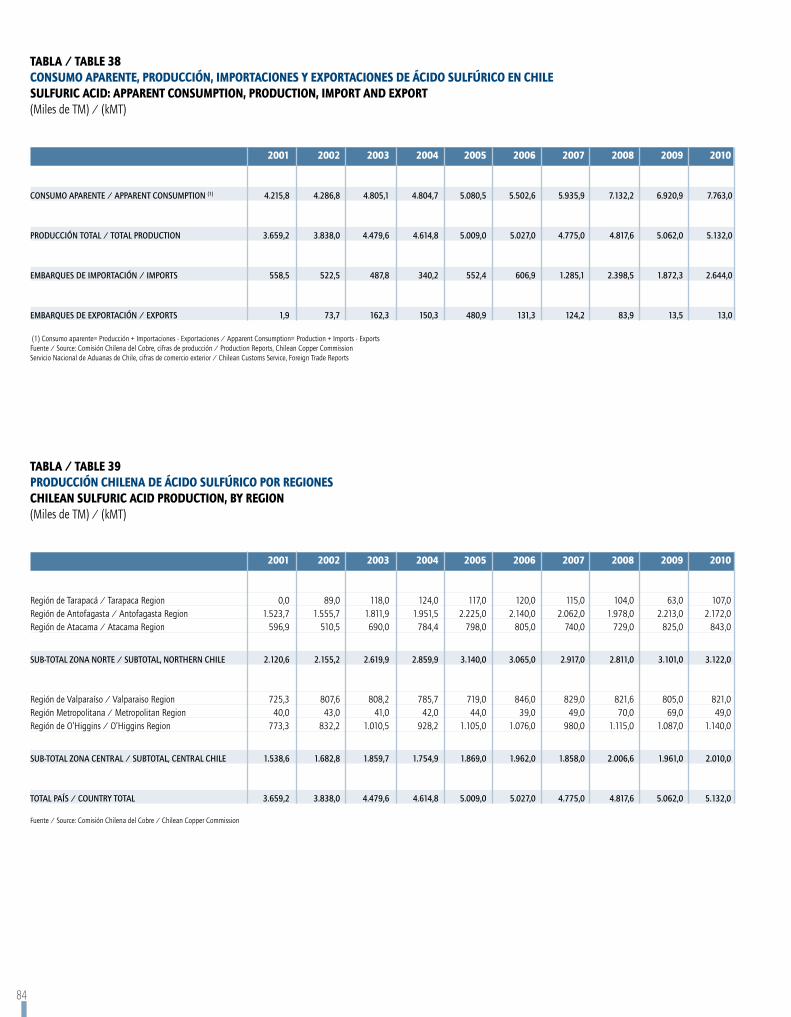
84
TABLA / TABLE 38 CONSUMO APARENTE, PRODUCCIÓN, IMPORTACIONES Y EXPORTACIONES DE ÁCIDO SULFÚRICO EN CHILE SULFURIC ACID: APPARENT CONSUMPTION, PRODUCTION, IMPORT AND EXPORT(Miles de tM) / (kMt) 2001 2002 2003 2004 2005 2006 2007 2008 2009 2010
consuMo APArente / APPArent consuMPtion (1) 4.215,8 4.286,8 4.805,1 4.804,7 5.080,5 5.502,6 5.935,9 7.132,2 6.920,9 7.763,0
ProducciÓn totAl / totAl Production 3.659,2 3.838,0 4.479,6 4.614,8 5.009,0 5.027,0 4.775,0 4.817,6 5.062,0 5.132,0
eMbArQues de iMPortAciÓn / iMPorts 558,5 522,5 487,8 340,2 552,4 606,9 1.285,1 2.398,5 1.872,3 2.644,0
eMbArQues de eXPortAciÓn / eXPorts 1,9 73,7 162,3 150,3 480,9 131,3 124,2 83,9 13,5 13,0
(1) Consumo aparente= producción + importaciones - exportaciones / apparent Consumption= production + imports - exportsFuente / Source: Comisión Chilena del Cobre, cifras de producción / production reports, Chilean Copper CommissionServicio nacional de aduanas de Chile, cifras de comercio exterior / Chilean Customs Service, Foreign trade reports
TABLA / TABLE 39 PRODUCCIÓN CHILENA DE ÁCIDO SULFÚRICO POR REGIONES CHILEAN SULFURIC ACID PRODUCTION, BY REGION (Miles de tM) / (kMt) 2001 2002 2003 2004 2005 2006 2007 2008 2009 2010
región de tarapacá / tarapaca region 0,0 89,0 118,0 124,0 117,0 120,0 115,0 104,0 63,0 107,0región de antofagasta / antofagasta region 1.523,7 1.555,7 1.811,9 1.951,5 2.225,0 2.140,0 2.062,0 1.978,0 2.213,0 2.172,0región de atacama / atacama region 596,9 510,5 690,0 784,4 798,0 805,0 740,0 729,0 825,0 843,0
sub-totAl ZonA norte / subtotAl, nortHern cHile 2.120,6 2.155,2 2.619,9 2.859,9 3.140,0 3.065,0 2.917,0 2.811,0 3.101,0 3.122,0 región de Valparaíso / Valparaiso region 725,3 807,6 808,2 785,7 719,0 846,0 829,0 821,6 805,0 821,0región Metropolitana / Metropolitan region 40,0 43,0 41,0 42,0 44,0 39,0 49,0 70,0 69,0 49,0región de o’higgins / o’higgins region 773,3 832,2 1.010,5 928,2 1.105,0 1.076,0 980,0 1.115,0 1.087,0 1.140,0
sub-totAl ZonA centrAl / subtotAl, centrAl cHile 1.538,6 1.682,8 1.859,7 1.754,9 1.869,0 1.962,0 1.858,0 2.006,6 1.961,0 2.010,0 totAl PAís / country totAl 3.659,2 3.838,0 4.479,6 4.614,8 5.009,0 5.027,0 4.775,0 4.817,6 5.062,0 5.132,0
Fuente / Source: Comisión Chilena del Cobre / Chilean Copper Commission
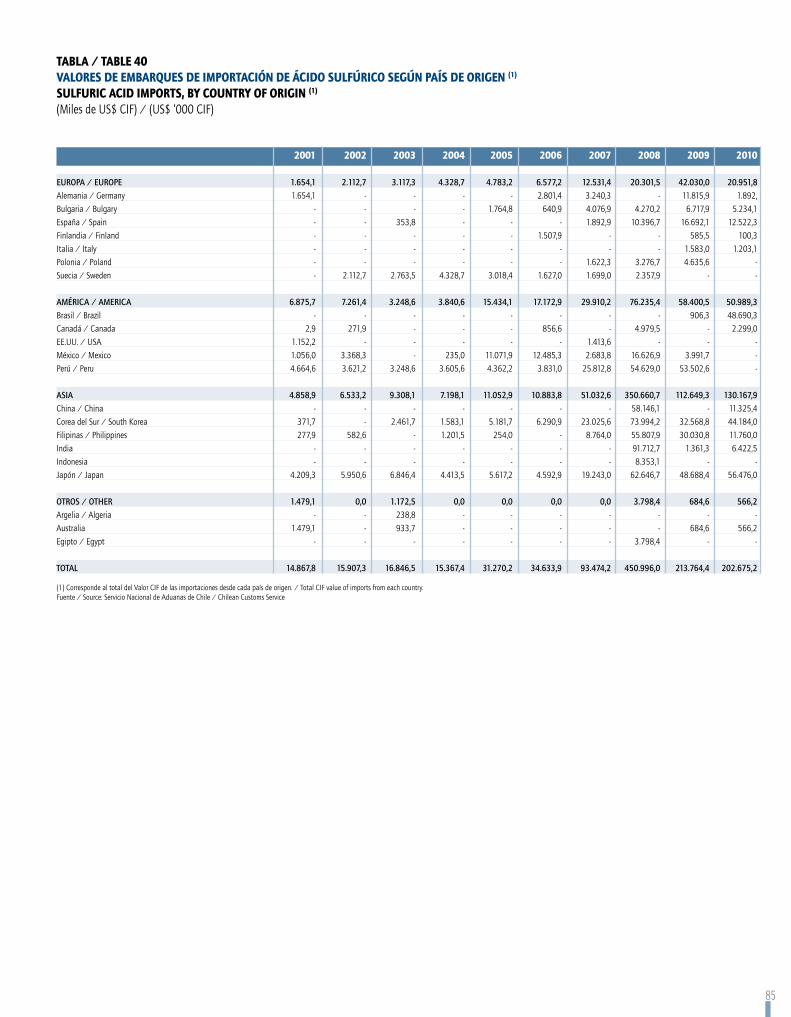
85
TABLA / TABLE 40 VALORES DE EMBARQUES DE IMPORTACIÓN DE ÁCIDO SULFÚRICO SEGÚN PAÍS DE ORIGEN (1)
SULFURIC ACID IMPORTS, BY COUNTRY OF ORIGIN (1) (Miles de US$ CiF) / (US$ ‘000 CiF)
2001 2002 2003 2004 2005 2006 2007 2008 2009 2010
euroPA / euroPe 1.654,1 2.112,7 3.117,3 4.328,7 4.783,2 6.577,2 12.531,4 20.301,5 42.030,0 20.951,8 alemania / Germany 1.654,1 - - - - 2.801,4 3.240,3 - 11.815,9 1.892,
bulgaria / bulgary - - - - 1.764,8 640,9 4.076,9 4.270,2 6.717,9 5.234,1
españa / Spain - - 353,8 - - - 1.892,9 10.396,7 16.692,1 12.522,3
Finlandia / Finland - - - - - 1.507,9 - - 585,5 100,3
italia / italy - - - - - - - - 1.583,0 1.203,1
polonia / poland - - - - - - 1.622,3 3.276,7 4.635,6 -
Suecia / Sweden - 2.112,7 2.763,5 4.328,7 3.018,4 1.627,0 1.699,0 2.357,9 - -
AMÉricA / AMericA 6.875,7 7.261,4 3.248,6 3.840,6 15.434,1 17.172,9 29.910,2 76.235,4 58.400,5 50.989,3 brasil / brazil - - - - - - - - 906,3 48.690,3
Canadá / Canada 2,9 271,9 - - - 856,6 - 4.979,5 - 2.299,0
ee.UU. / USa 1.152,2 - - - - - 1.413,6 - - -
México / Mexico 1.056,0 3.368,3 - 235,0 11.071,9 12.485,3 2.683,8 16.626,9 3.991,7 -
perú / peru 4.664,6 3.621,2 3.248,6 3.605,6 4.362,2 3.831,0 25.812,8 54.629,0 53.502,6 -
AsiA 4.858,9 6.533,2 9.308,1 7.198,1 11.052,9 10.883,8 51.032,6 350.660,7 112.649,3 130.167,9 China / China - - - - - - - 58.146,1 - 11.325,4
Corea del Sur / South korea 371,7 - 2.461,7 1.583,1 5.181,7 6.290,9 23.025,6 73.994,2 32.568,8 44.184,0
Filipinas / philippines 277,9 582,6 - 1.201,5 254,0 - 8.764,0 55.807,9 30.030,8 11.760,0
india - - - - - - - 91.712,7 1.361,3 6.422,5
indonesia - - - - - - - 8.353,1 - -
Japón / Japan 4.209,3 5.950,6 6.846,4 4.413,5 5.617,2 4.592,9 19.243,0 62.646,7 48.688,4 56.476,0
otros / otHer 1.479,1 0,0 1.172,5 0,0 0,0 0,0 0,0 3.798,4 684,6 566,2 argelia / algeria - - 238,8 - - - - - - -
australia 1.479,1 - 933,7 - - - - - 684,6 566,2
egipto / egypt - - - - - - - 3.798,4 - -
totAl 14.867,8 15.907,3 16.846,5 15.367,4 31.270,2 34.633,9 93.474,2 450.996,0 213.764,4 202.675,2
(1) Corresponde al total del Valor CiF de las importaciones desde cada país de origen. / total CiF value of imports from each country.Fuente / Source: Servicio nacional de aduanas de Chile / Chilean Customs Service
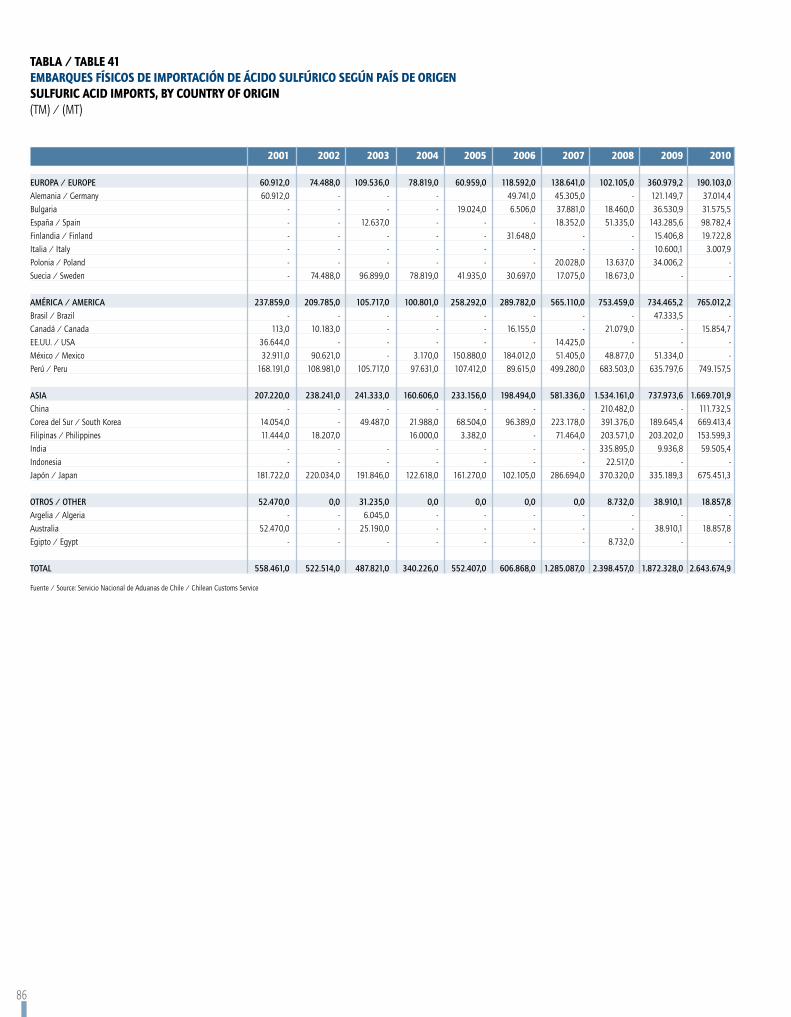
86
TABLA / TABLE 41 EMBARQUES FÍSICOS DE IMPORTACIÓN DE ÁCIDO SULFÚRICO SEGÚN PAÍS DE ORIGENSULFURIC ACID IMPORTS, BY COUNTRY OF ORIGIN(tM) / (Mt)
2001 2002 2003 2004 2005 2006 2007 2008 2009 2010
euroPA / euroPe 60.912,0 74.488,0 109.536,0 78.819,0 60.959,0 118.592,0 138.641,0 102.105,0 360.979,2 190.103,0 alemania / Germany 60.912,0 - - - 49.741,0 45.305,0 - 121.149,7 37.014,4
bulgaria - - - - 19.024,0 6.506,0 37.881,0 18.460,0 36.530,9 31.575,5
españa / Spain - - 12.637,0 - - - 18.352,0 51.335,0 143.285,6 98.782,4
Finlandia / Finland - - - - - 31.648,0 - - 15.406,8 19.722,8
italia / italy - - - - - - - - 10.600,1 3.007,9
polonia / poland - - - - - - 20.028,0 13.637,0 34.006,2 -
Suecia / Sweden - 74.488,0 96.899,0 78.819,0 41.935,0 30.697,0 17.075,0 18.673,0 - -
AMÉricA / AMericA 237.859,0 209.785,0 105.717,0 100.801,0 258.292,0 289.782,0 565.110,0 753.459,0 734.465,2 765.012,2 brasil / brazil - - - - - - - - 47.333,5 -
Canadá / Canada 113,0 10.183,0 - - - 16.155,0 - 21.079,0 - 15.854,7
ee.UU. / USa 36.644,0 - - - - - 14.425,0 - - -
México / Mexico 32.911,0 90.621,0 - 3.170,0 150.880,0 184.012,0 51.405,0 48.877,0 51.334,0 -
perú / peru 168.191,0 108.981,0 105.717,0 97.631,0 107.412,0 89.615,0 499.280,0 683.503,0 635.797,6 749.157,5
AsiA 207.220,0 238.241,0 241.333,0 160.606,0 233.156,0 198.494,0 581.336,0 1.534.161,0 737.973,6 1.669.701,9 China - - - - - - - 210.482,0 - 111.732,5
Corea del Sur / South korea 14.054,0 - 49.487,0 21.988,0 68.504,0 96.389,0 223.178,0 391.376,0 189.645,4 669.413,4
Filipinas / philippines 11.444,0 18.207,0 16.000,0 3.382,0 - 71.464,0 203.571,0 203.202,0 153.599,3
india - - - - - - - 335.895,0 9.936,8 59.505,4
indonesia - - - - - - - 22.517,0 - -
Japón / Japan 181.722,0 220.034,0 191.846,0 122.618,0 161.270,0 102.105,0 286.694,0 370.320,0 335.189,3 675.451,3
otros / otHer 52.470,0 0,0 31.235,0 0,0 0,0 0,0 0,0 8.732,0 38.910,1 18.857,8 argelia / algeria - - 6.045,0 - - - - - - -
australia 52.470,0 - 25.190,0 - - - - - 38.910,1 18.857,8
egipto / egypt - - - - - - - 8.732,0 - -
totAl 558.461,0 522.514,0 487.821,0 340.226,0 552.407,0 606.868,0 1.285.087,0 2.398.457,0 1.872.328,0 2.643.674,9 Fuente / Source: Servicio nacional de aduanas de Chile / Chilean Customs Service
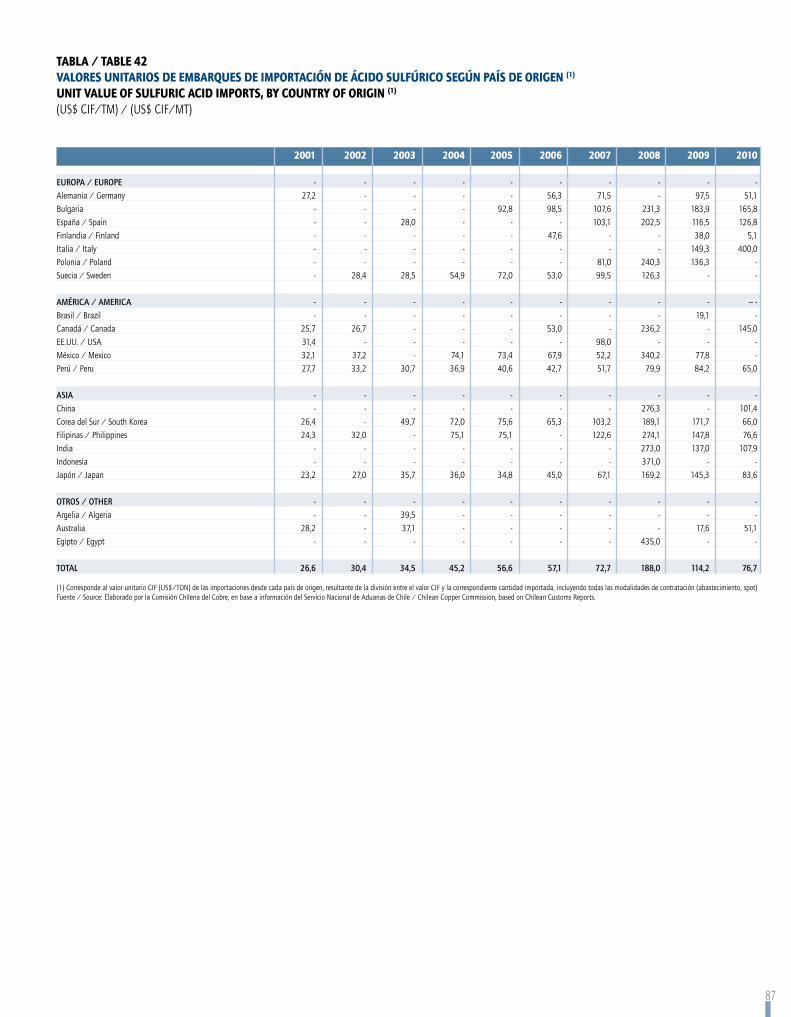
87
TABLA / TABLE 42 VALORES UNITARIOS DE EMBARQUES DE IMPORTACIÓN DE ÁCIDO SULFÚRICO SEGÚN PAÍS DE ORIGEN (1)
UNIT VALUE OF SULFURIC ACID IMPORTS, BY COUNTRY OF ORIGIN (1) (US$ CiF/tM) / (US$ CiF/Mt)
2001 2002 2003 2004 2005 2006 2007 2008 2009 2010
euroPA / euroPe - - - - - - - - - - alemania / Germany 27,2 - - - - 56,3 71,5 - 97,5 51,1
bulgaria - - - - 92,8 98,5 107,6 231,3 183,9 165,8
españa / Spain - - 28,0 - - - 103,1 202,5 116,5 126,8
Finlandia / Finland - - - - - 47,6 - - 38,0 5,1
italia / italy - - - - - - - - 149,3 400,0
polonia / poland - - - - - - 81,0 240,3 136,3 -
Suecia / Sweden - 28,4 28,5 54,9 72,0 53,0 99,5 126,3 - -
AMÉricA / AMericA - - - - - - - - - -- - brasil / brazil - - - - - - - - 19,1 -
Canadá / Canada 25,7 26,7 - - - 53,0 - 236,2 - 145,0
ee.UU. / USa 31,4 - - - - - 98,0 - - -
México / Mexico 32,1 37,2 - 74,1 73,4 67,9 52,2 340,2 77,8 -
perú / peru 27,7 33,2 30,7 36,9 40,6 42,7 51,7 79,9 84,2 65,0
AsiA - - - - - - - - - - China - - - - - - - 276,3 - 101,4
Corea del Sur / South korea 26,4 - 49,7 72,0 75,6 65,3 103,2 189,1 171,7 66,0
Filipinas / philippines 24,3 32,0 - 75,1 75,1 - 122,6 274,1 147,8 76,6
india - - - - - - - 273,0 137,0 107,9
indonesia - - - - - - - 371,0 - -
Japón / Japan 23,2 27,0 35,7 36,0 34,8 45,0 67,1 169,2 145,3 83,6
otros / otHer - - - - - - - - - - argelia / algeria - - 39,5 - - - - - - -
australia 28,2 - 37,1 - - - - - 17,6 51,1
egipto / egypt - - - - - - - 435,0 - -
totAl 26,6 30,4 34,5 45,2 56,6 57,1 72,7 188,0 114,2 76,7
(1) Corresponde al valor unitario CiF (US$/ton) de las importaciones desde cada país de origen, resultante de la división entre el valor CiF y la correspondiente cantidad importada, incluyendo todas las modalidades de contratación (abastecimiento, spot) Fuente / Source: elaborado por la Comisión Chilena del Cobre, en base a información del Servicio nacional de aduanas de Chile / Chilean Copper Commission, based on Chilean Customs reports.
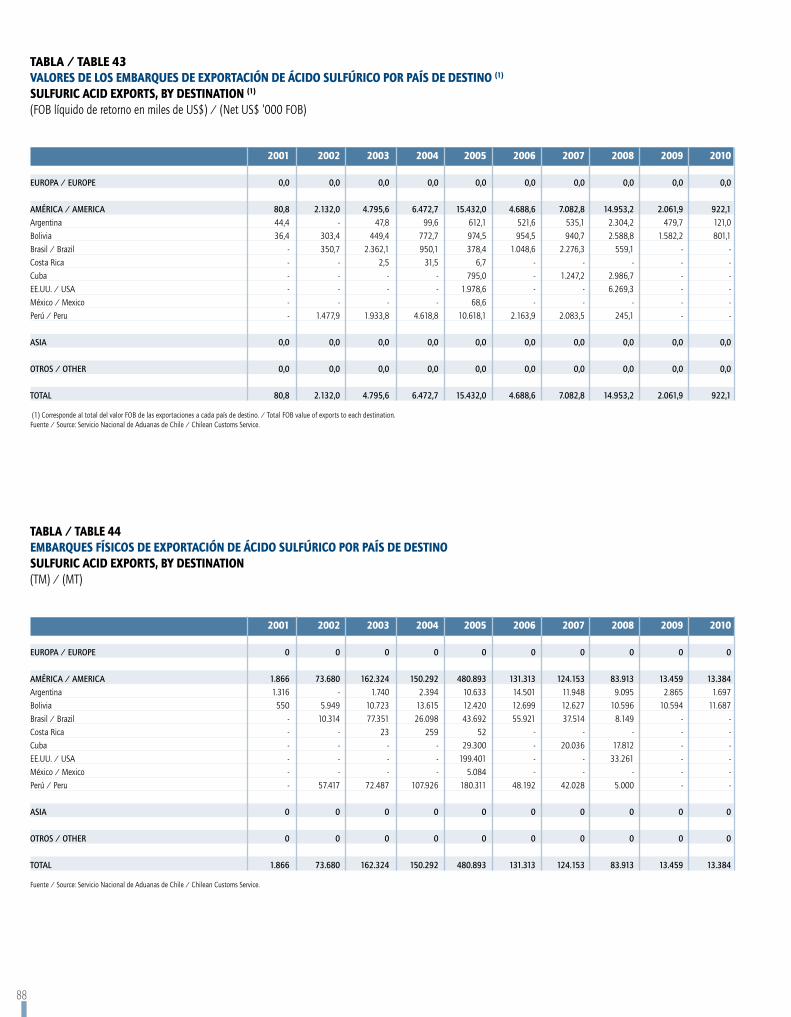
88
TABLA / TABLE 43VALORES DE LOS EMBARQUES DE EXPORTACIÓN DE ÁCIDO SULFÚRICO POR PAÍS DE DESTINO (1) SULFURIC ACID EXPORTS, BY DESTINATION (1)
(Fob líquido de retorno en miles de US$) / (net US$ ‘000 Fob)
2001 2002 2003 2004 2005 2006 2007 2008 2009 2010
euroPA / euroPe 0,0 0,0 0,0 0,0 0,0 0,0 0,0 0,0 0,0 0,0
AMÉricA / AMericA 80,8 2.132,0 4.795,6 6.472,7 15.432,0 4.688,6 7.082,8 14.953,2 2.061,9 922,1 argentina 44,4 - 47,8 99,6 612,1 521,6 535,1 2.304,2 479,7 121,0
bolivia 36,4 303,4 449,4 772,7 974,5 954,5 940,7 2.588,8 1.582,2 801,1
brasil / brazil - 350,7 2.362,1 950,1 378,4 1.048,6 2.276,3 559,1 - -
Costa rica - - 2,5 31,5 6,7 - - - - -
Cuba - - - - 795,0 - 1.247,2 2.986,7 - -
ee.UU. / USa - - - - 1.978,6 - - 6.269,3 - -
México / Mexico - - - - 68,6 - - - - -
perú / peru - 1.477,9 1.933,8 4.618,8 10.618,1 2.163,9 2.083,5 245,1 - -
AsiA 0,0 0,0 0,0 0,0 0,0 0,0 0,0 0,0 0,0 0,0
otros / otHer 0,0 0,0 0,0 0,0 0,0 0,0 0,0 0,0 0,0 0,0
totAl 80,8 2.132,0 4.795,6 6.472,7 15.432,0 4.688,6 7.082,8 14.953,2 2.061,9 922,1 (1) Corresponde al total del valor Fob de las exportaciones a cada país de destino. / total Fob value of exports to each destination.Fuente / Source: Servicio nacional de aduanas de Chile / Chilean Customs Service.
TABLA / TABLE 44EMBARQUES FÍSICOS DE EXPORTACIÓN DE ÁCIDO SULFÚRICO POR PAÍS DE DESTINOSULFURIC ACID EXPORTS, BY DESTINATION(tM) / (Mt)
2001 2002 2003 2004 2005 2006 2007 2008 2009 2010
euroPA / euroPe 0 0 0 0 0 0 0 0 0 0
AMÉricA / AMericA 1.866 73.680 162.324 150.292 480.893 131.313 124.153 83.913 13.459 13.384 argentina 1.316 - 1.740 2.394 10.633 14.501 11.948 9.095 2.865 1.697
bolivia 550 5.949 10.723 13.615 12.420 12.699 12.627 10.596 10.594 11.687
brasil / brazil - 10.314 77.351 26.098 43.692 55.921 37.514 8.149 - -
Costa rica - - 23 259 52 - - - - -
Cuba - - - - 29.300 - 20.036 17.812 - -
ee.UU. / USa - - - - 199.401 - - 33.261 - -
México / Mexico - - - - 5.084 - - - - -
perú / peru - 57.417 72.487 107.926 180.311 48.192 42.028 5.000 - -
AsiA 0 0 0 0 0 0 0 0 0 0
otros / otHer 0 0 0 0 0 0 0 0 0 0
totAl 1.866 73.680 162.324 150.292 480.893 131.313 124.153 83.913 13.459 13.384
Fuente / Source: Servicio nacional de aduanas de Chile / Chilean Customs Service.
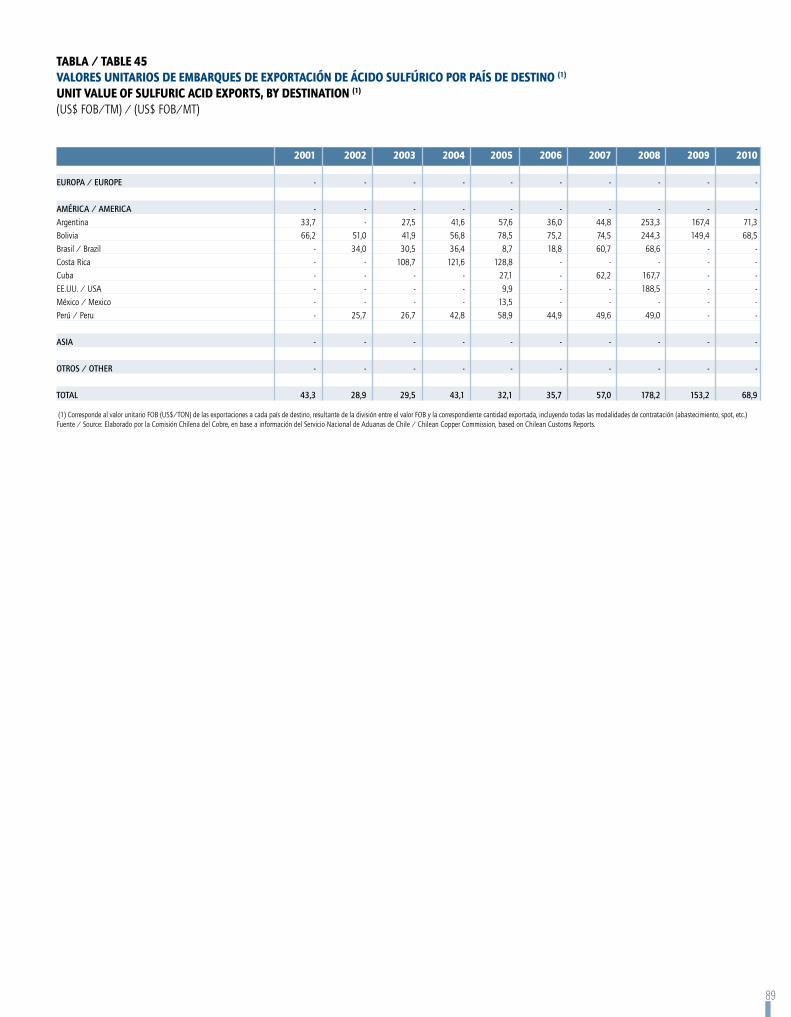
89
TABLA / TABLE 45 VALORES UNITARIOS DE EMBARQUES DE EXPORTACIÓN DE ÁCIDO SULFÚRICO POR PAÍS DE DESTINO (1)
UNIT VALUE OF SULFURIC ACID EXPORTS, BY DESTINATION (1) (US$ Fob/tM) / (US$ Fob/Mt)
2001 2002 2003 2004 2005 2006 2007 2008 2009 2010
euroPA / euroPe - - - - - - - - - -
AMÉricA / AMericA - - - - - - - - - - argentina 33,7 - 27,5 41,6 57,6 36,0 44,8 253,3 167,4 71,3
bolivia 66,2 51,0 41,9 56,8 78,5 75,2 74,5 244,3 149,4 68,5
brasil / brazil - 34,0 30,5 36,4 8,7 18,8 60,7 68,6 - -
Costa rica - - 108,7 121,6 128,8 - - - - -
Cuba - - - - 27,1 - 62,2 167,7 - -
ee.UU. / USa - - - - 9,9 - - 188,5 - -
México / Mexico - - - - 13,5 - - - - -
perú / peru - 25,7 26,7 42,8 58,9 44,9 49,6 49,0 - -
AsiA - - - - - - - - - -
otros / otHer - - - - - - - - - -
totAl 43,3 28,9 29,5 43,1 32,1 35,7 57,0 178,2 153,2 68,9 (1) Corresponde al valor unitario Fob (US$/ton) de las exportaciones a cada país de destino, resultante de la división entre el valor Fob y la correspondiente cantidad exportada, incluyendo todas las modalidades de contratación (abastecimiento, spot, etc.) Fuente / Source: elaborado por la Comisión Chilena del Cobre, en base a información del Servicio nacional de aduanas de Chile / Chilean Copper Commission, based on Chilean Customs reports.

90

91
1.6INDICADORES DE COMPETITIVIDAD DE LA INDUSTRIA DEL COBRE EN CHILEcHileAn coPPer industry: coMPetitiVeness indicAtors
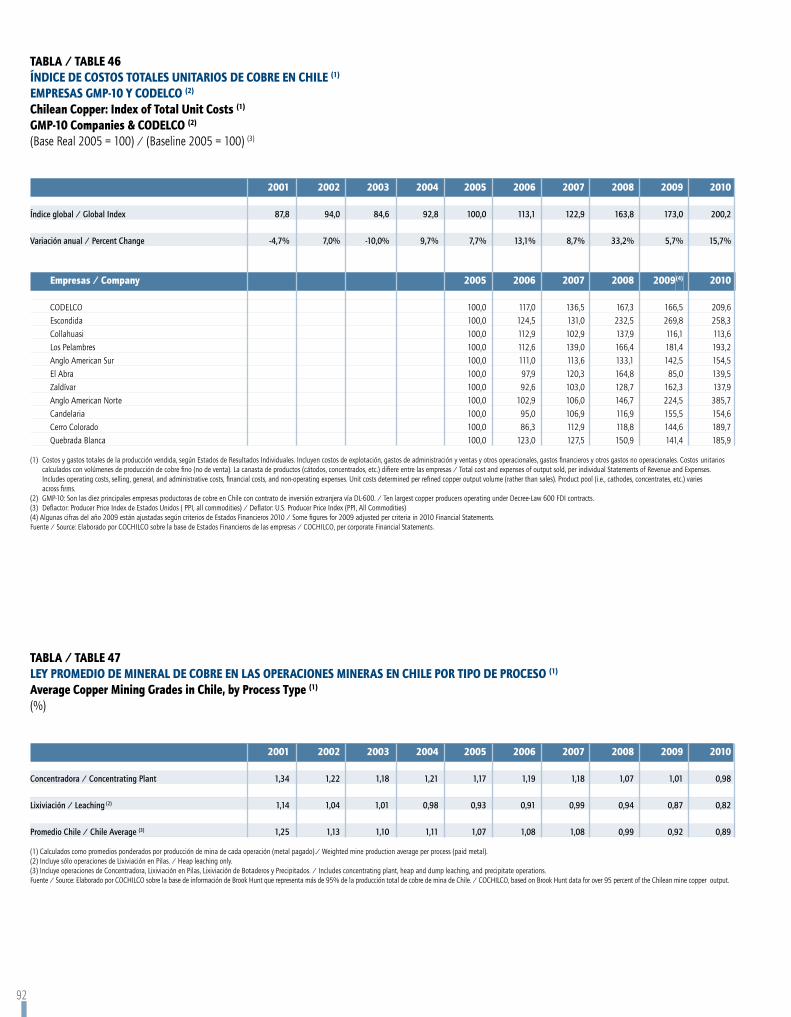
92
TABLA / TABLE 47LEY PROMEDIO DE MINERAL DE COBRE EN LAS OPERACIONES MINERAS EN CHILE POR TIPO DE PROCESO (1)
Average Copper Mining Grades in Chile, by Process Type (1)
(%)
2001 2002 2003 2004 2005 2006 2007 2008 2009 2010
concentradora / concentrating Plant 1,34 1,22 1,18 1,21 1,17 1,19 1,18 1,07 1,01 0,98
lixiviación / leaching (2) 1,14 1,04 1,01 0,98 0,93 0,91 0,99 0,94 0,87 0,82
Promedio chile / chile Average (3) 1,25 1,13 1,10 1,11 1,07 1,08 1,08 0,99 0,92 0,89
(1) Calculados como promedios ponderados por producción de mina de cada operación (metal pagado)./ Weighted mine production average per process (paid metal). (2) incluye sólo operaciones de lixiviación en pilas. / heap leaching only.(3) incluye operaciones de Concentradora, lixiviación en pilas, lixiviación de botaderos y precipitados. / includes concentrating plant, heap and dump leaching, and precipitate operations. Fuente / Source: elaborado por CoChilCo sobre la base de información de brook hunt que representa más de 95% de la producción total de cobre de mina de Chile. / CoChilCo, based on brook hunt data for over 95 percent of the Chilean mine copper output.
TABLA / TABLE 46ÍNDICE DE COSTOS TOTALES UNITARIOS DE COBRE EN CHILE (1)
EMPRESAS GMP-10 Y CODELCO (2)
Chilean Copper: Index of Total Unit Costs (1)
GMP-10 Companies & CODELCO (2)
(base real 2005 = 100) / (baseline 2005 = 100) (3)
2001 2002 2003 2004 2005 2006 2007 2008 2009 2010
índice global / Global index 87,8 94,0 84,6 92,8 100,0 113,1 122,9 163,8 173,0 200,2
Variación anual / Percent change -4,7% 7,0% -10,0% 9,7% 7,7% 13,1% 8,7% 33,2% 5,7% 15,7%
Empresas / Company 2005 2006 2007 2008 2009(4) 2010
CodelCo 100,0 117,0 136,5 167,3 166,5 209,6
escondida 100,0 124,5 131,0 232,5 269,8 258,3
Collahuasi 100,0 112,9 102,9 137,9 116,1 113,6
los pelambres 100,0 112,6 139,0 166,4 181,4 193,2
anglo american Sur 100,0 111,0 113,6 133,1 142,5 154,5
el abra 100,0 97,9 120,3 164,8 85,0 139,5
Zaldívar 100,0 92,6 103,0 128,7 162,3 137,9
anglo american norte 100,0 102,9 106,0 146,7 224,5 385,7
Candelaria 100,0 95,0 106,9 116,9 155,5 154,6
Cerro Colorado 100,0 86,3 112,9 118,8 144,6 189,7
Quebrada blanca 100,0 123,0 127,5 150,9 141,4 185,9
(1) Costos y gastos totales de la producción vendida, según estados de resultados individuales. incluyen costos de explotación, gastos de administración y ventas y otros operacionales, gastos financieros y otros gastos no operacionales. Costos unitarios calculados con volúmenes de producción de cobre fino (no de venta). la canasta de productos (cátodos, concentrados, etc.) difiere entre las empresas / total cost and expenses of output sold, per individual Statements of revenue and expenses. includes operating costs, selling, general, and administrative costs, financial costs, and non-operating expenses. Unit costs determined per refined copper output volume (rather than sales). product pool (i.e., cathodes, concentrates, etc.) varies across firms. (2) GMp-10: Son las diez principales empresas productoras de cobre en Chile con contrato de inversión extranjera vía dl-600. / ten largest copper producers operating under decree-law 600 Fdi contracts.(3) deflactor: producer price index de estados Unidos ( ppi, all commodities) / deflator: U.S. producer price index (ppi, all Commodities) (4) algunas cifras del año 2009 están ajustadas según criterios de estados Financieros 2010 / Some figures for 2009 adjusted per criteria in 2010 Financial Statements.Fuente / Source: elaborado por CoChilCo sobre la base de estados Financieros de las empresas / CoChilCo, per corporate Financial Statements.
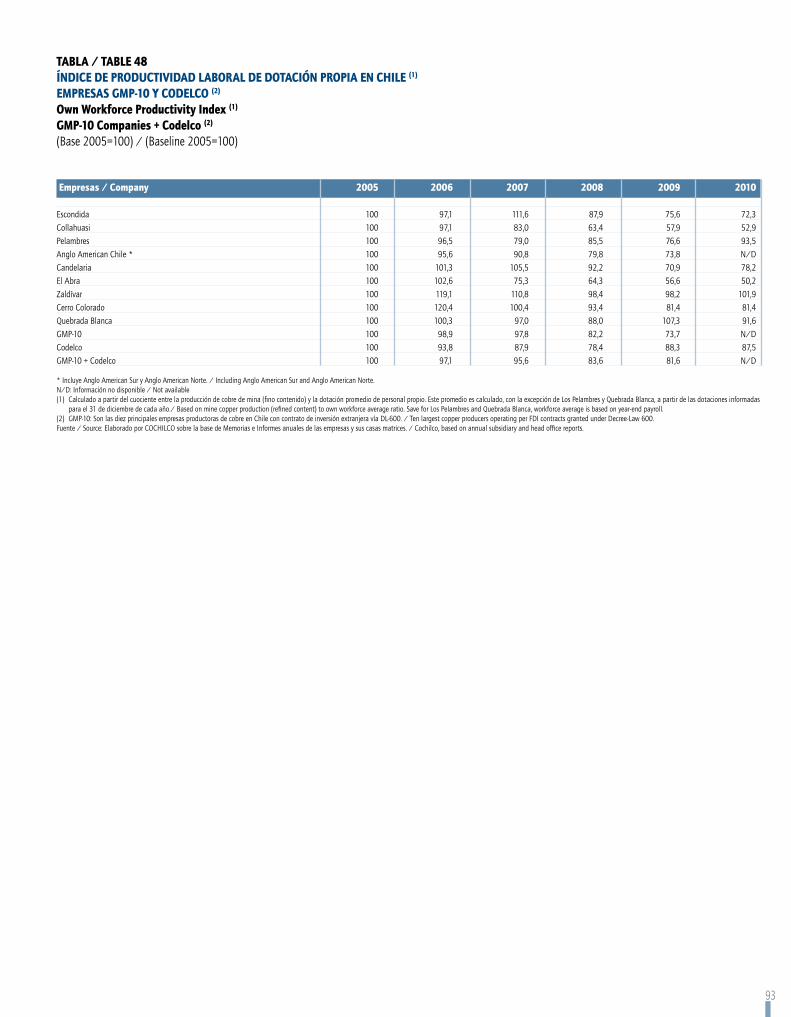
93
TABLA / TABLE 48 ÍNDICE DE PRODUCTIVIDAD LABORAL DE DOTACIÓN PROPIA EN CHILE (1) EMPRESAS GMP-10 Y CODELCO (2) Own Workforce Productivity Index (1) GMP-10 Companies + Codelco (2) (base 2005=100) / (baseline 2005=100)
Empresas / Company 2005 2006 2007 2008 2009 2010
escondida 100 97,1 111,6 87,9 75,6 72,3
Collahuasi 100 97,1 83,0 63,4 57,9 52,9
pelambres 100 96,5 79,0 85,5 76,6 93,5
anglo american Chile * 100 95,6 90,8 79,8 73,8 n/d
Candelaria 100 101,3 105,5 92,2 70,9 78,2
el abra 100 102,6 75,3 64,3 56,6 50,2
Zaldívar 100 119,1 110,8 98,4 98,2 101,9
Cerro Colorado 100 120,4 100,4 93,4 81,4 81,4
Quebrada blanca 100 100,3 97,0 88,0 107,3 91,6
GMp-10 100 98,9 97,8 82,2 73,7 n/d
Codelco 100 93,8 87,9 78,4 88,3 87,5
GMp-10 + Codelco 100 97,1 95,6 83,6 81,6 n/d
* incluye anglo american Sur y anglo american norte. / including anglo american Sur and anglo american norte. n/d: información no disponible / not available (1) Calculado a partir del cuociente entre la producción de cobre de mina (fino contenido) y la dotación promedio de personal propio. este promedio es calculado, con la excepción de los pelambres y Quebrada blanca, a partir de las dotaciones informadas para el 31 de diciembre de cada año./ based on mine copper production (refined content) to own workforce average ratio. Save for los pelambres and Quebrada blanca, workforce average is based on year-end payroll.(2) GMp-10: Son las diez principales empresas productoras de cobre en Chile con contrato de inversión extranjera vía dl-600. / ten largest copper producers operating per Fdi contracts granted under decree-law 600.Fuente / Source: elaborado por CoChilCo sobre la base de Memorias e informes anuales de las empresas y sus casas matrices. / Cochilco, based on annual subsidiary and head office reports.
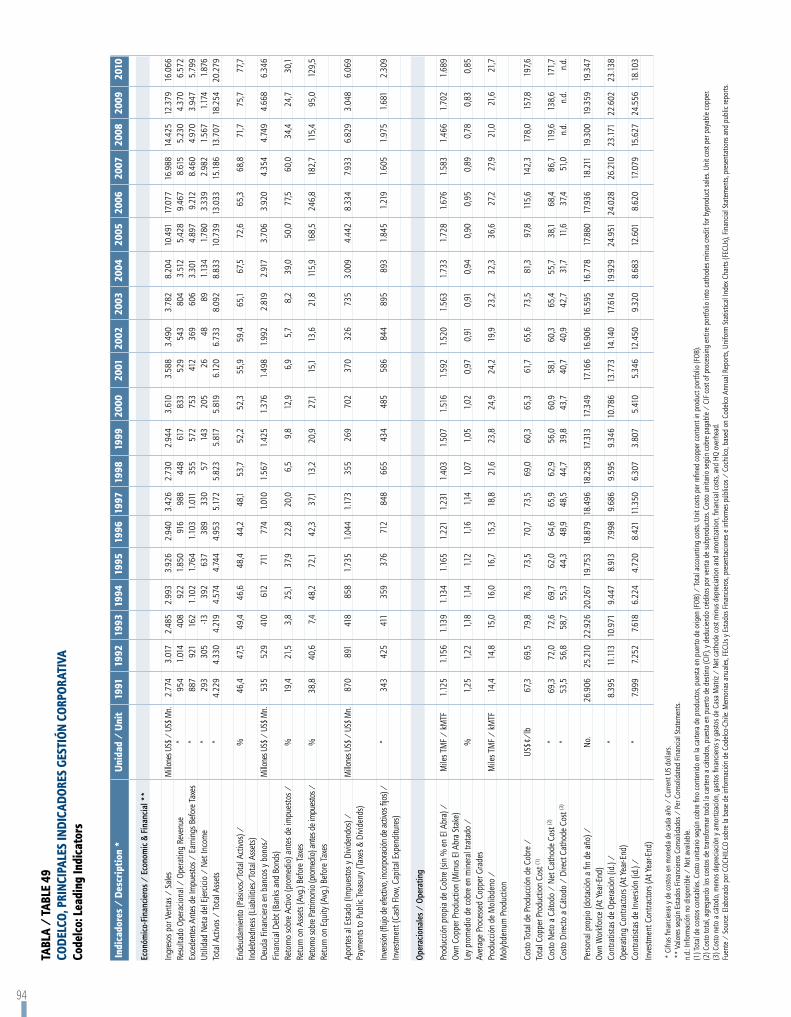
94
TABL
A /
TABL
E 49
CO
DELC
O, P
RINC
IPAL
ES IN
DICA
DORE
S GE
STIÓ
N CO
RPOR
ATIV
A
Co
delc
o: L
eadi
ng In
dica
tors
Indi
cado
res
/ D
escr
ipti
on *
U
nida
d /
Uni
t 19
91
1992
19
93
1994
19
95
1996
19
97
1998
19
99
2000
20
01
2002
20
03
2004
20
05
2006
20
07
2008
20
09
2010
econ
ómic
o-Fi
nanc
iero
s /
econ
omic
& F
inan
cial
**
ingr
esos
por
Ven
tas /
Sal
es
Millo
nes U
S$ /
US$
Mn.
2.77
4 3.
017
2.48
5 2.
993
3.92
6 2.
940
3.42
6 2.
730
2.94
4 3.
610
3.58
8 3.
490
3.78
2 8.
204
10.4
91
17.0
77
16.9
88
14.4
25
12.3
79
16.0
66re
sulta
do o
pera
ciona
l / o
pera
ting
reve
nue
“ 95
4 1.
014
408
922
1.85
0 91
6 98
8 44
8 61
7 83
3 52
9 54
3 80
4 3.
512
5.42
8 9.
467
8.61
5 5.
230
4.37
0 6.
572
exce
dent
es a
ntes
de
impu
esto
s / e
arni
ngs b
efor
e ta
xes
“ 88
7 92
1 16
2 1.
102
1.76
4 1.
103
1.01
1 35
5 57
2 75
3 41
2 36
9 60
6 3.
301
4.89
7 9.
212
8.46
0 4.
970
3.94
7 5.
799
Util
idad
net
a de
l eje
rcici
o /
net
inco
me
“
293
305
-13
392
637
389
330
57
143
205
26
48
89
1.13
4 1.
780
3.33
9 2.
982
1.56
7 1.
174
1.87
6to
tal a
ctivo
s / t
otal
ass
ets
“ 4.
229
4.33
0 4.
219
4.57
4 4.
744
4.95
3 5.
172
5.82
3 5.
817
5.81
9 6.
120
6.73
3 8.
092
8.83
3 10
.739
13
.033
15
.186
13
.707
18
.254
20
.279
en
deud
amie
nto
(pas
ivos/
tota
l act
ivos)
/
%
46,4
47
,5
49,4
46
,6
48,4
44
,2
48,1
53
,7
52,2
52
,3
55,9
59
,4
65,1
67
,5
72,6
65
,3
68,8
71
,7
75,7
77
,7in
debt
edne
ss (l
iabi
litie
s/to
tal a
sset
s)d
euda
Fin
ancie
ra e
n ba
ncos
y b
onos
/
Millo
nes U
S$ /
US$
Mn.
535
529
410
612
711
774
1.01
0 1.
567
1.42
5 1.
376
1.49
8 1.
992
2.81
9 2.
917
3.70
6 3.
920
4.35
4 4.
749
4.66
8 6.
346
Fina
ncia
l deb
t (ba
nks a
nd b
onds
) re
torn
o so
bre
activ
o (p
rom
edio
) ant
es d
e im
pues
tos /
%
19
,4
21,5
3,
8 25
,1
37,9
22
,8
20,0
6,
5 9,
8 12
,9
6,9
5,7
8,2
39,0
50
,0
77,5
60
,0
34,4
24
,7
30,1
retu
rn o
n as
sets
(avg
.) be
fore
taxe
sre
torn
o so
bre
patri
mon
io (p
rom
edio
) ant
es d
e im
pues
tos /
%
38
,8
40,6
7,4
48
,2
72,1
42
,3
37,1
13
,2
20,9
27
,1
15,1
13
,6
21,8
11
5,9
168,
5 24
6,8
182,
7 11
5,4
95,0
12
9,5
retu
rn o
n eq
uity
(avg
.) be
fore
taxe
s
apor
tes a
l est
ado
(impu
esto
s y d
ivid
endo
s) /
M
illone
s US$
/ U
S$ M
n. 87
0 89
1 41
8 85
8 1.
735
1.04
4 1.
173
355
269
702
370
326
735
3.00
9 4.
442
8.33
4 7.
933
6.82
9 3.
048
6.06
9pa
ymen
ts to
pub
lic t
reas
ury
(tax
es &
div
iden
ds)
inve
rsión
(fluj
o de
efe
ctivo
, inco
rpor
ació
n de
act
ivos fi
jos)
/ “
343
425
411
359
376
712
848
665
434
485
586
844
895
893
1.84
5 1.
219
1.60
5 1.
975
1.68
1 2.
309
inve
stm
ent (
Cash
Flo
w, C
apita
l exp
endi
ture
s)
ope
raci
onal
es /
ope
ratin
g
pr
oduc
ción
prop
ia d
e Co
bre
(sin
% e
n el
abr
a) /
M
iles t
MF
/ kM
tF
1.12
5 1.
156
1.13
9 1.
134
1.16
5 1.
221
1.23
1 1.
403
1.50
7 1.
516
1.59
2 1.
520
1.56
3 1.
733
1.72
8 1.
676
1.58
3 1.
466
1.70
2 1.
689
own
Copp
er p
rodu
ctio
n (M
inus
el a
bra
Stak
e)le
y pr
omed
io d
e co
bre
en m
iner
al tr
atad
o /
%
1,
25
1,22
1,1
8 1,1
4 1,1
2 1,1
6 1,1
4 1,
07
1,05
1,
02
0,97
0,
91
0,91
0,
94
0,90
0,
95
0,89
0,
78
0,83
0,
85av
erag
e pr
oces
sed
Copp
er G
rade
s pr
oduc
ción
de M
olib
deno
/
Mile
s tM
F /
kMtF
14
,4
14,8
15
,0
16,0
16
,7
15,3
18
,8
21,6
23
,8
24,9
24
,2
19,9
23
,2
32,3
36
,6
27,2
27
,9
21,0
21
,6
21,7
Mol
ybde
num
pro
duct
ion
Cost
o to
tal d
e pr
oduc
ción
de C
obre
/
US$
¢/lb
67
,3
69,5
79
,8
76,3
73
,5
70,7
73
,5
69,0
60
,3
65,3
61
,7
65,6
73
,5
81,3
97
,8
115,
6 14
2,3
178,
0 15
7,8
197,6
tota
l Cop
per p
rodu
ctio
n Co
st (1
)
Cost
o n
eto
a Cá
todo
/ n
et C
atho
de C
ost (2
) “
69,3
72
,0
72,6
69
,7
62,0
64
,6
65,9
62
,9
56,0
60
,9
58,1
60
,3
65,4
55
,7
38,1
68
,4
86,7
11
9,6
138,
6 17
1,7
Cost
o d
irect
o a
Cáto
do /
dire
ct C
atho
de C
ost (3
) “
53,5
56
,8
58,7
55
,3
44,3
48
,9
48,5
44
,7
39,8
43
,7
40,7
40
,9
42,7
31
,7
11,6
37
,4
51,0
n.
d.
n.d.
n.
d.
pers
onal
pro
pio
(dot
ació
n a
fin d
e añ
o) /
n
o.
26.9
06
25.2
10
22.9
26
20.2
67
19.7
53
18.8
79
18.4
96
18.2
58
17.3
13
17.3
49
17.1
66
16.9
06
16.5
95
16.7
78
17.8
80
17.9
36
18.2
11
19.3
00
19.3
59
19.3
47ow
n W
orkf
orce
(at Y
ear-e
nd)
Cont
ratis
tas d
e op
erac
ión
(id.)
/
“ 8.
395
11.11
3 10
.971
9.
447
8.91
3 7.
998
9.68
6 9.
595
9.34
6 10
.786
13
.773
14
.140
17
.614
19
.929
24
.951
24
.028
26
.210
23
.171
22
.602
23
.138
oper
atin
g Co
ntra
ctor
s (at
Yea
r-end
) Co
ntra
tista
s de
inve
rsió
n (id
.) /
“
7.99
9 7.
252
7.61
8 6.
224
4.72
0 8.
421
11.3
50
6.30
7 3.
807
5.41
0 5.
346
12.4
50
9.32
0 8.
683
12.6
01
8.62
0 17
.079
15
.627
24
.556
18
.103
inve
stm
ent C
ontra
ctor
s (at
Yea
r-end
)
* C
ifras
fina
ncie
ras y
de
cost
os e
n m
oned
a de
cad
a añ
o /
Curre
nt U
S do
llars
.
*
* Va
lore
s seg
ún e
stad
os F
inan
ciero
s Con
solid
ados
/ p
er C
onso
lidat
ed F
inan
cial S
tate
men
ts.
n.
d.: i
nfor
mac
ión
no d
ispon
ible
/ n
ot a
vaila
ble.
(1
) tot
al d
e co
stos
con
tabl
es. C
osto
uni
tario
segú
n co
bre
fino
cont
enid
o en
la c
arte
ra d
e pr
oduc
tos,
pues
ta e
n pu
erto
de
orig
en (F
ob) /
tot
al a
ccou
ntin
g co
sts.
Unit
cost
s per
refin
ed c
oppe
r con
tent
in p
rodu
ct p
ortfo
lio (F
ob).
(2) C
osto
tota
l, ag
rega
ndo
los c
osto
s de
trans
form
ar to
da la
car
tera
a c
átod
os, p
uest
a en
pue
rto d
e de
stin
o (C
iF),
y de
ducie
ndo
créd
itos p
or v
enta
de
subp
rodu
ctos
. Cos
to u
nita
rio se
gún
cobr
e pa
gabl
e /
CiF
cost
of p
roce
ssin
g en
tire
portf
olio
into
cat
hode
s min
us c
redi
t for
byp
rodu
ct sa
les.
Unit
cost
per
pay
able
cop
per.
(3) C
osto
net
o a
cáto
do, m
enos
dep
recia
ción
y am
ortiz
ació
n, g
asto
s fina
ncie
ros y
gas
tos d
e Ca
sa M
atriz
/ n
et c
atho
de c
ost m
inus
dep
recia
tion
and
amor
tizat
ion,
fina
ncia
l cos
ts, a
nd h
Q ov
erhe
ad.
Fuen
te /
Sou
rce:
ela
bora
do p
or C
oCh
ilCo
sobr
e la
bas
e de
info
rmac
ión
de C
odel
co-C
hile
: Mem
oria
s anu
ales
, FeC
Us y
est
ados
Fin
ancie
ros,
pres
enta
cione
s e in
form
es p
úblic
os /
Coc
hilco
, bas
ed o
n Co
delco
ann
ual r
epor
ts, U
nifo
rm S
tatis
tical
inde
x Ch
arts
(FeC
Us)
, Fin
ancia
l Sta
tem
ents
, pre
sent
atio
ns a
nd p
ublic
repo
rts.
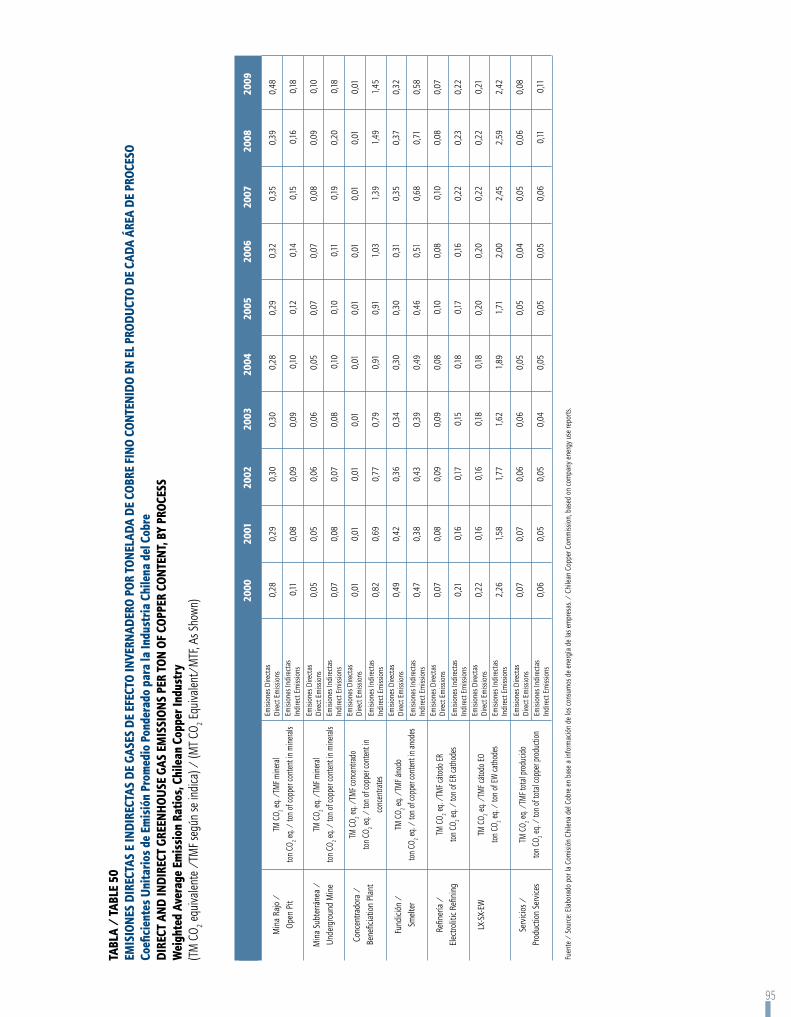
95
TABL
A /
TABL
E 50
EMIS
IONE
S DI
RECT
AS E
IND
IREC
TAS
DE G
ASES
DE
EFEC
TO IN
VERN
ADER
O PO
R TO
NELA
DA D
E CO
BRE
FINO
CON
TENI
DO E
N EL
PRO
DUCT
O DE
CAD
A ÁR
EA D
E PR
OCES
O Co
efici
ente
s U
nita
rios
de E
mis
ión
Prom
edio
Pon
dera
do p
ara
la In
dust
ria C
hile
na d
el C
obre
DI
RECT
AND
INDI
RECT
GRE
ENH
OUSE
GAS
EM
ISSI
ONS
PER
TON
OF C
OPPE
R CO
NTEN
T, B
Y PR
OCES
S
W
eigh
ted
Aver
age
Emis
sion
Rat
ios,
Chi
lean
Cop
per I
ndus
try
(t
M C
o 2 equ
ivale
nte
/tM
F se
gún
se in
dica
) / (M
t Co
2 equ
ivale
nt/M
tF, a
s Sho
wn)
0,
28
0,2
9
0,3
0
0,3
0
0,2
8
0,2
9
0,3
2
0,3
5
0,3
9
0,4
8
0
,11
0,0
8
0,0
9
0,0
9
0,10
0
,12
0,14
0
,15
0,16
0
,18
0
,05
0
,05
0
,06
0
,06
0
,05
0
,07
0
,07
0
,08
0
,09
0
,10
0
,07
0
,08
0
,07
0
,08
0
,10
0,10
0
,11
0,19
0
,20
0
,18
0,
01
0,0
1
0,0
1
0,0
1
0,0
1
0,0
1
0,0
1
0,0
1
0,0
1
0,0
1
0
,82
0
,69
0
,77
0
,79
0
,91
0
,91
1
,03
1
,39
1
,49
1
,45
0
,49
0
,42
0
,36
0
,34
0
,30
0
,30
0
,31
0
,35
0
,37
0
,32
0
,47
0
,38
0
,43
0
,39
0
,49
0
,46
0
,51
0
,68
0
,71
0
,58
0
,07
0
,08
0
,09
0
,09
0
,08
0
,10
0,0
8
0,10
0
,08
0
,07
0,
21
0,16
0
,17
0,15
0
,18
0,17
0
,16
0,2
2
0,2
3
0,2
2
0
,22
0
,16
0,16
0
,18
0,18
0
,20
0
,20
0
,22
0
,22
0
,21
2
,26
1
,58
1
,77
1
,62
1
,89
1
,71
2
,00
2
,45
2
,59
2
,42
0,
07
0,0
7
0,0
6
0,0
6
0,0
5
0,0
5
0,0
4
0,0
5
0,0
6
0,0
8
0
,06
0
,05
0
,05
0
,04
0
,05
0
,05
0
,05
0
,06
0
,11
0,11
2000
20
01
2002
20
03
2004
20
05
2006
20
07
2008
20
09
Min
a ra
jo /
open
pit
Min
a Su
bter
ráne
a /
Unde
rgro
und
Min
e
Conc
entra
dora
/
bene
ficia
tion
plan
t
Fund
ición
/
Smel
ter
refin
ería
/
elec
trolit
ic re
finin
g
lX-S
X-eW
Serv
icios
/
prod
uctio
n Se
rvice
s
tM C
o 2 eq. /
tMF m
iner
al
ton
Co2 eq
. / to
n of
copp
er co
nten
t in
min
eral
s
tM C
o 2 eq. /
tMF m
iner
al
ton
Co2 eq
. / to
n of
copp
er co
nten
t in
min
eral
s
tM C
o 2 eq. /
tMF c
once
ntra
do
ton
Co2 eq
. / to
n of
copp
er co
nten
t in
conc
entra
tes
tM C
o 2 eq. /
tMF á
nodo
ton
Co2 eq
. / to
n of
copp
er co
nten
t in
anod
es
tM C
o 2 eq. /
tMF c
átod
o er
ton
Co2 eq
. / to
n of
er
cath
odes
tM C
o 2 eq. /
tMF c
átod
o eo
ton
Co2 eq
. / to
n of
eW
cath
odes
tM C
o 2 eq. /
tMF t
otal
pro
ducid
o
ton
Co2 eq
. / to
n of
tota
l cop
per p
rodu
ction
emisi
ones
dire
ctas
dire
ct e
miss
ions
emisi
ones
indi
rect
asin
dire
ct e
miss
ions
emisi
ones
dire
ctas
dire
ct e
miss
ions
emisi
ones
indi
rect
asin
dire
ct e
miss
ions
emisi
ones
dire
ctas
dire
ct e
miss
ions
emisi
ones
indi
rect
asin
dire
ct e
miss
ions
emisi
ones
dire
ctas
dire
ct e
miss
ions
emisi
ones
indi
rect
asin
dire
ct e
miss
ions
emisi
ones
dire
ctas
dire
ct e
miss
ions
emisi
ones
indi
rect
asin
dire
ct e
miss
ions
emisi
ones
dire
ctas
dire
ct e
miss
ions
emisi
ones
indi
rect
asin
dire
ct e
miss
ions
emisi
ones
dire
ctas
dire
ct e
miss
ions
emisi
ones
indi
rect
asin
dire
ct e
miss
ions
Fuen
te /
Sou
rce:
ela
bora
do p
or la
Com
isión
Chi
lena
del
Cob
re e
n ba
se a
info
rmac
ión
de lo
s con
sum
os d
e en
ergí
a de
las e
mpr
esas
. / C
hile
an C
oppe
r Com
miss
ion,
bas
ed o
n co
mpa
ny e
nerg
y us
e re
ports
.
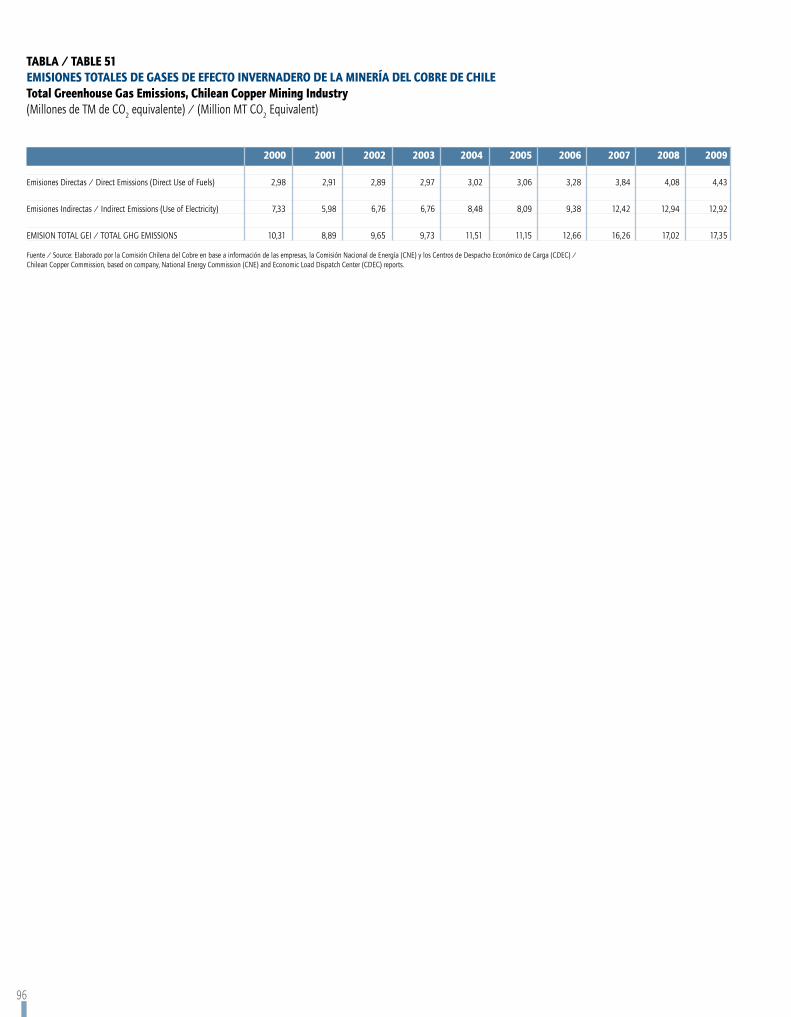
96
TABLA / TABLE 51EMISIONES TOTALES DE GASES DE EFECTO INVERNADERO DE LA MINERÍA DEL COBRE DE CHILE Total Greenhouse Gas Emissions, Chilean Copper Mining Industry(Millones de tM de Co
2 equivalente) / (Million Mt Co
2 equivalent)
2000 2001 2002 2003 2004 2005 2006 2007 2008 2009
emisiones directas / direct emissions (direct Use of Fuels) 2,98 2,91 2,89 2,97 3,02 3,06 3,28 3,84 4,08 4,43
emisiones indirectas / indirect emissions (Use of electricity) 7,33 5,98 6,76 6,76 8,48 8,09 9,38 12,42 12,94 12,92
eMiSion total Gei / total GhG eMiSSionS 10,31 8,89 9,65 9,73 11,51 11,15 12,66 16,26 17,02 17,35
Fuente / Source: elaborado por la Comisión Chilena del Cobre en base a información de las empresas, la Comisión nacional de energía (Cne) y los Centros de despacho económico de Carga (CdeC) / Chilean Copper Commission, based on company, national energy Commission (Cne) and economic load dispatch Center (CdeC) reports.
97
1.7MINERÍA REGIONALreGionAl MininG
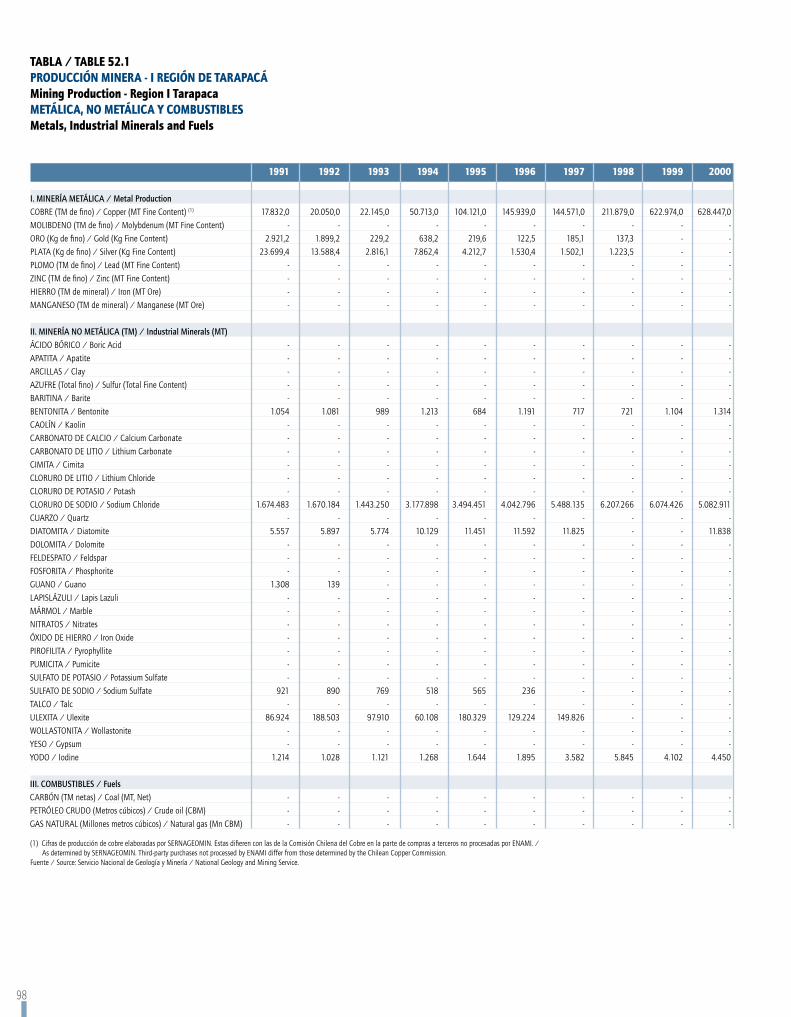
98
TABLA / TABLE 52.1PRODUCCIÓN MINERA - I REGIÓN DE TARAPACÁMining Production - Region I TarapacaMETÁLICA, NO METÁLICA Y COMBUSTIBLESMetals, Industrial Minerals and Fuels
1991 1992 1993 1994 1995 1996 1997 1998 1999 2000
i. MineríA MetÁlicA / Metal Production Cobre (tM de fino) / Copper (Mt Fine Content) (1) 17.832,0 20.050,0 22.145,0 50.713,0 104.121,0 145.939,0 144.571,0 211.879,0 622.974,0 628.447,0
Molibdeno (tM de fino) / Molybdenum (Mt Fine Content) - - - - - - - - - -
oro (kg de fino) / Gold (kg Fine Content) 2.921,2 1.899,2 229,2 638,2 219,6 122,5 185,1 137,3 - -
plata (kg de fino) / Silver (kg Fine Content) 23.699,4 13.588,4 2.816,1 7.862,4 4.212,7 1.530,4 1.502,1 1.223,5 - -
ploMo (tM de fino) / lead (Mt Fine Content) - - - - - - - - - -
ZinC (tM de fino) / Zinc (Mt Fine Content) - - - - - - - - - -
hierro (tM de mineral) / iron (Mt ore) - - - - - - - - - -
ManGaneSo (tM de mineral) / Manganese (Mt ore) - - - - - - - - - -
ii. MineríA no MetÁlicA (tM) / industrial Minerals (Mt) ÁCido bÓriCo / boric acid - - - - - - - - - -
apatita / apatite - - - - - - - - - -
arCillaS / Clay - - - - - - - - - -
aZUFre (total fino) / Sulfur (total Fine Content) - - - - - - - - - -
baritina / barite - - - - - - - - - -
bentonita / bentonite 1.054 1.081 989 1.213 684 1.191 717 721 1.104 1.314
CaolÍn / kaolin - - - - - - - - - -
Carbonato de CalCio / Calcium Carbonate - - - - - - - - - -
Carbonato de litio / lithium Carbonate - - - - - - - - - -
CiMita / Cimita - - - - - - - - - -
ClorUro de litio / lithium Chloride - - - - - - - - - -
ClorUro de potaSio / potash - - - - - - - - - -
ClorUro de Sodio / Sodium Chloride 1.674.483 1.670.184 1.443.250 3.177.898 3.494.451 4.042.796 5.488.135 6.207.266 6.074.426 5.082.911
CUarZo / Quartz - - - - - - - - - -
diatoMita / diatomite 5.557 5.897 5.774 10.129 11.451 11.592 11.825 - - 11.838
doloMita / dolomite - - - - - - - - - -
FeldeSpato / Feldspar - - - - - - - - - -
FoSForita / phosphorite - - - - - - - - - -
GUano / Guano 1.308 139 - - - - - - - -
lapiSlÁZUli / lapis lazuli - - - - - - - - - -
MÁrMol / Marble - - - - - - - - - -
nitratoS / nitrates - - - - - - - - - -
ÓXido de hierro / iron oxide - - - - - - - - - -
piroFilita / pyrophyllite - - - - - - - - - -
pUMiCita / pumicite - - - - - - - - - -
SUlFato de potaSio / potassium Sulfate - - - - - - - - - -
SUlFato de Sodio / Sodium Sulfate 921 890 769 518 565 236 - - - -
talCo / talc - - - - - - - - - -
UleXita / Ulexite 86.924 188.503 97.910 60.108 180.329 129.224 149.826 - - -
WollaStonita / Wollastonite - - - - - - - - - -
YeSo / Gypsum - - - - - - - - - -
Yodo / iodine 1.214 1.028 1.121 1.268 1.644 1.895 3.582 5.845 4.102 4.450
iii. coMbustibles / Fuels CarbÓn (tM netas) / Coal (Mt, net) - - - - - - - - - -
petrÓleo CrUdo (Metros cúbicos) / Crude oil (CbM) - - - - - - - - - -
GaS natUral (Millones metros cúbicos) / natural gas (Mn CbM) - - - - - - - - - - (1) Cifras de producción de cobre elaboradas por SernaGeoMin. estas difieren con las de la Comisión Chilena del Cobre en la parte de compras a terceros no procesadas por enaMi. / as determined by SernaGeoMin. third-party purchases not processed by enaMi differ from those determined by the Chilean Copper Commission. Fuente / Source: Servicio nacional de Geología y Minería / national Geology and Mining Service.
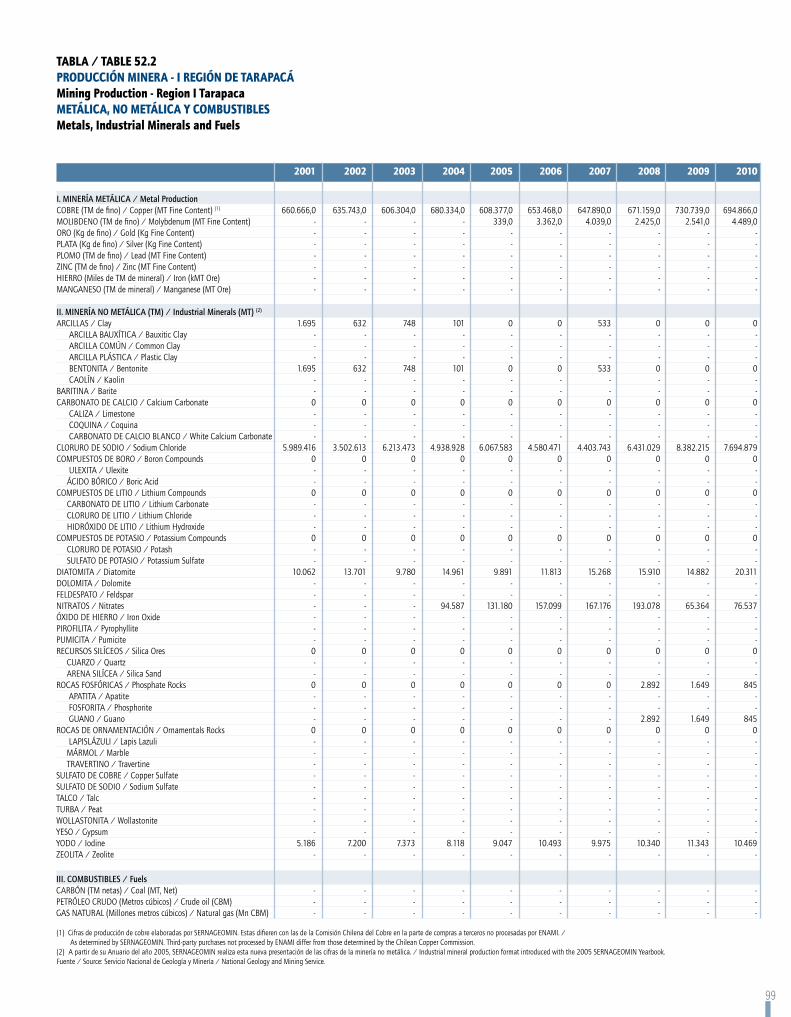
99
TABLA / TABLE 52.2PRODUCCIÓN MINERA - I REGIÓN DE TARAPACÁMining Production - Region I TarapacaMETÁLICA, NO METÁLICA Y COMBUSTIBLES Metals, Industrial Minerals and Fuels
2001 2002 2003 2004 2005 2006 2007 2008 2009 2010
i. MineríA MetÁlicA / Metal Production Cobre (tM de fino) / Copper (Mt Fine Content) (1) 660.666,0 635.743,0 606.304,0 680.334,0 608.377,0 653.468,0 647.890,0 671.159,0 730.739,0 694.866,0Molibdeno (tM de fino) / Molybdenum (Mt Fine Content) - - - - 339,0 3.362,0 4.039,0 2.425,0 2.541,0 4.489,0oro (kg de fino) / Gold (kg Fine Content) - - - - - - - - - -plata (kg de fino) / Silver (kg Fine Content) - - - - - - - - - -ploMo (tM de fino) / lead (Mt Fine Content) - - - - - - - - - -ZinC (tM de fino) / Zinc (Mt Fine Content) - - - - - - - - - -hierro (Miles de tM de mineral) / iron (kMt ore) - - - - - - - - - -ManGaneSo (tM de mineral) / Manganese (Mt ore) - - - - - - - - - - ii. MineríA no MetÁlicA (tM) / industrial Minerals (Mt) (2) arCillaS / Clay 1.695 632 748 101 0 0 533 0 0 0 arCilla baUXÍtiCa / bauxitic Clay - - - - - - - - - - arCilla CoMÚn / Common Clay - - - - - - - - - - arCilla plÁStiCa / plastic Clay - - - - - - - - - - bentonita / bentonite 1.695 632 748 101 0 0 533 0 0 0 CaolÍn / kaolin - - - - - - - - - -baritina / barite - - - - - - - - - -Carbonato de CalCio / Calcium Carbonate 0 0 0 0 0 0 0 0 0 0 CaliZa / limestone - - - - - - - - - - CoQUina / Coquina - - - - - - - - - - Carbonato de CalCio blanCo / White Calcium Carbonate - - - - - - - - - -ClorUro de Sodio / Sodium Chloride 5.989.416 3.502.613 6.213.473 4.938.928 6.067.583 4.580.471 4.403.743 6.431.029 8.382.215 7.694.879CoMpUeStoS de boro / boron Compounds 0 0 0 0 0 0 0 0 0 0 UleXita / Ulexite - - - - - - - - - - ÁCido bÓriCo / boric acid - - - - - - - - - -CoMpUeStoS de litio / lithium Compounds 0 0 0 0 0 0 0 0 0 0 Carbonato de litio / lithium Carbonate - - - - - - - - - - ClorUro de litio / lithium Chloride - - - - - - - - - - hidrÓXido de litio / lithium hydroxide - - - - - - - - - -CoMpUeStoS de potaSio / potassium Compounds 0 0 0 0 0 0 0 0 0 0 ClorUro de potaSio / potash - - - - - - - - - - SUlFato de potaSio / potassium Sulfate - - - - - - - - - -diatoMita / diatomite 10.062 13.701 9.780 14.961 9.891 11.813 15.268 15.910 14.882 20.311doloMita / dolomite - - - - - - - - - -FeldeSpato / Feldspar - - - - - - - - - -nitratoS / nitrates - - - 94.587 131.180 157.099 167.176 193.078 65.364 76.537ÓXido de hierro / iron oxide - - - - - - - - - -piroFilita / pyrophyllite - - - - - - - - - -pUMiCita / pumicite - - - - - - - - - -reCUrSoS SilÍCeoS / Silica ores 0 0 0 0 0 0 0 0 0 0 CUarZo / Quartz - - - - - - - - - - arena SilÍCea / Silica Sand - - - - - - - - - -roCaS FoSFÓriCaS / phosphate rocks 0 0 0 0 0 0 0 2.892 1.649 845 apatita / apatite - - - - - - - - - - FoSForita / phosphorite - - - - - - - - - - GUano / Guano - - - - - - - 2.892 1.649 845roCaS de ornaMentaCiÓn / ornamentals rocks 0 0 0 0 0 0 0 0 0 0 lapiSlÁZUli / lapis lazuli - - - - - - - - - - MÁrMol / Marble - - - - - - - - - - traVertino / travertine - - - - - - - - - -SUlFato de Cobre / Copper Sulfate - - - - - - - - - -SUlFato de Sodio / Sodium Sulfate - - - - - - - - - -talCo / talc - - - - - - - - - -tUrba / peat - - - - - - - - - -WollaStonita / Wollastonite - - - - - - - - - -YeSo / Gypsum - - - - - - - - - -Yodo / iodine 5.186 7.200 7.373 8.118 9.047 10.493 9.975 10.340 11.343 10.469Zeolita / Zeolite - - - - - - - - - -
iii. coMbustibles / Fuels CarbÓn (tM netas) / Coal (Mt, net) - - - - - - - - - -petrÓleo CrUdo (Metros cúbicos) / Crude oil (CbM) - - - - - - - - - -GaS natUral (Millones metros cúbicos) / natural gas (Mn CbM) - - - - - - - - - -
(1) Cifras de producción de cobre elaboradas por SernaGeoMin. estas difieren con las de la Comisión Chilena del Cobre en la parte de compras a terceros no procesadas por enaMi. / as determined by SernaGeoMin. third-party purchases not processed by enaMi differ from those determined by the Chilean Copper Commission. (2) a partir de su anuario del año 2005, SernaGeoMin realiza esta nueva presentación de las cifras de la minería no metálica. / industrial mineral production format introduced with the 2005 SernaGeoMin Yearbook. Fuente / Source: Servicio nacional de Geología y Minería / national Geology and Mining Service.
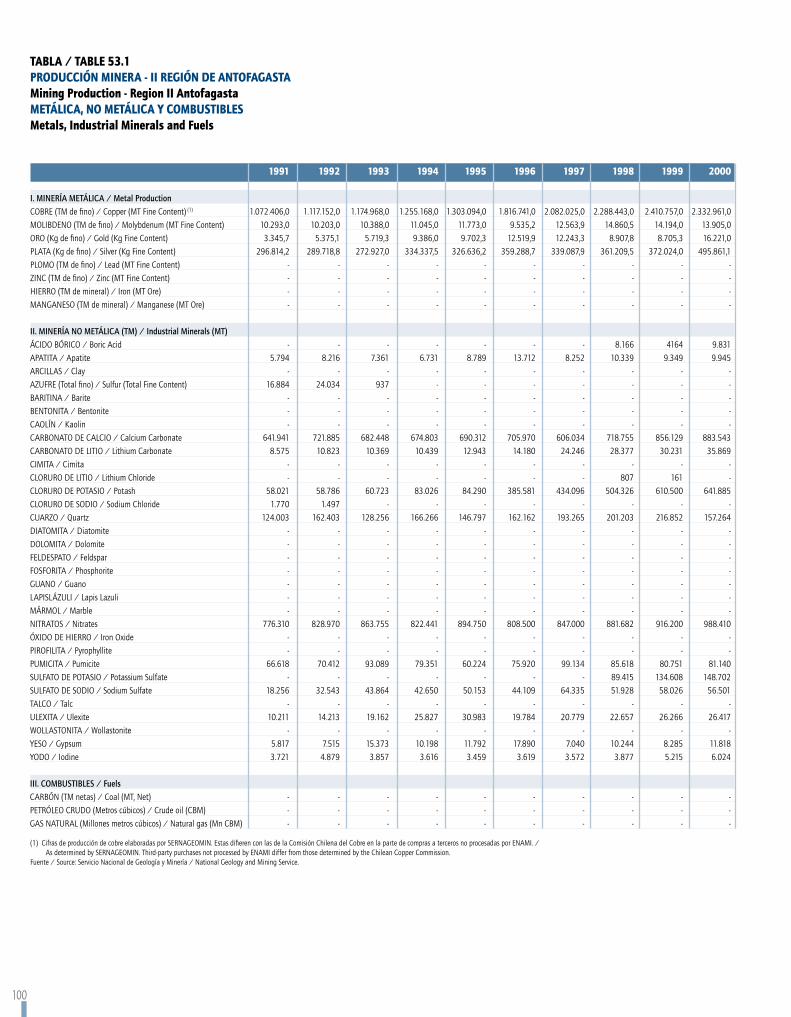
100
TABLA / TABLE 53.1PRODUCCIÓN MINERA - II REGIÓN DE ANTOFAGASTAMining Production - Region II AntofagastaMETÁLICA, NO METÁLICA Y COMBUSTIBLESMetals, Industrial Minerals and Fuels
1991 1992 1993 1994 1995 1996 1997 1998 1999 2000
i. MineríA MetÁlicA / Metal Production Cobre (tM de fino) / Copper (Mt Fine Content) (1) 1.072.406,0 1.117.152,0 1.174.968,0 1.255.168,0 1.303.094,0 1.816.741,0 2.082.025,0 2.288.443,0 2.410.757,0 2.332.961,0
Molibdeno (tM de fino) / Molybdenum (Mt Fine Content) 10.293,0 10.203,0 10.388,0 11.045,0 11.773,0 9.535,2 12.563,9 14.860,5 14.194,0 13.905,0
oro (kg de fino) / Gold (kg Fine Content) 3.345,7 5.375,1 5.719,3 9.386,0 9.702,3 12.519,9 12.243,3 8.907,8 8.705,3 16.221,0
plata (kg de fino) / Silver (kg Fine Content) 296.814,2 289.718,8 272.927,0 334.337,5 326.636,2 359.288,7 339.087,9 361.209,5 372.024,0 495.861,1
ploMo (tM de fino) / lead (Mt Fine Content) - - - - - - - - - -
ZinC (tM de fino) / Zinc (Mt Fine Content) - - - - - - - - - -
hierro (tM de mineral) / iron (Mt ore) - - - - - - - - - -
ManGaneSo (tM de mineral) / Manganese (Mt ore) - - - - - - - - - -
ii. MineríA no MetÁlicA (tM) / industrial Minerals (Mt) ÁCido bÓriCo / boric acid - - - - - - - 8.166 4164 9.831
apatita / apatite 5.794 8.216 7.361 6.731 8.789 13.712 8.252 10.339 9.349 9.945
arCillaS / Clay - - - - - - - - - -
aZUFre (total fino) / Sulfur (total Fine Content) 16.884 24.034 937 - - - - - - -
baritina / barite - - - - - - - - - -
bentonita / bentonite - - - - - - - - - -
CaolÍn / kaolin - - - - - - - - - -
Carbonato de CalCio / Calcium Carbonate 641.941 721.885 682.448 674.803 690.312 705.970 606.034 718.755 856.129 883.543
Carbonato de litio / lithium Carbonate 8.575 10.823 10.369 10.439 12.943 14.180 24.246 28.377 30.231 35.869
CiMita / Cimita - - - - - - - - - -
ClorUro de litio / lithium Chloride - - - - - - - 807 161 -
ClorUro de potaSio / potash 58.021 58.786 60.723 83.026 84.290 385.581 434.096 504.326 610.500 641.885
ClorUro de Sodio / Sodium Chloride 1.770 1.497 - - - - - - - -
CUarZo / Quartz 124.003 162.403 128.256 166.266 146.797 162.162 193.265 201.203 216.852 157.264
diatoMita / diatomite - - - - - - - - - -
doloMita / dolomite - - - - - - - - - -
FeldeSpato / Feldspar - - - - - - - - - -
FoSForita / phosphorite - - - - - - - - - -
GUano / Guano - - - - - - - - - -
lapiSlÁZUli / lapis lazuli - - - - - - - - - -
MÁrMol / Marble - - - - - - - - - -
nitratoS / nitrates 776.310 828.970 863.755 822.441 894.750 808.500 847.000 881.682 916.200 988.410
ÓXido de hierro / iron oxide - - - - - - - - - -
piroFilita / pyrophyllite - - - - - - - - - -
pUMiCita / pumicite 66.618 70.412 93.089 79.351 60.224 75.920 99.134 85.618 80.751 81.140
SUlFato de potaSio / potassium Sulfate - - - - - - - 89.415 134.608 148.702
SUlFato de Sodio / Sodium Sulfate 18.256 32.543 43.864 42.650 50.153 44.109 64.335 51.928 58.026 56.501
talCo / talc - - - - - - - - - -
UleXita / Ulexite 10.211 14.213 19.162 25.827 30.983 19.784 20.779 22.657 26.266 26.417
WollaStonita / Wollastonite - - - - - - - - - -
YeSo / Gypsum 5.817 7.515 15.373 10.198 11.792 17.890 7.040 10.244 8.285 11.818
Yodo / iodine 3.721 4.879 3.857 3.616 3.459 3.619 3.572 3.877 5.215 6.024
iii. coMbustibles / Fuels CarbÓn (tM netas) / Coal (Mt, net) - - - - - - - - - -
petrÓleo CrUdo (Metros cúbicos) / Crude oil (CbM) - - - - - - - - - -
GaS natUral (Millones metros cúbicos) / natural gas (Mn CbM) - - - - - - - - - - (1) Cifras de producción de cobre elaboradas por SernaGeoMin. estas difieren con las de la Comisión Chilena del Cobre en la parte de compras a terceros no procesadas por enaMi. / as determined by SernaGeoMin. third-party purchases not processed by enaMi differ from those determined by the Chilean Copper Commission. Fuente / Source: Servicio nacional de Geología y Minería / national Geology and Mining Service.
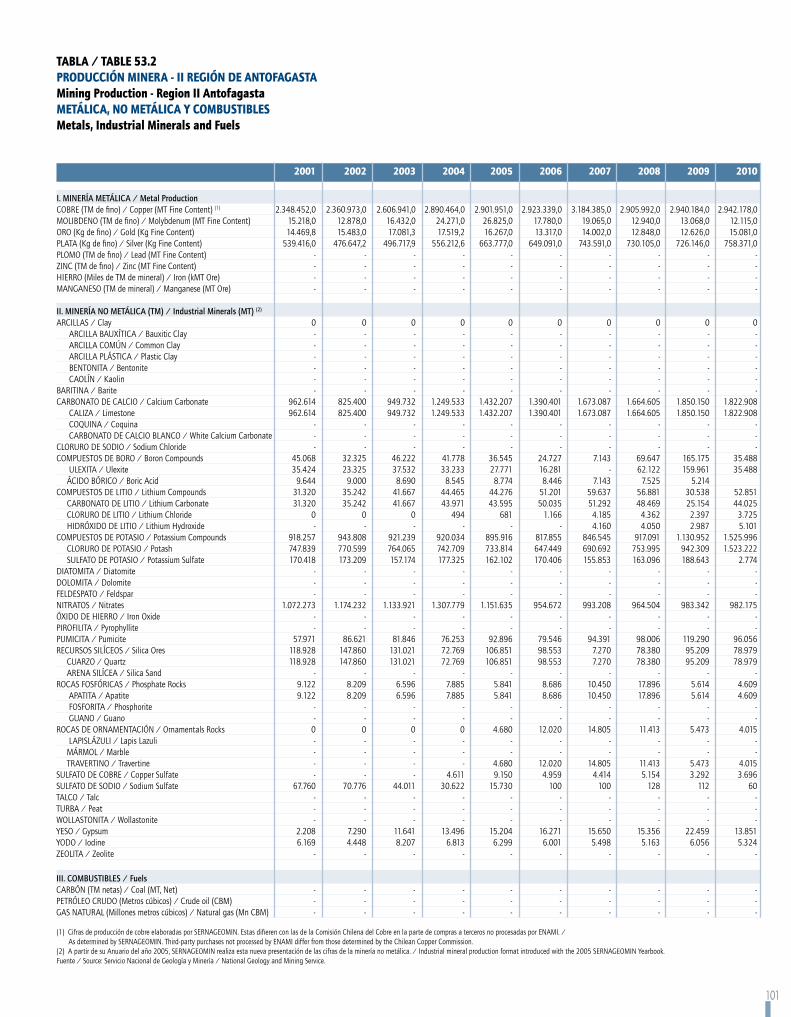
101
TABLA / TABLE 53.2PRODUCCIÓN MINERA - II REGIÓN DE ANTOFAGASTAMining Production - Region II AntofagastaMETÁLICA, NO METÁLICA Y COMBUSTIBLES Metals, Industrial Minerals and Fuels
2001 2002 2003 2004 2005 2006 2007 2008 2009 2010 i. MineríA MetÁlicA / Metal Production Cobre (tM de fino) / Copper (Mt Fine Content) (1) 2.348.452,0 2.360.973,0 2.606.941,0 2.890.464,0 2.901.951,0 2.923.339,0 3.184.385,0 2.905.992,0 2.940.184,0 2.942.178,0Molibdeno (tM de fino) / Molybdenum (Mt Fine Content) 15.218,0 12.878,0 16.432,0 24.271,0 26.825,0 17.780,0 19.065,0 12.940,0 13.068,0 12.115,0oro (kg de fino) / Gold (kg Fine Content) 14.469,8 15.483,0 17.081,3 17.519,2 16.267,0 13.317,0 14.002,0 12.848,0 12.626,0 15.081,0plata (kg de fino) / Silver (kg Fine Content) 539.416,0 476.647,2 496.717,9 556.212,6 663.777,0 649.091,0 743.591,0 730.105,0 726.146,0 758.371,0ploMo (tM de fino) / lead (Mt Fine Content) - - - - - - - - - -ZinC (tM de fino) / Zinc (Mt Fine Content) - - - - - - - - - -hierro (Miles de tM de mineral) / iron (kMt ore) - - - - - - - - - -ManGaneSo (tM de mineral) / Manganese (Mt ore) - - - - - - - - - - ii. MineríA no MetÁlicA (tM) / industrial Minerals (Mt) (2) arCillaS / Clay 0 0 0 0 0 0 0 0 0 0 arCilla baUXÍtiCa / bauxitic Clay - - - - - - - - - - arCilla CoMÚn / Common Clay - - - - - - - - - - arCilla plÁStiCa / plastic Clay - - - - - - - - - - bentonita / bentonite - - - - - - - - - - CaolÍn / kaolin - - - - - - - - - -baritina / barite - - - - - - - - - -Carbonato de CalCio / Calcium Carbonate 962.614 825.400 949.732 1.249.533 1.432.207 1.390.401 1.673.087 1.664.605 1.850.150 1.822.908 CaliZa / limestone 962.614 825.400 949.732 1.249.533 1.432.207 1.390.401 1.673.087 1.664.605 1.850.150 1.822.908 CoQUina / Coquina - - - - - - - - - - Carbonato de CalCio blanCo / White Calcium Carbonate - - - - - - - - - -ClorUro de Sodio / Sodium Chloride - - - - - - - - - -CoMpUeStoS de boro / boron Compounds 45.068 32.325 46.222 41.778 36.545 24.727 7.143 69.647 165.175 35.488 UleXita / Ulexite 35.424 23.325 37.532 33.233 27.771 16.281 - 62.122 159.961 35.488 ÁCido bÓriCo / boric acid 9.644 9.000 8.690 8.545 8.774 8.446 7.143 7.525 5.214 CoMpUeStoS de litio / lithium Compounds 31.320 35.242 41.667 44.465 44.276 51.201 59.637 56.881 30.538 52.851 Carbonato de litio / lithium Carbonate 31.320 35.242 41.667 43.971 43.595 50.035 51.292 48.469 25.154 44.025 ClorUro de litio / lithium Chloride 0 0 0 494 681 1.166 4.185 4.362 2.397 3.725 hidrÓXido de litio / lithium hydroxide - - - - - - 4.160 4.050 2.987 5.101CoMpUeStoS de potaSio / potassium Compounds 918.257 943.808 921.239 920.034 895.916 817.855 846.545 917.091 1.130.952 1.525.996 ClorUro de potaSio / potash 747.839 770.599 764.065 742.709 733.814 647.449 690.692 753.995 942.309 1.523.222 SUlFato de potaSio / potassium Sulfate 170.418 173.209 157.174 177.325 162.102 170.406 155.853 163.096 188.643 2.774diatoMita / diatomite - - - - - - - - - -doloMita / dolomite - - - - - - - - - -FeldeSpato / Feldspar - - - - - - - - - -nitratoS / nitrates 1.072.273 1.174.232 1.133.921 1.307.779 1.151.635 954.672 993.208 964.504 983.342 982.175ÓXido de hierro / iron oxide - - - - - - - - - -piroFilita / pyrophyllite - - - - - - - - - -pUMiCita / pumicite 57.971 86.621 81.846 76.253 92.896 79.546 94.391 98.006 119.290 96.056reCUrSoS SilÍCeoS / Silica ores 118.928 147.860 131.021 72.769 106.851 98.553 7.270 78.380 95.209 78.979 CUarZo / Quartz 118.928 147.860 131.021 72.769 106.851 98.553 7.270 78.380 95.209 78.979 arena SilÍCea / Silica Sand - - - - - - - - - -roCaS FoSFÓriCaS / phosphate rocks 9.122 8.209 6.596 7.885 5.841 8.686 10.450 17.896 5.614 4.609 apatita / apatite 9.122 8.209 6.596 7.885 5.841 8.686 10.450 17.896 5.614 4.609 FoSForita / phosphorite - - - - - - - - - - GUano / Guano - - - - - - - - - -roCaS de ornaMentaCiÓn / ornamentals rocks 0 0 0 0 4.680 12.020 14.805 11.413 5.473 4.015 lapiSlÁZUli / lapis lazuli - - - - - - - - - - MÁrMol / Marble - - - - - - - - - - traVertino / travertine - - - - 4.680 12.020 14.805 11.413 5.473 4.015SUlFato de Cobre / Copper Sulfate - - - 4.611 9.150 4.959 4.414 5.154 3.292 3.696SUlFato de Sodio / Sodium Sulfate 67.760 70.776 44.011 30.622 15.730 100 100 128 112 60talCo / talc - - - - - - - - - -tUrba / peat - - - - - - - - - -WollaStonita / Wollastonite - - - - - - - - - -YeSo / Gypsum 2.208 7.290 11.641 13.496 15.204 16.271 15.650 15.356 22.459 13.851Yodo / iodine 6.169 4.448 8.207 6.813 6.299 6.001 5.498 5.163 6.056 5.324Zeolita / Zeolite - - - - - - - - - -
iii. coMbustibles / Fuels CarbÓn (tM netas) / Coal (Mt, net) - - - - - - - - - -petrÓleo CrUdo (Metros cúbicos) / Crude oil (CbM) - - - - - - - - - -GaS natUral (Millones metros cúbicos) / natural gas (Mn CbM) - - - - - - - - - - (1) Cifras de producción de cobre elaboradas por SernaGeoMin. estas difieren con las de la Comisión Chilena del Cobre en la parte de compras a terceros no procesadas por enaMi. / as determined by SernaGeoMin. third-party purchases not processed by enaMi differ from those determined by the Chilean Copper Commission. (2) a partir de su anuario del año 2005, SernaGeoMin realiza esta nueva presentación de las cifras de la minería no metálica. / industrial mineral production format introduced with the 2005 SernaGeoMin Yearbook. Fuente / Source: Servicio nacional de Geología y Minería / national Geology and Mining Service.
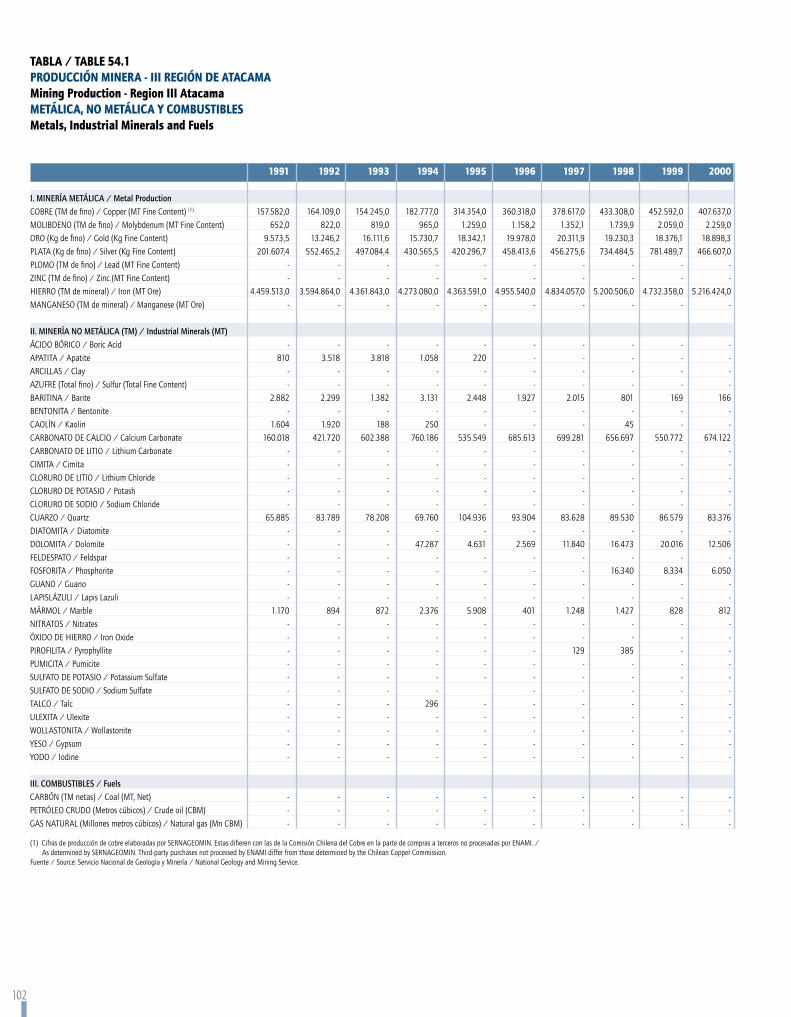
102
TABLA / TABLE 54.1PRODUCCIÓN MINERA - III REGIÓN DE ATACAMAMining Production - Region III AtacamaMETÁLICA, NO METÁLICA Y COMBUSTIBLES Metals, Industrial Minerals and Fuels
1991 1992 1993 1994 1995 1996 1997 1998 1999 2000
i. MineríA MetÁlicA / Metal Production Cobre (tM de fino) / Copper (Mt Fine Content) (1) 157.582,0 164.109,0 154.245,0 182.777,0 314.354,0 360.318,0 378.617,0 433.308,0 452.592,0 407.637,0
Molibdeno (tM de fino) / Molybdenum (Mt Fine Content) 652,0 822,0 819,0 965,0 1.259,0 1.158,2 1.352,1 1.739,9 2.059,0 2.259,0
oro (kg de fino) / Gold (kg Fine Content) 9.573,5 13.246,2 16.111,6 15.730,7 18.342,1 19.978,0 20.311,9 19.230,3 18.376,1 18.898,3
plata (kg de fino) / Silver (kg Fine Content) 201.607,4 552.465,2 497.084,4 430.565,5 420.296,7 458.413,6 456.275,6 734.484,5 781.489,7 466.607,0
ploMo (tM de fino) / lead (Mt Fine Content) - - - - - - - - - -
ZinC (tM de fino) / Zinc (Mt Fine Content) - - - - - - - - - -
hierro (tM de mineral) / iron (Mt ore) 4.459.513,0 3.594.864,0 4.361.843,0 4.273.080,0 4.363.591,0 4.955.540,0 4.834.057,0 5.200.506,0 4.732.358,0 5.216.424,0
ManGaneSo (tM de mineral) / Manganese (Mt ore) - - - - - - - - - -
ii. MineríA no MetÁlicA (tM) / industrial Minerals (Mt) ÁCido bÓriCo / boric acid - - - - - - - - - -
apatita / apatite 810 3.518 3.818 1.058 220 - - - - -
arCillaS / Clay - - - - - - - - - -
aZUFre (total fino) / Sulfur (total Fine Content) - - - - - - - - - -
baritina / barite 2.882 2.299 1.382 3.131 2.448 1.927 2.015 801 169 166
bentonita / bentonite - - - - - - - - - -
CaolÍn / kaolin 1.604 1.920 188 250 - - - 45 - -
Carbonato de CalCio / Calcium Carbonate 160.018 421.720 602.388 760.186 535.549 685.613 699.281 656.697 550.772 674.122
Carbonato de litio / lithium Carbonate - - - - - - - - - -
CiMita / Cimita - - - - - - - - - -
ClorUro de litio / lithium Chloride - - - - - - - - - -
ClorUro de potaSio / potash - - - - - - - - - -
ClorUro de Sodio / Sodium Chloride - - - - - - - - - -
CUarZo / Quartz 65.885 83.789 78.208 69.760 104.936 93.904 83.628 89.530 86.579 83.376
diatoMita / diatomite - - - - - - - - - -
doloMita / dolomite - - - 47.287 4.631 2.569 11.840 16.473 20.016 12.506
FeldeSpato / Feldspar - - - - - - - - - -
FoSForita / phosphorite - - - - - - - 16.340 8.334 6.050
GUano / Guano - - - - - - - - - -
lapiSlÁZUli / lapis lazuli - - - - - - - - - -
MÁrMol / Marble 1.170 894 872 2.376 5.908 401 1.248 1.427 828 812
nitratoS / nitrates - - - - - - - - - -
ÓXido de hierro / iron oxide - - - - - - - - - -
piroFilita / pyrophyllite - - - - - - 129 385 - -
pUMiCita / pumicite - - - - - - - - - -
SUlFato de potaSio / potassium Sulfate - - - - - - - - - -
SUlFato de Sodio / Sodium Sulfate - - - - - - - - -
talCo / talc - - - 296 - - - - - -
UleXita / Ulexite - - - - - - - - - -
WollaStonita / Wollastonite - - - - - - - - - -
YeSo / Gypsum - - - - - - - - - -
Yodo / iodine - - - - - - - - - -
iii. coMbustibles / Fuels CarbÓn (tM netas) / Coal (Mt, net) - - - - - - - - - -
petrÓleo CrUdo (Metros cúbicos) / Crude oil (CbM) - - - - - - - - - -
GaS natUral (Millones metros cúbicos) / natural gas (Mn CbM) - - - - - - - - - -
(1) Cifras de producción de cobre elaboradas por SernaGeoMin. estas difieren con las de la Comisión Chilena del Cobre en la parte de compras a terceros no procesadas por enaMi. / as determined by SernaGeoMin. third-party purchases not processed by enaMi differ from those determined by the Chilean Copper Commission. Fuente / Source: Servicio nacional de Geología y Minería / national Geology and Mining Service.
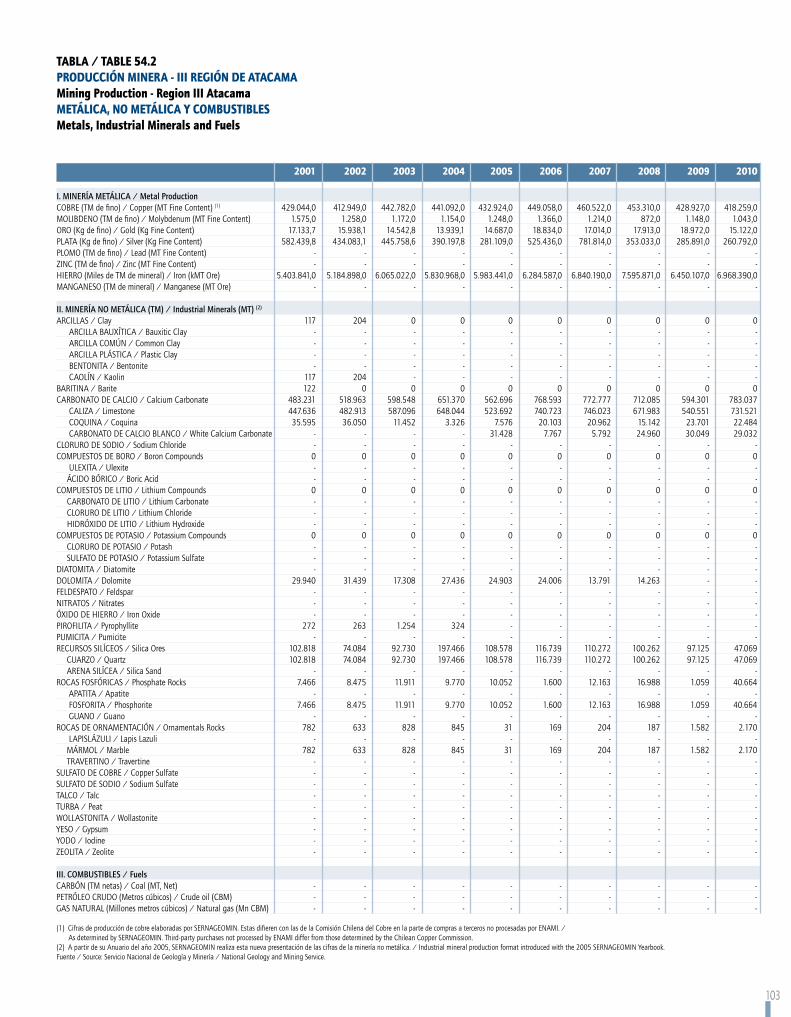
103
TABLA / TABLE 54.2 PRODUCCIÓN MINERA - III REGIÓN DE ATACAMAMining Production - Region III AtacamaMETÁLICA, NO METÁLICA Y COMBUSTIBLES Metals, Industrial Minerals and Fuels
2001 2002 2003 2004 2005 2006 2007 2008 2009 2010 i. MineríA MetÁlicA / Metal Production Cobre (tM de fino) / Copper (Mt Fine Content) (1) 429.044,0 412.949,0 442.782,0 441.092,0 432.924,0 449.058,0 460.522,0 453.310,0 428.927,0 418.259,0Molibdeno (tM de fino) / Molybdenum (Mt Fine Content) 1.575,0 1.258,0 1.172,0 1.154,0 1.248,0 1.366,0 1.214,0 872,0 1.148,0 1.043,0oro (kg de fino) / Gold (kg Fine Content) 17.133,7 15.938,1 14.542,8 13.939,1 14.687,0 18.834,0 17.014,0 17.913,0 18.972,0 15.122,0plata (kg de fino) / Silver (kg Fine Content) 582.439,8 434.083,1 445.758,6 390.197,8 281.109,0 525.436,0 781.814,0 353.033,0 285.891,0 260.792,0ploMo (tM de fino) / lead (Mt Fine Content) - - - - - - - - - -ZinC (tM de fino) / Zinc (Mt Fine Content) - - - - - - - - - -hierro (Miles de tM de mineral) / iron (kMt ore) 5.403.841,0 5.184.898,0 6.065.022,0 5.830.968,0 5.983.441,0 6.284.587,0 6.840.190,0 7.595.871,0 6.450.107,0 6.968.390,0ManGaneSo (tM de mineral) / Manganese (Mt ore) - - - - - - - - - - ii. MineríA no MetÁlicA (tM) / industrial Minerals (Mt) (2) arCillaS / Clay 117 204 0 0 0 0 0 0 0 0 arCilla baUXÍtiCa / bauxitic Clay - - - - - - - - - - arCilla CoMÚn / Common Clay - - - - - - - - - - arCilla plÁStiCa / plastic Clay - - - - - - - - - - bentonita / bentonite - - - - - - - - - - CaolÍn / kaolin 117 204 - - - - - - - -baritina / barite 122 0 0 0 0 0 0 0 0 0Carbonato de CalCio / Calcium Carbonate 483.231 518.963 598.548 651.370 562.696 768.593 772.777 712.085 594.301 783.037 CaliZa / limestone 447.636 482.913 587.096 648.044 523.692 740.723 746.023 671.983 540.551 731.521 CoQUina / Coquina 35.595 36.050 11.452 3.326 7.576 20.103 20.962 15.142 23.701 22.484 Carbonato de CalCio blanCo / White Calcium Carbonate - - - - 31.428 7.767 5.792 24.960 30.049 29.032ClorUro de Sodio / Sodium Chloride - - - - - - - - - -CoMpUeStoS de boro / boron Compounds 0 0 0 0 0 0 0 0 0 0 UleXita / Ulexite - - - - - - - - - - ÁCido bÓriCo / boric acid - - - - - - - - - -CoMpUeStoS de litio / lithium Compounds 0 0 0 0 0 0 0 0 0 0 Carbonato de litio / lithium Carbonate - - - - - - - - - - ClorUro de litio / lithium Chloride - - - - - - - - - - hidrÓXido de litio / lithium hydroxide - - - - - - - - - -CoMpUeStoS de potaSio / potassium Compounds 0 0 0 0 0 0 0 0 0 0 ClorUro de potaSio / potash - - - - - - - - - - SUlFato de potaSio / potassium Sulfate - - - - - - - - - -diatoMita / diatomite - - - - - - - - - -doloMita / dolomite 29.940 31.439 17.308 27.436 24.903 24.006 13.791 14.263 - -FeldeSpato / Feldspar - - - - - - - - - -nitratoS / nitrates - - - - - - - - - -ÓXido de hierro / iron oxide - - - - - - - - - -piroFilita / pyrophyllite 272 263 1.254 324 - - - - - -pUMiCita / pumicite - - - - - - - - - -reCUrSoS SilÍCeoS / Silica ores 102.818 74.084 92.730 197.466 108.578 116.739 110.272 100.262 97.125 47.069 CUarZo / Quartz 102.818 74.084 92.730 197.466 108.578 116.739 110.272 100.262 97.125 47.069 arena SilÍCea / Silica Sand - - - - - - - - - -roCaS FoSFÓriCaS / phosphate rocks 7.466 8.475 11.911 9.770 10.052 1.600 12.163 16.988 1.059 40.664 apatita / apatite - - - - - - - - - - FoSForita / phosphorite 7.466 8.475 11.911 9.770 10.052 1.600 12.163 16.988 1.059 40.664 GUano / Guano - - - - - - - - - -roCaS de ornaMentaCiÓn / ornamentals rocks 782 633 828 845 31 169 204 187 1.582 2.170 lapiSlÁZUli / lapis lazuli - - - - - - - - - - MÁrMol / Marble 782 633 828 845 31 169 204 187 1.582 2.170 traVertino / travertine - - - - - - - - - -SUlFato de Cobre / Copper Sulfate - - - - - - - - - -SUlFato de Sodio / Sodium Sulfate - - - - - - - - - -talCo / talc - - - - - - - - - -tUrba / peat - - - - - - - - - -WollaStonita / Wollastonite - - - - - - - - - -YeSo / Gypsum - - - - - - - - - -Yodo / iodine - - - - - - - - - -Zeolita / Zeolite - - - - - - - - - - iii. coMbustibles / Fuels CarbÓn (tM netas) / Coal (Mt, net) - - - - - - - - - -petrÓleo CrUdo (Metros cúbicos) / Crude oil (CbM) - - - - - - - - - -GaS natUral (Millones metros cúbicos) / natural gas (Mn CbM) - - - - - - - - - - (1) Cifras de producción de cobre elaboradas por SernaGeoMin. estas difieren con las de la Comisión Chilena del Cobre en la parte de compras a terceros no procesadas por enaMi. / as determined by SernaGeoMin. third-party purchases not processed by enaMi differ from those determined by the Chilean Copper Commission.(2) a partir de su anuario del año 2005, SernaGeoMin realiza esta nueva presentación de las cifras de la minería no metálica. / industrial mineral production format introduced with the 2005 SernaGeoMin Yearbook. Fuente / Source: Servicio nacional de Geología y Minería / national Geology and Mining Service.
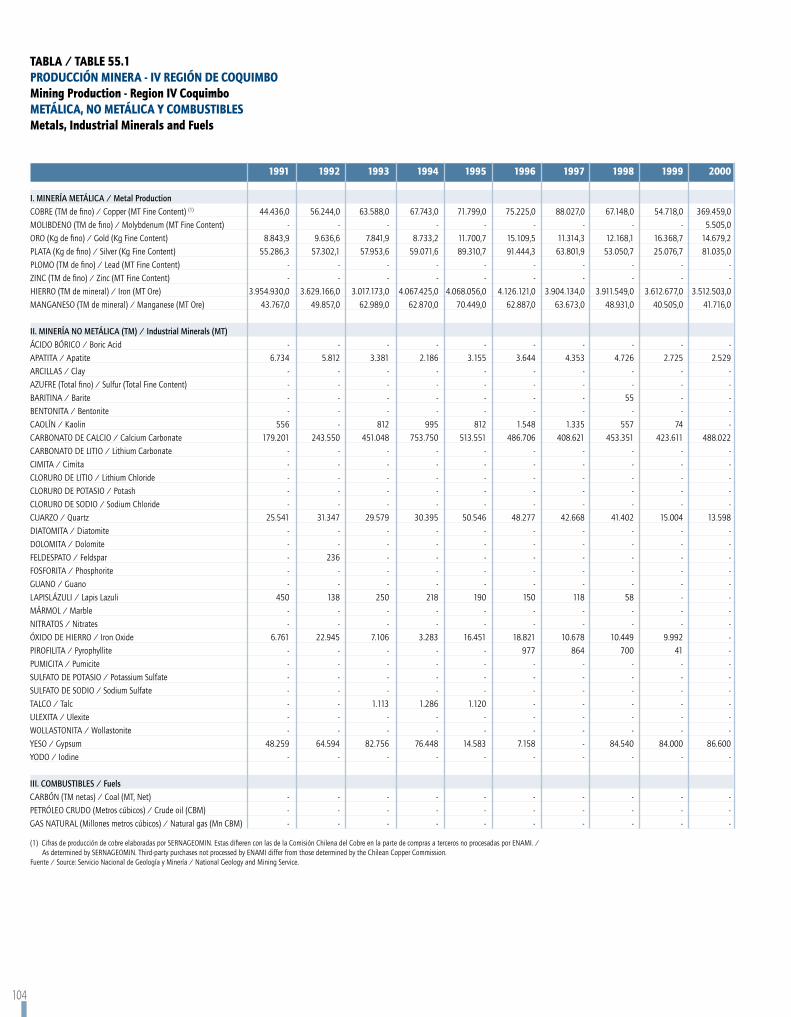
104
TABLA / TABLE 55.1PRODUCCIÓN MINERA - IV REGIÓN DE COQUIMBOMining Production - Region IV CoquimboMETÁLICA, NO METÁLICA Y COMBUSTIBLES Metals, Industrial Minerals and Fuels
1991 1992 1993 1994 1995 1996 1997 1998 1999 2000
i. MineríA MetÁlicA / Metal Production Cobre (tM de fino) / Copper (Mt Fine Content) (1) 44.436,0 56.244,0 63.588,0 67.743,0 71.799,0 75.225,0 88.027,0 67.148,0 54.718,0 369.459,0
Molibdeno (tM de fino) / Molybdenum (Mt Fine Content) - - - - - - - - - 5.505,0
oro (kg de fino) / Gold (kg Fine Content) 8.843,9 9.636,6 7.841,9 8.733,2 11.700,7 15.109,5 11.314,3 12.168,1 16.368,7 14.679,2
plata (kg de fino) / Silver (kg Fine Content) 55.286,3 57.302,1 57.953,6 59.071,6 89.310,7 91.444,3 63.801,9 53.050,7 25.076,7 81.035,0
ploMo (tM de fino) / lead (Mt Fine Content) - - - - - - - - - -
ZinC (tM de fino) / Zinc (Mt Fine Content) - - - - - - - - - -
hierro (tM de mineral) / iron (Mt ore) 3.954.930,0 3.629.166,0 3.017.173,0 4.067.425,0 4.068.056,0 4.126.121,0 3.904.134,0 3.911.549,0 3.612.677,0 3.512.503,0
ManGaneSo (tM de mineral) / Manganese (Mt ore) 43.767,0 49.857,0 62.989,0 62.870,0 70.449,0 62.887,0 63.673,0 48.931,0 40.505,0 41.716,0
ii. MineríA no MetÁlicA (tM) / industrial Minerals (Mt) ÁCido bÓriCo / boric acid - - - - - - - - - -
apatita / apatite 6.734 5.812 3.381 2.186 3.155 3.644 4.353 4.726 2.725 2.529
arCillaS / Clay - - - - - - - - - -
aZUFre (total fino) / Sulfur (total Fine Content) - - - - - - - - - -
baritina / barite - - - - - - - 55 - -
bentonita / bentonite - - - - - - - - - -
CaolÍn / kaolin 556 - 812 995 812 1.548 1.335 557 74 -
Carbonato de CalCio / Calcium Carbonate 179.201 243.550 451.048 753.750 513.551 486.706 408.621 453.351 423.611 488.022
Carbonato de litio / lithium Carbonate - - - - - - - - - -
CiMita / Cimita - - - - - - - - - -
ClorUro de litio / lithium Chloride - - - - - - - - - -
ClorUro de potaSio / potash - - - - - - - - - -
ClorUro de Sodio / Sodium Chloride - - - - - - - - - -
CUarZo / Quartz 25.541 31.347 29.579 30.395 50.546 48.277 42.668 41.402 15.004 13.598
diatoMita / diatomite - - - - - - - - - -
doloMita / dolomite - - - - - - - - - -
FeldeSpato / Feldspar - 236 - - - - - - - -
FoSForita / phosphorite - - - - - - - - - -
GUano / Guano - - - - - - - - - -
lapiSlÁZUli / lapis lazuli 450 138 250 218 190 150 118 58 - -
MÁrMol / Marble - - - - - - - - - -
nitratoS / nitrates - - - - - - - - - -
ÓXido de hierro / iron oxide 6.761 22.945 7.106 3.283 16.451 18.821 10.678 10.449 9.992 -
piroFilita / pyrophyllite - - - - - 977 864 700 41 -
pUMiCita / pumicite - - - - - - - - - -
SUlFato de potaSio / potassium Sulfate - - - - - - - - - -
SUlFato de Sodio / Sodium Sulfate - - - - - - - - - -
talCo / talc - - 1.113 1.286 1.120 - - - - -
UleXita / Ulexite - - - - - - - - - -
WollaStonita / Wollastonite - - - - - - - - - -
YeSo / Gypsum 48.259 64.594 82.756 76.448 14.583 7.158 - 84.540 84.000 86.600
Yodo / iodine - - - - - - - - - -
iii. coMbustibles / Fuels CarbÓn (tM netas) / Coal (Mt, net) - - - - - - - - - -
petrÓleo CrUdo (Metros cúbicos) / Crude oil (CbM) - - - - - - - - - -
GaS natUral (Millones metros cúbicos) / natural gas (Mn CbM) - - - - - - - - - - (1) Cifras de producción de cobre elaboradas por SernaGeoMin. estas difieren con las de la Comisión Chilena del Cobre en la parte de compras a terceros no procesadas por enaMi. / as determined by SernaGeoMin. third-party purchases not processed by enaMi differ from those determined by the Chilean Copper Commission. Fuente / Source: Servicio nacional de Geología y Minería / national Geology and Mining Service.
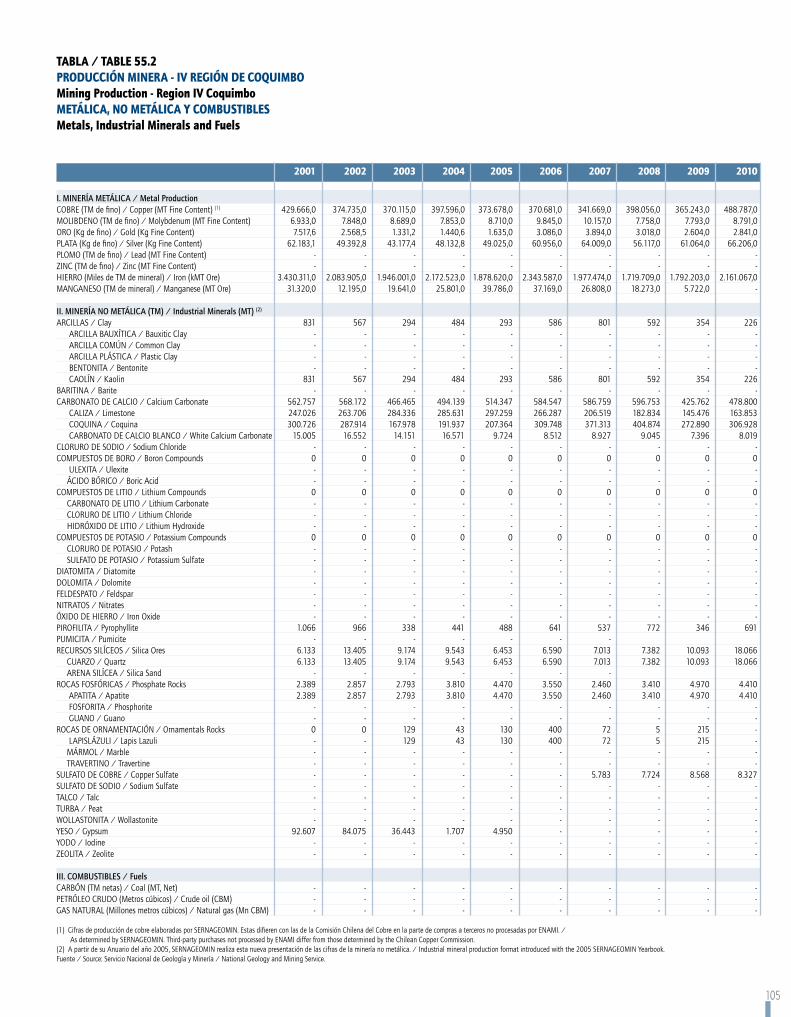
105
TABLA / TABLE 55.2PRODUCCIÓN MINERA - IV REGIÓN DE COQUIMBOMining Production - Region IV CoquimboMETÁLICA, NO METÁLICA Y COMBUSTIBLES Metals, Industrial Minerals and Fuels
2001 2002 2003 2004 2005 2006 2007 2008 2009 2010
i. MineríA MetÁlicA / Metal Production Cobre (tM de fino) / Copper (Mt Fine Content) (1) 429.666,0 374.735,0 370.115,0 397.596,0 373.678,0 370.681,0 341.669,0 398.056,0 365.243,0 488.787,0Molibdeno (tM de fino) / Molybdenum (Mt Fine Content) 6.933,0 7.848,0 8.689,0 7.853,0 8.710,0 9.845,0 10.157,0 7.758,0 7.793,0 8.791,0oro (kg de fino) / Gold (kg Fine Content) 7.517,6 2.568,5 1.331,2 1.440,6 1.635,0 3.086,0 3.894,0 3.018,0 2.604,0 2.841,0plata (kg de fino) / Silver (kg Fine Content) 62.183,1 49.392,8 43.177,4 48.132,8 49.025,0 60.956,0 64.009,0 56.117,0 61.064,0 66.206,0ploMo (tM de fino) / lead (Mt Fine Content) - - - - - - - - - -ZinC (tM de fino) / Zinc (Mt Fine Content) - - - - - - - - - -hierro (Miles de tM de mineral) / iron (kMt ore) 3.430.311,0 2.083.905,0 1.946.001,0 2.172.523,0 1.878.620,0 2.343.587,0 1.977.474,0 1.719.709,0 1.792.203,0 2.161.067,0ManGaneSo (tM de mineral) / Manganese (Mt ore) 31.320,0 12.195,0 19.641,0 25.801,0 39.786,0 37.169,0 26.808,0 18.273,0 5.722,0 - ii. MineríA no MetÁlicA (tM) / industrial Minerals (Mt) (2) arCillaS / Clay 831 567 294 484 293 586 801 592 354 226 arCilla baUXÍtiCa / bauxitic Clay - - - - - - - - - - arCilla CoMÚn / Common Clay - - - - - - - - - - arCilla plÁStiCa / plastic Clay - - - - - - - - - - bentonita / bentonite - - - - - - - - - - CaolÍn / kaolin 831 567 294 484 293 586 801 592 354 226baritina / barite - - - - - - - - - -Carbonato de CalCio / Calcium Carbonate 562.757 568.172 466.465 494.139 514.347 584.547 586.759 596.753 425.762 478.800 CaliZa / limestone 247.026 263.706 284.336 285.631 297.259 266.287 206.519 182.834 145.476 163.853 CoQUina / Coquina 300.726 287.914 167.978 191.937 207.364 309.748 371.313 404.874 272.890 306.928 Carbonato de CalCio blanCo / White Calcium Carbonate 15.005 16.552 14.151 16.571 9.724 8.512 8.927 9.045 7.396 8.019ClorUro de Sodio / Sodium Chloride - - - - - - - - - -CoMpUeStoS de boro / boron Compounds 0 0 0 0 0 0 0 0 0 0 UleXita / Ulexite - - - - - - - - - - ÁCido bÓriCo / boric acid - - - - - - - - - -CoMpUeStoS de litio / lithium Compounds 0 0 0 0 0 0 0 0 0 0 Carbonato de litio / lithium Carbonate - - - - - - - - - - ClorUro de litio / lithium Chloride - - - - - - - - - - hidrÓXido de litio / lithium hydroxide - - - - - - - - - -CoMpUeStoS de potaSio / potassium Compounds 0 0 0 0 0 0 0 0 0 0 ClorUro de potaSio / potash - - - - - - - - - - SUlFato de potaSio / potassium Sulfate - - - - - - - - - -diatoMita / diatomite - - - - - - - - - -doloMita / dolomite - - - - - - - - - -FeldeSpato / Feldspar - - - - - - - - - -nitratoS / nitrates - - - - - - - - - -ÓXido de hierro / iron oxide - - - - - - - - - -piroFilita / pyrophyllite 1.066 966 338 441 488 641 537 772 346 691pUMiCita / pumicite - - - - - - - reCUrSoS SilÍCeoS / Silica ores 6.133 13.405 9.174 9.543 6.453 6.590 7.013 7.382 10.093 18.066 CUarZo / Quartz 6.133 13.405 9.174 9.543 6.453 6.590 7.013 7.382 10.093 18.066 arena SilÍCea / Silica Sand - - - - - - - roCaS FoSFÓriCaS / phosphate rocks 2.389 2.857 2.793 3.810 4.470 3.550 2.460 3.410 4.970 4.410 apatita / apatite 2.389 2.857 2.793 3.810 4.470 3.550 2.460 3.410 4.970 4.410 FoSForita / phosphorite - - - - - - - - - - GUano / Guano - - - - - - - - - -roCaS de ornaMentaCiÓn / ornamentals rocks 0 0 129 43 130 400 72 5 215 - lapiSlÁZUli / lapis lazuli - - 129 43 130 400 72 5 215 - MÁrMol / Marble - - - - - - - - - - traVertino / travertine - - - - - - - - - -SUlFato de Cobre / Copper Sulfate - - - - - - 5.783 7.724 8.568 8.327SUlFato de Sodio / Sodium Sulfate - - - - - - - - - -talCo / talc - - - - - - - - - -tUrba / peat - - - - - - - - - -WollaStonita / Wollastonite - - - - - - - - - -YeSo / Gypsum 92.607 84.075 36.443 1.707 4.950 - - - - -Yodo / iodine - - - - - - - - - -Zeolita / Zeolite - - - - - - - - - - iii. coMbustibles / Fuels CarbÓn (tM netas) / Coal (Mt, net) - - - - - - - - - -petrÓleo CrUdo (Metros cúbicos) / Crude oil (CbM) - - - - - - - - - -GaS natUral (Millones metros cúbicos) / natural gas (Mn CbM) - - - - - - - - - - (1) Cifras de producción de cobre elaboradas por SernaGeoMin. estas difieren con las de la Comisión Chilena del Cobre en la parte de compras a terceros no procesadas por enaMi. / as determined by SernaGeoMin. third-party purchases not processed by enaMi differ from those determined by the Chilean Copper Commission. (2) a partir de su anuario del año 2005, SernaGeoMin realiza esta nueva presentación de las cifras de la minería no metálica. / industrial mineral production format introduced with the 2005 SernaGeoMin Yearbook. Fuente / Source: Servicio nacional de Geología y Minería / national Geology and Mining Service.
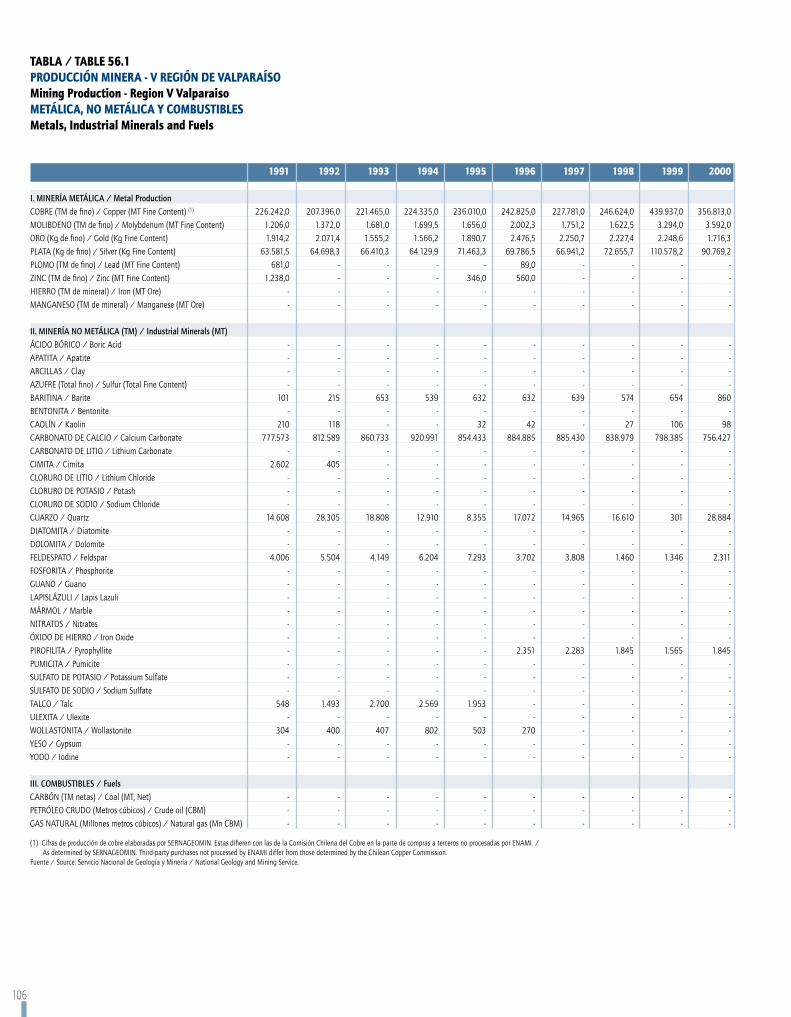
106
TABLA / TABLE 56.1PRODUCCIÓN MINERA - V REGIÓN DE VALPARAÍSOMining Production - Region V ValparaisoMETÁLICA, NO METÁLICA Y COMBUSTIBLES Metals, Industrial Minerals and Fuels
1991 1992 1993 1994 1995 1996 1997 1998 1999 2000
i. MineríA MetÁlicA / Metal Production Cobre (tM de fino) / Copper (Mt Fine Content) (1) 226.242,0 207.396,0 221.465,0 224.335,0 236.010,0 242.825,0 227.781,0 246.624,0 439.937,0 356.813,0
Molibdeno (tM de fino) / Molybdenum (Mt Fine Content) 1.206,0 1.372,0 1.681,0 1.699,5 1.656,0 2.002,3 1.751,2 1.622,5 3.294,0 3.592,0
oro (kg de fino) / Gold (kg Fine Content) 1.914,2 2.071,4 1.555,2 1.566,2 1.890,7 2.476,5 2.250,7 2.227,4 2.248,6 1.716,3
plata (kg de fino) / Silver (kg Fine Content) 63.581,5 64.698,3 66.410,3 64.129,9 71.463,3 69.786,5 66.941,2 72.655,7 110.578,2 90.769,2
ploMo (tM de fino) / lead (Mt Fine Content) 681,0 - - - - 89,0 - - - -
ZinC (tM de fino) / Zinc (Mt Fine Content) 1.238,0 - - - 346,0 560,0 - - - -
hierro (tM de mineral) / iron (Mt ore) - - - - - - - - - -
ManGaneSo (tM de mineral) / Manganese (Mt ore) - - - - - - - - - -
ii. MineríA no MetÁlicA (tM) / industrial Minerals (Mt) ÁCido bÓriCo / boric acid - - - - - - - - - -
apatita / apatite - - - - - - - - - -
arCillaS / Clay - - - - - - - - - -
aZUFre (total fino) / Sulfur (total Fine Content) - - - - - - - - - -
baritina / barite 101 215 653 539 632 632 639 574 654 860
bentonita / bentonite - - - - - - - - - -
CaolÍn / kaolin 210 118 - - 32 42 - 27 106 98
Carbonato de CalCio / Calcium Carbonate 777.573 812.589 860.733 920.991 854.433 884.885 885.430 838.979 798.385 756.427
Carbonato de litio / lithium Carbonate - - - - - - - - - -
CiMita / Cimita 2.602 405 - - - - - - - -
ClorUro de litio / lithium Chloride - - - - - - - - - -
ClorUro de potaSio / potash - - - - - - - - - -
ClorUro de Sodio / Sodium Chloride - - - - - - - - - -
CUarZo / Quartz 14.608 28.305 18.808 12.910 8.355 17.072 14.965 16.610 301 28.884
diatoMita / diatomite - - - - - - - - - -
doloMita / dolomite - - - - - - - - - -
FeldeSpato / Feldspar 4.006 5.504 4.149 6.204 7.293 3.702 3.808 1.460 1.346 2.311
FoSForita / phosphorite - - - - - - - - - -
GUano / Guano - - - - - - - - - -
lapiSlÁZUli / lapis lazuli - - - - - - - - - -
MÁrMol / Marble - - - - - - - - - -
nitratoS / nitrates - - - - - - - - - -
ÓXido de hierro / iron oxide - - - - - - - - - -
piroFilita / pyrophyllite - - - - - 2.351 2.283 1.845 1.565 1.845
pUMiCita / pumicite - - - - - - - - - -
SUlFato de potaSio / potassium Sulfate - - - - - - - - - -
SUlFato de Sodio / Sodium Sulfate - - - - - - - - - -
talCo / talc 548 1.493 2.700 2.569 1.953 - - - - -
UleXita / Ulexite - - - - - - - - - -
WollaStonita / Wollastonite 304 400 407 802 503 270 - - - -
YeSo / Gypsum - - - - - - - - - -
Yodo / iodine - - - - - - - - - -
iii. coMbustibles / Fuels CarbÓn (tM netas) / Coal (Mt, net) - - - - - - - - - -
petrÓleo CrUdo (Metros cúbicos) / Crude oil (CbM) - - - - - - - - - -
GaS natUral (Millones metros cúbicos) / natural gas (Mn CbM) - - - - - - - - - -
(1) Cifras de producción de cobre elaboradas por SernaGeoMin. estas difieren con las de la Comisión Chilena del Cobre en la parte de compras a terceros no procesadas por enaMi. / as determined by SernaGeoMin. third-party purchases not processed by enaMi differ from those determined by the Chilean Copper Commission. Fuente / Source: Servicio nacional de Geología y Minería / national Geology and Mining Service.
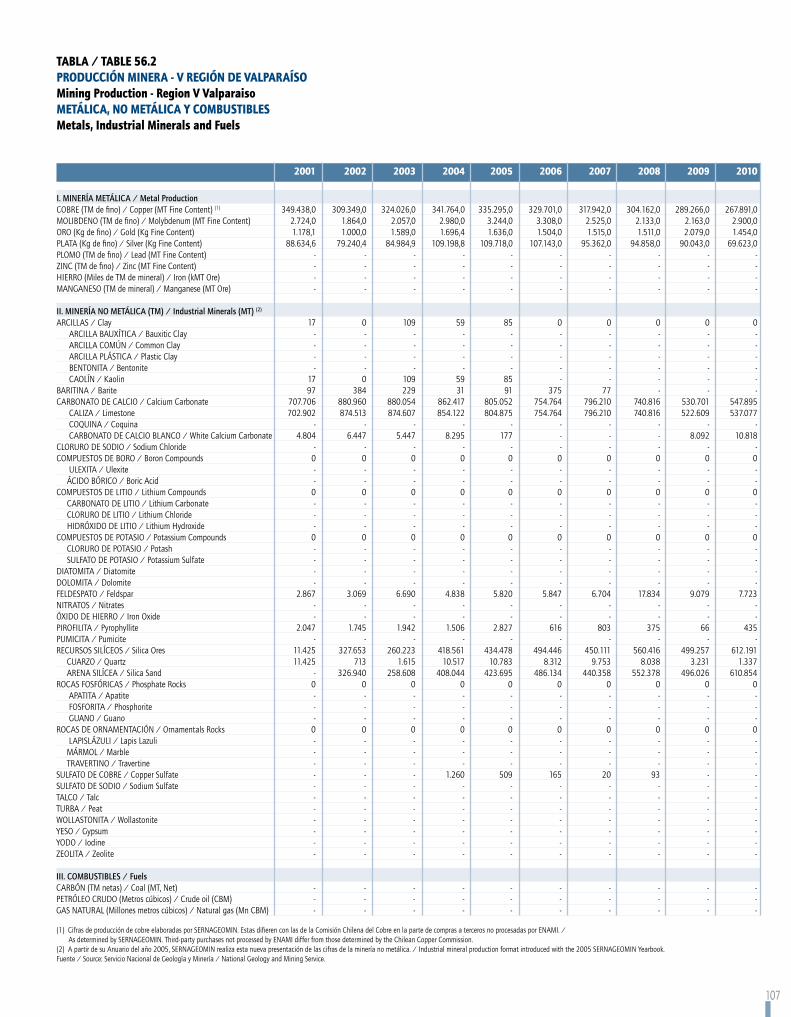
107
TABLA / TABLE 56.2PRODUCCIÓN MINERA - V REGIÓN DE VALPARAÍSOMining Production - Region V ValparaisoMETÁLICA, NO METÁLICA Y COMBUSTIBLES Metals, Industrial Minerals and Fuels
2001 2002 2003 2004 2005 2006 2007 2008 2009 2010
i. MineríA MetÁlicA / Metal Production Cobre (tM de fino) / Copper (Mt Fine Content) (1) 349.438,0 309.349,0 324.026,0 341.764,0 335.295,0 329.701,0 317.942,0 304.162,0 289.266,0 267.891,0Molibdeno (tM de fino) / Molybdenum (Mt Fine Content) 2.724,0 1.864,0 2.057,0 2.980,0 3.244,0 3.308,0 2.525,0 2.133,0 2.163,0 2.900,0oro (kg de fino) / Gold (kg Fine Content) 1.178,1 1.000,0 1.589,0 1.696,4 1.636,0 1.504,0 1.515,0 1.511,0 2.079,0 1.454,0plata (kg de fino) / Silver (kg Fine Content) 88.634,6 79.240,4 84.984,9 109.198,8 109.718,0 107.143,0 95.362,0 94.858,0 90.043,0 69.623,0ploMo (tM de fino) / lead (Mt Fine Content) - - - - - - - - - -ZinC (tM de fino) / Zinc (Mt Fine Content) - - - - - - - - - -hierro (Miles de tM de mineral) / iron (kMt ore) - - - - - - - - - -ManGaneSo (tM de mineral) / Manganese (Mt ore) - - - - - - - - - - ii. MineríA no MetÁlicA (tM) / industrial Minerals (Mt) (2) arCillaS / Clay 17 0 109 59 85 0 0 0 0 0 arCilla baUXÍtiCa / bauxitic Clay - - - - - - - - - - arCilla CoMÚn / Common Clay - - - - - - - - - - arCilla plÁStiCa / plastic Clay - - - - - - - - - - bentonita / bentonite - - - - - - - - - - CaolÍn / kaolin 17 0 109 59 85 - - - - -baritina / barite 97 384 229 31 91 375 77 - - -Carbonato de CalCio / Calcium Carbonate 707.706 880.960 880.054 862.417 805.052 754.764 796.210 740.816 530.701 547.895 CaliZa / limestone 702.902 874.513 874.607 854.122 804.875 754.764 796.210 740.816 522.609 537.077 CoQUina / Coquina - - - - - - - - - - Carbonato de CalCio blanCo / White Calcium Carbonate 4.804 6.447 5.447 8.295 177 - - - 8.092 10.818ClorUro de Sodio / Sodium Chloride - - - - - - - - - -CoMpUeStoS de boro / boron Compounds 0 0 0 0 0 0 0 0 0 0 UleXita / Ulexite - - - - - - - - - - ÁCido bÓriCo / boric acid - - - - - - - - - -CoMpUeStoS de litio / lithium Compounds 0 0 0 0 0 0 0 0 0 0 Carbonato de litio / lithium Carbonate - - - - - - - - - - ClorUro de litio / lithium Chloride - - - - - - - - - - hidrÓXido de litio / lithium hydroxide - - - - - - - - - -CoMpUeStoS de potaSio / potassium Compounds 0 0 0 0 0 0 0 0 0 0 ClorUro de potaSio / potash - - - - - - - - - - SUlFato de potaSio / potassium Sulfate - - - - - - - - - -diatoMita / diatomite - - - - - - - - - -doloMita / dolomite - - - - - - - - - -FeldeSpato / Feldspar 2.867 3.069 6.690 4.838 5.820 5.847 6.704 17.834 9.079 7.723nitratoS / nitrates - - - - - - - - - -ÓXido de hierro / iron oxide - - - - - - - - - -piroFilita / pyrophyllite 2.047 1.745 1.942 1.506 2.827 616 803 375 66 435pUMiCita / pumicite - - - - - - - - - -reCUrSoS SilÍCeoS / Silica ores 11.425 327.653 260.223 418.561 434.478 494.446 450.111 560.416 499.257 612.191 CUarZo / Quartz 11.425 713 1.615 10.517 10.783 8.312 9.753 8.038 3.231 1.337 arena SilÍCea / Silica Sand - 326.940 258.608 408.044 423.695 486.134 440.358 552.378 496.026 610.854roCaS FoSFÓriCaS / phosphate rocks 0 0 0 0 0 0 0 0 0 0 apatita / apatite - - - - - - - - - - FoSForita / phosphorite - - - - - - - - - - GUano / Guano - - - - - - - - - -roCaS de ornaMentaCiÓn / ornamentals rocks 0 0 0 0 0 0 0 0 0 0 lapiSlÁZUli / lapis lazuli - - - - - - - - - - MÁrMol / Marble - - - - - - - - - - traVertino / travertine - - - - - - - - - -SUlFato de Cobre / Copper Sulfate - - - 1.260 509 165 20 93 - -SUlFato de Sodio / Sodium Sulfate - - - - - - - - - -talCo / talc - - - - - - - - - -tUrba / peat - - - - - - - - - -WollaStonita / Wollastonite - - - - - - - - - -YeSo / Gypsum - - - - - - - - - -Yodo / iodine - - - - - - - - - -Zeolita / Zeolite - - - - - - - - - - iii. coMbustibles / Fuels CarbÓn (tM netas) / Coal (Mt, net) - - - - - - - - - -petrÓleo CrUdo (Metros cúbicos) / Crude oil (CbM) - - - - - - - - - -GaS natUral (Millones metros cúbicos) / natural gas (Mn CbM) - - - - - - - - - -
(1) Cifras de producción de cobre elaboradas por SernaGeoMin. estas difieren con las de la Comisión Chilena del Cobre en la parte de compras a terceros no procesadas por enaMi. / as determined by SernaGeoMin. third-party purchases not processed by enaMi differ from those determined by the Chilean Copper Commission.(2) a partir de su anuario del año 2005, SernaGeoMin realiza esta nueva presentación de las cifras de la minería no metálica. / industrial mineral production format introduced with the 2005 SernaGeoMin Yearbook. Fuente / Source: Servicio nacional de Geología y Minería / national Geology and Mining Service.
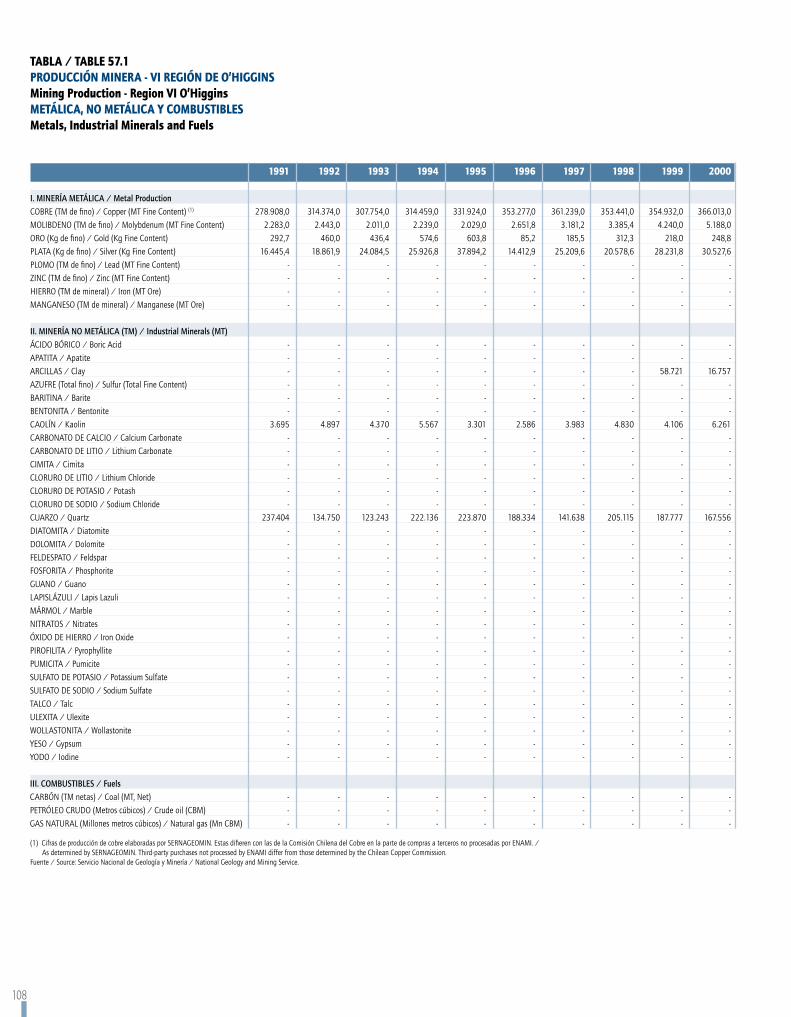
108
TABLA / TABLE 57.1PRODUCCIÓN MINERA - VI REGIÓN DE O’HIGGINSMining Production - Region VI O’HigginsMETÁLICA, NO METÁLICA Y COMBUSTIBLESMetals, Industrial Minerals and Fuels
1991 1992 1993 1994 1995 1996 1997 1998 1999 2000
i. MineríA MetÁlicA / Metal Production Cobre (tM de fino) / Copper (Mt Fine Content) (1) 278.908,0 314.374,0 307.754,0 314.459,0 331.924,0 353.277,0 361.239,0 353.441,0 354.932,0 366.013,0
Molibdeno (tM de fino) / Molybdenum (Mt Fine Content) 2.283,0 2.443,0 2.011,0 2.239,0 2.029,0 2.651,8 3.181,2 3.385,4 4.240,0 5.188,0
oro (kg de fino) / Gold (kg Fine Content) 292,7 460,0 436,4 574,6 603,8 85,2 185,5 312,3 218,0 248,8
plata (kg de fino) / Silver (kg Fine Content) 16.445,4 18.861,9 24.084,5 25.926,8 37.894,2 14.412,9 25.209,6 20.578,6 28.231,8 30.527,6
ploMo (tM de fino) / lead (Mt Fine Content) - - - - - - - - - -
ZinC (tM de fino) / Zinc (Mt Fine Content) - - - - - - - - - -
hierro (tM de mineral) / iron (Mt ore) - - - - - - - - - -
ManGaneSo (tM de mineral) / Manganese (Mt ore) - - - - - - - - - -
ii. MineríA no MetÁlicA (tM) / industrial Minerals (Mt) ÁCido bÓriCo / boric acid - - - - - - - - - -
apatita / apatite - - - - - - - - - -
arCillaS / Clay - - - - - - - - 58.721 16.757
aZUFre (total fino) / Sulfur (total Fine Content) - - - - - - - - - -
baritina / barite - - - - - - - - - -
bentonita / bentonite - - - - - - - - - -
CaolÍn / kaolin 3.695 4.897 4.370 5.567 3.301 2.586 3.983 4.830 4.106 6.261
Carbonato de CalCio / Calcium Carbonate - - - - - - - - - -
Carbonato de litio / lithium Carbonate - - - - - - - - - -
CiMita / Cimita - - - - - - - - - -
ClorUro de litio / lithium Chloride - - - - - - - - - -
ClorUro de potaSio / potash - - - - - - - - - -
ClorUro de Sodio / Sodium Chloride - - - - - - - - - -
CUarZo / Quartz 237.404 134.750 123.243 222.136 223.870 188.334 141.638 205.115 187.777 167.556
diatoMita / diatomite - - - - - - - - - -
doloMita / dolomite - - - - - - - - - -
FeldeSpato / Feldspar - - - - - - - - - -
FoSForita / phosphorite - - - - - - - - - -
GUano / Guano - - - - - - - - - -
lapiSlÁZUli / lapis lazuli - - - - - - - - - -
MÁrMol / Marble - - - - - - - - - -
nitratoS / nitrates - - - - - - - - - -
ÓXido de hierro / iron oxide - - - - - - - - - -
piroFilita / pyrophyllite - - - - - - - - - -
pUMiCita / pumicite - - - - - - - - - -
SUlFato de potaSio / potassium Sulfate - - - - - - - - - -
SUlFato de Sodio / Sodium Sulfate - - - - - - - - - -
talCo / talc - - - - - - - - - -
UleXita / Ulexite - - - - - - - - - -
WollaStonita / Wollastonite - - - - - - - - - -
YeSo / Gypsum - - - - - - - - - -
Yodo / iodine - - - - - - - - - -
iii. coMbustibles / Fuels CarbÓn (tM netas) / Coal (Mt, net) - - - - - - - - - -
petrÓleo CrUdo (Metros cúbicos) / Crude oil (CbM) - - - - - - - - - -
GaS natUral (Millones metros cúbicos) / natural gas (Mn CbM) - - - - - - - - - - (1) Cifras de producción de cobre elaboradas por SernaGeoMin. estas difieren con las de la Comisión Chilena del Cobre en la parte de compras a terceros no procesadas por enaMi. / as determined by SernaGeoMin. third-party purchases not processed by enaMi differ from those determined by the Chilean Copper Commission. Fuente / Source: Servicio nacional de Geología y Minería / national Geology and Mining Service.
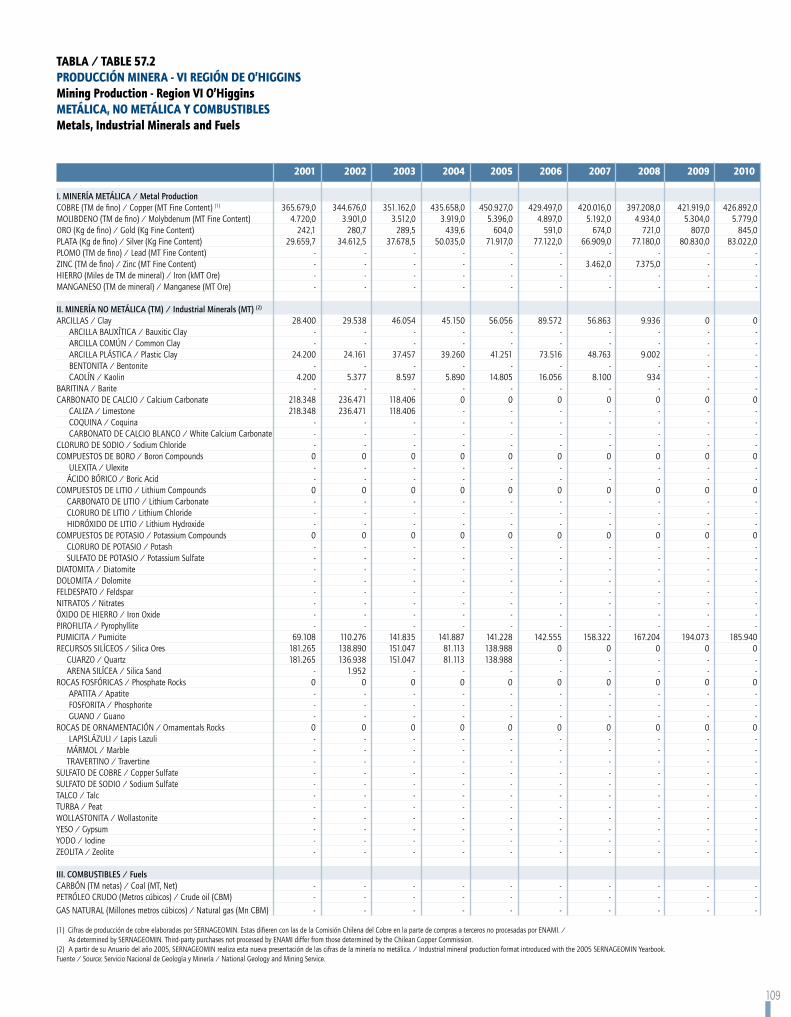
109
TABLA / TABLE 57.2PRODUCCIÓN MINERA - VI REGIÓN DE O’HIGGINSMining Production - Region VI O’HigginsMETÁLICA, NO METÁLICA Y COMBUSTIBLES Metals, Industrial Minerals and Fuels
2001 2002 2003 2004 2005 2006 2007 2008 2009 2010 i. MineríA MetÁlicA / Metal Production Cobre (tM de fino) / Copper (Mt Fine Content) (1) 365.679,0 344.676,0 351.162,0 435.658,0 450.927,0 429.497,0 420.016,0 397.208,0 421.919,0 426.892,0Molibdeno (tM de fino) / Molybdenum (Mt Fine Content) 4.720,0 3.901,0 3.512,0 3.919,0 5.396,0 4.897,0 5.192,0 4.934,0 5.304,0 5.779,0oro (kg de fino) / Gold (kg Fine Content) 242,1 280,7 289,5 439,6 604,0 591,0 674,0 721,0 807,0 845,0plata (kg de fino) / Silver (kg Fine Content) 29.659,7 34.612,5 37.678,5 50.035,0 71.917,0 77.122,0 66.909,0 77.180,0 80.830,0 83.022,0ploMo (tM de fino) / lead (Mt Fine Content) - - - - - - - - - -ZinC (tM de fino) / Zinc (Mt Fine Content) - - - - - - 3.462,0 7.375,0 - -hierro (Miles de tM de mineral) / iron (kMt ore) - - - - - - - - - -ManGaneSo (tM de mineral) / Manganese (Mt ore) - - - - - - - - - - ii. MineríA no MetÁlicA (tM) / industrial Minerals (Mt) (2) arCillaS / Clay 28.400 29.538 46.054 45.150 56.056 89.572 56.863 9.936 0 0 arCilla baUXÍtiCa / bauxitic Clay - - - - - - - - - - arCilla CoMÚn / Common Clay - - - - - - - - - - arCilla plÁStiCa / plastic Clay 24.200 24.161 37.457 39.260 41.251 73.516 48.763 9.002 - - bentonita / bentonite - - - - - - - - - - CaolÍn / kaolin 4.200 5.377 8.597 5.890 14.805 16.056 8.100 934 - -baritina / barite - - - - - - - - - -Carbonato de CalCio / Calcium Carbonate 218.348 236.471 118.406 0 0 0 0 0 0 0 CaliZa / limestone 218.348 236.471 118.406 - - - - - - - CoQUina / Coquina - - - - - - - - - - Carbonato de CalCio blanCo / White Calcium Carbonate - - - - - - - - - -ClorUro de Sodio / Sodium Chloride - - - - - - - - - -CoMpUeStoS de boro / boron Compounds 0 0 0 0 0 0 0 0 0 0 UleXita / Ulexite - - - - - - - - - - ÁCido bÓriCo / boric acid - - - - - - - - - -CoMpUeStoS de litio / lithium Compounds 0 0 0 0 0 0 0 0 0 0 Carbonato de litio / lithium Carbonate - - - - - - - - - - ClorUro de litio / lithium Chloride - - - - - - - - - - hidrÓXido de litio / lithium hydroxide - - - - - - - - - -CoMpUeStoS de potaSio / potassium Compounds 0 0 0 0 0 0 0 0 0 0 ClorUro de potaSio / potash - - - - - - - - - - SUlFato de potaSio / potassium Sulfate - - - - - - - - - -diatoMita / diatomite - - - - - - - - - -doloMita / dolomite - - - - - - - - - -FeldeSpato / Feldspar - - - - - - - - - -nitratoS / nitrates - - - - - - - - - -ÓXido de hierro / iron oxide - - - - - - - - - -piroFilita / pyrophyllite - - - - - - - - - -pUMiCita / pumicite 69.108 110.276 141.835 141.887 141.228 142.555 158.322 167.204 194.073 185.940reCUrSoS SilÍCeoS / Silica ores 181.265 138.890 151.047 81.113 138.988 0 0 0 0 0 CUarZo / Quartz 181.265 136.938 151.047 81.113 138.988 - - - - - arena SilÍCea / Silica Sand - 1.952 - - - - - - - -roCaS FoSFÓriCaS / phosphate rocks 0 0 0 0 0 0 0 0 0 0 apatita / apatite - - - - - - - - - - FoSForita / phosphorite - - - - - - - - - - GUano / Guano - - - - - - - - - -roCaS de ornaMentaCiÓn / ornamentals rocks 0 0 0 0 0 0 0 0 0 0 lapiSlÁZUli / lapis lazuli - - - - - - - - - - MÁrMol / Marble - - - - - - - - - - traVertino / travertine - - - - - - - - - -SUlFato de Cobre / Copper Sulfate - - - - - - - - - -SUlFato de Sodio / Sodium Sulfate - - - - - - - - - -talCo / talc - - - - - - - - - -tUrba / peat - - - - - - - - - -WollaStonita / Wollastonite - - - - - - - - - -YeSo / Gypsum - - - - - - - - - -Yodo / iodine - - - - - - - - - -Zeolita / Zeolite - - - - - - - - - - iii. coMbustibles / Fuels CarbÓn (tM netas) / Coal (Mt, net) - - - - - - - - - -petrÓleo CrUdo (Metros cúbicos) / Crude oil (CbM) - - - - - - - - - -
GaS natUral (Millones metros cúbicos) / natural gas (Mn CbM) - - - - - - - - - - (1) Cifras de producción de cobre elaboradas por SernaGeoMin. estas difieren con las de la Comisión Chilena del Cobre en la parte de compras a terceros no procesadas por enaMi. / as determined by SernaGeoMin. third-party purchases not processed by enaMi differ from those determined by the Chilean Copper Commission. (2) a partir de su anuario del año 2005, SernaGeoMin realiza esta nueva presentación de las cifras de la minería no metálica. / industrial mineral production format introduced with the 2005 SernaGeoMin Yearbook. Fuente / Source: Servicio nacional de Geología y Minería / national Geology and Mining Service.
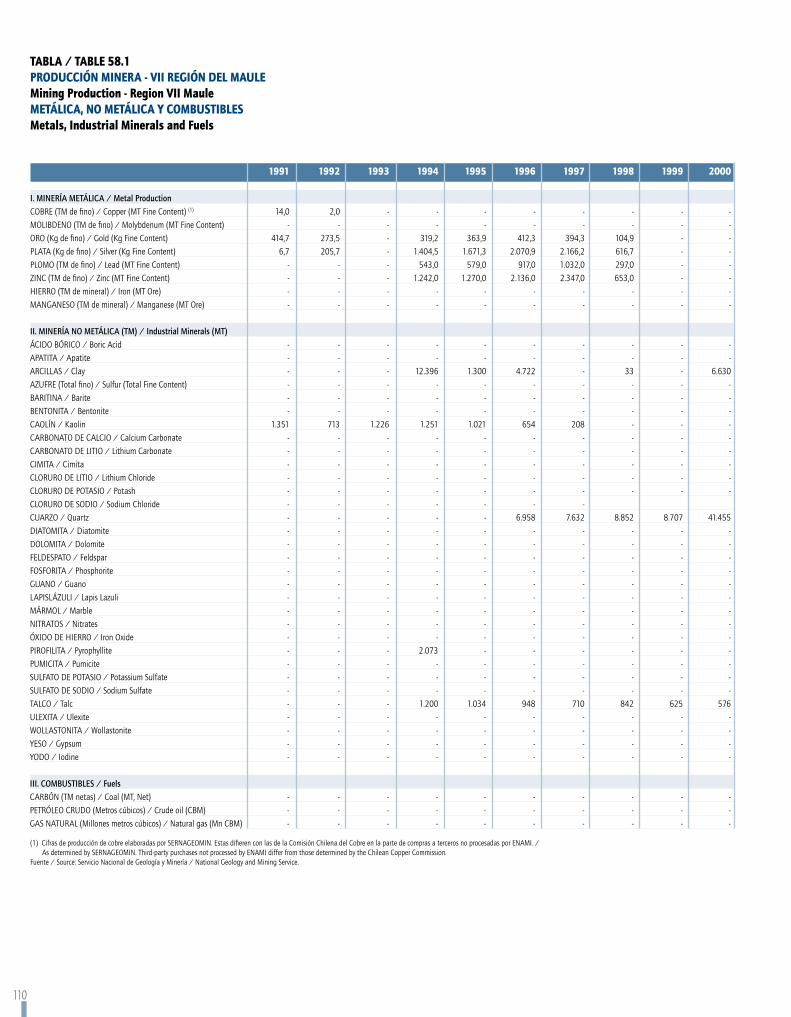
110
TABLA / TABLE 58.1PRODUCCIÓN MINERA - VII REGIÓN DEL MAULEMining Production - Region VII MauleMETÁLICA, NO METÁLICA Y COMBUSTIBLES Metals, Industrial Minerals and Fuels
1991 1992 1993 1994 1995 1996 1997 1998 1999 2000
i. MineríA MetÁlicA / Metal Production Cobre (tM de fino) / Copper (Mt Fine Content) (1) 14,0 2,0 - - - - - - - -
Molibdeno (tM de fino) / Molybdenum (Mt Fine Content) - - - - - - - - - -
oro (kg de fino) / Gold (kg Fine Content) 414,7 273,5 - 319,2 363,9 412,3 394,3 104,9 - -
plata (kg de fino) / Silver (kg Fine Content) 6,7 205,7 - 1.404,5 1.671,3 2.070,9 2.166,2 616,7 - -
ploMo (tM de fino) / lead (Mt Fine Content) - - - 543,0 579,0 917,0 1.032,0 297,0 - -
ZinC (tM de fino) / Zinc (Mt Fine Content) - - - 1.242,0 1.270,0 2.136,0 2.347,0 653,0 - -
hierro (tM de mineral) / iron (Mt ore) - - - - - - - - - -
ManGaneSo (tM de mineral) / Manganese (Mt ore) - - - - - - - - - -
ii. MineríA no MetÁlicA (tM) / industrial Minerals (Mt) ÁCido bÓriCo / boric acid - - - - - - - - - -
apatita / apatite - - - - - - - - - -
arCillaS / Clay - - - 12.396 1.300 4.722 - 33 - 6.630
aZUFre (total fino) / Sulfur (total Fine Content) - - - - - - - - - -
baritina / barite - - - - - - - - - -
bentonita / bentonite - - - - - - - - - -
CaolÍn / kaolin 1.351 713 1.226 1.251 1.021 654 208 - - -
Carbonato de CalCio / Calcium Carbonate - - - - - - - - - -
Carbonato de litio / lithium Carbonate - - - - - - - - - -
CiMita / Cimita - - - - - - - - - -
ClorUro de litio / lithium Chloride - - - - - - - - - -
ClorUro de potaSio / potash - - - - - - - - - -
ClorUro de Sodio / Sodium Chloride - - - - - - -
CUarZo / Quartz - - - - - 6.958 7.632 8.852 8.707 41.455
diatoMita / diatomite - - - - - - - - - -
doloMita / dolomite - - - - - - - - - -
FeldeSpato / Feldspar - - - - - - - - - -
FoSForita / phosphorite - - - - - - - - - -
GUano / Guano - - - - - - - - - -
lapiSlÁZUli / lapis lazuli - - - - - - - - - -
MÁrMol / Marble - - - - - - - - - -
nitratoS / nitrates - - - - - - - - - -
ÓXido de hierro / iron oxide - - - - - - - - - -
piroFilita / pyrophyllite - - - 2.073 - - - - - -
pUMiCita / pumicite - - - - - - - - - -
SUlFato de potaSio / potassium Sulfate - - - - - - - - - -
SUlFato de Sodio / Sodium Sulfate - - - - - - - - - -
talCo / talc - - - 1.200 1.034 948 710 842 625 576
UleXita / Ulexite - - - - - - - - - -
WollaStonita / Wollastonite - - - - - - - - - -
YeSo / Gypsum - - - - - - - - - -
Yodo / iodine - - - - - - - - - -
iii. coMbustibles / Fuels CarbÓn (tM netas) / Coal (Mt, net) - - - - - - - - - -
petrÓleo CrUdo (Metros cúbicos) / Crude oil (CbM) - - - - - - - - - -
GaS natUral (Millones metros cúbicos) / natural gas (Mn CbM) - - - - - - - - - -
(1) Cifras de producción de cobre elaboradas por SernaGeoMin. estas difieren con las de la Comisión Chilena del Cobre en la parte de compras a terceros no procesadas por enaMi. / as determined by SernaGeoMin. third-party purchases not processed by enaMi differ from those determined by the Chilean Copper Commission. Fuente / Source: Servicio nacional de Geología y Minería / national Geology and Mining Service.
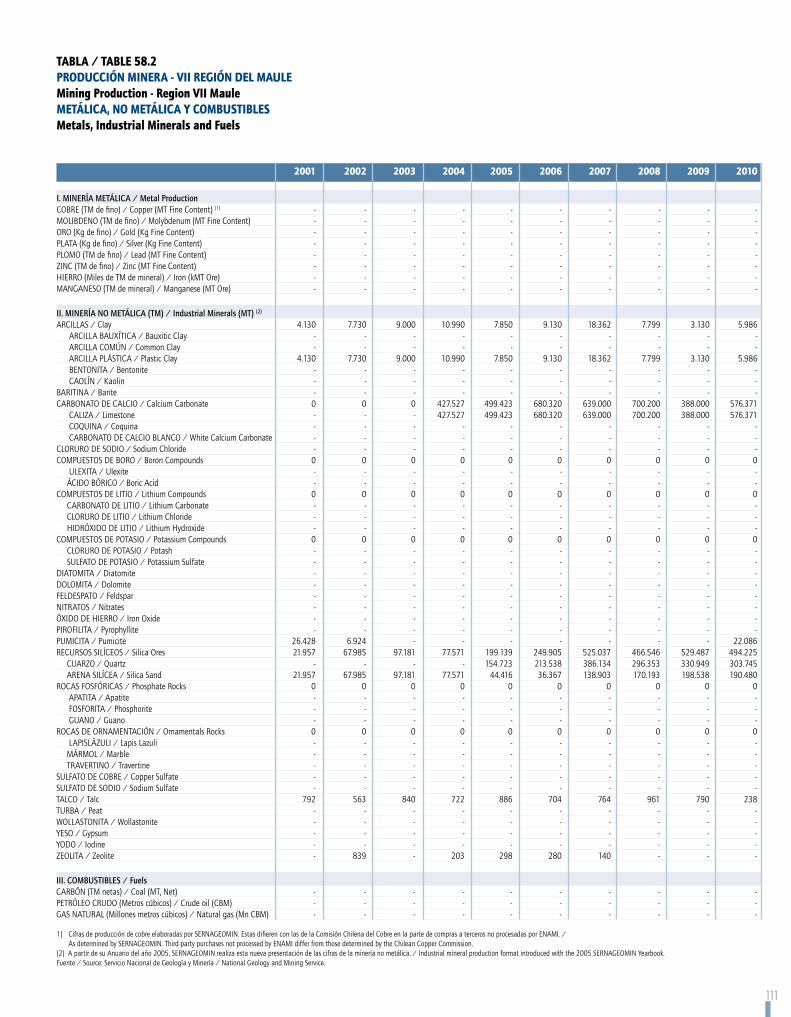
111
TABLA / TABLE 58.2PRODUCCIÓN MINERA - VII REGIÓN DEL MAULEMining Production - Region VII MauleMETÁLICA, NO METÁLICA Y COMBUSTIBLES Metals, Industrial Minerals and Fuels
2001 2002 2003 2004 2005 2006 2007 2008 2009 2010
i. MineríA MetÁlicA / Metal Production Cobre (tM de fino) / Copper (Mt Fine Content) (1) - - - - - - - - - -Molibdeno (tM de fino) / Molybdenum (Mt Fine Content) - - - - - - - - - -oro (kg de fino) / Gold (kg Fine Content) - - - - - - - - - -plata (kg de fino) / Silver (kg Fine Content) - - - - - - - - - -ploMo (tM de fino) / lead (Mt Fine Content) - - - - - - - - - -ZinC (tM de fino) / Zinc (Mt Fine Content) - - - - - - - - - -hierro (Miles de tM de mineral) / iron (kMt ore) - - - - - - - - - -ManGaneSo (tM de mineral) / Manganese (Mt ore) - - - - - - - - - -
ii. MineríA no MetÁlicA (tM) / industrial Minerals (Mt) (2) arCillaS / Clay 4.130 7.730 9.000 10.990 7.850 9.130 18.362 7.799 3.130 5.986 arCilla baUXÍtiCa / bauxitic Clay - - - - - - - - - - arCilla CoMÚn / Common Clay - - - - - - - - - - arCilla plÁStiCa / plastic Clay 4.130 7.730 9.000 10.990 7.850 9.130 18.362 7.799 3.130 5.986 bentonita / bentonite - - - - - - - - - - CaolÍn / kaolin - - - - - - - - - -baritina / barite - - - - - - - - - -Carbonato de CalCio / Calcium Carbonate 0 0 0 427.527 499.423 680.320 639.000 700.200 388.000 576.371 CaliZa / limestone - - - 427.527 499.423 680.320 639.000 700.200 388.000 576.371 CoQUina / Coquina - - - - - - - - - - Carbonato de CalCio blanCo / White Calcium Carbonate - - - - - - - - - -ClorUro de Sodio / Sodium Chloride - - - - - - - - - -CoMpUeStoS de boro / boron Compounds 0 0 0 0 0 0 0 0 0 0 UleXita / Ulexite - - - - - - - - - - ÁCido bÓriCo / boric acid - - - - - - - - - -CoMpUeStoS de litio / lithium Compounds 0 0 0 0 0 0 0 0 0 0 Carbonato de litio / lithium Carbonate - - - - - - - - - - ClorUro de litio / lithium Chloride - - - - - - - - - - hidrÓXido de litio / lithium hydroxide - - - - - - - - - -CoMpUeStoS de potaSio / potassium Compounds 0 0 0 0 0 0 0 0 0 0 ClorUro de potaSio / potash - - - - - - - - - - SUlFato de potaSio / potassium Sulfate - - - - - - - - - -diatoMita / diatomite - - - - - - - - - -doloMita / dolomite - - - - - - - - - -FeldeSpato / Feldspar - - - - - - - - - -nitratoS / nitrates - - - - - - - - - -ÓXido de hierro / iron oxide - - - - - - - - - -piroFilita / pyrophyllite - - - - - - - - - -pUMiCita / pumicite 26.428 6.924 - - - - - - - 22.086reCUrSoS SilÍCeoS / Silica ores 21.957 67.985 97.181 77.571 199.139 249.905 525.037 466.546 529.487 494.225 CUarZo / Quartz - - - - 154.723 213.538 386.134 296.353 330.949 303.745 arena SilÍCea / Silica Sand 21.957 67.985 97.181 77.571 44.416 36.367 138.903 170.193 198.538 190.480roCaS FoSFÓriCaS / phosphate rocks 0 0 0 0 0 0 0 0 0 0 apatita / apatite - - - - - - - - - - FoSForita / phosphorite - - - - - - - - - - GUano / Guano - - - - - - - - - -roCaS de ornaMentaCiÓn / ornamentals rocks 0 0 0 0 0 0 0 0 0 0 lapiSlÁZUli / lapis lazuli - - - - - - - - - - MÁrMol / Marble - - - - - - - - - - traVertino / travertine - - - - - - - - - -SUlFato de Cobre / Copper Sulfate - - - - - - - - - -SUlFato de Sodio / Sodium Sulfate - - - - - - - - - -talCo / talc 792 563 840 722 886 704 764 961 790 238tUrba / peat - - - - - - - - - -WollaStonita / Wollastonite - - - - - - - - - -YeSo / Gypsum - - - - - - - - - -Yodo / iodine - - - - - - - - - -Zeolita / Zeolite - 839 - 203 298 280 140 - - -
iii. coMbustibles / Fuels CarbÓn (tM netas) / Coal (Mt, net) - - - - - - - - - -petrÓleo CrUdo (Metros cúbicos) / Crude oil (CbM) - - - - - - - - - -GaS natUral (Millones metros cúbicos) / natural gas (Mn CbM) - - - - - - - - - -
1) Cifras de producción de cobre elaboradas por SernaGeoMin. estas difieren con las de la Comisión Chilena del Cobre en la parte de compras a terceros no procesadas por enaMi. / as determined by SernaGeoMin. third-party purchases not processed by enaMi differ from those determined by the Chilean Copper Commission. (2) a partir de su anuario del año 2005, SernaGeoMin realiza esta nueva presentación de las cifras de la minería no metálica. / industrial mineral production format introduced with the 2005 SernaGeoMin Yearbook. Fuente / Source: Servicio nacional de Geología y Minería / national Geology and Mining Service.
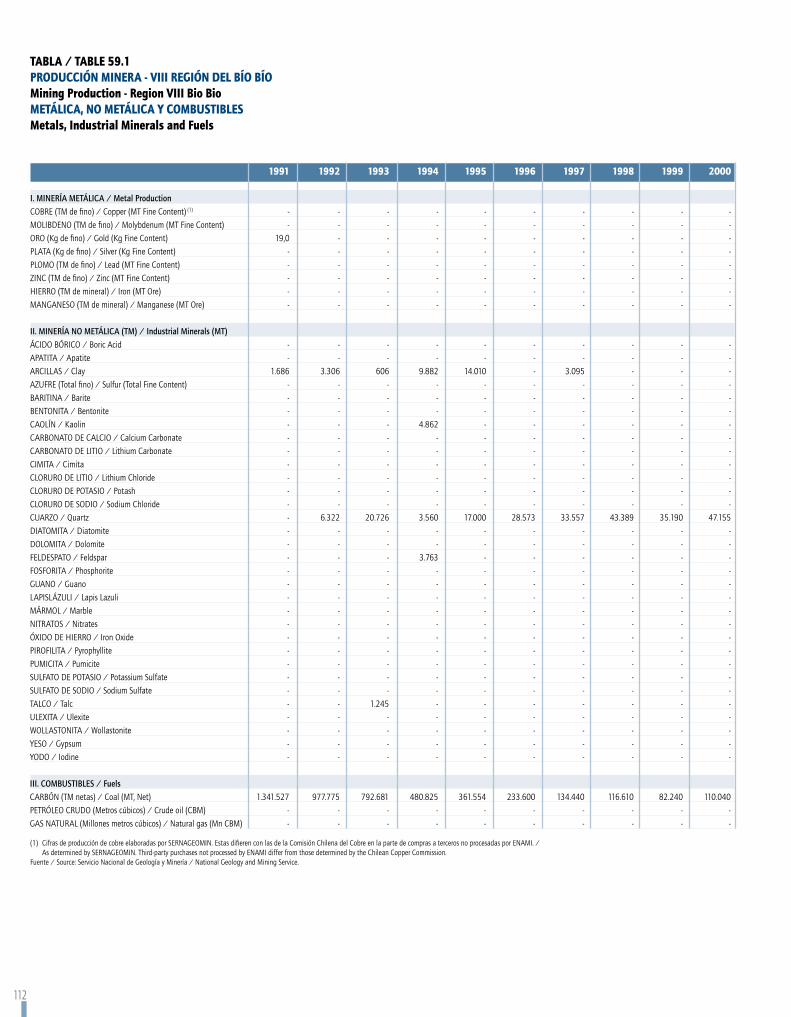
112
TABLA / TABLE 59.1PRODUCCIÓN MINERA - VIII REGIÓN DEL BÍO BÍO Mining Production - Region VIII Bio BioMETÁLICA, NO METÁLICA Y COMBUSTIBLES Metals, Industrial Minerals and Fuels
1991 1992 1993 1994 1995 1996 1997 1998 1999 2000
i. MineríA MetÁlicA / Metal Production Cobre (tM de fino) / Copper (Mt Fine Content) (1) - - - - - - - - - -
Molibdeno (tM de fino) / Molybdenum (Mt Fine Content) - - - - - - - - - -
oro (kg de fino) / Gold (kg Fine Content) 19,0 - - - - - - - - -
plata (kg de fino) / Silver (kg Fine Content) - - - - - - - - - -
ploMo (tM de fino) / lead (Mt Fine Content) - - - - - - - - - -
ZinC (tM de fino) / Zinc (Mt Fine Content) - - - - - - - - - -
hierro (tM de mineral) / iron (Mt ore) - - - - - - - - - -
ManGaneSo (tM de mineral) / Manganese (Mt ore) - - - - - - - - - -
ii. MineríA no MetÁlicA (tM) / industrial Minerals (Mt) ÁCido bÓriCo / boric acid - - - - - - - - - -
apatita / apatite - - - - - - - - - -
arCillaS / Clay 1.686 3.306 606 9.882 14.010 - 3.095 - - -
aZUFre (total fino) / Sulfur (total Fine Content) - - - - - - - - - -
baritina / barite - - - - - - - - - -
bentonita / bentonite - - - - - - - - - -
CaolÍn / kaolin - - - 4.862 - - - - - -
Carbonato de CalCio / Calcium Carbonate - - - - - - - - - -
Carbonato de litio / lithium Carbonate - - - - - - - - - -
CiMita / Cimita - - - - - - - - - -
ClorUro de litio / lithium Chloride - - - - - - - - - -
ClorUro de potaSio / potash - - - - - - - - - -
ClorUro de Sodio / Sodium Chloride - - - - - - - - - -
CUarZo / Quartz - 6.322 20.726 3.560 17.000 28.573 33.557 43.389 35.190 47.155
diatoMita / diatomite - - - - - - - - - -
doloMita / dolomite - - - - - - - - - -
FeldeSpato / Feldspar - - - 3.763 - - - - - -
FoSForita / phosphorite - - - - - - - - - -
GUano / Guano - - - - - - - - - -
lapiSlÁZUli / lapis lazuli - - - - - - - - - -
MÁrMol / Marble - - - - - - - - - -
nitratoS / nitrates - - - - - - - - - -
ÓXido de hierro / iron oxide - - - - - - - - - -
piroFilita / pyrophyllite - - - - - - - - - -
pUMiCita / pumicite - - - - - - - - - -
SUlFato de potaSio / potassium Sulfate - - - - - - - - - -
SUlFato de Sodio / Sodium Sulfate - - - - - - - - - -
talCo / talc - - 1.245 - - - - - - -
UleXita / Ulexite - - - - - - - - - -
WollaStonita / Wollastonite - - - - - - - - - -
YeSo / Gypsum - - - - - - - - - -
Yodo / iodine - - - - - - - - - -
iii. coMbustibles / Fuels CarbÓn (tM netas) / Coal (Mt, net) 1.341.527 977.775 792.681 480.825 361.554 233.600 134.440 116.610 82.240 110.040
petrÓleo CrUdo (Metros cúbicos) / Crude oil (CbM) - - - - - - - - - -
GaS natUral (Millones metros cúbicos) / natural gas (Mn CbM) - - - - - - - - - -
(1) Cifras de producción de cobre elaboradas por SernaGeoMin. estas difieren con las de la Comisión Chilena del Cobre en la parte de compras a terceros no procesadas por enaMi. / as determined by SernaGeoMin. third-party purchases not processed by enaMi differ from those determined by the Chilean Copper Commission. Fuente / Source: Servicio nacional de Geología y Minería / national Geology and Mining Service.
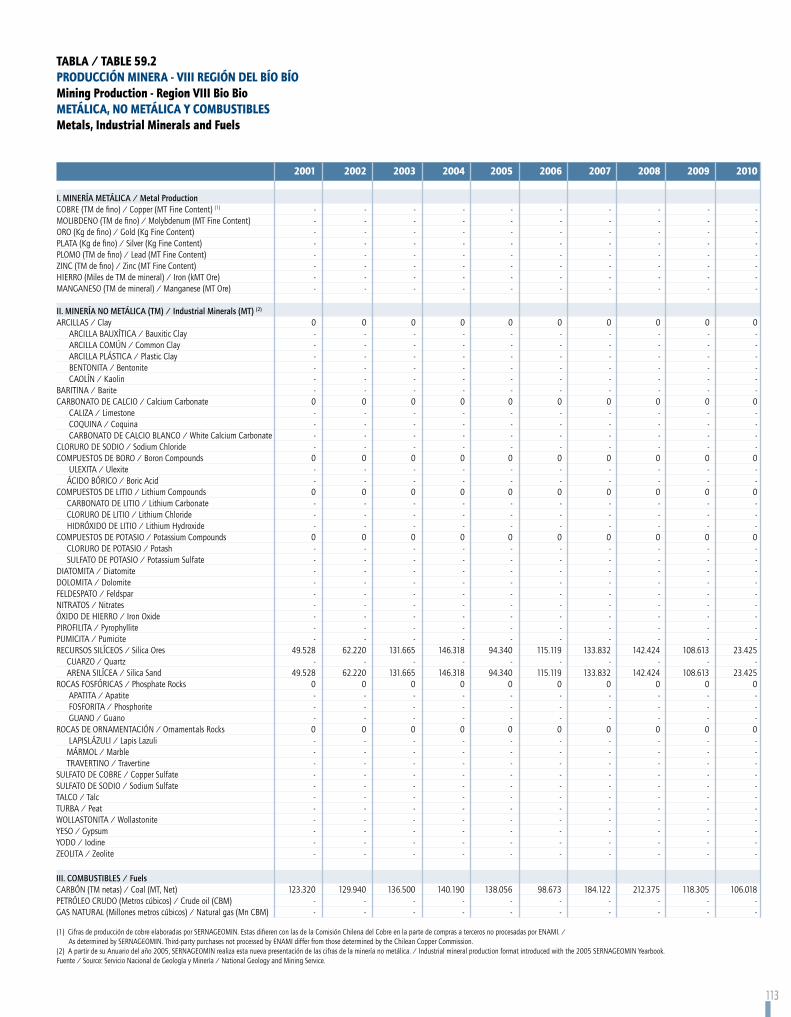
113
TABLA / TABLE 59.2PRODUCCIÓN MINERA - VIII REGIÓN DEL BÍO BÍO Mining Production - Region VIII Bio BioMETÁLICA, NO METÁLICA Y COMBUSTIBLES Metals, Industrial Minerals and Fuels
2001 2002 2003 2004 2005 2006 2007 2008 2009 2010
i. MineríA MetÁlicA / Metal Production Cobre (tM de fino) / Copper (Mt Fine Content) (1) - - - - - - - - - -Molibdeno (tM de fino) / Molybdenum (Mt Fine Content) - - - - - - - - - -oro (kg de fino) / Gold (kg Fine Content) - - - - - - - - - -plata (kg de fino) / Silver (kg Fine Content) - - - - - - - - - -ploMo (tM de fino) / lead (Mt Fine Content) - - - - - - - - - -ZinC (tM de fino) / Zinc (Mt Fine Content) - - - - - - - - - -hierro (Miles de tM de mineral) / iron (kMt ore) - - - - - - - - - -ManGaneSo (tM de mineral) / Manganese (Mt ore) - - - - - - - - - - ii. MineríA no MetÁlicA (tM) / industrial Minerals (Mt) (2) arCillaS / Clay 0 0 0 0 0 0 0 0 0 0 arCilla baUXÍtiCa / bauxitic Clay - - - - - - - - - - arCilla CoMÚn / Common Clay - - - - - - - - - - arCilla plÁStiCa / plastic Clay - - - - - - - - - - bentonita / bentonite - - - - - - - - - - CaolÍn / kaolin - - - - - - - - - -baritina / barite - - - - - - - - - -Carbonato de CalCio / Calcium Carbonate 0 0 0 0 0 0 0 0 0 0 CaliZa / limestone - - - - - - - - - - CoQUina / Coquina - - - - - - - - - - Carbonato de CalCio blanCo / White Calcium Carbonate - - - - - - - - - -ClorUro de Sodio / Sodium Chloride - - - - - - - - - -CoMpUeStoS de boro / boron Compounds 0 0 0 0 0 0 0 0 0 0 UleXita / Ulexite - - - - - - - - - - ÁCido bÓriCo / boric acid - - - - - - - - - -CoMpUeStoS de litio / lithium Compounds 0 0 0 0 0 0 0 0 0 0 Carbonato de litio / lithium Carbonate - - - - - - - - - - ClorUro de litio / lithium Chloride - - - - - - - - - - hidrÓXido de litio / lithium hydroxide - - - - - - - - - -CoMpUeStoS de potaSio / potassium Compounds 0 0 0 0 0 0 0 0 0 0 ClorUro de potaSio / potash - - - - - - - - - - SUlFato de potaSio / potassium Sulfate - - - - - - - - - -diatoMita / diatomite - - - - - - - - - -doloMita / dolomite - - - - - - - - - -FeldeSpato / Feldspar - - - - - - - - - -nitratoS / nitrates - - - - - - - - - -ÓXido de hierro / iron oxide - - - - - - - - - -piroFilita / pyrophyllite - - - - - - - - - -pUMiCita / pumicite - - - - - - - - - -reCUrSoS SilÍCeoS / Silica ores 49.528 62.220 131.665 146.318 94.340 115.119 133.832 142.424 108.613 23.425 CUarZo / Quartz - - - - - - - - - - arena SilÍCea / Silica Sand 49.528 62.220 131.665 146.318 94.340 115.119 133.832 142.424 108.613 23.425roCaS FoSFÓriCaS / phosphate rocks 0 0 0 0 0 0 0 0 0 0 apatita / apatite - - - - - - - - - - FoSForita / phosphorite - - - - - - - - - - GUano / Guano - - - - - - - - - -roCaS de ornaMentaCiÓn / ornamentals rocks 0 0 0 0 0 0 0 0 0 0 lapiSlÁZUli / lapis lazuli - - - - - - - - - - MÁrMol / Marble - - - - - - - - - - traVertino / travertine - - - - - - - - - -SUlFato de Cobre / Copper Sulfate - - - - - - - - - -SUlFato de Sodio / Sodium Sulfate - - - - - - - - - -talCo / talc - - - - - - - - - -tUrba / peat - - - - - - - - - -WollaStonita / Wollastonite - - - - - - - - - -YeSo / Gypsum - - - - - - - - - -Yodo / iodine - - - - - - - - - -Zeolita / Zeolite - - - - - - - - - -
iii. coMbustibles / Fuels CarbÓn (tM netas) / Coal (Mt, net) 123.320 129.940 136.500 140.190 138.056 98.673 184.122 212.375 118.305 106.018petrÓleo CrUdo (Metros cúbicos) / Crude oil (CbM) - - - - - - - - - -GaS natUral (Millones metros cúbicos) / natural gas (Mn CbM) - - - - - - - - - - (1) Cifras de producción de cobre elaboradas por SernaGeoMin. estas difieren con las de la Comisión Chilena del Cobre en la parte de compras a terceros no procesadas por enaMi. / as determined by SernaGeoMin. third-party purchases not processed by enaMi differ from those determined by the Chilean Copper Commission. (2) a partir de su anuario del año 2005, SernaGeoMin realiza esta nueva presentación de las cifras de la minería no metálica. / industrial mineral production format introduced with the 2005 SernaGeoMin Yearbook. Fuente / Source: Servicio nacional de Geología y Minería / national Geology and Mining Service.
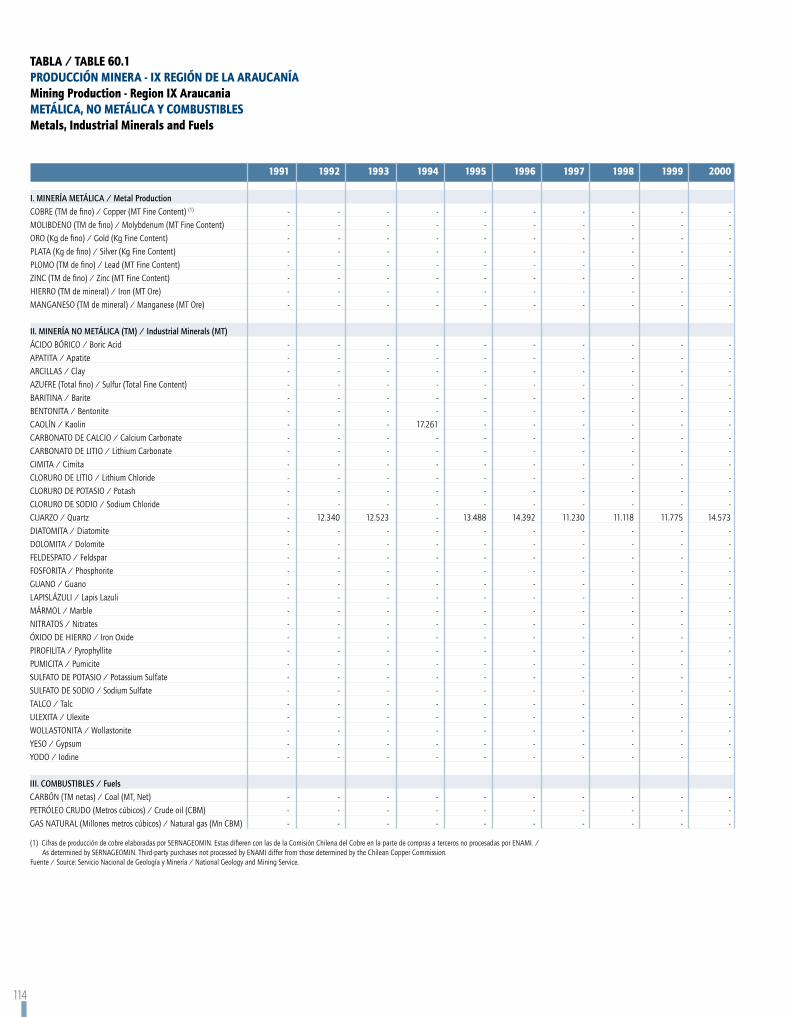
114
TABLA / TABLE 60.1PRODUCCIÓN MINERA - IX REGIÓN DE LA ARAUCANÍA Mining Production - Region IX AraucaniaMETÁLICA, NO METÁLICA Y COMBUSTIBLES Metals, Industrial Minerals and Fuels
1991 1992 1993 1994 1995 1996 1997 1998 1999 2000
i. MineríA MetÁlicA / Metal Production Cobre (tM de fino) / Copper (Mt Fine Content) (1) - - - - - - - - - -
Molibdeno (tM de fino) / Molybdenum (Mt Fine Content) - - - - - - - - - -
oro (kg de fino) / Gold (kg Fine Content) - - - - - - - - - -
plata (kg de fino) / Silver (kg Fine Content) - - - - - - - - - -
ploMo (tM de fino) / lead (Mt Fine Content) - - - - - - - - - -
ZinC (tM de fino) / Zinc (Mt Fine Content) - - - - - - - - - -
hierro (tM de mineral) / iron (Mt ore) - - - - - - - - - -
ManGaneSo (tM de mineral) / Manganese (Mt ore) - - - - - - - - - -
ii. MineríA no MetÁlicA (tM) / industrial Minerals (Mt) ÁCido bÓriCo / boric acid - - - - - - - - - -
apatita / apatite - - - - - - - - - -
arCillaS / Clay - - - - - - - - - -
aZUFre (total fino) / Sulfur (total Fine Content) - - - - - - - - - -
baritina / barite - - - - - - - - - -
bentonita / bentonite - - - - - - - - - -
CaolÍn / kaolin - - - 17.261 - - - - - -
Carbonato de CalCio / Calcium Carbonate - - - - - - - - - -
Carbonato de litio / lithium Carbonate - - - - - - - - - -
CiMita / Cimita - - - - - - - - - -
ClorUro de litio / lithium Chloride - - - - - - - - - -
ClorUro de potaSio / potash - - - - - - - - - -
ClorUro de Sodio / Sodium Chloride - - - - - - - - - -
CUarZo / Quartz - 12.340 12.523 - 13.488 14.392 11.230 11.118 11.775 14.573
diatoMita / diatomite - - - - - - - - - -
doloMita / dolomite - - - - - - - - - -
FeldeSpato / Feldspar - - - - - - - - - -
FoSForita / phosphorite - - - - - - - - - -
GUano / Guano - - - - - - - - - -
lapiSlÁZUli / lapis lazuli - - - - - - - - - -
MÁrMol / Marble - - - - - - - - - -
nitratoS / nitrates - - - - - - - - - -
ÓXido de hierro / iron oxide - - - - - - - - - -
piroFilita / pyrophyllite - - - - - - - - - -
pUMiCita / pumicite - - - - - - - - - -
SUlFato de potaSio / potassium Sulfate - - - - - - - - - -
SUlFato de Sodio / Sodium Sulfate - - - - - - - - - -
talCo / talc - - - - - - - - - -
UleXita / Ulexite - - - - - - - - - -
WollaStonita / Wollastonite - - - - - - - - - -
YeSo / Gypsum - - - - - - - - - -
Yodo / iodine - - - - - - - - - -
iii. coMbustibles / Fuels CarbÓn (tM netas) / Coal (Mt, net) - - - - - - - - - -
petrÓleo CrUdo (Metros cúbicos) / Crude oil (CbM) - - - - - - - - - -
GaS natUral (Millones metros cúbicos) / natural gas (Mn CbM) - - - - - - - - - - (1) Cifras de producción de cobre elaboradas por SernaGeoMin. estas difieren con las de la Comisión Chilena del Cobre en la parte de compras a terceros no procesadas por enaMi. / as determined by SernaGeoMin. third-party purchases not processed by enaMi differ from those determined by the Chilean Copper Commission. Fuente / Source: Servicio nacional de Geología y Minería / national Geology and Mining Service.

115
TABLA / TABLE 60.2 PRODUCCIÓN MINERA - IX REGIÓN DE LA ARAUCANÍA Mining Production - Region IX AraucaniaMETÁLICA, NO METÁLICA Y COMBUSTIBLES Metals, Industrial Minerals and Fuels
2001 2002 2003 2004 2005 2006 2007 2008 2009 2010
i. MineríA MetÁlicA / Metal Production Cobre (tM de fino) / Copper (Mt Fine Content) (1) - - - - - - - - - -Molibdeno (tM de fino) / Molybdenum (Mt Fine Content) - - - - - - - - - -oro (kg de fino) / Gold (kg Fine Content) - - - - - - - - - -plata (kg de fino) / Silver (kg Fine Content) - - - - - - - - - -ploMo (tM de fino) / lead (Mt Fine Content) - - - - - - - - - -ZinC (tM de fino) / Zinc (Mt Fine Content) - - - - - - - - - -hierro (Miles de tM de mineral) / iron (kMt ore) - - - - - - - - - -ManGaneSo (tM de mineral) / Manganese (Mt ore) - - - - - - - - - - ii. MineríA no MetÁlicA (tM) / industrial Minerals (Mt) (2) arCillaS / Clay 0 3.200 5.165 700 5.200 2.200 6.682 6.396 2.946 1.986 arCilla baUXÍtiCa / bauxitic Clay - - - - - - - - - - arCilla CoMÚn / Common Clay - - - - - - - - - - arCilla plÁStiCa / plastic Clay - 3.200 5.165 - 5.200 2.200 6.682 6.396 2.946 1.986 bentonita / bentonite - - - - - - - - - - CaolÍn / kaolin - - - 700 - - - - - -baritina / barite - - - - - - - - - -Carbonato de CalCio / Calcium Carbonate 0 0 0 0 0 0 0 0 0 0 CaliZa / limestone - - - - - - - - - - CoQUina / Coquina - - - - - - - - - - Carbonato de CalCio blanCo / White Calcium Carbonate - - - - - - - - - -ClorUro de Sodio / Sodium Chloride - - - - - - - - - -CoMpUeStoS de boro / boron Compounds 0 0 0 0 0 0 0 0 0 0 UleXita / Ulexite - - - - - - - - - - ÁCido bÓriCo / boric acid - - - - - - - - - -CoMpUeStoS de litio / lithium Compounds 0 0 0 0 0 0 0 0 0 0 Carbonato de litio / lithium Carbonate - - - - - - - - - - ClorUro de litio / lithium Chloride - - - - - - - - - - hidrÓXido de litio / lithium hydroxide - - - - - - - - - -CoMpUeStoS de potaSio / potassium Compounds 0 0 0 0 0 0 0 0 0 0 ClorUro de potaSio / potash - - - - - - - - - - SUlFato de potaSio / potassium Sulfate - - - - - - - - - -diatoMita / diatomite - - - - - - - - - -doloMita / dolomite - - - - - - - - - -FeldeSpato / Feldspar - - - - - - - - - -nitratoS / nitrates - - - - - - - - - -ÓXido de hierro / iron oxide - - - - - - - - - -piroFilita / pyrophyllite - - - - - - - - - -pUMiCita / pumicite - - - - - - - - - -reCUrSoS SilÍCeoS / Silica ores 13.370 4.523 0 0 0 0 0 0 0 0 CUarZo / Quartz 13.370 4.523 0 0 0 0 0 0 0 0 arena SilÍCea / Silica Sand - - - - - - - - - -roCaS FoSFÓriCaS / phosphate rocks 0 0 0 0 0 0 0 0 0 0 apatita / apatite - - - - - - - - - - FoSForita / phosphorite - - - - - - - - - - GUano / Guano - - - - - - - - - -roCaS de ornaMentaCiÓn / ornamentals rocks 0 0 0 0 0 0 0 0 0 0 lapiSlÁZUli / lapis lazuli - - - - - - - - - - MÁrMol / Marble - - - - - - - - - - traVertino / travertine - - - - - - - - - -SUlFato de Cobre / Copper Sulfate - - - - - - - - - -SUlFato de Sodio / Sodium Sulfate - - - - - - - - - -talCo / talc - - - - - - - - - -tUrba / peat - - - - - - - - - -WollaStonita / Wollastonite - - - - - - - - - -YeSo / Gypsum - - - - - - - - - -Yodo / iodine - - - - - - - - - -Zeolita / Zeolite - - - - - - - - - -
iii. coMbustibles / Fuels CarbÓn (tM netas) / Coal (Mt, net) - - - - - - - - - -petrÓleo CrUdo (Metros cúbicos) / Crude oil (CbM) - - - - - - - - - -GaS natUral (Millones metros cúbicos) / natural gas (Mn CbM) - - - - - - - - - -
(1) Cifras de producción de cobre elaboradas por SernaGeoMin. estas difieren con las de la Comisión Chilena del Cobre en la parte de compras a terceros no procesadas por enaMi. / as determined by SernaGeoMin. third-party purchases not processed by enaMi differ from those determined by the Chilean Copper Commission.(2) a partir de su anuario del año 2005, SernaGeoMin realiza esta nueva presentación de las cifras de la minería no metálica. / industrial mineral production format introduced with the 2005 SernaGeoMin Yearbook. Fuente / Source: Servicio nacional de Geología y Minería / national Geology and Mining Service.
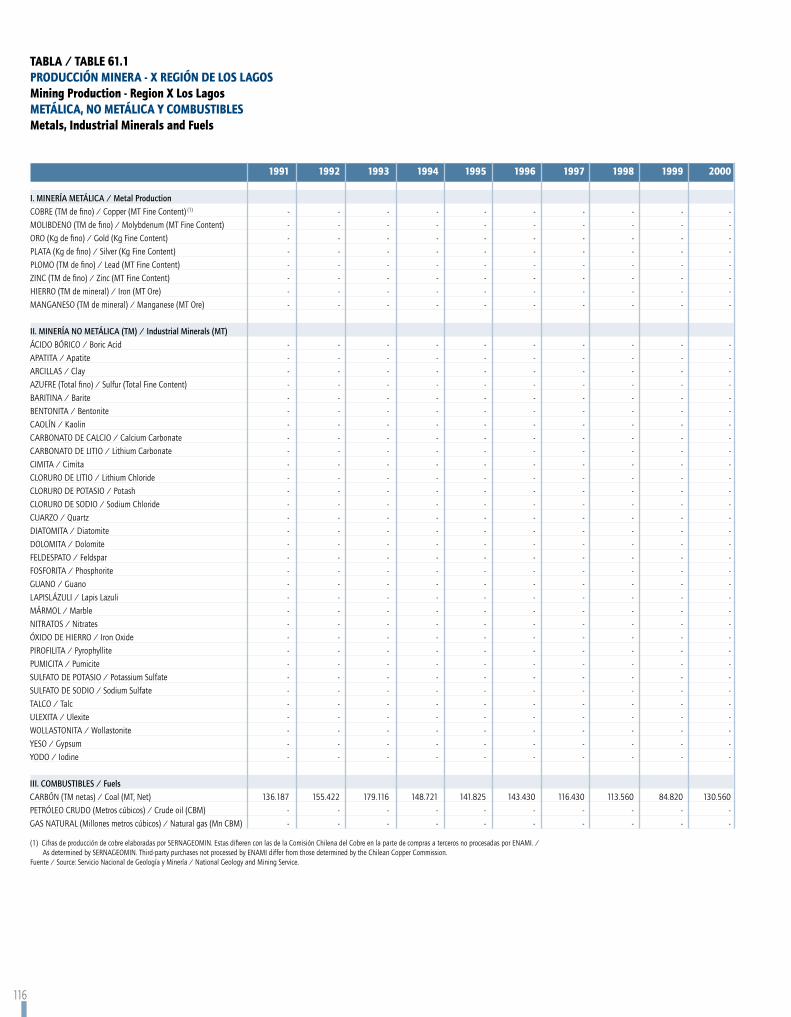
116
TABLA / TABLE 61.1 PRODUCCIÓN MINERA - X REGIÓN DE LOS LAGOSMining Production - Region X Los LagosMETÁLICA, NO METÁLICA Y COMBUSTIBLES Metals, Industrial Minerals and Fuels
1991 1992 1993 1994 1995 1996 1997 1998 1999 2000
i. MineríA MetÁlicA / Metal Production Cobre (tM de fino) / Copper (Mt Fine Content) (1) - - - - - - - - - -
Molibdeno (tM de fino) / Molybdenum (Mt Fine Content) - - - - - - - - - -
oro (kg de fino) / Gold (kg Fine Content) - - - - - - - - - -
plata (kg de fino) / Silver (kg Fine Content) - - - - - - - - - -
ploMo (tM de fino) / lead (Mt Fine Content) - - - - - - - - - -
ZinC (tM de fino) / Zinc (Mt Fine Content) - - - - - - - - - -
hierro (tM de mineral) / iron (Mt ore) - - - - - - - - - -
ManGaneSo (tM de mineral) / Manganese (Mt ore) - - - - - - - - - -
ii. MineríA no MetÁlicA (tM) / industrial Minerals (Mt) ÁCido bÓriCo / boric acid - - - - - - - - - -
apatita / apatite - - - - - - - - - -
arCillaS / Clay - - - - - - - - - -
aZUFre (total fino) / Sulfur (total Fine Content) - - - - - - - - - -
baritina / barite - - - - - - - - - -
bentonita / bentonite - - - - - - - - - -
CaolÍn / kaolin - - - - - - - - - -
Carbonato de CalCio / Calcium Carbonate - - - - - - - - - -
Carbonato de litio / lithium Carbonate - - - - - - - - - -
CiMita / Cimita - - - - - - - - - -
ClorUro de litio / lithium Chloride - - - - - - - - - -
ClorUro de potaSio / potash - - - - - - - - - -
ClorUro de Sodio / Sodium Chloride - - - - - - - - - -
CUarZo / Quartz - - - - - - - - - -
diatoMita / diatomite - - - - - - - - - -
doloMita / dolomite - - - - - - - - - -
FeldeSpato / Feldspar - - - - - - - - - -
FoSForita / phosphorite - - - - - - - - - -
GUano / Guano - - - - - - - - - -
lapiSlÁZUli / lapis lazuli - - - - - - - - - -
MÁrMol / Marble - - - - - - - - - -
nitratoS / nitrates - - - - - - - - - -
ÓXido de hierro / iron oxide - - - - - - - - - -
piroFilita / pyrophyllite - - - - - - - - - -
pUMiCita / pumicite - - - - - - - - - -
SUlFato de potaSio / potassium Sulfate - - - - - - - - - -
SUlFato de Sodio / Sodium Sulfate - - - - - - - - - -
talCo / talc - - - - - - - - - -
UleXita / Ulexite - - - - - - - - - -
WollaStonita / Wollastonite - - - - - - - - - -
YeSo / Gypsum - - - - - - - - - -
Yodo / iodine - - - - - - - - - -
iii. coMbustibles / Fuels CarbÓn (tM netas) / Coal (Mt, net) 136.187 155.422 179.116 148.721 141.825 143.430 116.430 113.560 84.820 130.560
petrÓleo CrUdo (Metros cúbicos) / Crude oil (CbM) - - - - - - - - - -
GaS natUral (Millones metros cúbicos) / natural gas (Mn CbM) - - - - - - - - - - (1) Cifras de producción de cobre elaboradas por SernaGeoMin. estas difieren con las de la Comisión Chilena del Cobre en la parte de compras a terceros no procesadas por enaMi. / as determined by SernaGeoMin. third-party purchases not processed by enaMi differ from those determined by the Chilean Copper Commission.Fuente / Source: Servicio nacional de Geología y Minería / national Geology and Mining Service.
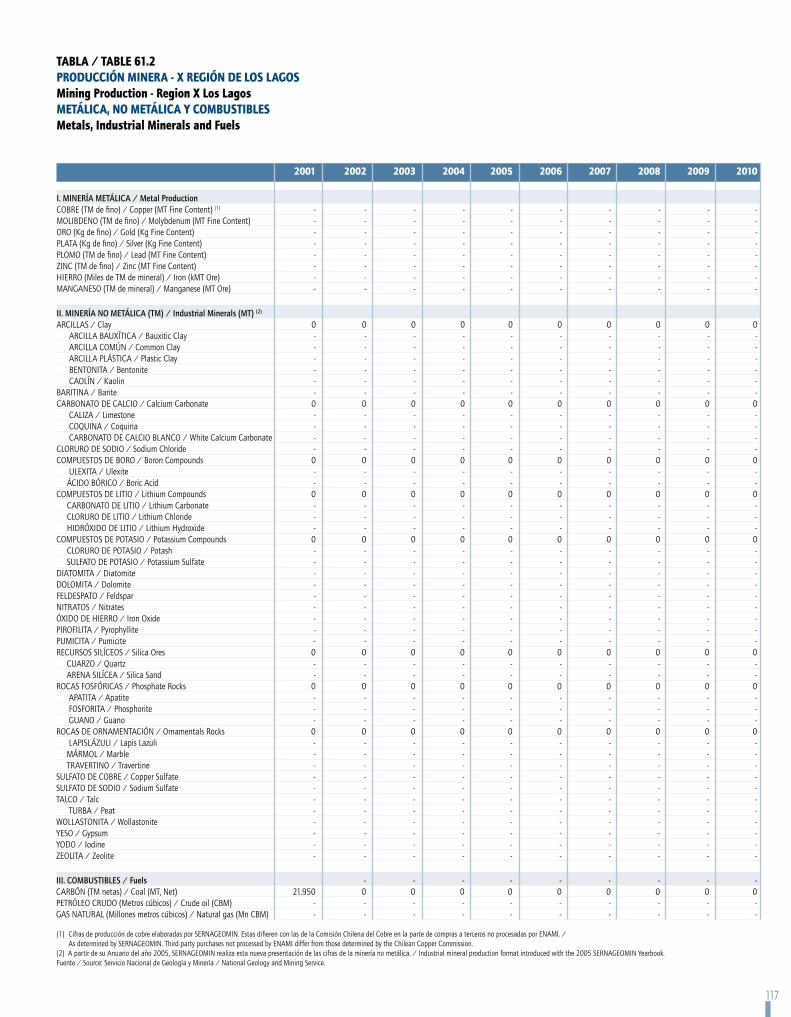
117
TABLA / TABLE 61.2PRODUCCIÓN MINERA - X REGIÓN DE LOS LAGOSMining Production - Region X Los LagosMETÁLICA, NO METÁLICA Y COMBUSTIBLES Metals, Industrial Minerals and Fuels
2001 2002 2003 2004 2005 2006 2007 2008 2009 2010
i. MineríA MetÁlicA / Metal Production Cobre (tM de fino) / Copper (Mt Fine Content) (1) - - - - - - - - - -Molibdeno (tM de fino) / Molybdenum (Mt Fine Content) - - - - - - - - - -oro (kg de fino) / Gold (kg Fine Content) - - - - - - - - - -plata (kg de fino) / Silver (kg Fine Content) - - - - - - - - - -ploMo (tM de fino) / lead (Mt Fine Content) - - - - - - - - - -ZinC (tM de fino) / Zinc (Mt Fine Content) - - - - - - - - - -hierro (Miles de tM de mineral) / iron (kMt ore) - - - - - - - - - -ManGaneSo (tM de mineral) / Manganese (Mt ore) - - - - - - - - - -
ii. MineríA no MetÁlicA (tM) / industrial Minerals (Mt) (2) arCillaS / Clay 0 0 0 0 0 0 0 0 0 0 arCilla baUXÍtiCa / bauxitic Clay - - - - - - - - - - arCilla CoMÚn / Common Clay - - - - - - - - - - arCilla plÁStiCa / plastic Clay - - - - - - - - - - bentonita / bentonite - - - - - - - - - - CaolÍn / kaolin - - - - - - - - - -baritina / barite - - - - - - - - - -Carbonato de CalCio / Calcium Carbonate 0 0 0 0 0 0 0 0 0 0 CaliZa / limestone - - - - - - - - - - CoQUina / Coquina - - - - - - - - - - Carbonato de CalCio blanCo / White Calcium Carbonate - - - - - - - - - -ClorUro de Sodio / Sodium Chloride - - - - - - - - - -CoMpUeStoS de boro / boron Compounds 0 0 0 0 0 0 0 0 0 0 UleXita / Ulexite - - - - - - - - - - ÁCido bÓriCo / boric acid - - - - - - - - - -CoMpUeStoS de litio / lithium Compounds 0 0 0 0 0 0 0 0 0 0 Carbonato de litio / lithium Carbonate - - - - - - - - - - ClorUro de litio / lithium Chloride - - - - - - - - - - hidrÓXido de litio / lithium hydroxide - - - - - - - - - -CoMpUeStoS de potaSio / potassium Compounds 0 0 0 0 0 0 0 0 0 0 ClorUro de potaSio / potash - - - - - - - - - - SUlFato de potaSio / potassium Sulfate - - - - - - - - - -diatoMita / diatomite - - - - - - - - - -doloMita / dolomite - - - - - - - - - -FeldeSpato / Feldspar - - - - - - - - - -nitratoS / nitrates - - - - - - - - - -ÓXido de hierro / iron oxide - - - - - - - - - -piroFilita / pyrophyllite - - - - - - - - - -pUMiCita / pumicite - - - - - - - - - -reCUrSoS SilÍCeoS / Silica ores 0 0 0 0 0 0 0 0 0 0 CUarZo / Quartz - - - - - - - - - - arena SilÍCea / Silica Sand - - - - - - - - - -roCaS FoSFÓriCaS / phosphate rocks 0 0 0 0 0 0 0 0 0 0 apatita / apatite - - - - - - - - - - FoSForita / phosphorite - - - - - - - - - - GUano / Guano - - - - - - - - - -roCaS de ornaMentaCiÓn / ornamentals rocks 0 0 0 0 0 0 0 0 0 0 lapiSlÁZUli / lapis lazuli - - - - - - - - - - MÁrMol / Marble - - - - - - - - - - traVertino / travertine - - - - - - - - - -SUlFato de Cobre / Copper Sulfate - - - - - - - - - -SUlFato de Sodio / Sodium Sulfate - - - - - - - - - -talCo / talc - - - - - - - - - - tUrba / peat - - - - - - - - - -WollaStonita / Wollastonite - - - - - - - - - -YeSo / Gypsum - - - - - - - - - -Yodo / iodine - - - - - - - - - -Zeolita / Zeolite - - - - - - - - - -
iii. coMbustibles / Fuels - - - - - - - - - CarbÓn (tM netas) / Coal (Mt, net) 21.950 0 0 0 0 0 0 0 0 0petrÓleo CrUdo (Metros cúbicos) / Crude oil (CbM) - - - - - - - - - -GaS natUral (Millones metros cúbicos) / natural gas (Mn CbM) - - - - - - - - - - (1) Cifras de producción de cobre elaboradas por SernaGeoMin. estas difieren con las de la Comisión Chilena del Cobre en la parte de compras a terceros no procesadas por enaMi. / as determined by SernaGeoMin. third-party purchases not processed by enaMi differ from those determined by the Chilean Copper Commission. (2) a partir de su anuario del año 2005, SernaGeoMin realiza esta nueva presentación de las cifras de la minería no metálica. / industrial mineral production format introduced with the 2005 SernaGeoMin Yearbook. Fuente / Source: Servicio nacional de Geología y Minería / national Geology and Mining Service.
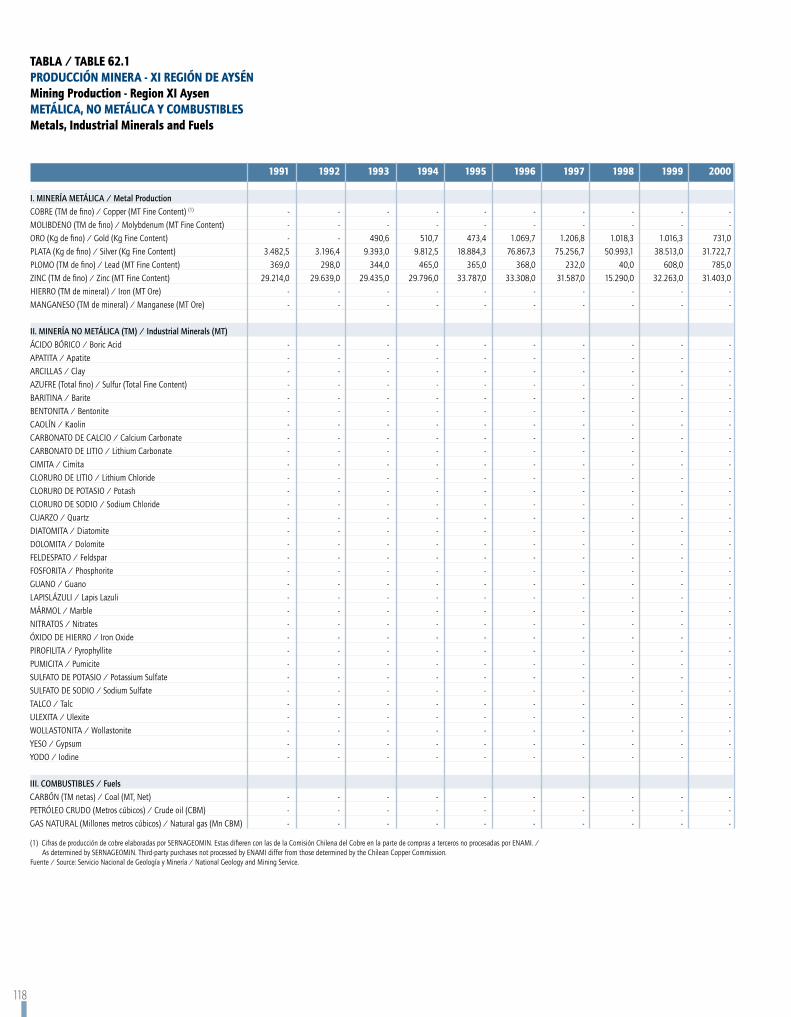
118
TABLA / TABLE 62.1PRODUCCIÓN MINERA - XI REGIÓN DE AYSÉNMining Production - Region XI AysenMETÁLICA, NO METÁLICA Y COMBUSTIBLESMetals, Industrial Minerals and Fuels
1991 1992 1993 1994 1995 1996 1997 1998 1999 2000
i. MineríA MetÁlicA / Metal Production Cobre (tM de fino) / Copper (Mt Fine Content) (1) - - - - - - - - - -
Molibdeno (tM de fino) / Molybdenum (Mt Fine Content) - - - - - - - - - -
oro (kg de fino) / Gold (kg Fine Content) - - 490,6 510,7 473,4 1.069,7 1.206,8 1.018,3 1.016,3 731,0
plata (kg de fino) / Silver (kg Fine Content) 3.482,5 3.196,4 9.393,0 9.812,5 18.884,3 76.867,3 75.256,7 50.993,1 38.513,0 31.722,7
ploMo (tM de fino) / lead (Mt Fine Content) 369,0 298,0 344,0 465,0 365,0 368,0 232,0 40,0 608,0 785,0
ZinC (tM de fino) / Zinc (Mt Fine Content) 29.214,0 29.639,0 29.435,0 29.796,0 33.787,0 33.308,0 31.587,0 15.290,0 32.263,0 31.403,0
hierro (tM de mineral) / iron (Mt ore) - - - - - - - - - -
ManGaneSo (tM de mineral) / Manganese (Mt ore) - - - - - - - - - -
ii. MineríA no MetÁlicA (tM) / industrial Minerals (Mt) ÁCido bÓriCo / boric acid - - - - - - - - - -
apatita / apatite - - - - - - - - - -
arCillaS / Clay - - - - - - - - - -
aZUFre (total fino) / Sulfur (total Fine Content) - - - - - - - - - -
baritina / barite - - - - - - - - - -
bentonita / bentonite - - - - - - - - - -
CaolÍn / kaolin - - - - - - - - - -
Carbonato de CalCio / Calcium Carbonate - - - - - - - - - -
Carbonato de litio / lithium Carbonate - - - - - - - - - -
CiMita / Cimita - - - - - - - - - -
ClorUro de litio / lithium Chloride - - - - - - - - - -
ClorUro de potaSio / potash - - - - - - - - - -
ClorUro de Sodio / Sodium Chloride - - - - - - - - - -
CUarZo / Quartz - - - - - - - - - -
diatoMita / diatomite - - - - - - - - - -
doloMita / dolomite - - - - - - - - - -
FeldeSpato / Feldspar - - - - - - - - - -
FoSForita / phosphorite - - - - - - - - - -
GUano / Guano - - - - - - - - - -
lapiSlÁZUli / lapis lazuli - - - - - - - - - -
MÁrMol / Marble - - - - - - - - - -
nitratoS / nitrates - - - - - - - - - -
ÓXido de hierro / iron oxide - - - - - - - - - -
piroFilita / pyrophyllite - - - - - - - - - -
pUMiCita / pumicite - - - - - - - - - -
SUlFato de potaSio / potassium Sulfate - - - - - - - - - -
SUlFato de Sodio / Sodium Sulfate - - - - - - - - - -
talCo / talc - - - - - - - - - -
UleXita / Ulexite - - - - - - - - - -
WollaStonita / Wollastonite - - - - - - - - - -
YeSo / Gypsum - - - - - - - - - -
Yodo / iodine - - - - - - - - - -
iii. coMbustibles / Fuels CarbÓn (tM netas) / Coal (Mt, net) - - - - - - - - - -
petrÓleo CrUdo (Metros cúbicos) / Crude oil (CbM) - - - - - - - - - -
GaS natUral (Millones metros cúbicos) / natural gas (Mn CbM) - - - - - - - - - -
(1) Cifras de producción de cobre elaboradas por SernaGeoMin. estas difieren con las de la Comisión Chilena del Cobre en la parte de compras a terceros no procesadas por enaMi. / as determined by SernaGeoMin. third-party purchases not processed by enaMi differ from those determined by the Chilean Copper Commission. Fuente / Source: Servicio nacional de Geología y Minería / national Geology and Mining Service.
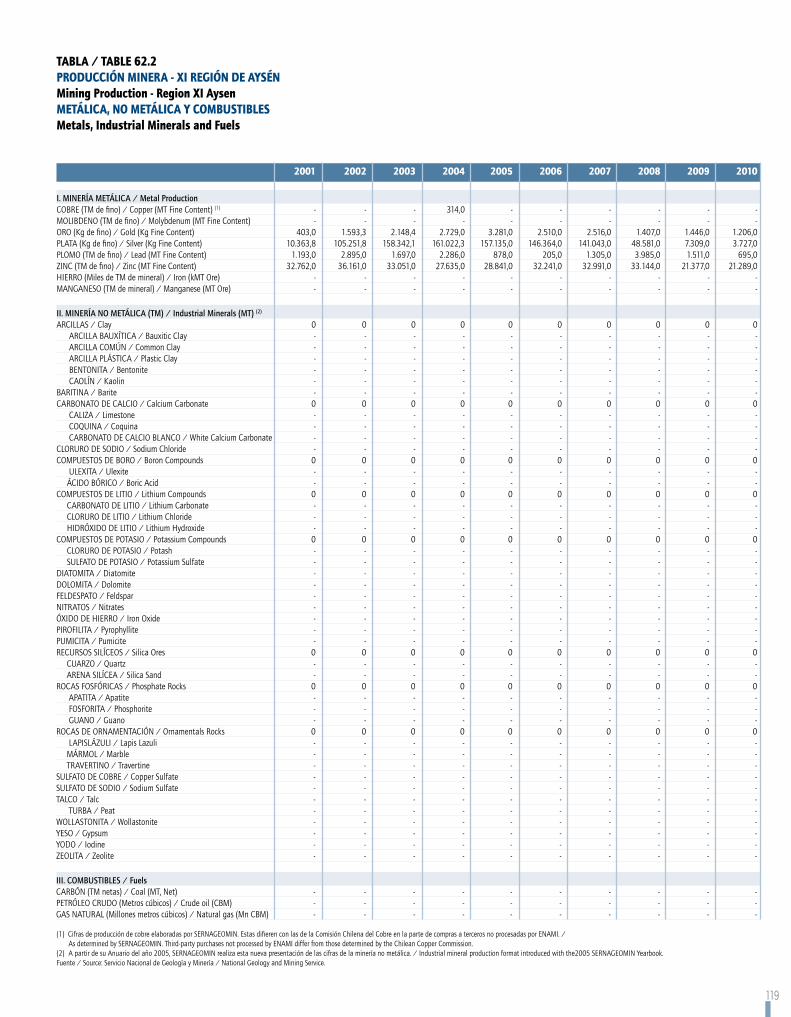
119
TABLA / TABLE 62.2PRODUCCIÓN MINERA - XI REGIÓN DE AYSÉNMining Production - Region XI AysenMETÁLICA, NO METÁLICA Y COMBUSTIBLESMetals, Industrial Minerals and Fuels
2001 2002 2003 2004 2005 2006 2007 2008 2009 2010
i. MineríA MetÁlicA / Metal Production Cobre (tM de fino) / Copper (Mt Fine Content) (1) - - - 314,0 - - - - - -Molibdeno (tM de fino) / Molybdenum (Mt Fine Content) - - - - - - - - - -oro (kg de fino) / Gold (kg Fine Content) 403,0 1.593,3 2.148,4 2.729,0 3.281,0 2.510,0 2.516,0 1.407,0 1.446,0 1.206,0plata (kg de fino) / Silver (kg Fine Content) 10.363,8 105.251,8 158.342,1 161.022,3 157.135,0 146.364,0 141.043,0 48.581,0 7.309,0 3.727,0ploMo (tM de fino) / lead (Mt Fine Content) 1.193,0 2.895,0 1.697,0 2.286,0 878,0 205,0 1.305,0 3.985,0 1.511,0 695,0ZinC (tM de fino) / Zinc (Mt Fine Content) 32.762,0 36.161,0 33.051,0 27.635,0 28.841,0 32.241,0 32.991,0 33.144,0 21.377,0 21.289,0hierro (Miles de tM de mineral) / iron (kMt ore) - - - - - - - - - -ManGaneSo (tM de mineral) / Manganese (Mt ore) - - - - - - - - - -
ii. MineríA no MetÁlicA (tM) / industrial Minerals (Mt) (2) arCillaS / Clay 0 0 0 0 0 0 0 0 0 0 arCilla baUXÍtiCa / bauxitic Clay - - - - - - - - - - arCilla CoMÚn / Common Clay - - - - - - - - - - arCilla plÁStiCa / plastic Clay - - - - - - - - - - bentonita / bentonite - - - - - - - - - - CaolÍn / kaolin - - - - - - - - - -baritina / barite - - - - - - - - - -Carbonato de CalCio / Calcium Carbonate 0 0 0 0 0 0 0 0 0 0 CaliZa / limestone - - - - - - - - - - CoQUina / Coquina - - - - - - - - - - Carbonato de CalCio blanCo / White Calcium Carbonate - - - - - - - - - -ClorUro de Sodio / Sodium Chloride - - - - - - - - - -CoMpUeStoS de boro / boron Compounds 0 0 0 0 0 0 0 0 0 0 UleXita / Ulexite - - - - - - - - - - ÁCido bÓriCo / boric acid - - - - - - - - - -CoMpUeStoS de litio / lithium Compounds 0 0 0 0 0 0 0 0 0 0 Carbonato de litio / lithium Carbonate - - - - - - - - - - ClorUro de litio / lithium Chloride - - - - - - - - - - hidrÓXido de litio / lithium hydroxide - - - - - - - - - -CoMpUeStoS de potaSio / potassium Compounds 0 0 0 0 0 0 0 0 0 0 ClorUro de potaSio / potash - - - - - - - - - - SUlFato de potaSio / potassium Sulfate - - - - - - - - - -diatoMita / diatomite - - - - - - - - - -doloMita / dolomite - - - - - - - - - -FeldeSpato / Feldspar - - - - - - - - - -nitratoS / nitrates - - - - - - - - - -ÓXido de hierro / iron oxide - - - - - - - - - -piroFilita / pyrophyllite - - - - - - - - - -pUMiCita / pumicite - - - - - - - - - -reCUrSoS SilÍCeoS / Silica ores 0 0 0 0 0 0 0 0 0 0 CUarZo / Quartz - - - - - - - - - - arena SilÍCea / Silica Sand - - - - - - - - - -roCaS FoSFÓriCaS / phosphate rocks 0 0 0 0 0 0 0 0 0 0 apatita / apatite - - - - - - - - - - FoSForita / phosphorite - - - - - - - - - - GUano / Guano - - - - - - - - - -roCaS de ornaMentaCiÓn / ornamentals rocks 0 0 0 0 0 0 0 0 0 0 lapiSlÁZUli / lapis lazuli - - - - - - - - - - MÁrMol / Marble - - - - - - - - - - traVertino / travertine - - - - - - - - - -SUlFato de Cobre / Copper Sulfate - - - - - - - - - -SUlFato de Sodio / Sodium Sulfate - - - - - - - - - -talCo / talc - - - - - - - - - - tUrba / peat - - - - - - - - - -WollaStonita / Wollastonite - - - - - - - - - -YeSo / Gypsum - - - - - - - - - -Yodo / iodine - - - - - - - - - -Zeolita / Zeolite - - - - - - - - - -
iii. coMbustibles / Fuels CarbÓn (tM netas) / Coal (Mt, net) - - - - - - - - - -petrÓleo CrUdo (Metros cúbicos) / Crude oil (CbM) - - - - - - - - - -GaS natUral (Millones metros cúbicos) / natural gas (Mn CbM) - - - - - - - - - -
(1) Cifras de producción de cobre elaboradas por SernaGeoMin. estas difieren con las de la Comisión Chilena del Cobre en la parte de compras a terceros no procesadas por enaMi. / as determined by SernaGeoMin. third-party purchases not processed by enaMi differ from those determined by the Chilean Copper Commission.(2) a partir de su anuario del año 2005, SernaGeoMin realiza esta nueva presentación de las cifras de la minería no metálica. / industrial mineral production format introduced with the2005 SernaGeoMin Yearbook. Fuente / Source: Servicio nacional de Geología y Minería / national Geology and Mining Service.
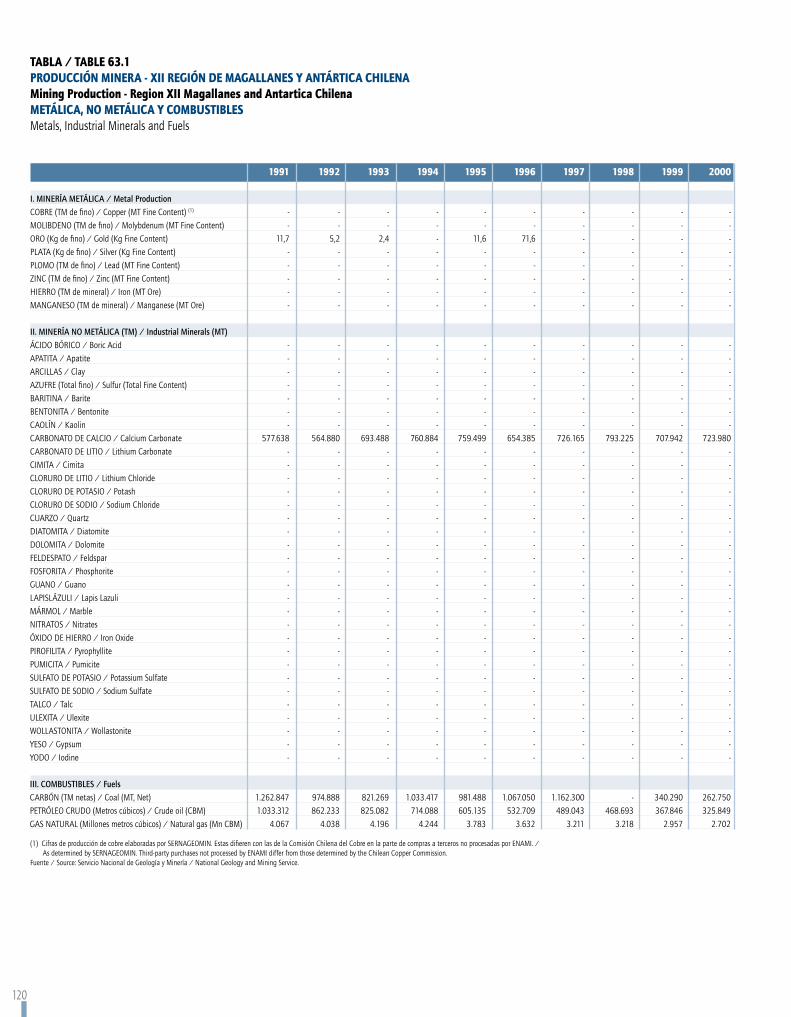
120
TABLA / TABLE 63.1 PRODUCCIÓN MINERA - XII REGIÓN DE MAGALLANES Y ANTÁRTICA CHILENA Mining Production - Region XII Magallanes and Antartica ChilenaMETÁLICA, NO METÁLICA Y COMBUSTIBLES Metals, industrial Minerals and Fuels
1991 1992 1993 1994 1995 1996 1997 1998 1999 2000
i. MineríA MetÁlicA / Metal Production Cobre (tM de fino) / Copper (Mt Fine Content) (1) - - - - - - - - - -
Molibdeno (tM de fino) / Molybdenum (Mt Fine Content) - - - - - - - - - -
oro (kg de fino) / Gold (kg Fine Content) 11,7 5,2 2,4 - 11,6 71,6 - - - -
plata (kg de fino) / Silver (kg Fine Content) - - - - - - - - - -
ploMo (tM de fino) / lead (Mt Fine Content) - - - - - - - - - -
ZinC (tM de fino) / Zinc (Mt Fine Content) - - - - - - - - - -
hierro (tM de mineral) / iron (Mt ore) - - - - - - - - - -
ManGaneSo (tM de mineral) / Manganese (Mt ore) - - - - - - - - - -
ii. MineríA no MetÁlicA (tM) / industrial Minerals (Mt) ÁCido bÓriCo / boric acid - - - - - - - - - -
apatita / apatite - - - - - - - - - -
arCillaS / Clay - - - - - - - - - -
aZUFre (total fino) / Sulfur (total Fine Content) - - - - - - - - - -
baritina / barite - - - - - - - - - -
bentonita / bentonite - - - - - - - - - -
CaolÍn / kaolin - - - - - - - - - -
Carbonato de CalCio / Calcium Carbonate 577.638 564.880 693.488 760.884 759.499 654.385 726.165 793.225 707.942 723.980
Carbonato de litio / lithium Carbonate - - - - - - - - - -
CiMita / Cimita - - - - - - - - - -
ClorUro de litio / lithium Chloride - - - - - - - - - -
ClorUro de potaSio / potash - - - - - - - - - -
ClorUro de Sodio / Sodium Chloride - - - - - - - - - -
CUarZo / Quartz - - - - - - - - - -
diatoMita / diatomite - - - - - - - - - -
doloMita / dolomite - - - - - - - - - -
FeldeSpato / Feldspar - - - - - - - - - -
FoSForita / phosphorite - - - - - - - - - -
GUano / Guano - - - - - - - - - -
lapiSlÁZUli / lapis lazuli - - - - - - - - - -
MÁrMol / Marble - - - - - - - - - -
nitratoS / nitrates - - - - - - - - - -
ÓXido de hierro / iron oxide - - - - - - - - - -
piroFilita / pyrophyllite - - - - - - - - - -
pUMiCita / pumicite - - - - - - - - - -
SUlFato de potaSio / potassium Sulfate - - - - - - - - - -
SUlFato de Sodio / Sodium Sulfate - - - - - - - - - -
talCo / talc - - - - - - - - - -
UleXita / Ulexite - - - - - - - - - -
WollaStonita / Wollastonite - - - - - - - - - -
YeSo / Gypsum - - - - - - - - - -
Yodo / iodine - - - - - - - - - -
iii. coMbustibles / Fuels CarbÓn (tM netas) / Coal (Mt, net) 1.262.847 974.888 821.269 1.033.417 981.488 1.067.050 1.162.300 - 340.290 262.750
petrÓleo CrUdo (Metros cúbicos) / Crude oil (CbM) 1.033.312 862.233 825.082 714.088 605.135 532.709 489.043 468.693 367.846 325.849
GaS natUral (Millones metros cúbicos) / natural gas (Mn CbM) 4.067 4.038 4.196 4.244 3.783 3.632 3.211 3.218 2.957 2.702 (1) Cifras de producción de cobre elaboradas por SernaGeoMin. estas difieren con las de la Comisión Chilena del Cobre en la parte de compras a terceros no procesadas por enaMi. / as determined by SernaGeoMin. third-party purchases not processed by enaMi differ from those determined by the Chilean Copper Commission. Fuente / Source: Servicio nacional de Geología y Minería / national Geology and Mining Service.
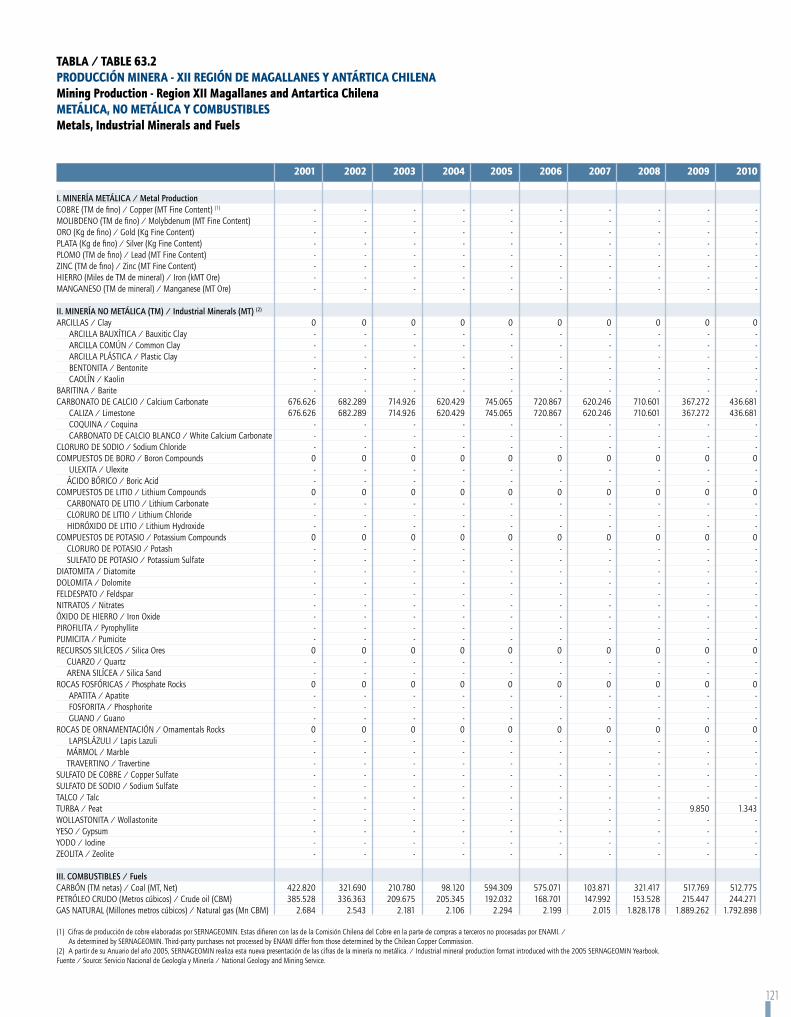
121
TABLA / TABLE 63.2PRODUCCIÓN MINERA - XII REGIÓN DE MAGALLANES Y ANTÁRTICA CHILENA Mining Production - Region XII Magallanes and Antartica ChilenaMETÁLICA, NO METÁLICA Y COMBUSTIBLES Metals, Industrial Minerals and Fuels
2001 2002 2003 2004 2005 2006 2007 2008 2009 2010
i. MineríA MetÁlicA / Metal Production Cobre (tM de fino) / Copper (Mt Fine Content) (1) - - - - - - - - - -Molibdeno (tM de fino) / Molybdenum (Mt Fine Content) - - - - - - - - - -oro (kg de fino) / Gold (kg Fine Content) - - - - - - - - - -plata (kg de fino) / Silver (kg Fine Content) - - - - - - - - - -ploMo (tM de fino) / lead (Mt Fine Content) - - - - - - - - - -ZinC (tM de fino) / Zinc (Mt Fine Content) - - - - - - - - - -hierro (Miles de tM de mineral) / iron (kMt ore) - - - - - - - - - -ManGaneSo (tM de mineral) / Manganese (Mt ore) - - - - - - - - - - ii. MineríA no MetÁlicA (tM) / industrial Minerals (Mt) (2) arCillaS / Clay 0 0 0 0 0 0 0 0 0 0 arCilla baUXÍtiCa / bauxitic Clay - - - - - - - - - - arCilla CoMÚn / Common Clay - - - - - - - - - - arCilla plÁStiCa / plastic Clay - - - - - - - - - - bentonita / bentonite - - - - - - - - - - CaolÍn / kaolin - - - - - - - - - -baritina / barite - - - - - - - - - -Carbonato de CalCio / Calcium Carbonate 676.626 682.289 714.926 620.429 745.065 720.867 620.246 710.601 367.272 436.681 CaliZa / limestone 676.626 682.289 714.926 620.429 745.065 720.867 620.246 710.601 367.272 436.681 CoQUina / Coquina - - - - - - - - - - Carbonato de CalCio blanCo / White Calcium Carbonate - - - - - - - - - -ClorUro de Sodio / Sodium Chloride - - - - - - - - - -CoMpUeStoS de boro / boron Compounds 0 0 0 0 0 0 0 0 0 0 UleXita / Ulexite - - - - - - - - - - ÁCido bÓriCo / boric acid - - - - - - - - - -CoMpUeStoS de litio / lithium Compounds 0 0 0 0 0 0 0 0 0 0 Carbonato de litio / lithium Carbonate - - - - - - - - - - ClorUro de litio / lithium Chloride - - - - - - - - - - hidrÓXido de litio / lithium hydroxide - - - - - - - - - -CoMpUeStoS de potaSio / potassium Compounds 0 0 0 0 0 0 0 0 0 0 ClorUro de potaSio / potash - - - - - - - - - - SUlFato de potaSio / potassium Sulfate - - - - - - - - - -diatoMita / diatomite - - - - - - - - - -doloMita / dolomite - - - - - - - - - -FeldeSpato / Feldspar - - - - - - - - - -nitratoS / nitrates - - - - - - - - - -ÓXido de hierro / iron oxide - - - - - - - - - -piroFilita / pyrophyllite - - - - - - - - - -pUMiCita / pumicite - - - - - - - - - -reCUrSoS SilÍCeoS / Silica ores 0 0 0 0 0 0 0 0 0 0 CUarZo / Quartz - - - - - - - - - - arena SilÍCea / Silica Sand - - - - - - - - - -roCaS FoSFÓriCaS / phosphate rocks 0 0 0 0 0 0 0 0 0 0 apatita / apatite - - - - - - - - - - FoSForita / phosphorite - - - - - - - - - - GUano / Guano - - - - - - - - - -roCaS de ornaMentaCiÓn / ornamentals rocks 0 0 0 0 0 0 0 0 0 0 lapiSlÁZUli / lapis lazuli - - - - - - - - - - MÁrMol / Marble - - - - - - - - - - traVertino / travertine - - - - - - - - - -SUlFato de Cobre / Copper Sulfate - - - - - - - - - -SUlFato de Sodio / Sodium Sulfate - - - - - - - - - -talCo / talc - - - - - - - - - -tUrba / peat - - - - - - - - 9.850 1.343WollaStonita / Wollastonite - - - - - - - - - -YeSo / Gypsum - - - - - - - - - -Yodo / iodine - - - - - - - - - -Zeolita / Zeolite - - - - - - - - - - iii. coMbustibles / Fuels CarbÓn (tM netas) / Coal (Mt, net) 422.820 321.690 210.780 98.120 594.309 575.071 103.871 321.417 517.769 512.775petrÓleo CrUdo (Metros cúbicos) / Crude oil (CbM) 385.528 336.363 209.675 205.345 192.032 168.701 147.992 153.528 215.447 244.271GaS natUral (Millones metros cúbicos) / natural gas (Mn CbM) 2.684 2.543 2.181 2.106 2.294 2.199 2.015 1.828.178 1.889.262 1.792.898 (1) Cifras de producción de cobre elaboradas por SernaGeoMin. estas difieren con las de la Comisión Chilena del Cobre en la parte de compras a terceros no procesadas por enaMi. / as determined by SernaGeoMin. third-party purchases not processed by enaMi differ from those determined by the Chilean Copper Commission.(2) a partir de su anuario del año 2005, SernaGeoMin realiza esta nueva presentación de las cifras de la minería no metálica. / industrial mineral production format introduced with the 2005 SernaGeoMin Yearbook. Fuente / Source: Servicio nacional de Geología y Minería / national Geology and Mining Service.
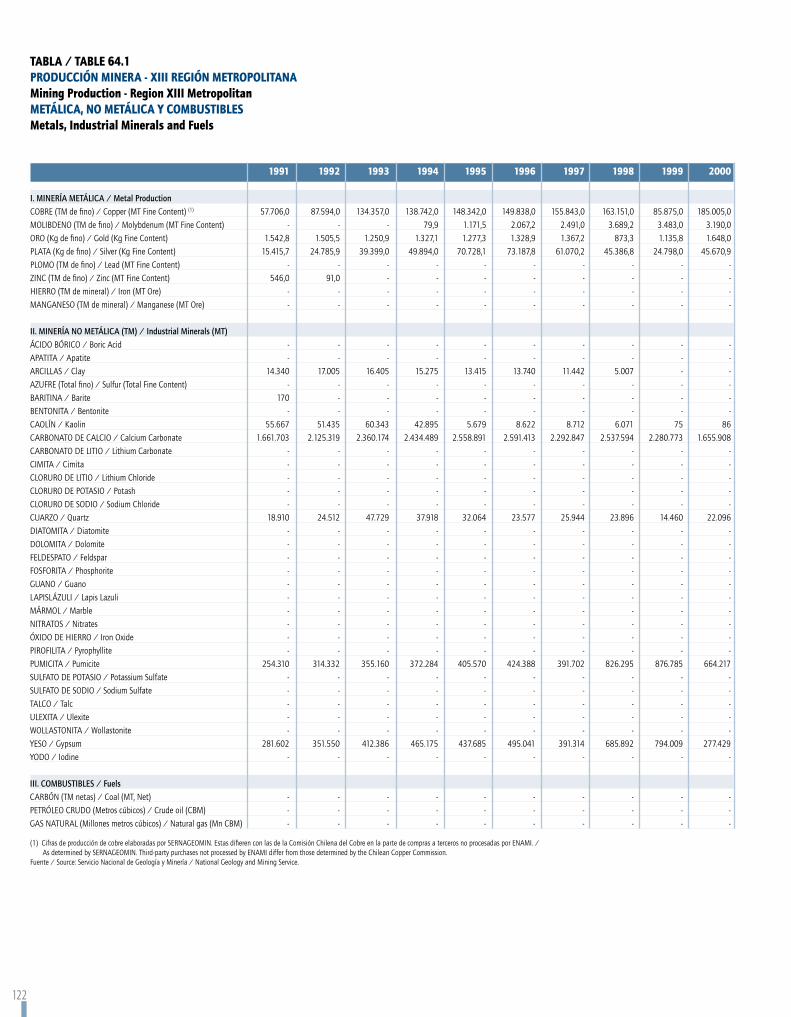
122
TABLA / TABLE 64.1PRODUCCIÓN MINERA - XIII REGIÓN METROPOLITANAMining Production - Region XIII MetropolitanMETÁLICA, NO METÁLICA Y COMBUSTIBLES Metals, Industrial Minerals and Fuels
1991 1992 1993 1994 1995 1996 1997 1998 1999 2000
i. MineríA MetÁlicA / Metal Production Cobre (tM de fino) / Copper (Mt Fine Content) (1) 57.706,0 87.594,0 134.357,0 138.742,0 148.342,0 149.838,0 155.843,0 163.151,0 85.875,0 185.005,0
Molibdeno (tM de fino) / Molybdenum (Mt Fine Content) - - - 79,9 1.171,5 2.067,2 2.491,0 3.689,2 3.483,0 3.190,0
oro (kg de fino) / Gold (kg Fine Content) 1.542,8 1.505,5 1.250,9 1.327,1 1.277,3 1.328,9 1.367,2 873,3 1.135,8 1.648,0
plata (kg de fino) / Silver (kg Fine Content) 15.415,7 24.785,9 39.399,0 49.894,0 70.728,1 73.187,8 61.070,2 45.386,8 24.798,0 45.670,9
ploMo (tM de fino) / lead (Mt Fine Content) - - - - - - - - - -
ZinC (tM de fino) / Zinc (Mt Fine Content) 546,0 91,0 - - - - - - - -
hierro (tM de mineral) / iron (Mt ore) - - - - - - - - - -
ManGaneSo (tM de mineral) / Manganese (Mt ore) - - - - - - - - - -
ii. MineríA no MetÁlicA (tM) / industrial Minerals (Mt) ÁCido bÓriCo / boric acid - - - - - - - - - -
apatita / apatite - - - - - - - - - -
arCillaS / Clay 14.340 17.005 16.405 15.275 13.415 13.740 11.442 5.007 - -
aZUFre (total fino) / Sulfur (total Fine Content) - - - - - - - - - -
baritina / barite 170 - - - - - - - - -
bentonita / bentonite - - - - - - - - - -
CaolÍn / kaolin 55.667 51.435 60.343 42.895 5.679 8.622 8.712 6.071 75 86
Carbonato de CalCio / Calcium Carbonate 1.661.703 2.125.319 2.360.174 2.434.489 2.558.891 2.591.413 2.292.847 2.537.594 2.280.773 1.655.908
Carbonato de litio / lithium Carbonate - - - - - - - - - -
CiMita / Cimita - - - - - - - - - -
ClorUro de litio / lithium Chloride - - - - - - - - - -
ClorUro de potaSio / potash - - - - - - - - - -
ClorUro de Sodio / Sodium Chloride - - - - - - - - - -
CUarZo / Quartz 18.910 24.512 47.729 37.918 32.064 23.577 25.944 23.896 14.460 22.096
diatoMita / diatomite - - - - - - - - - -
doloMita / dolomite - - - - - - - - - -
FeldeSpato / Feldspar - - - - - - - - - -
FoSForita / phosphorite - - - - - - - - - -
GUano / Guano - - - - - - - - - -
lapiSlÁZUli / lapis lazuli - - - - - - - - - -
MÁrMol / Marble - - - - - - - - - -
nitratoS / nitrates - - - - - - - - - -
ÓXido de hierro / iron oxide - - - - - - - - - -
piroFilita / pyrophyllite - - - - - - - - - -
pUMiCita / pumicite 254.310 314.332 355.160 372.284 405.570 424.388 391.702 826.295 876.785 664.217
SUlFato de potaSio / potassium Sulfate - - - - - - - - - -
SUlFato de Sodio / Sodium Sulfate - - - - - - - - - -
talCo / talc - - - - - - - - - -
UleXita / Ulexite - - - - - - - - - -
WollaStonita / Wollastonite - - - - - - - - - -
YeSo / Gypsum 281.602 351.550 412.386 465.175 437.685 495.041 391.314 685.892 794.009 277.429
Yodo / iodine - - - - - - - - - -
iii. coMbustibles / Fuels CarbÓn (tM netas) / Coal (Mt, net) - - - - - - - - - -
petrÓleo CrUdo (Metros cúbicos) / Crude oil (CbM) - - - - - - - - - -
GaS natUral (Millones metros cúbicos) / natural gas (Mn CbM) - - - - - - - - - - (1) Cifras de producción de cobre elaboradas por SernaGeoMin. estas difieren con las de la Comisión Chilena del Cobre en la parte de compras a terceros no procesadas por enaMi. / as determined by SernaGeoMin. third-party purchases not processed by enaMi differ from those determined by the Chilean Copper Commission.Fuente / Source: Servicio nacional de Geología y Minería / national Geology and Mining Service.
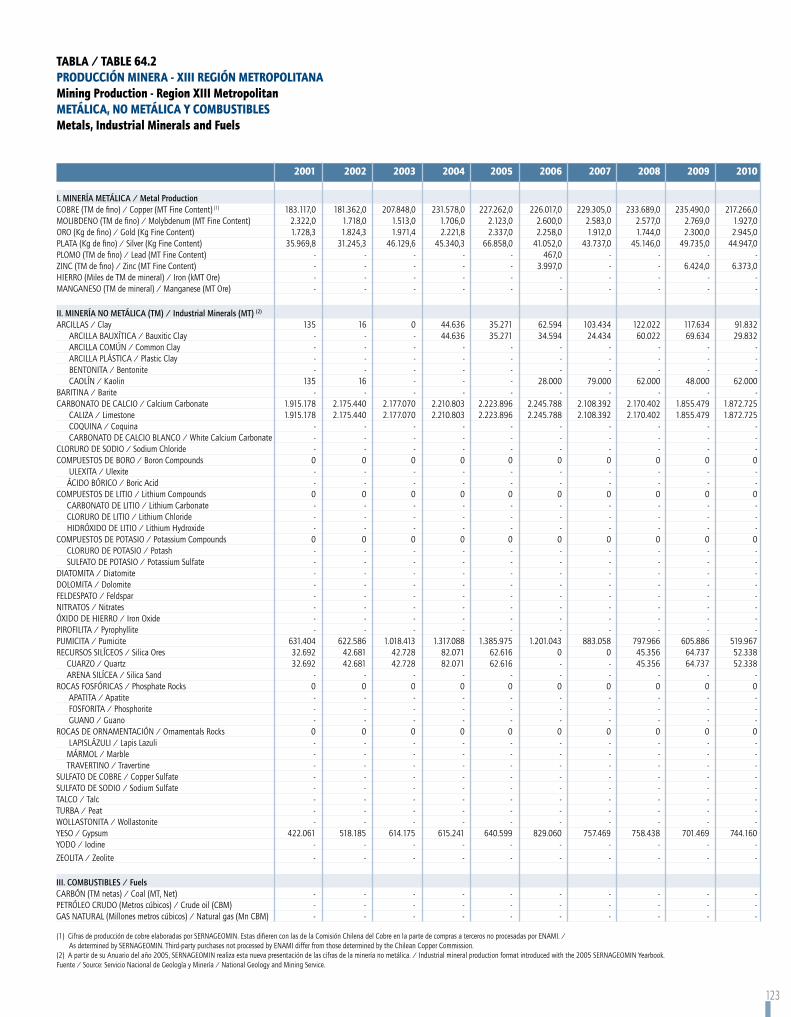
123
TABLA / TABLE 64.2 PRODUCCIÓN MINERA - XIII REGIÓN METROPOLITANAMining Production - Region XIII MetropolitanMETÁLICA, NO METÁLICA Y COMBUSTIBLESMetals, Industrial Minerals and Fuels
2001 2002 2003 2004 2005 2006 2007 2008 2009 2010
i. MineríA MetÁlicA / Metal Production Cobre (tM de fino) / Copper (Mt Fine Content) (1) 183.117,0 181.362,0 207.848,0 231.578,0 227.262,0 226.017,0 229.305,0 233.689,0 235.490,0 217.266,0Molibdeno (tM de fino) / Molybdenum (Mt Fine Content) 2.322,0 1.718,0 1.513,0 1.706,0 2.123,0 2.600,0 2.583,0 2.577,0 2.769,0 1.927,0oro (kg de fino) / Gold (kg Fine Content) 1.728,3 1.824,3 1.971,4 2.221,8 2.337,0 2.258,0 1.912,0 1.744,0 2.300,0 2.945,0plata (kg de fino) / Silver (kg Fine Content) 35.969,8 31.245,3 46.129,6 45.340,3 66.858,0 41.052,0 43.737,0 45.146,0 49.735,0 44.947,0ploMo (tM de fino) / lead (Mt Fine Content) - - - - - 467,0 - - - -ZinC (tM de fino) / Zinc (Mt Fine Content) - - - - - 3.997,0 - - 6.424,0 6.373,0hierro (Miles de tM de mineral) / iron (kMt ore) - - - - - - - - - -ManGaneSo (tM de mineral) / Manganese (Mt ore) - - - - - - - - - -
ii. MineríA no MetÁlicA (tM) / industrial Minerals (Mt) (2) arCillaS / Clay 135 16 0 44.636 35.271 62.594 103.434 122.022 117.634 91.832 arCilla baUXÍtiCa / bauxitic Clay - - - 44.636 35.271 34.594 24.434 60.022 69.634 29.832 arCilla CoMÚn / Common Clay - - - - - - - - - - arCilla plÁStiCa / plastic Clay - - - - - - - - - - bentonita / bentonite - - - - - - - - - - CaolÍn / kaolin 135 16 - - - 28.000 79.000 62.000 48.000 62.000baritina / barite - - - - - - - - - -Carbonato de CalCio / Calcium Carbonate 1.915.178 2.175.440 2.177.070 2.210.803 2.223.896 2.245.788 2.108.392 2.170.402 1.855.479 1.872.725 CaliZa / limestone 1.915.178 2.175.440 2.177.070 2.210.803 2.223.896 2.245.788 2.108.392 2.170.402 1.855.479 1.872.725 CoQUina / Coquina - - - - - - - - - - Carbonato de CalCio blanCo / White Calcium Carbonate - - - - - - - - - -ClorUro de Sodio / Sodium Chloride - - - - - - - - - -CoMpUeStoS de boro / boron Compounds 0 0 0 0 0 0 0 0 0 0 UleXita / Ulexite - - - - - - - - - - ÁCido bÓriCo / boric acid - - - - - - - - - -CoMpUeStoS de litio / lithium Compounds 0 0 0 0 0 0 0 0 0 0 Carbonato de litio / lithium Carbonate - - - - - - - - - - ClorUro de litio / lithium Chloride - - - - - - - - - - hidrÓXido de litio / lithium hydroxide - - - - - - - - - -CoMpUeStoS de potaSio / potassium Compounds 0 0 0 0 0 0 0 0 0 0 ClorUro de potaSio / potash - - - - - - - - - - SUlFato de potaSio / potassium Sulfate - - - - - - - - - -diatoMita / diatomite - - - - - - - - - -doloMita / dolomite - - - - - - - - - -FeldeSpato / Feldspar - - - - - - - - - -nitratoS / nitrates - - - - - - - - - -ÓXido de hierro / iron oxide - - - - - - - - - -piroFilita / pyrophyllite - - - - - - - - - -pUMiCita / pumicite 631.404 622.586 1.018.413 1.317.088 1.385.975 1.201.043 883.058 797.966 605.886 519.967reCUrSoS SilÍCeoS / Silica ores 32.692 42.681 42.728 82.071 62.616 0 0 45.356 64.737 52.338 CUarZo / Quartz 32.692 42.681 42.728 82.071 62.616 - - 45.356 64.737 52.338 arena SilÍCea / Silica Sand - - - - - - - - - -roCaS FoSFÓriCaS / phosphate rocks 0 0 0 0 0 0 0 0 0 0 apatita / apatite - - - - - - - - - - FoSForita / phosphorite - - - - - - - - - - GUano / Guano - - - - - - - - - -roCaS de ornaMentaCiÓn / ornamentals rocks 0 0 0 0 0 0 0 0 0 0 lapiSlÁZUli / lapis lazuli - - - - - - - - - - MÁrMol / Marble - - - - - - - - - - traVertino / travertine - - - - - - - - - -SUlFato de Cobre / Copper Sulfate - - - - - - - - - -SUlFato de Sodio / Sodium Sulfate - - - - - - - - - -talCo / talc - - - - - - - - - -tUrba / peat - - - - - - - - - -WollaStonita / Wollastonite - - - - - - - - - -YeSo / Gypsum 422.061 518.185 614.175 615.241 640.599 829.060 757.469 758.438 701.469 744.160Yodo / iodine - - - - - - - - - -
Zeolita / Zeolite - - - - - - - - - -
iii. coMbustibles / Fuels CarbÓn (tM netas) / Coal (Mt, net) - - - - - - - - - -petrÓleo CrUdo (Metros cúbicos) / Crude oil (CbM) - - - - - - - - - -GaS natUral (Millones metros cúbicos) / natural gas (Mn CbM) - - - - - - - - - - (1) Cifras de producción de cobre elaboradas por SernaGeoMin. estas difieren con las de la Comisión Chilena del Cobre en la parte de compras a terceros no procesadas por enaMi. / as determined by SernaGeoMin. third-party purchases not processed by enaMi differ from those determined by the Chilean Copper Commission.(2) a partir de su anuario del año 2005, SernaGeoMin realiza esta nueva presentación de las cifras de la minería no metálica. / industrial mineral production format introduced with the 2005 SernaGeoMin Yearbook. Fuente / Source: Servicio nacional de Geología y Minería / national Geology and Mining Service.

124
TABLA / TABLE 65PRODUCCIÓN MINERA - XV REGIÓN DE ARICA Y PARINACOTA (1)
Mining Production - Region XV Arica and Parinacota (1)
METÁLICA, NO METÁLICA Y COMBUSTIBLES Metals, Industrial Minerals and Fuels
2001 2002 2003 2004 2005 2006 2007 2008 2009 2010
i. MineríA MetÁlicA / Metal Production Cobre (tM de fino) / Copper (Mt Fine Content) - - - - - - - - 76,0 509,0Molibdeno (tM de fino) / Molybdenum (Mt Fine Content) - - - - - - - - - -oro (kg de fino) / Gold (kg Fine Content) - - - - - - - - - -plata (kg de fino) / Silver (kg Fine Content) - - - - - - - - - -ploMo (tM de fino) / lead (Mt Fine Content) - - - - - - - - - -ZinC (tM de fino) / Zinc (Mt Fine Content) - - - - - - - - - -hierro (Miles de tM de mineral) / iron (kMt ore) - - - - - - - - - -ManGaneSo (tM de mineral) / Manganese (Mt ore) - - - - - - - - - -
ii. MineríA no MetÁlicA (tM) / industrial Minerals (Mt) arCillaS / Clay 0 0 0 0 0 0 0 0 0 0 arCilla baUXÍtiCa / bauxitic Clay - - - - - - - - - - arCilla CoMÚn / Common Clay - - - - - - - - - - arCilla plÁStiCa / plastic Clay - - - - - - - - - - bentonita / bentonite - - - - - - - - - - CaolÍn / kaolin - - - - - - - - - -baritina / barite - - - - - - - - - -Carbonato de CalCio / Calcium Carbonate 0 0 0 0 0 0 0 0 0 0 CaliZa / limestone - - - - - - - - - - CoQUina / Coquina - - - - - - - - - - Carbonato de CalCio blanCo / White Calcium Carbonate - - - - - - - - - -ClorUro de Sodio / Sodium Chloride - - - - - - - - - -CoMpUeStoS de boro / boron Compounds 292.319 407.968 363.071 560.958 432.912 443.364 527.929 521.352 447.960 468.121 UleXita / Ulexite 292.319 407.968 363.071 560.958 432.912 443.364 527.929 521.352 447.960 468.121 ÁCido bÓriCo / boric acid - - - - - - - - - -CoMpUeStoS de litio / lithium Compounds 0 0 0 0 0 0 0 0 0 0 Carbonato de litio / lithium Carbonate - - - - - - - - - - ClorUro de litio / lithium Chloride - - - - - - - - - - hidrÓXido de litio / lithium hydroxide - - - - - - - - - -CoMpUeStoS de potaSio / potassium Compounds 0 0 0 0 0 0 0 0 0 0 ClorUro de potaSio / potash - - - - - - - - - - SUlFato de potaSio / potassium Sulfate - - - - - - - - - -diatoMita / diatomite 5.346 2.679 5.995 9.170 6.527 7.291 10.137 9.587 8.145 10.614doloMita / dolomite - - - - - - - - - -FeldeSpato / Feldspar - - - - - - - - - -nitratoS / nitrates - - - - - - - - - -ÓXido de hierro / iron oxide - - - - - - - - - -piroFilita / pyrophyllite - - - - - - - - - -pUMiCita / pumicite - - - - - - - - - -reCUrSoS SilÍCeoS / Silica ores 0 0 0 0 0 0 0 0 0 0 CUarZo / Quartz - - - - - - - - - - arena SilÍCea / Silica Sand - - - - - - - - - -roCaS FoSFÓriCaS / phosphate rocks 0 0 0 0 0 0 0 0 0 0 apatita / apatite - - - - - - - - - - FoSForita / phosphorite - - - - - - - - - - GUano / Guano - - - - - - - - - -roCaS de ornaMentaCiÓn / ornamentals rocks 0 0 0 0 0 0 0 0 0 0 lapiSlÁZUli / lapis lazuli - - - - - - - - - - MÁrMol / Marble - - - - - - - - - - traVertino / travertine - - - - - - - - - -SUlFato de Cobre / Copper Sulfate - - - - - - - - - -SUlFato de Sodio / Sodium Sulfate - - - - - - - - - -talCo / talc - - - - - - - - - -tUrba / peat - - - - - - - - - -WollaStonita / Wollastonite - - - - - - - - - -YeSo / Gypsum - - - - - - - - - -Yodo / iodine - - - - - - - - - -Zeolita / Zeolite - - - - - - - - - -
iii. coMbustibles / Fuels CarbÓn (tM netas) / Coal (Mt, net) - - - - - - - - - -petrÓleo CrUdo (Metros cúbicos) / Crude oil (CbM) - - - - - - - - - -
GaS natUral (Millones metros cúbicos) / natural gas (Mn CbM) - - - - - - - - - - (1) la XV región de arica y parinacota fue creada por ley n° 20.175 del 11 de abril de 2007. para esta región, las cifras están disponibles sólo desde 1998 en adelante. / the region of arica & parinacota (region XV) was established by law 20175 of 11 april 2007. data is available starting in 1998.Fuente / Source: Servicio nacional de Geología y Minería / national Geology and Mining Service.
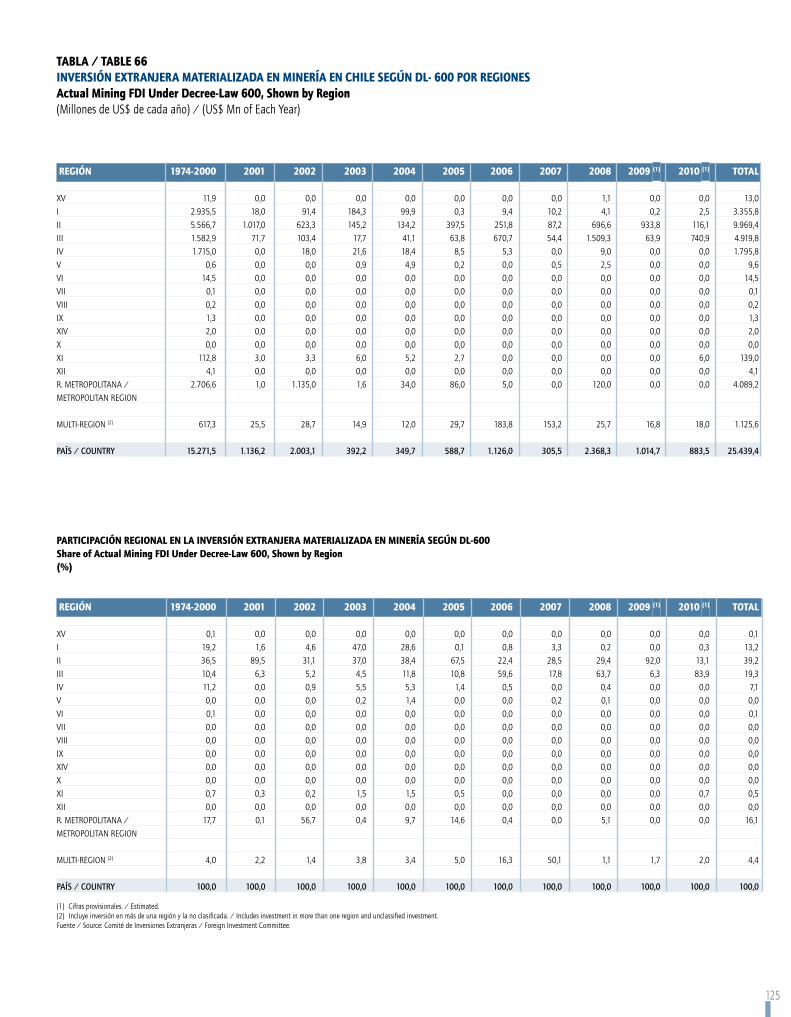
125
TABLA / TABLE 66 INVERSIÓN EXTRANJERA MATERIALIZADA EN MINERÍA EN CHILE SEGÚN DL- 600 POR REGIONES Actual Mining FDI Under Decree-Law 600, Shown by Region (Millones de US$ de cada año) / (US$ Mn of each Year)
REGIÓN 1974-2000 2001 2002 2003 2004 2005 2006 2007 2008 2009 (1) 2010 (1) TOTAL
XV 11,9 0,0 0,0 0,0 0,0 0,0 0,0 0,0 1,1 0,0 0,0 13,0
i 2.935,5 18,0 91,4 184,3 99,9 0,3 9,4 10,2 4,1 0,2 2,5 3.355,8
ii 5.566,7 1.017,0 623,3 145,2 134,2 397,5 251,8 87,2 696,6 933,8 116,1 9.969,4
iii 1.582,9 71,7 103,4 17,7 41,1 63,8 670,7 54,4 1.509,3 63,9 740,9 4.919,8
iV 1.715,0 0,0 18,0 21,6 18,4 8,5 5,3 0,0 9,0 0,0 0,0 1.795,8
V 0,6 0,0 0,0 0,9 4,9 0,2 0,0 0,5 2,5 0,0 0,0 9,6
Vi 14,5 0,0 0,0 0,0 0,0 0,0 0,0 0,0 0,0 0,0 0,0 14,5
Vii 0,1 0,0 0,0 0,0 0,0 0,0 0,0 0,0 0,0 0,0 0,0 0,1
Viii 0,2 0,0 0,0 0,0 0,0 0,0 0,0 0,0 0,0 0,0 0,0 0,2
iX 1,3 0,0 0,0 0,0 0,0 0,0 0,0 0,0 0,0 0,0 0,0 1,3
XiV 2,0 0,0 0,0 0,0 0,0 0,0 0,0 0,0 0,0 0,0 0,0 2,0
X 0,0 0,0 0,0 0,0 0,0 0,0 0,0 0,0 0,0 0,0 0,0 0,0
Xi 112,8 3,0 3,3 6,0 5,2 2,7 0,0 0,0 0,0 0,0 6,0 139,0
Xii 4,1 0,0 0,0 0,0 0,0 0,0 0,0 0,0 0,0 0,0 0,0 4,1
r. Metropolitana / 2.706,6 1,0 1.135,0 1,6 34,0 86,0 5,0 0,0 120,0 0,0 0,0 4.089,2
Metropolitan reGion
MUlti-reGion (2) 617,3 25,5 28,7 14,9 12,0 29,7 183,8 153,2 25,7 16,8 18,0 1.125,6
PAís / country 15.271,5 1.136,2 2.003,1 392,2 349,7 588,7 1.126,0 305,5 2.368,3 1.014,7 883,5 25.439,4
PARTICIPACIÓN REGIONAL EN LA INVERSIÓN EXTRANJERA MATERIALIZADA EN MINERÍA SEGÚN DL-600Share of Actual Mining FDI Under Decree-Law 600, Shown by Region(%)
REGIÓN 1974-2000 2001 2002 2003 2004 2005 2006 2007 2008 2009 (1) 2010 (1) TOTAL
XV 0,1 0,0 0,0 0,0 0,0 0,0 0,0 0,0 0,0 0,0 0,0 0,1
i 19,2 1,6 4,6 47,0 28,6 0,1 0,8 3,3 0,2 0,0 0,3 13,2
ii 36,5 89,5 31,1 37,0 38,4 67,5 22,4 28,5 29,4 92,0 13,1 39,2
iii 10,4 6,3 5,2 4,5 11,8 10,8 59,6 17,8 63,7 6,3 83,9 19,3
iV 11,2 0,0 0,9 5,5 5,3 1,4 0,5 0,0 0,4 0,0 0,0 7,1
V 0,0 0,0 0,0 0,2 1,4 0,0 0,0 0,2 0,1 0,0 0,0 0,0
Vi 0,1 0,0 0,0 0,0 0,0 0,0 0,0 0,0 0,0 0,0 0,0 0,1
Vii 0,0 0,0 0,0 0,0 0,0 0,0 0,0 0,0 0,0 0,0 0,0 0,0
Viii 0,0 0,0 0,0 0,0 0,0 0,0 0,0 0,0 0,0 0,0 0,0 0,0
iX 0,0 0,0 0,0 0,0 0,0 0,0 0,0 0,0 0,0 0,0 0,0 0,0
XiV 0,0 0,0 0,0 0,0 0,0 0,0 0,0 0,0 0,0 0,0 0,0 0,0
X 0,0 0,0 0,0 0,0 0,0 0,0 0,0 0,0 0,0 0,0 0,0 0,0
Xi 0,7 0,3 0,2 1,5 1,5 0,5 0,0 0,0 0,0 0,0 0,7 0,5
Xii 0,0 0,0 0,0 0,0 0,0 0,0 0,0 0,0 0,0 0,0 0,0 0,0
r. Metropolitana / 17,7 0,1 56,7 0,4 9,7 14,6 0,4 0,0 5,1 0,0 0,0 16,1
Metropolitan reGion
MUlti-reGion (2) 4,0 2,2 1,4 3,8 3,4 5,0 16,3 50,1 1,1 1,7 2,0 4,4
PAís / country 100,0 100,0 100,0 100,0 100,0 100,0 100,0 100,0 100,0 100,0 100,0 100,0 (1) Cifras provisionales. / estimated. (2) incluye inversión en más de una región y la no clasificada. / includes investment in more than one region and unclassified investment. Fuente / Source: Comité de inversiones extranjeras / Foreign investment Committee.

126

127
1.8OTRAS ESTADÍSTICAS NACIONALESotHer country stAtistics
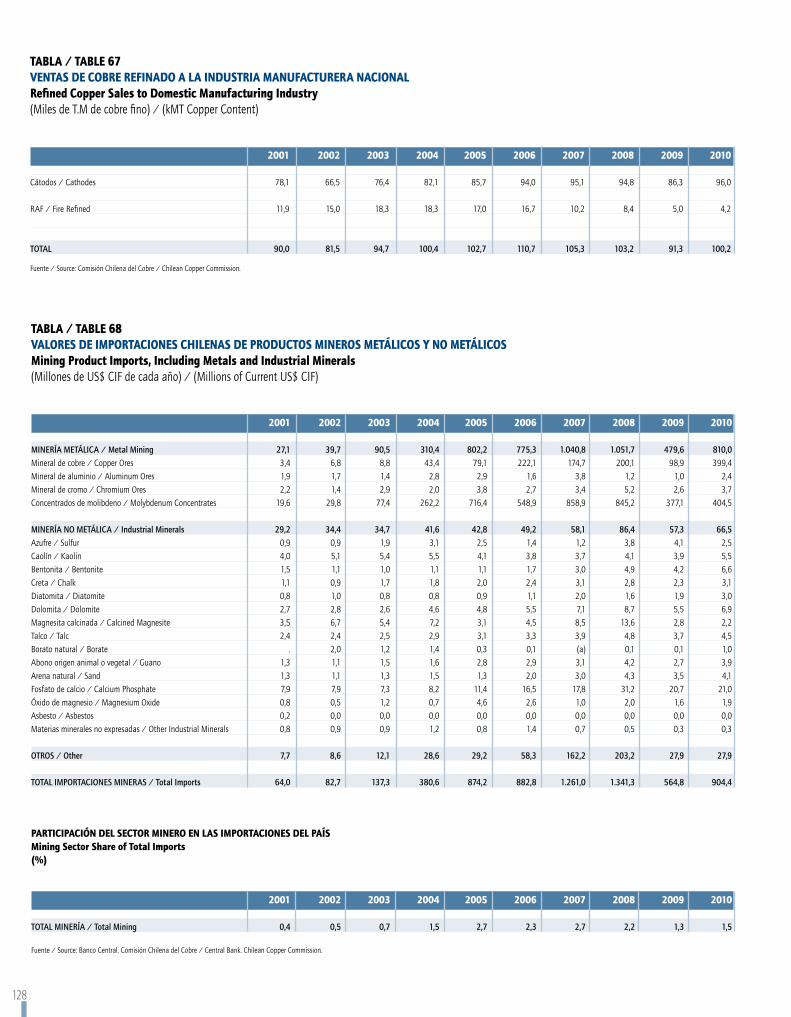
128
TABLA / TABLE 67VENTAS DE COBRE REFINADO A LA INDUSTRIA MANUFACTURERA NACIONAL Refined Copper Sales to Domestic Manufacturing Industry(Miles de t.M de cobre fino) / (kMt Copper Content) 2001 2002 2003 2004 2005 2006 2007 2008 2009 2010
Cátodos / Cathodes 78,1 66,5 76,4 82,1 85,7 94,0 95,1 94,8 86,3 96,0
raF / Fire refined 11,9 15,0 18,3 18,3 17,0 16,7 10,2 8,4 5,0 4,2
totAl 90,0 81,5 94,7 100,4 102,7 110,7 105,3 103,2 91,3 100,2 Fuente / Source: Comisión Chilena del Cobre / Chilean Copper Commission.
TABLA / TABLE 68 VALORES DE IMPORTACIONES CHILENAS DE PRODUCTOS MINEROS METÁLICOS Y NO METÁLICOSMining Product Imports, Including Metals and Industrial Minerals (Millones de US$ CiF de cada año) / (Millions of Current US$ CiF)
2001 2002 2003 2004 2005 2006 2007 2008 2009 2010
MineríA MetÁlicA / Metal Mining 27,1 39,7 90,5 310,4 802,2 775,3 1.040,8 1.051,7 479,6 810,0 Mineral de cobre / Copper ores 3,4 6,8 8,8 43,4 79,1 222,1 174,7 200,1 98,9 399,4
Mineral de aluminio / aluminum ores 1,9 1,7 1,4 2,8 2,9 1,6 3,8 1,2 1,0 2,4
Mineral de cromo / Chromium ores 2,2 1,4 2,9 2,0 3,8 2,7 3,4 5,2 2,6 3,7
Concentrados de molibdeno / Molybdenum Concentrates 19,6 29,8 77,4 262,2 716,4 548,9 858,9 845,2 377,1 404,5
MineríA no MetÁlicA / industrial Minerals 29,2 34,4 34,7 41,6 42,8 49,2 58,1 86,4 57,3 66,5 azufre / Sulfur 0,9 0,9 1,9 3,1 2,5 1,4 1,2 3,8 4,1 2,5
Caolín / kaolin 4,0 5,1 5,4 5,5 4,1 3,8 3,7 4,1 3,9 5,5
bentonita / bentonite 1,5 1,1 1,0 1,1 1,1 1,7 3,0 4,9 4,2 6,6
Creta / Chalk 1,1 0,9 1,7 1,8 2,0 2,4 3,1 2,8 2,3 3,1
diatomita / diatomite 0,8 1,0 0,8 0,8 0,9 1,1 2,0 1,6 1,9 3,0
dolomita / dolomite 2,7 2,8 2,6 4,6 4,8 5,5 7,1 8,7 5,5 6,9
Magnesita calcinada / Calcined Magnesite 3,5 6,7 5,4 7,2 3,1 4,5 8,5 13,6 2,8 2,2
talco / talc 2,4 2,4 2,5 2,9 3,1 3,3 3,9 4,8 3,7 4,5
borato natural / borate . 2,0 1,2 1,4 0,3 0,1 (a) 0,1 0,1 1,0
abono origen animal o vegetal / Guano 1,3 1,1 1,5 1,6 2,8 2,9 3,1 4,2 2,7 3,9
arena natural / Sand 1,3 1,1 1,3 1,5 1,3 2,0 3,0 4,3 3,5 4,1
Fosfato de calcio / Calcium phosphate 7,9 7,9 7,3 8,2 11,4 16,5 17,8 31,2 20,7 21,0
Óxido de magnesio / Magnesium oxide 0,8 0,5 1,2 0,7 4,6 2,6 1,0 2,0 1,6 1,9
asbesto / asbestos 0,2 0,0 0,0 0,0 0,0 0,0 0,0 0,0 0,0 0,0
Materias minerales no expresadas / other industrial Minerals 0,8 0,9 0,9 1,2 0,8 1,4 0,7 0,5 0,3 0,3
otros / other 7,7 8,6 12,1 28,6 29,2 58,3 162,2 203,2 27,9 27,9
totAl iMPortAciones MinerAs / total imports 64,0 82,7 137,3 380,6 874,2 882,8 1.261,0 1.341,3 564,8 904,4
PARTICIPACIÓN DEL SECTOR MINERO EN LAS IMPORTACIONES DEL PAÍSMining Sector Share of Total Imports(%)
2001 2002 2003 2004 2005 2006 2007 2008 2009 2010
totAl MineríA / total Mining 0,4 0,5 0,7 1,5 2,7 2,3 2,7 2,2 1,3 1,5
Fuente / Source: banco Central. Comisión Chilena del Cobre / Central bank. Chilean Copper Commission.
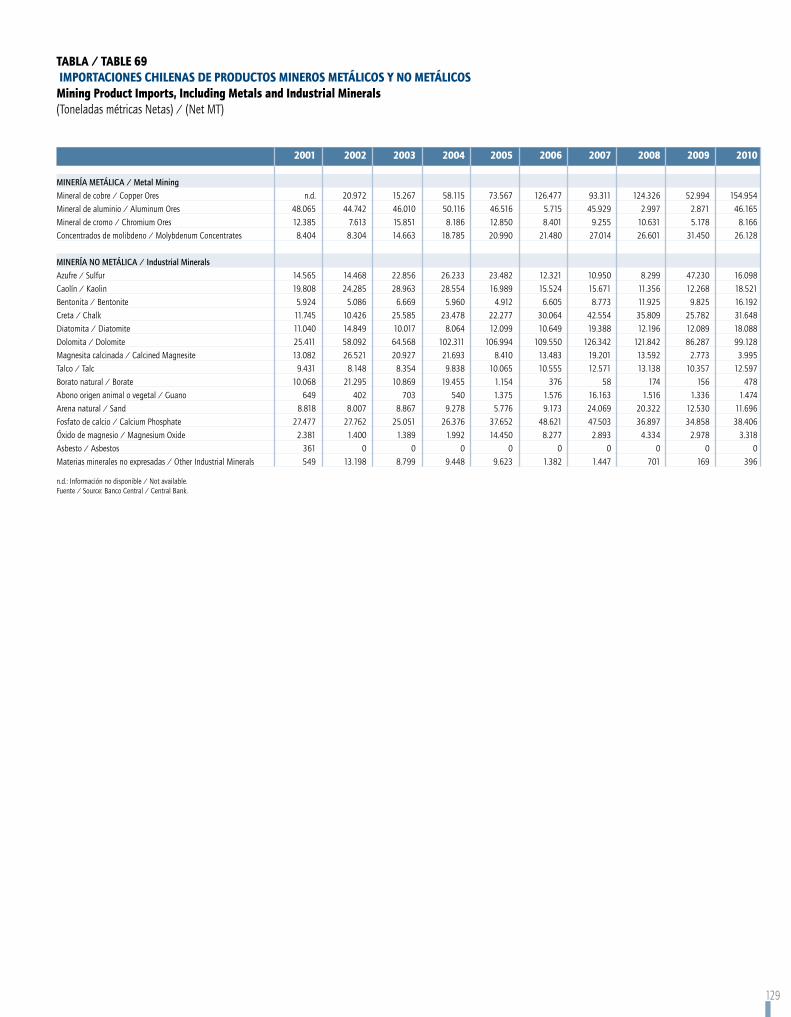
129
TABLA / TABLE 69 IMPORTACIONES CHILENAS DE PRODUCTOS MINEROS METÁLICOS Y NO METÁLICOSMining Product Imports, Including Metals and Industrial Minerals(toneladas métricas netas) / (net Mt)
2001 2002 2003 2004 2005 2006 2007 2008 2009 2010
MineríA MetÁlicA / Metal Mining Mineral de cobre / Copper ores n.d. 20.972 15.267 58.115 73.567 126.477 93.311 124.326 52.994 154.954
Mineral de aluminio / aluminum ores 48.065 44.742 46.010 50.116 46.516 5.715 45.929 2.997 2.871 46.165
Mineral de cromo / Chromium ores 12.385 7.613 15.851 8.186 12.850 8.401 9.255 10.631 5.178 8.166
Concentrados de molibdeno / Molybdenum Concentrates 8.404 8.304 14.663 18.785 20.990 21.480 27.014 26.601 31.450 26.128
MineríA no MetÁlicA / industrial Minerals azufre / Sulfur 14.565 14.468 22.856 26.233 23.482 12.321 10.950 8.299 47.230 16.098
Caolín / kaolin 19.808 24.285 28.963 28.554 16.989 15.524 15.671 11.356 12.268 18.521
bentonita / bentonite 5.924 5.086 6.669 5.960 4.912 6.605 8.773 11.925 9.825 16.192
Creta / Chalk 11.745 10.426 25.585 23.478 22.277 30.064 42.554 35.809 25.782 31.648
diatomita / diatomite 11.040 14.849 10.017 8.064 12.099 10.649 19.388 12.196 12.089 18.088
dolomita / dolomite 25.411 58.092 64.568 102.311 106.994 109.550 126.342 121.842 86.287 99.128
Magnesita calcinada / Calcined Magnesite 13.082 26.521 20.927 21.693 8.410 13.483 19.201 13.592 2.773 3.995
talco / talc 9.431 8.148 8.354 9.838 10.065 10.555 12.571 13.138 10.357 12.597
borato natural / borate 10.068 21.295 10.869 19.455 1.154 376 58 174 156 478
abono origen animal o vegetal / Guano 649 402 703 540 1.375 1.576 16.163 1.516 1.336 1.474
arena natural / Sand 8.818 8.007 8.867 9.278 5.776 9.173 24.069 20.322 12.530 11.696
Fosfato de calcio / Calcium phosphate 27.477 27.762 25.051 26.376 37.652 48.621 47.503 36.897 34.858 38.406
Óxido de magnesio / Magnesium oxide 2.381 1.400 1.389 1.992 14.450 8.277 2.893 4.334 2.978 3.318
asbesto / asbestos 361 0 0 0 0 0 0 0 0 0
Materias minerales no expresadas / other industrial Minerals 549 13.198 8.799 9.448 9.623 1.382 1.447 701 169 396 n.d.: información no disponible / not available. Fuente / Source: banco Central / Central bank.
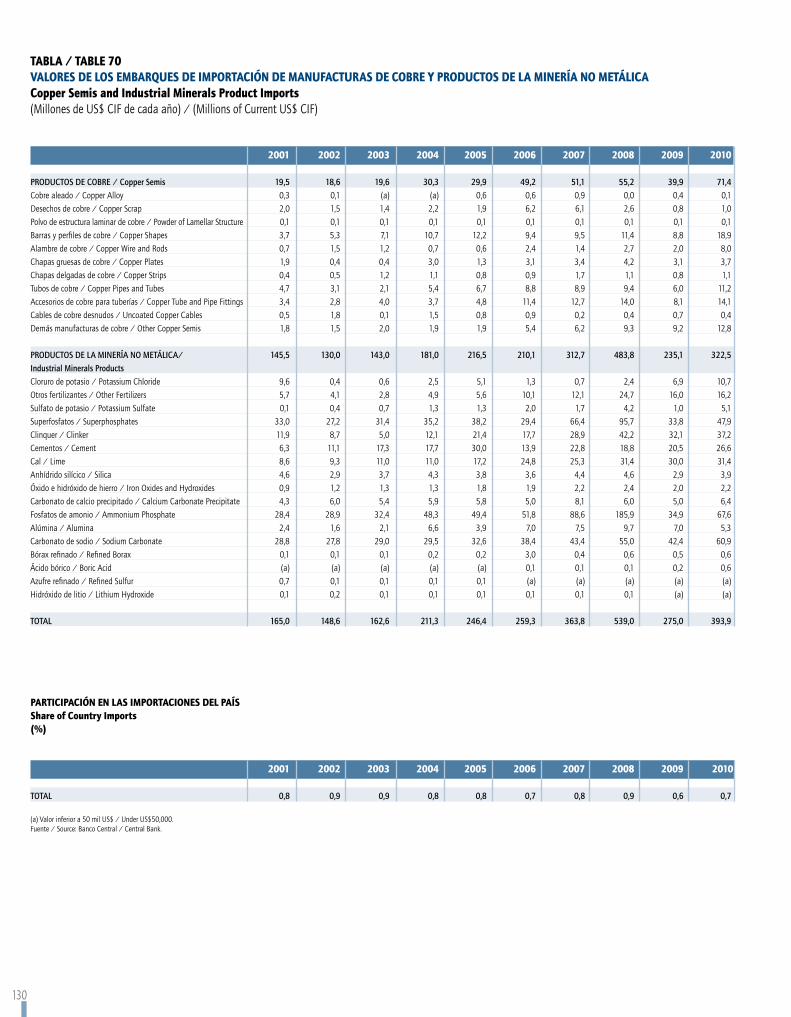
130
TABLA / TABLE 70 VALORES DE LOS EMBARQUES DE IMPORTACIÓN DE MANUFACTURAS DE COBRE Y PRODUCTOS DE LA MINERÍA NO METÁLICACopper Semis and Industrial Minerals Product Imports(Millones de US$ CiF de cada año) / (Millions of Current US$ CiF)
2001 2002 2003 2004 2005 2006 2007 2008 2009 2010
Productos de cobre / copper semis 19,5 18,6 19,6 30,3 29,9 49,2 51,1 55,2 39,9 71,4 Cobre aleado / Copper alloy 0,3 0,1 (a) (a) 0,6 0,6 0,9 0,0 0,4 0,1
desechos de cobre / Copper Scrap 2,0 1,5 1,4 2,2 1,9 6,2 6,1 2,6 0,8 1,0
polvo de estructura laminar de cobre / powder of lamellar Structure 0,1 0,1 0,1 0,1 0,1 0,1 0,1 0,1 0,1 0,1
barras y perfiles de cobre / Copper Shapes 3,7 5,3 7,1 10,7 12,2 9,4 9,5 11,4 8,8 18,9
alambre de cobre / Copper Wire and rods 0,7 1,5 1,2 0,7 0,6 2,4 1,4 2,7 2,0 8,0
Chapas gruesas de cobre / Copper plates 1,9 0,4 0,4 3,0 1,3 3,1 3,4 4,2 3,1 3,7
Chapas delgadas de cobre / Copper Strips 0,4 0,5 1,2 1,1 0,8 0,9 1,7 1,1 0,8 1,1
tubos de cobre / Copper pipes and tubes 4,7 3,1 2,1 5,4 6,7 8,8 8,9 9,4 6,0 11,2
accesorios de cobre para tuberías / Copper tube and pipe Fittings 3,4 2,8 4,0 3,7 4,8 11,4 12,7 14,0 8,1 14,1
Cables de cobre desnudos / Uncoated Copper Cables 0,5 1,8 0,1 1,5 0,8 0,9 0,2 0,4 0,7 0,4
demás manufacturas de cobre / other Copper Semis 1,8 1,5 2,0 1,9 1,9 5,4 6,2 9,3 9,2 12,8
Productos de lA MineríA no MetÁlicA/ 145,5 130,0 143,0 181,0 216,5 210,1 312,7 483,8 235,1 322,5 industrial Minerals Products Cloruro de potasio / potassium Chloride 9,6 0,4 0,6 2,5 5,1 1,3 0,7 2,4 6,9 10,7
otros fertilizantes / other Fertilizers 5,7 4,1 2,8 4,9 5,6 10,1 12,1 24,7 16,0 16,2
Sulfato de potasio / potassium Sulfate 0,1 0,4 0,7 1,3 1,3 2,0 1,7 4,2 1,0 5,1
Superfosfatos / Superphosphates 33,0 27,2 31,4 35,2 38,2 29,4 66,4 95,7 33,8 47,9
Clinquer / Clinker 11,9 8,7 5,0 12,1 21,4 17,7 28,9 42,2 32,1 37,2
Cementos / Cement 6,3 11,1 17,3 17,7 30,0 13,9 22,8 18,8 20,5 26,6
Cal / lime 8,6 9,3 11,0 11,0 17,2 24,8 25,3 31,4 30,0 31,4
anhídrido silícico / Silica 4,6 2,9 3,7 4,3 3,8 3,6 4,4 4,6 2,9 3,9
Óxido e hidróxido de hierro / iron oxides and hydroxides 0,9 1,2 1,3 1,3 1,8 1,9 2,2 2,4 2,0 2,2
Carbonato de calcio precipitado / Calcium Carbonate precipitate 4,3 6,0 5,4 5,9 5,8 5,0 8,1 6,0 5,0 6,4
Fosfatos de amonio / ammonium phosphate 28,4 28,9 32,4 48,3 49,4 51,8 88,6 185,9 34,9 67,6
alúmina / alumina 2,4 1,6 2,1 6,6 3,9 7,0 7,5 9,7 7,0 5,3
Carbonato de sodio / Sodium Carbonate 28,8 27,8 29,0 29,5 32,6 38,4 43,4 55,0 42,4 60,9
bórax refinado / refined borax 0,1 0,1 0,1 0,2 0,2 3,0 0,4 0,6 0,5 0,6
Ácido bórico / boric acid (a) (a) (a) (a) (a) 0,1 0,1 0,1 0,2 0,6
azufre refinado / refined Sulfur 0,7 0,1 0,1 0,1 0,1 (a) (a) (a) (a) (a)
hidróxido de litio / lithium hydroxide 0,1 0,2 0,1 0,1 0,1 0,1 0,1 0,1 (a) (a)
totAl 165,0 148,6 162,6 211,3 246,4 259,3 363,8 539,0 275,0 393,9
PARTICIPACIÓN EN LAS IMPORTACIONES DEL PAÍSShare of Country Imports(%)
2001 2002 2003 2004 2005 2006 2007 2008 2009 2010
totAl 0,8 0,9 0,9 0,8 0,8 0,7 0,8 0,9 0,6 0,7
(a) Valor inferior a 50 mil US$ / Under US$50,000. Fuente / Source: banco Central / Central bank.
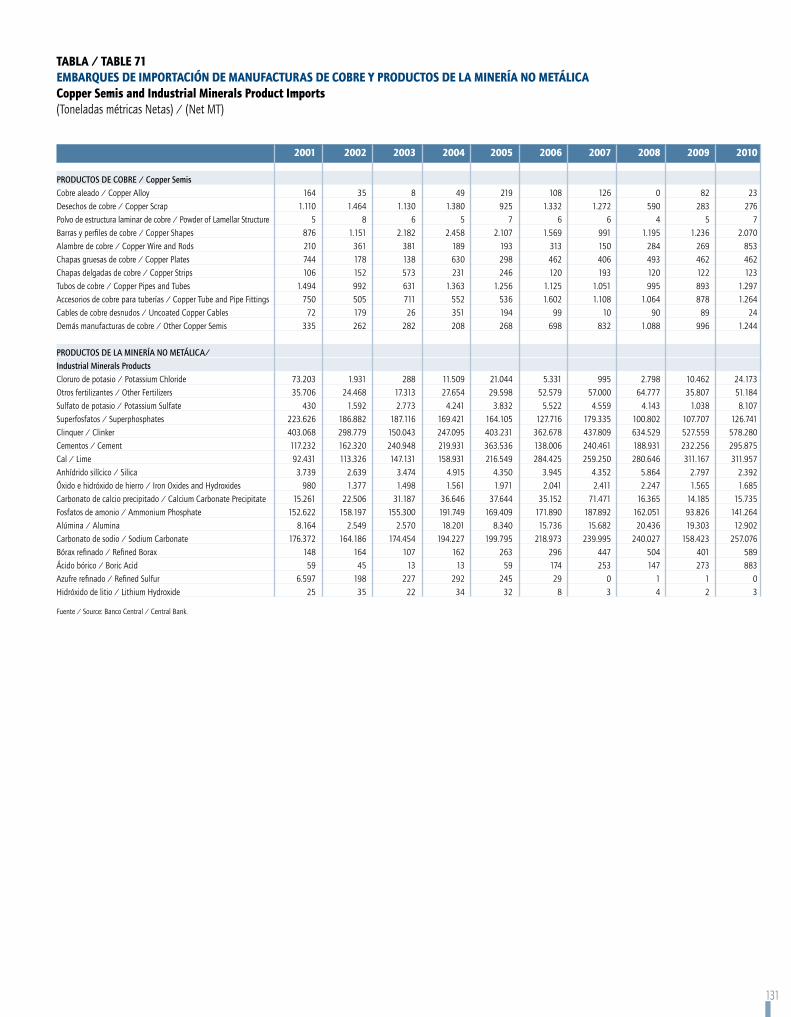
131
TABLA / TABLE 71EMBARQUES DE IMPORTACIÓN DE MANUFACTURAS DE COBRE Y PRODUCTOS DE LA MINERÍA NO METÁLICACopper Semis and Industrial Minerals Product Imports(toneladas métricas netas) / (net Mt)
2001 2002 2003 2004 2005 2006 2007 2008 2009 2010
Productos de cobre / copper semis Cobre aleado / Copper alloy 164 35 8 49 219 108 126 0 82 23
desechos de cobre / Copper Scrap 1.110 1.464 1.130 1.380 925 1.332 1.272 590 283 276
polvo de estructura laminar de cobre / powder of lamellar Structure 5 8 6 5 7 6 6 4 5 7
barras y perfiles de cobre / Copper Shapes 876 1.151 2.182 2.458 2.107 1.569 991 1.195 1.236 2.070
alambre de cobre / Copper Wire and rods 210 361 381 189 193 313 150 284 269 853
Chapas gruesas de cobre / Copper plates 744 178 138 630 298 462 406 493 462 462
Chapas delgadas de cobre / Copper Strips 106 152 573 231 246 120 193 120 122 123
tubos de cobre / Copper pipes and tubes 1.494 992 631 1.363 1.256 1.125 1.051 995 893 1.297
accesorios de cobre para tuberías / Copper tube and pipe Fittings 750 505 711 552 536 1.602 1.108 1.064 878 1.264
Cables de cobre desnudos / Uncoated Copper Cables 72 179 26 351 194 99 10 90 89 24
demás manufacturas de cobre / other Copper Semis 335 262 282 208 268 698 832 1.088 996 1.244
Productos de lA MineríA no MetÁlicA/ industrial Minerals Products Cloruro de potasio / potassium Chloride 73.203 1.931 288 11.509 21.044 5.331 995 2.798 10.462 24.173
otros fertilizantes / other Fertilizers 35.706 24.468 17.313 27.654 29.598 52.579 57.000 64.777 35.807 51.184
Sulfato de potasio / potassium Sulfate 430 1.592 2.773 4.241 3.832 5.522 4.559 4.143 1.038 8.107
Superfosfatos / Superphosphates 223.626 186.882 187.116 169.421 164.105 127.716 179.335 100.802 107.707 126.741
Clinquer / Clinker 403.068 298.779 150.043 247.095 403.231 362.678 437.809 634.529 527.559 578.280
Cementos / Cement 117.232 162.320 240.948 219.931 363.536 138.006 240.461 188.931 232.256 295.875
Cal / lime 92.431 113.326 147.131 158.931 216.549 284.425 259.250 280.646 311.167 311.957
anhídrido silícico / Silica 3.739 2.639 3.474 4.915 4.350 3.945 4.352 5.864 2.797 2.392
Óxido e hidróxido de hierro / iron oxides and hydroxides 980 1.377 1.498 1.561 1.971 2.041 2.411 2.247 1.565 1.685
Carbonato de calcio precipitado / Calcium Carbonate precipitate 15.261 22.506 31.187 36.646 37.644 35.152 71.471 16.365 14.185 15.735
Fosfatos de amonio / ammonium phosphate 152.622 158.197 155.300 191.749 169.409 171.890 187.892 162.051 93.826 141.264
alúmina / alumina 8.164 2.549 2.570 18.201 8.340 15.736 15.682 20.436 19.303 12.902
Carbonato de sodio / Sodium Carbonate 176.372 164.186 174.454 194.227 199.795 218.973 239.995 240.027 158.423 257.076
bórax refinado / refined borax 148 164 107 162 263 296 447 504 401 589
Ácido bórico / boric acid 59 45 13 13 59 174 253 147 273 883
azufre refinado / refined Sulfur 6.597 198 227 292 245 29 0 1 1 0
hidróxido de litio / lithium hydroxide 25 35 22 34 32 8 3 4 2 3 Fuente / Source: banco Central / Central bank.

132
133
CAPÍTULO 2MercAdo internAcionAl:ProducciÓn, consuMo, coMercio y Precios
cHAPter 2World MArKet Production, consuMPtion, trAde And Prices

134
135
2.1PRODUCCIÓN MINERA MUNDIALWorld MininG Production
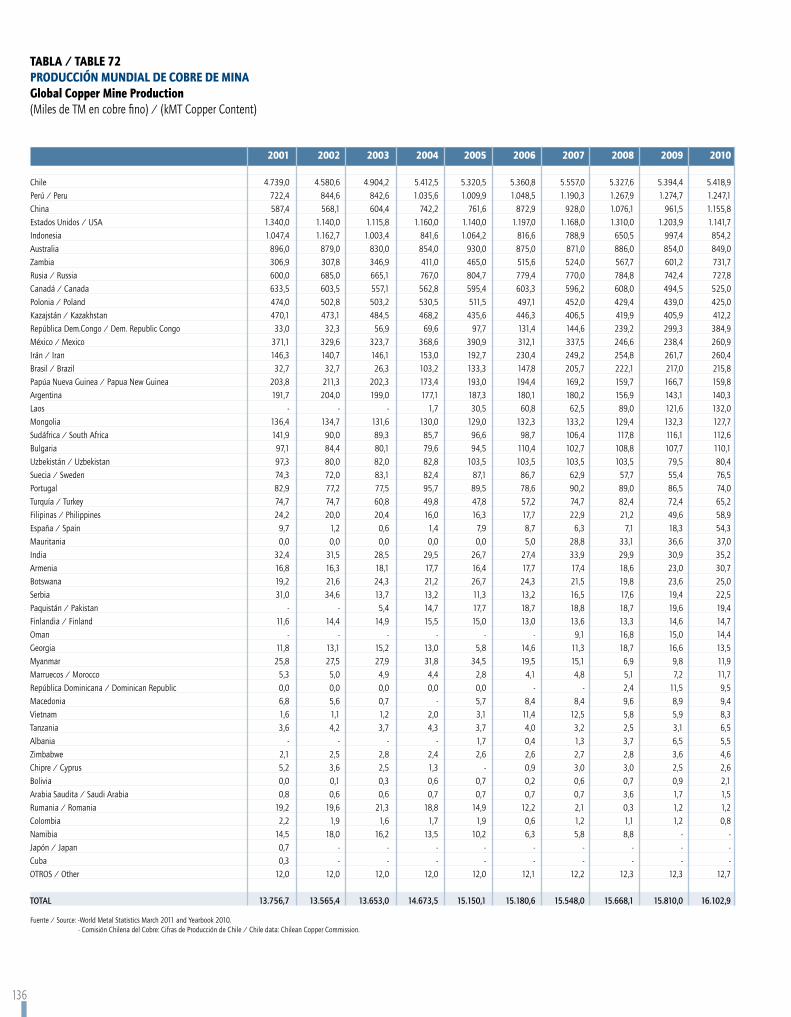
136
TABLA / TABLE 72 PRODUCCIÓN MUNDIAL DE COBRE DE MINAGlobal Copper Mine Production (Miles de tM en cobre fino) / (kMt Copper Content)
2001 2002 2003 2004 2005 2006 2007 2008 2009 2010
Chile 4.739,0 4.580,6 4.904,2 5.412,5 5.320,5 5.360,8 5.557,0 5.327,6 5.394,4 5.418,9
perú / peru 722,4 844,6 842,6 1.035,6 1.009,9 1.048,5 1.190,3 1.267,9 1.274,7 1.247,1
China 587,4 568,1 604,4 742,2 761,6 872,9 928,0 1.076,1 961,5 1.155,8
estados Unidos / USa 1.340,0 1.140,0 1.115,8 1.160,0 1.140,0 1.197,0 1.168,0 1.310,0 1.203,9 1.141,7
indonesia 1.047,4 1.162,7 1.003,4 841,6 1.064,2 816,6 788,9 650,5 997,4 854,2
australia 896,0 879,0 830,0 854,0 930,0 875,0 871,0 886,0 854,0 849,0
Zambia 306,9 307,8 346,9 411,0 465,0 515,6 524,0 567,7 601,2 731,7
rusia / russia 600,0 685,0 665,1 767,0 804,7 779,4 770,0 784,8 742,4 727,8
Canadá / Canada 633,5 603,5 557,1 562,8 595,4 603,3 596,2 608,0 494,5 525,0
polonia / poland 474,0 502,8 503,2 530,5 511,5 497,1 452,0 429,4 439,0 425,0
kazajstán / kazakhstan 470,1 473,1 484,5 468,2 435,6 446,3 406,5 419,9 405,9 412,2
república dem.Congo / dem. republic Congo 33,0 32,3 56,9 69,6 97,7 131,4 144,6 239,2 299,3 384,9
México / Mexico 371,1 329,6 323,7 368,6 390,9 312,1 337,5 246,6 238,4 260,9
irán / iran 146,3 140,7 146,1 153,0 192,7 230,4 249,2 254,8 261,7 260,4
brasil / brazil 32,7 32,7 26,3 103,2 133,3 147,8 205,7 222,1 217,0 215,8
papúa nueva Guinea / papua new Guinea 203,8 211,3 202,3 173,4 193,0 194,4 169,2 159,7 166,7 159,8
argentina 191,7 204,0 199,0 177,1 187,3 180,1 180,2 156,9 143,1 140,3
laos - - - 1,7 30,5 60,8 62,5 89,0 121,6 132,0
Mongolia 136,4 134,7 131,6 130,0 129,0 132,3 133,2 129,4 132,3 127,7
Sudáfrica / South africa 141,9 90,0 89,3 85,7 96,6 98,7 106,4 117,8 116,1 112,6
bulgaria 97,1 84,4 80,1 79,6 94,5 110,4 102,7 108,8 107,7 110,1
Uzbekistán / Uzbekistan 97,3 80,0 82,0 82,8 103,5 103,5 103,5 103,5 79,5 80,4
Suecia / Sweden 74,3 72,0 83,1 82,4 87,1 86,7 62,9 57,7 55,4 76,5
portugal 82,9 77,2 77,5 95,7 89,5 78,6 90,2 89,0 86,5 74,0
turquía / turkey 74,7 74,7 60,8 49,8 47,8 57,2 74,7 82,4 72,4 65,2
Filipinas / philippines 24,2 20,0 20,4 16,0 16,3 17,7 22,9 21,2 49,6 58,9
españa / Spain 9,7 1,2 0,6 1,4 7,9 8,7 6,3 7,1 18,3 54,3
Mauritania 0,0 0,0 0,0 0,0 0,0 5,0 28,8 33,1 36,6 37,0
india 32,4 31,5 28,5 29,5 26,7 27,4 33,9 29,9 30,9 35,2
armenia 16,8 16,3 18,1 17,7 16,4 17,7 17,4 18,6 23,0 30,7
botswana 19,2 21,6 24,3 21,2 26,7 24,3 21,5 19,8 23,6 25,0
Serbia 31,0 34,6 13,7 13,2 11,3 13,2 16,5 17,6 19,4 22,5
paquistán / pakistan - - 5,4 14,7 17,7 18,7 18,8 18,7 19,6 19,4
Finlandia / Finland 11,6 14,4 14,9 15,5 15,0 13,0 13,6 13,3 14,6 14,7
oman - - - - - - 9,1 16,8 15,0 14,4
Georgia 11,8 13,1 15,2 13,0 5,8 14,6 11,3 18,7 16,6 13,5
Myanmar 25,8 27,5 27,9 31,8 34,5 19,5 15,1 6,9 9,8 11,9
Marruecos / Morocco 5,3 5,0 4,9 4,4 2,8 4,1 4,8 5,1 7,2 11,7
república dominicana / dominican republic 0,0 0,0 0,0 0,0 0,0 - - 2,4 11,5 9,5
Macedonia 6,8 5,6 0,7 - 5,7 8,4 8,4 9,6 8,9 9,4
Vietnam 1,6 1,1 1,2 2,0 3,1 11,4 12,5 5,8 5,9 8,3
tanzania 3,6 4,2 3,7 4,3 3,7 4,0 3,2 2,5 3,1 6,5
albania - - - - 1,7 0,4 1,3 3,7 6,5 5,5
Zimbabwe 2,1 2,5 2,8 2,4 2,6 2,6 2,7 2,8 3,6 4,6
Chipre / Cyprus 5,2 3,6 2,5 1,3 - 0,9 3,0 3,0 2,5 2,6
bolivia 0,0 0,1 0,3 0,6 0,7 0,2 0,6 0,7 0,9 2,1
arabia Saudita / Saudi arabia 0,8 0,6 0,6 0,7 0,7 0,7 0,7 3,6 1,7 1,5
rumania / romania 19,2 19,6 21,3 18,8 14,9 12,2 2,1 0,3 1,2 1,2
Colombia 2,2 1,9 1,6 1,7 1,9 0,6 1,2 1,1 1,2 0,8
namibia 14,5 18,0 16,2 13,5 10,2 6,3 5,8 8,8 - -
Japón / Japan 0,7 - - - - - - - - -
Cuba 0,3 - - - - - - - - -
otroS / other 12,0 12,0 12,0 12,0 12,0 12,1 12,2 12,3 12,3 12,7
totAl 13.756,7 13.565,4 13.653,0 14.673,5 15.150,1 15.180,6 15.548,0 15.668,1 15.810,0 16.102,9 Fuente / Source: -World Metal Statistics March 2011 and Yearbook 2010. - Comisión Chilena del Cobre: Cifras de producción de Chile / Chile data: Chilean Copper Commission.
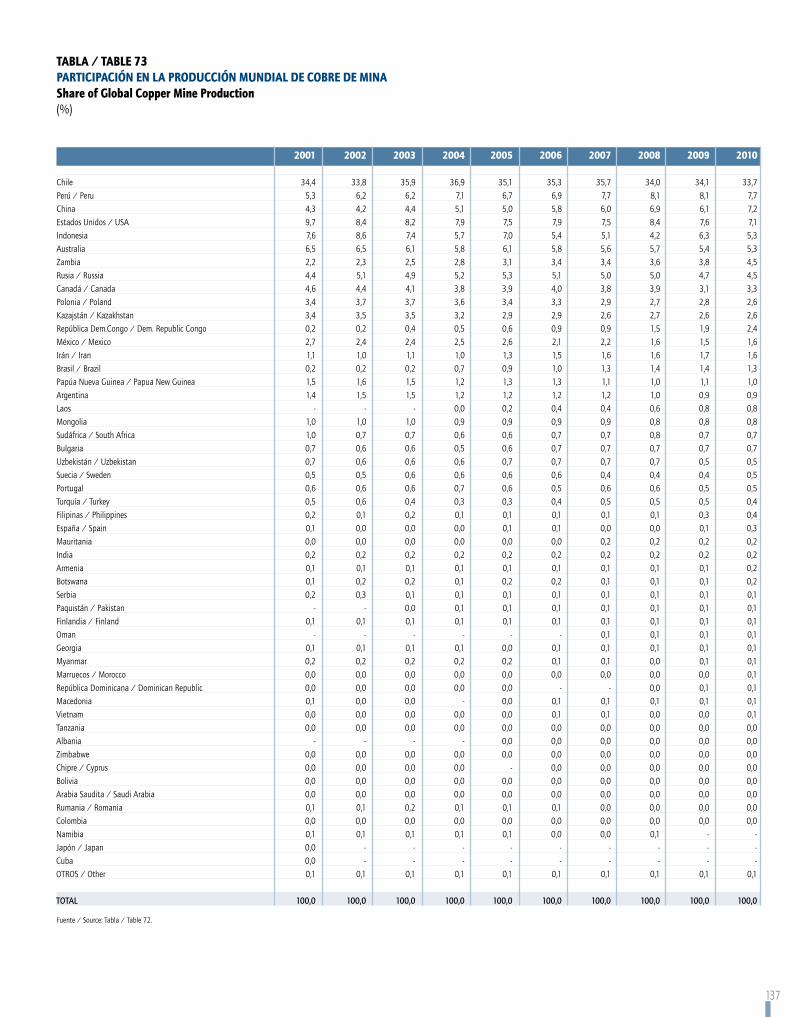
137
TABLA / TABLE 73 PARTICIPACIÓN EN LA PRODUCCIÓN MUNDIAL DE COBRE DE MINA Share of Global Copper Mine Production (%)
2001 2002 2003 2004 2005 2006 2007 2008 2009 2010
Chile 34,4 33,8 35,9 36,9 35,1 35,3 35,7 34,0 34,1 33,7
perú / peru 5,3 6,2 6,2 7,1 6,7 6,9 7,7 8,1 8,1 7,7
China 4,3 4,2 4,4 5,1 5,0 5,8 6,0 6,9 6,1 7,2
estados Unidos / USa 9,7 8,4 8,2 7,9 7,5 7,9 7,5 8,4 7,6 7,1
indonesia 7,6 8,6 7,4 5,7 7,0 5,4 5,1 4,2 6,3 5,3
australia 6,5 6,5 6,1 5,8 6,1 5,8 5,6 5,7 5,4 5,3
Zambia 2,2 2,3 2,5 2,8 3,1 3,4 3,4 3,6 3,8 4,5
rusia / russia 4,4 5,1 4,9 5,2 5,3 5,1 5,0 5,0 4,7 4,5
Canadá / Canada 4,6 4,4 4,1 3,8 3,9 4,0 3,8 3,9 3,1 3,3
polonia / poland 3,4 3,7 3,7 3,6 3,4 3,3 2,9 2,7 2,8 2,6
kazajstán / kazakhstan 3,4 3,5 3,5 3,2 2,9 2,9 2,6 2,7 2,6 2,6
república dem.Congo / dem. republic Congo 0,2 0,2 0,4 0,5 0,6 0,9 0,9 1,5 1,9 2,4
México / Mexico 2,7 2,4 2,4 2,5 2,6 2,1 2,2 1,6 1,5 1,6
irán / iran 1,1 1,0 1,1 1,0 1,3 1,5 1,6 1,6 1,7 1,6
brasil / brazil 0,2 0,2 0,2 0,7 0,9 1,0 1,3 1,4 1,4 1,3
papúa nueva Guinea / papua new Guinea 1,5 1,6 1,5 1,2 1,3 1,3 1,1 1,0 1,1 1,0
argentina 1,4 1,5 1,5 1,2 1,2 1,2 1,2 1,0 0,9 0,9
laos - - - 0,0 0,2 0,4 0,4 0,6 0,8 0,8
Mongolia 1,0 1,0 1,0 0,9 0,9 0,9 0,9 0,8 0,8 0,8
Sudáfrica / South africa 1,0 0,7 0,7 0,6 0,6 0,7 0,7 0,8 0,7 0,7
bulgaria 0,7 0,6 0,6 0,5 0,6 0,7 0,7 0,7 0,7 0,7
Uzbekistán / Uzbekistan 0,7 0,6 0,6 0,6 0,7 0,7 0,7 0,7 0,5 0,5
Suecia / Sweden 0,5 0,5 0,6 0,6 0,6 0,6 0,4 0,4 0,4 0,5
portugal 0,6 0,6 0,6 0,7 0,6 0,5 0,6 0,6 0,5 0,5
turquía / turkey 0,5 0,6 0,4 0,3 0,3 0,4 0,5 0,5 0,5 0,4
Filipinas / philippines 0,2 0,1 0,2 0,1 0,1 0,1 0,1 0,1 0,3 0,4
españa / Spain 0,1 0,0 0,0 0,0 0,1 0,1 0,0 0,0 0,1 0,3
Mauritania 0,0 0,0 0,0 0,0 0,0 0,0 0,2 0,2 0,2 0,2
india 0,2 0,2 0,2 0,2 0,2 0,2 0,2 0,2 0,2 0,2
armenia 0,1 0,1 0,1 0,1 0,1 0,1 0,1 0,1 0,1 0,2
botswana 0,1 0,2 0,2 0,1 0,2 0,2 0,1 0,1 0,1 0,2
Serbia 0,2 0,3 0,1 0,1 0,1 0,1 0,1 0,1 0,1 0,1
paquistán / pakistan - - 0,0 0,1 0,1 0,1 0,1 0,1 0,1 0,1
Finlandia / Finland 0,1 0,1 0,1 0,1 0,1 0,1 0,1 0,1 0,1 0,1
oman - - - - - - 0,1 0,1 0,1 0,1
Georgia 0,1 0,1 0,1 0,1 0,0 0,1 0,1 0,1 0,1 0,1
Myanmar 0,2 0,2 0,2 0,2 0,2 0,1 0,1 0,0 0,1 0,1
Marruecos / Morocco 0,0 0,0 0,0 0,0 0,0 0,0 0,0 0,0 0,0 0,1
república dominicana / dominican republic 0,0 0,0 0,0 0,0 0,0 - - 0,0 0,1 0,1
Macedonia 0,1 0,0 0,0 - 0,0 0,1 0,1 0,1 0,1 0,1
Vietnam 0,0 0,0 0,0 0,0 0,0 0,1 0,1 0,0 0,0 0,1
tanzania 0,0 0,0 0,0 0,0 0,0 0,0 0,0 0,0 0,0 0,0
albania - - - - 0,0 0,0 0,0 0,0 0,0 0,0
Zimbabwe 0,0 0,0 0,0 0,0 0,0 0,0 0,0 0,0 0,0 0,0
Chipre / Cyprus 0,0 0,0 0,0 0,0 - 0,0 0,0 0,0 0,0 0,0
bolivia 0,0 0,0 0,0 0,0 0,0 0,0 0,0 0,0 0,0 0,0
arabia Saudita / Saudi arabia 0,0 0,0 0,0 0,0 0,0 0,0 0,0 0,0 0,0 0,0
rumania / romania 0,1 0,1 0,2 0,1 0,1 0,1 0,0 0,0 0,0 0,0
Colombia 0,0 0,0 0,0 0,0 0,0 0,0 0,0 0,0 0,0 0,0
namibia 0,1 0,1 0,1 0,1 0,1 0,0 0,0 0,1 - -
Japón / Japan 0,0 - - - - - - - - -
Cuba 0,0 - - - - - - - - -
otroS / other 0,1 0,1 0,1 0,1 0,1 0,1 0,1 0,1 0,1 0,1
totAl 100,0 100,0 100,0 100,0 100,0 100,0 100,0 100,0 100,0 100,0
Fuente / Source: tabla / table 72.
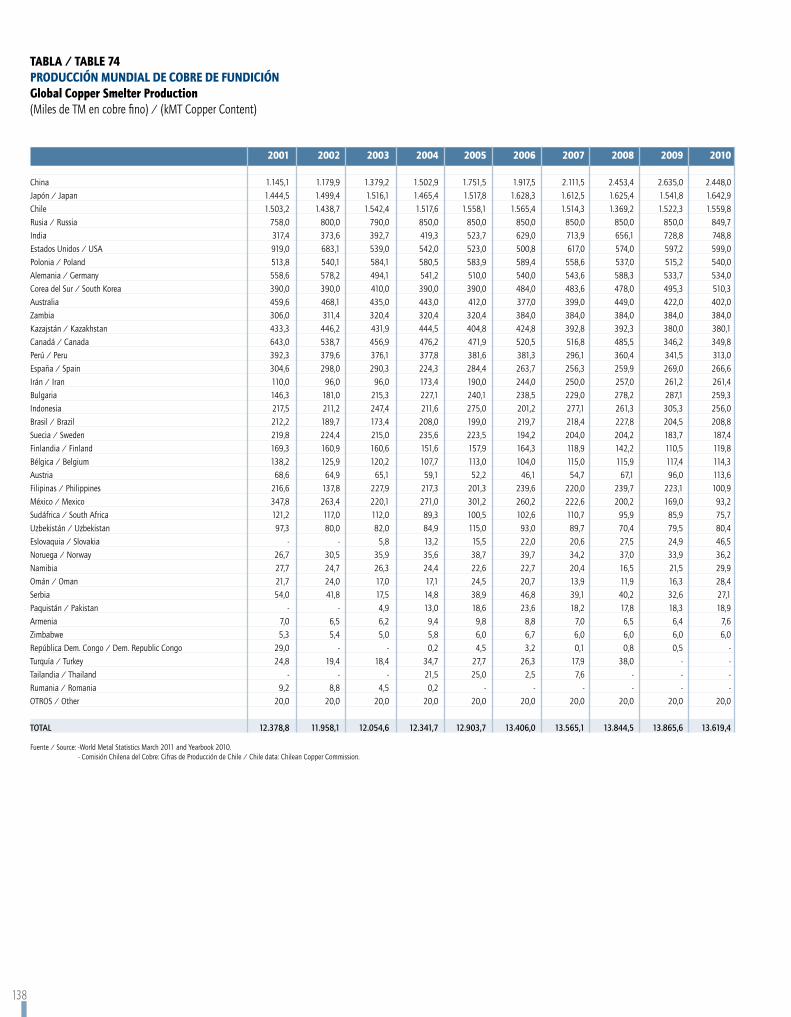
138
TABLA / TABLE 74 PRODUCCIÓN MUNDIAL DE COBRE DE FUNDICIÓN Global Copper Smelter Production(Miles de tM en cobre fino) / (kMt Copper Content)
2001 2002 2003 2004 2005 2006 2007 2008 2009 2010
China 1.145,1 1.179,9 1.379,2 1.502,9 1.751,5 1.917,5 2.111,5 2.453,4 2.635,0 2.448,0
Japón / Japan 1.444,5 1.499,4 1.516,1 1.465,4 1.517,8 1.628,3 1.612,5 1.625,4 1.541,8 1.642,9
Chile 1.503,2 1.438,7 1.542,4 1.517,6 1.558,1 1.565,4 1.514,3 1.369,2 1.522,3 1.559,8
rusia / russia 758,0 800,0 790,0 850,0 850,0 850,0 850,0 850,0 850,0 849,7
india 317,4 373,6 392,7 419,3 523,7 629,0 713,9 656,1 728,8 748,8
estados Unidos / USa 919,0 683,1 539,0 542,0 523,0 500,8 617,0 574,0 597,2 599,0
polonia / poland 513,8 540,1 584,1 580,5 583,9 589,4 558,6 537,0 515,2 540,0
alemania / Germany 558,6 578,2 494,1 541,2 510,0 540,0 543,6 588,3 533,7 534,0
Corea del Sur / South korea 390,0 390,0 410,0 390,0 390,0 484,0 483,6 478,0 495,3 510,3
australia 459,6 468,1 435,0 443,0 412,0 377,0 399,0 449,0 422,0 402,0
Zambia 306,0 311,4 320,4 320,4 320,4 384,0 384,0 384,0 384,0 384,0
kazajstán / kazakhstan 433,3 446,2 431,9 444,5 404,8 424,8 392,8 392,3 380,0 380,1
Canadá / Canada 643,0 538,7 456,9 476,2 471,9 520,5 516,8 485,5 346,2 349,8
perú / peru 392,3 379,6 376,1 377,8 381,6 381,3 296,1 360,4 341,5 313,0
españa / Spain 304,6 298,0 290,3 224,3 284,4 263,7 256,3 259,9 269,0 266,6
irán / iran 110,0 96,0 96,0 173,4 190,0 244,0 250,0 257,0 261,2 261,4
bulgaria 146,3 181,0 215,3 227,1 240,1 238,5 229,0 278,2 287,1 259,3
indonesia 217,5 211,2 247,4 211,6 275,0 201,2 277,1 261,3 305,3 256,0
brasil / brazil 212,2 189,7 173,4 208,0 199,0 219,7 218,4 227,8 204,5 208,8
Suecia / Sweden 219,8 224,4 215,0 235,6 223,5 194,2 204,0 204,2 183,7 187,4
Finlandia / Finland 169,3 160,9 160,6 151,6 157,9 164,3 118,9 142,2 110,5 119,8
bélgica / belgium 138,2 125,9 120,2 107,7 113,0 104,0 115,0 115,9 117,4 114,3
austria 68,6 64,9 65,1 59,1 52,2 46,1 54,7 67,1 96,0 113,6
Filipinas / philippines 216,6 137,8 227,9 217,3 201,3 239,6 220,0 239,7 223,1 100,9
México / Mexico 347,8 263,4 220,1 271,0 301,2 260,2 222,6 200,2 169,0 93,2
Sudáfrica / South africa 121,2 117,0 112,0 89,3 100,5 102,6 110,7 95,9 85,9 75,7
Uzbekistán / Uzbekistan 97,3 80,0 82,0 84,9 115,0 93,0 89,7 70,4 79,5 80,4
eslovaquia / Slovakia - - 5,8 13,2 15,5 22,0 20,6 27,5 24,9 46,5
noruega / norway 26,7 30,5 35,9 35,6 38,7 39,7 34,2 37,0 33,9 36,2
namibia 27,7 24,7 26,3 24,4 22,6 22,7 20,4 16,5 21,5 29,9
omán / oman 21,7 24,0 17,0 17,1 24,5 20,7 13,9 11,9 16,3 28,4
Serbia 54,0 41,8 17,5 14,8 38,9 46,8 39,1 40,2 32,6 27,1
paquistán / pakistan - - 4,9 13,0 18,6 23,6 18,2 17,8 18,3 18,9
armenia 7,0 6,5 6,2 9,4 9,8 8,8 7,0 6,5 6,4 7,6
Zimbabwe 5,3 5,4 5,0 5,8 6,0 6,7 6,0 6,0 6,0 6,0
república dem. Congo / dem. republic Congo 29,0 - - 0,2 4,5 3,2 0,1 0,8 0,5 -
turquía / turkey 24,8 19,4 18,4 34,7 27,7 26,3 17,9 38,0 - -
tailandia / thailand - - - 21,5 25,0 2,5 7,6 - - -
rumania / romania 9,2 8,8 4,5 0,2 - - - - - -
otroS / other 20,0 20,0 20,0 20,0 20,0 20,0 20,0 20,0 20,0 20,0
totAl 12.378,8 11.958,1 12.054,6 12.341,7 12.903,7 13.406,0 13.565,1 13.844,5 13.865,6 13.619,4
Fuente / Source: -World Metal Statistics March 2011 and Yearbook 2010. - Comisión Chilena del Cobre: Cifras de producción de Chile / Chile data: Chilean Copper Commission.
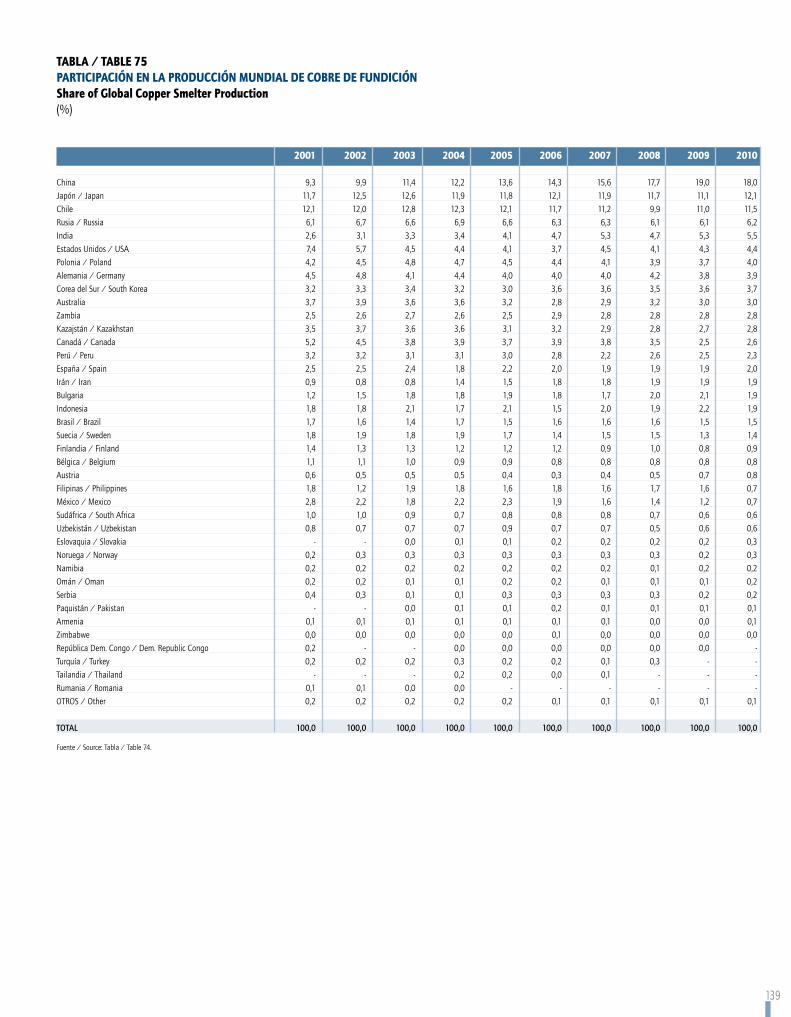
139
TABLA / TABLE 75 PARTICIPACIÓN EN LA PRODUCCIÓN MUNDIAL DE COBRE DE FUNDICIÓN Share of Global Copper Smelter Production(%)
2001 2002 2003 2004 2005 2006 2007 2008 2009 2010
China 9,3 9,9 11,4 12,2 13,6 14,3 15,6 17,7 19,0 18,0
Japón / Japan 11,7 12,5 12,6 11,9 11,8 12,1 11,9 11,7 11,1 12,1
Chile 12,1 12,0 12,8 12,3 12,1 11,7 11,2 9,9 11,0 11,5
rusia / russia 6,1 6,7 6,6 6,9 6,6 6,3 6,3 6,1 6,1 6,2
india 2,6 3,1 3,3 3,4 4,1 4,7 5,3 4,7 5,3 5,5
estados Unidos / USa 7,4 5,7 4,5 4,4 4,1 3,7 4,5 4,1 4,3 4,4
polonia / poland 4,2 4,5 4,8 4,7 4,5 4,4 4,1 3,9 3,7 4,0
alemania / Germany 4,5 4,8 4,1 4,4 4,0 4,0 4,0 4,2 3,8 3,9
Corea del Sur / South korea 3,2 3,3 3,4 3,2 3,0 3,6 3,6 3,5 3,6 3,7
australia 3,7 3,9 3,6 3,6 3,2 2,8 2,9 3,2 3,0 3,0
Zambia 2,5 2,6 2,7 2,6 2,5 2,9 2,8 2,8 2,8 2,8
kazajstán / kazakhstan 3,5 3,7 3,6 3,6 3,1 3,2 2,9 2,8 2,7 2,8
Canadá / Canada 5,2 4,5 3,8 3,9 3,7 3,9 3,8 3,5 2,5 2,6
perú / peru 3,2 3,2 3,1 3,1 3,0 2,8 2,2 2,6 2,5 2,3
españa / Spain 2,5 2,5 2,4 1,8 2,2 2,0 1,9 1,9 1,9 2,0
irán / iran 0,9 0,8 0,8 1,4 1,5 1,8 1,8 1,9 1,9 1,9
bulgaria 1,2 1,5 1,8 1,8 1,9 1,8 1,7 2,0 2,1 1,9
indonesia 1,8 1,8 2,1 1,7 2,1 1,5 2,0 1,9 2,2 1,9
brasil / brazil 1,7 1,6 1,4 1,7 1,5 1,6 1,6 1,6 1,5 1,5
Suecia / Sweden 1,8 1,9 1,8 1,9 1,7 1,4 1,5 1,5 1,3 1,4
Finlandia / Finland 1,4 1,3 1,3 1,2 1,2 1,2 0,9 1,0 0,8 0,9
bélgica / belgium 1,1 1,1 1,0 0,9 0,9 0,8 0,8 0,8 0,8 0,8
austria 0,6 0,5 0,5 0,5 0,4 0,3 0,4 0,5 0,7 0,8
Filipinas / philippines 1,8 1,2 1,9 1,8 1,6 1,8 1,6 1,7 1,6 0,7
México / Mexico 2,8 2,2 1,8 2,2 2,3 1,9 1,6 1,4 1,2 0,7
Sudáfrica / South africa 1,0 1,0 0,9 0,7 0,8 0,8 0,8 0,7 0,6 0,6
Uzbekistán / Uzbekistan 0,8 0,7 0,7 0,7 0,9 0,7 0,7 0,5 0,6 0,6
eslovaquia / Slovakia - - 0,0 0,1 0,1 0,2 0,2 0,2 0,2 0,3
noruega / norway 0,2 0,3 0,3 0,3 0,3 0,3 0,3 0,3 0,2 0,3
namibia 0,2 0,2 0,2 0,2 0,2 0,2 0,2 0,1 0,2 0,2
omán / oman 0,2 0,2 0,1 0,1 0,2 0,2 0,1 0,1 0,1 0,2
Serbia 0,4 0,3 0,1 0,1 0,3 0,3 0,3 0,3 0,2 0,2
paquistán / pakistan - - 0,0 0,1 0,1 0,2 0,1 0,1 0,1 0,1
armenia 0,1 0,1 0,1 0,1 0,1 0,1 0,1 0,0 0,0 0,1
Zimbabwe 0,0 0,0 0,0 0,0 0,0 0,1 0,0 0,0 0,0 0,0
república dem. Congo / dem. republic Congo 0,2 - - 0,0 0,0 0,0 0,0 0,0 0,0 -
turquía / turkey 0,2 0,2 0,2 0,3 0,2 0,2 0,1 0,3 - -
tailandia / thailand - - - 0,2 0,2 0,0 0,1 - - -
rumania / romania 0,1 0,1 0,0 0,0 - - - - - -
otroS / other 0,2 0,2 0,2 0,2 0,2 0,1 0,1 0,1 0,1 0,1
totAl 100,0 100,0 100,0 100,0 100,0 100,0 100,0 100,0 100,0 100,0
Fuente / Source: tabla / table 74.
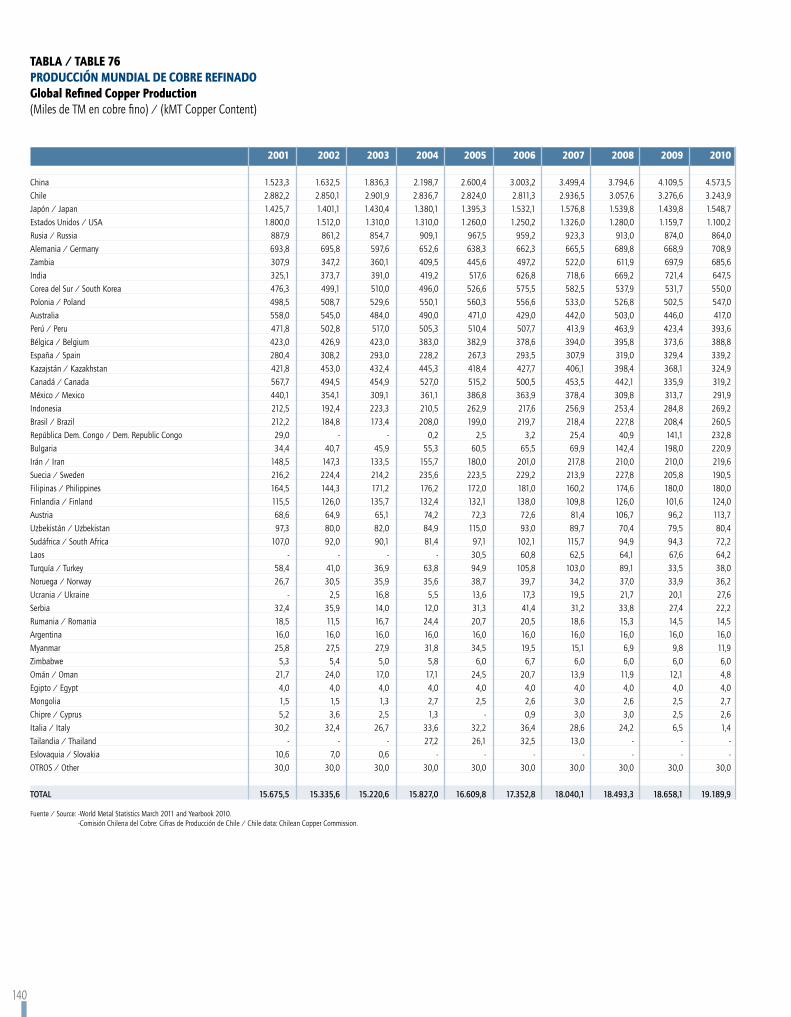
140
TABLA / TABLE 76 PRODUCCIÓN MUNDIAL DE COBRE REFINADO Global Refined Copper Production(Miles de tM en cobre fino) / (kMt Copper Content)
2001 2002 2003 2004 2005 2006 2007 2008 2009 2010
China 1.523,3 1.632,5 1.836,3 2.198,7 2.600,4 3.003,2 3.499,4 3.794,6 4.109,5 4.573,5
Chile 2.882,2 2.850,1 2.901,9 2.836,7 2.824,0 2.811,3 2.936,5 3.057,6 3.276,6 3.243,9
Japón / Japan 1.425,7 1.401,1 1.430,4 1.380,1 1.395,3 1.532,1 1.576,8 1.539,8 1.439,8 1.548,7
estados Unidos / USa 1.800,0 1.512,0 1.310,0 1.310,0 1.260,0 1.250,2 1.326,0 1.280,0 1.159,7 1.100,2
rusia / russia 887,9 861,2 854,7 909,1 967,5 959,2 923,3 913,0 874,0 864,0
alemania / Germany 693,8 695,8 597,6 652,6 638,3 662,3 665,5 689,8 668,9 708,9
Zambia 307,9 347,2 360,1 409,5 445,6 497,2 522,0 611,9 697,9 685,6
india 325,1 373,7 391,0 419,2 517,6 626,8 718,6 669,2 721,4 647,5
Corea del Sur / South korea 476,3 499,1 510,0 496,0 526,6 575,5 582,5 537,9 531,7 550,0
polonia / poland 498,5 508,7 529,6 550,1 560,3 556,6 533,0 526,8 502,5 547,0
australia 558,0 545,0 484,0 490,0 471,0 429,0 442,0 503,0 446,0 417,0
perú / peru 471,8 502,8 517,0 505,3 510,4 507,7 413,9 463,9 423,4 393,6
bélgica / belgium 423,0 426,9 423,0 383,0 382,9 378,6 394,0 395,8 373,6 388,8
españa / Spain 280,4 308,2 293,0 228,2 267,3 293,5 307,9 319,0 329,4 339,2
kazajstán / kazakhstan 421,8 453,0 432,4 445,3 418,4 427,7 406,1 398,4 368,1 324,9
Canadá / Canada 567,7 494,5 454,9 527,0 515,2 500,5 453,5 442,1 335,9 319,2
México / Mexico 440,1 354,1 309,1 361,1 386,8 363,9 378,4 309,8 313,7 291,9
indonesia 212,5 192,4 223,3 210,5 262,9 217,6 256,9 253,4 284,8 269,2
brasil / brazil 212,2 184,8 173,4 208,0 199,0 219,7 218,4 227,8 208,4 260,5
república dem. Congo / dem. republic Congo 29,0 - - 0,2 2,5 3,2 25,4 40,9 141,1 232,8
bulgaria 34,4 40,7 45,9 55,3 60,5 65,5 69,9 142,4 198,0 220,9
irán / iran 148,5 147,3 133,5 155,7 180,0 201,0 217,8 210,0 210,0 219,6
Suecia / Sweden 216,2 224,4 214,2 235,6 223,5 229,2 213,9 227,8 205,8 190,5
Filipinas / philippines 164,5 144,3 171,2 176,2 172,0 181,0 160,2 174,6 180,0 180,0
Finlandia / Finland 115,5 126,0 135,7 132,4 132,1 138,0 109,8 126,0 101,6 124,0
austria 68,6 64,9 65,1 74,2 72,3 72,6 81,4 106,7 96,2 113,7
Uzbekistán / Uzbekistan 97,3 80,0 82,0 84,9 115,0 93,0 89,7 70,4 79,5 80,4
Sudáfrica / South africa 107,0 92,0 90,1 81,4 97,1 102,1 115,7 94,9 94,3 72,2
laos - - - - 30,5 60,8 62,5 64,1 67,6 64,2
turquía / turkey 58,4 41,0 36,9 63,8 94,9 105,8 103,0 89,1 33,5 38,0
noruega / norway 26,7 30,5 35,9 35,6 38,7 39,7 34,2 37,0 33,9 36,2
Ucrania / Ukraine - 2,5 16,8 5,5 13,6 17,3 19,5 21,7 20,1 27,6
Serbia 32,4 35,9 14,0 12,0 31,3 41,4 31,2 33,8 27,4 22,2
rumania / romania 18,5 11,5 16,7 24,4 20,7 20,5 18,6 15,3 14,5 14,5
argentina 16,0 16,0 16,0 16,0 16,0 16,0 16,0 16,0 16,0 16,0
Myanmar 25,8 27,5 27,9 31,8 34,5 19,5 15,1 6,9 9,8 11,9
Zimbabwe 5,3 5,4 5,0 5,8 6,0 6,7 6,0 6,0 6,0 6,0
omán / oman 21,7 24,0 17,0 17,1 24,5 20,7 13,9 11,9 12,1 4,8
egipto / egypt 4,0 4,0 4,0 4,0 4,0 4,0 4,0 4,0 4,0 4,0
Mongolia 1,5 1,5 1,3 2,7 2,5 2,6 3,0 2,6 2,5 2,7
Chipre / Cyprus 5,2 3,6 2,5 1,3 - 0,9 3,0 3,0 2,5 2,6
italia / italy 30,2 32,4 26,7 33,6 32,2 36,4 28,6 24,2 6,5 1,4
tailandia / thailand - - - 27,2 26,1 32,5 13,0 - - -
eslovaquia / Slovakia 10,6 7,0 0,6 - - - - - - -
otroS / other 30,0 30,0 30,0 30,0 30,0 30,0 30,0 30,0 30,0 30,0
totAl 15.675,5 15.335,6 15.220,6 15.827,0 16.609,8 17.352,8 18.040,1 18.493,3 18.658,1 19.189,9 Fuente / Source: -World Metal Statistics March 2011 and Yearbook 2010. -Comisión Chilena del Cobre: Cifras de producción de Chile / Chile data: Chilean Copper Commission.
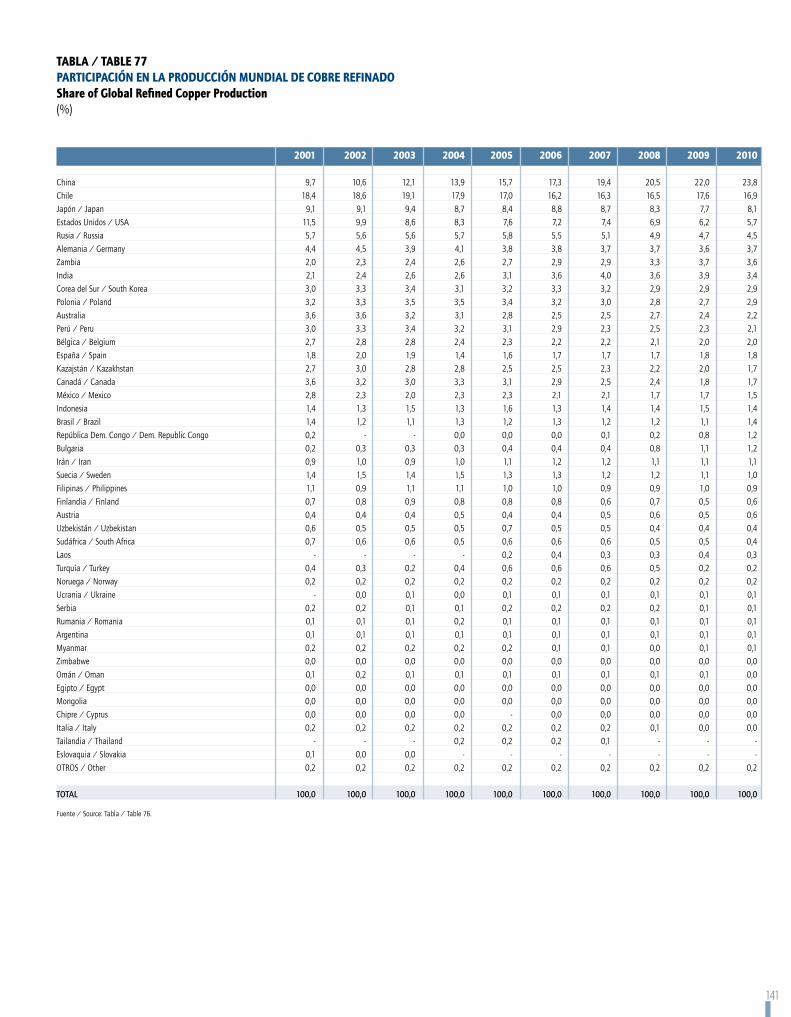
141
TABLA / TABLE 77 PARTICIPACIÓN EN LA PRODUCCIÓN MUNDIAL DE COBRE REFINADOShare of Global Refined Copper Production(%)
2001 2002 2003 2004 2005 2006 2007 2008 2009 2010
China 9,7 10,6 12,1 13,9 15,7 17,3 19,4 20,5 22,0 23,8
Chile 18,4 18,6 19,1 17,9 17,0 16,2 16,3 16,5 17,6 16,9
Japón / Japan 9,1 9,1 9,4 8,7 8,4 8,8 8,7 8,3 7,7 8,1
estados Unidos / USa 11,5 9,9 8,6 8,3 7,6 7,2 7,4 6,9 6,2 5,7
rusia / russia 5,7 5,6 5,6 5,7 5,8 5,5 5,1 4,9 4,7 4,5
alemania / Germany 4,4 4,5 3,9 4,1 3,8 3,8 3,7 3,7 3,6 3,7
Zambia 2,0 2,3 2,4 2,6 2,7 2,9 2,9 3,3 3,7 3,6
india 2,1 2,4 2,6 2,6 3,1 3,6 4,0 3,6 3,9 3,4
Corea del Sur / South korea 3,0 3,3 3,4 3,1 3,2 3,3 3,2 2,9 2,9 2,9
polonia / poland 3,2 3,3 3,5 3,5 3,4 3,2 3,0 2,8 2,7 2,9
australia 3,6 3,6 3,2 3,1 2,8 2,5 2,5 2,7 2,4 2,2
perú / peru 3,0 3,3 3,4 3,2 3,1 2,9 2,3 2,5 2,3 2,1
bélgica / belgium 2,7 2,8 2,8 2,4 2,3 2,2 2,2 2,1 2,0 2,0
españa / Spain 1,8 2,0 1,9 1,4 1,6 1,7 1,7 1,7 1,8 1,8
kazajstán / kazakhstan 2,7 3,0 2,8 2,8 2,5 2,5 2,3 2,2 2,0 1,7
Canadá / Canada 3,6 3,2 3,0 3,3 3,1 2,9 2,5 2,4 1,8 1,7
México / Mexico 2,8 2,3 2,0 2,3 2,3 2,1 2,1 1,7 1,7 1,5
indonesia 1,4 1,3 1,5 1,3 1,6 1,3 1,4 1,4 1,5 1,4
brasil / brazil 1,4 1,2 1,1 1,3 1,2 1,3 1,2 1,2 1,1 1,4
república dem. Congo / dem. republic Congo 0,2 - - 0,0 0,0 0,0 0,1 0,2 0,8 1,2
bulgaria 0,2 0,3 0,3 0,3 0,4 0,4 0,4 0,8 1,1 1,2
irán / iran 0,9 1,0 0,9 1,0 1,1 1,2 1,2 1,1 1,1 1,1
Suecia / Sweden 1,4 1,5 1,4 1,5 1,3 1,3 1,2 1,2 1,1 1,0
Filipinas / philippines 1,1 0,9 1,1 1,1 1,0 1,0 0,9 0,9 1,0 0,9
Finlandia / Finland 0,7 0,8 0,9 0,8 0,8 0,8 0,6 0,7 0,5 0,6
austria 0,4 0,4 0,4 0,5 0,4 0,4 0,5 0,6 0,5 0,6
Uzbekistán / Uzbekistan 0,6 0,5 0,5 0,5 0,7 0,5 0,5 0,4 0,4 0,4
Sudáfrica / South africa 0,7 0,6 0,6 0,5 0,6 0,6 0,6 0,5 0,5 0,4
laos - - - - 0,2 0,4 0,3 0,3 0,4 0,3
turquía / turkey 0,4 0,3 0,2 0,4 0,6 0,6 0,6 0,5 0,2 0,2
noruega / norway 0,2 0,2 0,2 0,2 0,2 0,2 0,2 0,2 0,2 0,2
Ucrania / Ukraine - 0,0 0,1 0,0 0,1 0,1 0,1 0,1 0,1 0,1
Serbia 0,2 0,2 0,1 0,1 0,2 0,2 0,2 0,2 0,1 0,1
rumania / romania 0,1 0,1 0,1 0,2 0,1 0,1 0,1 0,1 0,1 0,1
argentina 0,1 0,1 0,1 0,1 0,1 0,1 0,1 0,1 0,1 0,1
Myanmar 0,2 0,2 0,2 0,2 0,2 0,1 0,1 0,0 0,1 0,1
Zimbabwe 0,0 0,0 0,0 0,0 0,0 0,0 0,0 0,0 0,0 0,0
omán / oman 0,1 0,2 0,1 0,1 0,1 0,1 0,1 0,1 0,1 0,0
egipto / egypt 0,0 0,0 0,0 0,0 0,0 0,0 0,0 0,0 0,0 0,0
Mongolia 0,0 0,0 0,0 0,0 0,0 0,0 0,0 0,0 0,0 0,0
Chipre / Cyprus 0,0 0,0 0,0 0,0 - 0,0 0,0 0,0 0,0 0,0
italia / italy 0,2 0,2 0,2 0,2 0,2 0,2 0,2 0,1 0,0 0,0
tailandia / thailand - - - 0,2 0,2 0,2 0,1 - - -
eslovaquia / Slovakia 0,1 0,0 0,0 - - - - - - -
otroS / other 0,2 0,2 0,2 0,2 0,2 0,2 0,2 0,2 0,2 0,2
totAl 100,0 100,0 100,0 100,0 100,0 100,0 100,0 100,0 100,0 100,0 Fuente / Source: tabla / table 76.
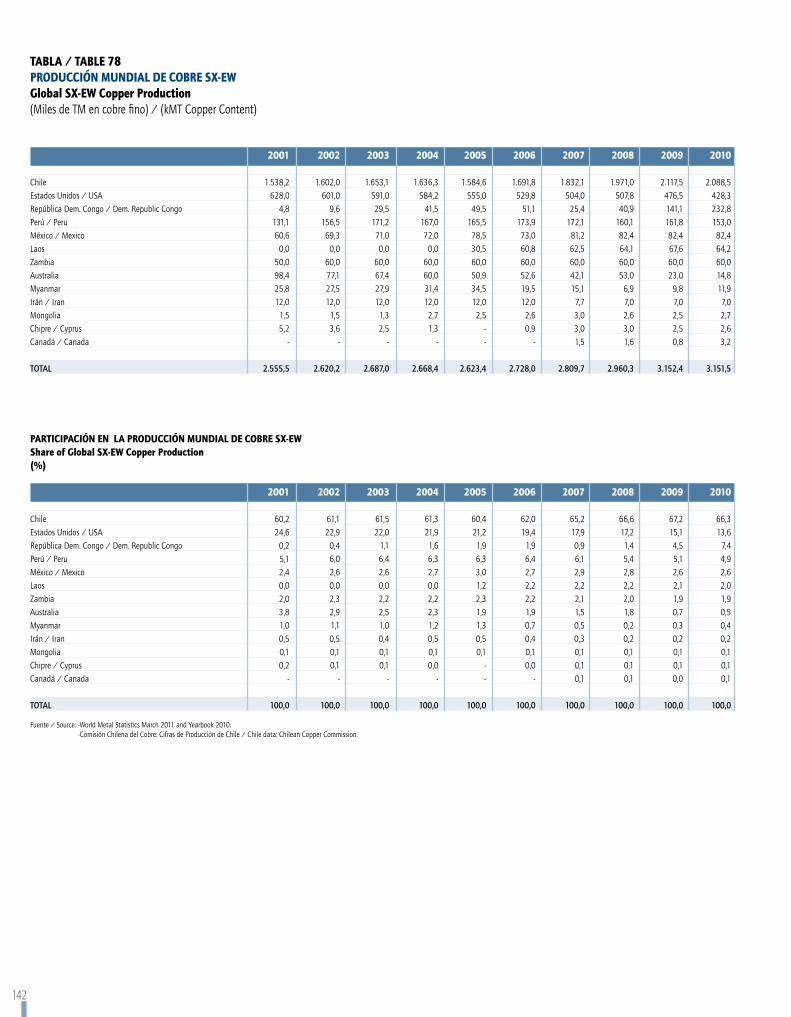
142
TABLA / TABLE 78 PRODUCCIÓN MUNDIAL DE COBRE SX-EWGlobal SX-EW Copper Production(Miles de tM en cobre fino) / (kMt Copper Content)
2001 2002 2003 2004 2005 2006 2007 2008 2009 2010
Chile 1.538,2 1.602,0 1.653,1 1.636,3 1.584,6 1.691,8 1.832,1 1.971,0 2.117,5 2.088,5
estados Unidos / USa 628,0 601,0 591,0 584,2 555,0 529,8 504,0 507,8 476,5 428,3
república dem. Congo / dem. republic Congo 4,8 9,6 29,5 41,5 49,5 51,1 25,4 40,9 141,1 232,8
perú / peru 131,1 156,5 171,2 167,0 165,5 173,9 172,1 160,1 161,8 153,0
México / Mexico 60,6 69,3 71,0 72,0 78,5 73,0 81,2 82,4 82,4 82,4
laos 0,0 0,0 0,0 0,0 30,5 60,8 62,5 64,1 67,6 64,2
Zambia 50,0 60,0 60,0 60,0 60,0 60,0 60,0 60,0 60,0 60,0
australia 98,4 77,1 67,4 60,0 50,9 52,6 42,1 53,0 23,0 14,8
Myanmar 25,8 27,5 27,9 31,4 34,5 19,5 15,1 6,9 9,8 11,9
irán / iran 12,0 12,0 12,0 12,0 12,0 12,0 7,7 7,0 7,0 7,0
Mongolia 1,5 1,5 1,3 2,7 2,5 2,6 3,0 2,6 2,5 2,7
Chipre / Cyprus 5,2 3,6 2,5 1,3 - 0,9 3,0 3,0 2,5 2,6
Canadá / Canada - - - - - - 1,5 1,6 0,8 3,2
totAl 2.555,5 2.620,2 2.687,0 2.668,4 2.623,4 2.728,0 2.809,7 2.960,3 3.152,4 3.151,5
PARTICIPACIÓN EN LA PRODUCCIÓN MUNDIAL DE COBRE SX-EW Share of Global SX-EW Copper Production (%)
2001 2002 2003 2004 2005 2006 2007 2008 2009 2010
Chile 60,2 61,1 61,5 61,3 60,4 62,0 65,2 66,6 67,2 66,3
estados Unidos / USa 24,6 22,9 22,0 21,9 21,2 19,4 17,9 17,2 15,1 13,6
república dem. Congo / dem. republic Congo 0,2 0,4 1,1 1,6 1,9 1,9 0,9 1,4 4,5 7,4
perú / peru 5,1 6,0 6,4 6,3 6,3 6,4 6,1 5,4 5,1 4,9
México / Mexico 2,4 2,6 2,6 2,7 3,0 2,7 2,9 2,8 2,6 2,6
laos 0,0 0,0 0,0 0,0 1,2 2,2 2,2 2,2 2,1 2,0
Zambia 2,0 2,3 2,2 2,2 2,3 2,2 2,1 2,0 1,9 1,9
australia 3,8 2,9 2,5 2,3 1,9 1,9 1,5 1,8 0,7 0,5
Myanmar 1,0 1,1 1,0 1,2 1,3 0,7 0,5 0,2 0,3 0,4
irán / iran 0,5 0,5 0,4 0,5 0,5 0,4 0,3 0,2 0,2 0,2
Mongolia 0,1 0,1 0,1 0,1 0,1 0,1 0,1 0,1 0,1 0,1
Chipre / Cyprus 0,2 0,1 0,1 0,0 - 0,0 0,1 0,1 0,1 0,1
Canadá / Canada - - - - - - 0,1 0,1 0,0 0,1
totAl 100,0 100,0 100,0 100,0 100,0 100,0 100,0 100,0 100,0 100,0
Fuente / Source: -World Metal Statistics March 2011 and Yearbook 2010. -Comisión Chilena del Cobre: Cifras de producción de Chile / Chile data: Chilean Copper Commission.
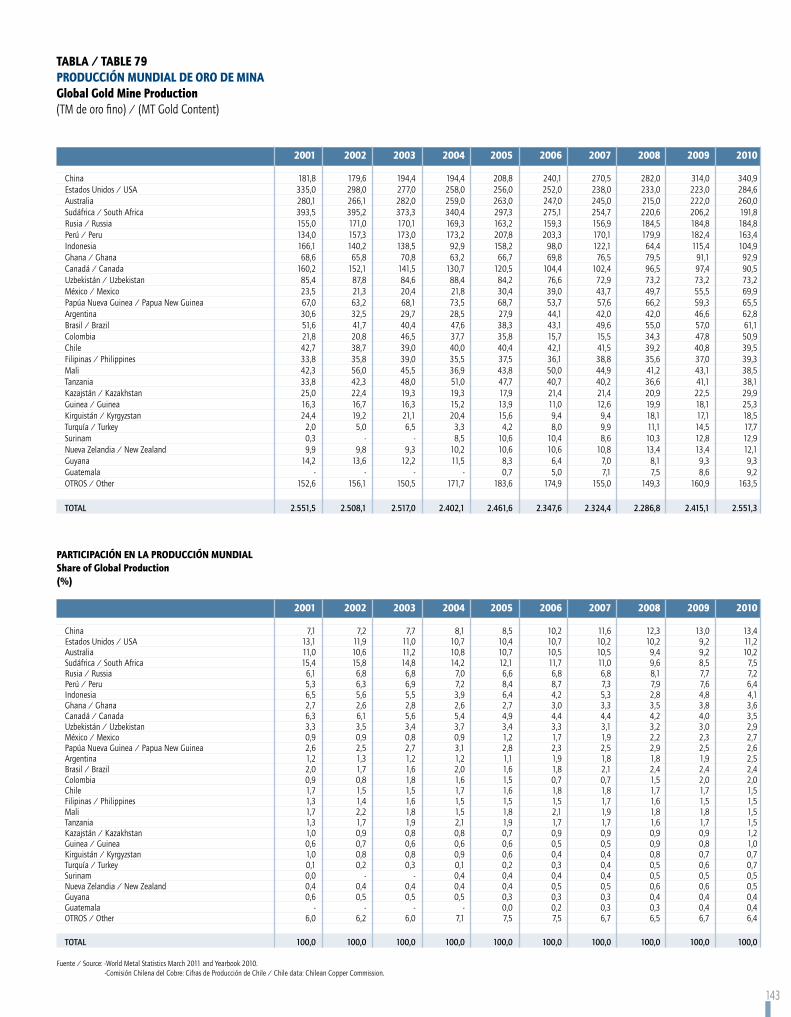
143
TABLA / TABLE 79PRODUCCIÓN MUNDIAL DE ORO DE MINAGlobal Gold Mine Production (tM de oro fino) / (Mt Gold Content)
2001 2002 2003 2004 2005 2006 2007 2008 2009 2010 China 181,8 179,6 194,4 194,4 208,8 240,1 270,5 282,0 314,0 340,9 estados Unidos / USa 335,0 298,0 277,0 258,0 256,0 252,0 238,0 233,0 223,0 284,6 australia 280,1 266,1 282,0 259,0 263,0 247,0 245,0 215,0 222,0 260,0 Sudáfrica / South africa 393,5 395,2 373,3 340,4 297,3 275,1 254,7 220,6 206,2 191,8 rusia / russia 155,0 171,0 170,1 169,3 163,2 159,3 156,9 184,5 184,8 184,8 perú / peru 134,0 157,3 173,0 173,2 207,8 203,3 170,1 179,9 182,4 163,4 indonesia 166,1 140,2 138,5 92,9 158,2 98,0 122,1 64,4 115,4 104,9 Ghana / Ghana 68,6 65,8 70,8 63,2 66,7 69,8 76,5 79,5 91,1 92,9 Canadá / Canada 160,2 152,1 141,5 130,7 120,5 104,4 102,4 96,5 97,4 90,5 Uzbekistán / Uzbekistan 85,4 87,8 84,6 88,4 84,2 76,6 72,9 73,2 73,2 73,2 México / Mexico 23,5 21,3 20,4 21,8 30,4 39,0 43,7 49,7 55,5 69,9 papúa nueva Guinea / papua new Guinea 67,0 63,2 68,1 73,5 68,7 53,7 57,6 66,2 59,3 65,5 argentina 30,6 32,5 29,7 28,5 27,9 44,1 42,0 42,0 46,6 62,8 brasil / brazil 51,6 41,7 40,4 47,6 38,3 43,1 49,6 55,0 57,0 61,1 Colombia 21,8 20,8 46,5 37,7 35,8 15,7 15,5 34,3 47,8 50,9 Chile 42,7 38,7 39,0 40,0 40,4 42,1 41,5 39,2 40,8 39,5 Filipinas / philippines 33,8 35,8 39,0 35,5 37,5 36,1 38,8 35,6 37,0 39,3 Mali 42,3 56,0 45,5 36,9 43,8 50,0 44,9 41,2 43,1 38,5 tanzania 33,8 42,3 48,0 51,0 47,7 40,7 40,2 36,6 41,1 38,1 kazajstán / kazakhstan 25,0 22,4 19,3 19,3 17,9 21,4 21,4 20,9 22,5 29,9 Guinea / Guinea 16,3 16,7 16,3 15,2 13,9 11,0 12,6 19,9 18,1 25,3 kirguistán / kyrgyzstan 24,4 19,2 21,1 20,4 15,6 9,4 9,4 18,1 17,1 18,5 turquía / turkey 2,0 5,0 6,5 3,3 4,2 8,0 9,9 11,1 14,5 17,7 Surinam 0,3 - - 8,5 10,6 10,4 8,6 10,3 12,8 12,9 nueva Zelandia / new Zealand 9,9 9,8 9,3 10,2 10,6 10,6 10,8 13,4 13,4 12,1 Guyana 14,2 13,6 12,2 11,5 8,3 6,4 7,0 8,1 9,3 9,3 Guatemala - - - - 0,7 5,0 7,1 7,5 8,6 9,2 otroS / other 152,6 156,1 150,5 171,7 183,6 174,9 155,0 149,3 160,9 163,5
totAl 2.551,5 2.508,1 2.517,0 2.402,1 2.461,6 2.347,6 2.324,4 2.286,8 2.415,1 2.551,3 PARTICIPACIÓN EN LA PRODUCCIÓN MUNDIALShare of Global Production (%)
2001 2002 2003 2004 2005 2006 2007 2008 2009 2010 China 7,1 7,2 7,7 8,1 8,5 10,2 11,6 12,3 13,0 13,4 estados Unidos / USa 13,1 11,9 11,0 10,7 10,4 10,7 10,2 10,2 9,2 11,2 australia 11,0 10,6 11,2 10,8 10,7 10,5 10,5 9,4 9,2 10,2 Sudáfrica / South africa 15,4 15,8 14,8 14,2 12,1 11,7 11,0 9,6 8,5 7,5 rusia / russia 6,1 6,8 6,8 7,0 6,6 6,8 6,8 8,1 7,7 7,2 perú / peru 5,3 6,3 6,9 7,2 8,4 8,7 7,3 7,9 7,6 6,4 indonesia 6,5 5,6 5,5 3,9 6,4 4,2 5,3 2,8 4,8 4,1 Ghana / Ghana 2,7 2,6 2,8 2,6 2,7 3,0 3,3 3,5 3,8 3,6 Canadá / Canada 6,3 6,1 5,6 5,4 4,9 4,4 4,4 4,2 4,0 3,5 Uzbekistán / Uzbekistan 3,3 3,5 3,4 3,7 3,4 3,3 3,1 3,2 3,0 2,9 México / Mexico 0,9 0,9 0,8 0,9 1,2 1,7 1,9 2,2 2,3 2,7 papúa nueva Guinea / papua new Guinea 2,6 2,5 2,7 3,1 2,8 2,3 2,5 2,9 2,5 2,6 argentina 1,2 1,3 1,2 1,2 1,1 1,9 1,8 1,8 1,9 2,5 brasil / brazil 2,0 1,7 1,6 2,0 1,6 1,8 2,1 2,4 2,4 2,4 Colombia 0,9 0,8 1,8 1,6 1,5 0,7 0,7 1,5 2,0 2,0 Chile 1,7 1,5 1,5 1,7 1,6 1,8 1,8 1,7 1,7 1,5 Filipinas / philippines 1,3 1,4 1,6 1,5 1,5 1,5 1,7 1,6 1,5 1,5 Mali 1,7 2,2 1,8 1,5 1,8 2,1 1,9 1,8 1,8 1,5 tanzania 1,3 1,7 1,9 2,1 1,9 1,7 1,7 1,6 1,7 1,5 kazajstán / kazakhstan 1,0 0,9 0,8 0,8 0,7 0,9 0,9 0,9 0,9 1,2 Guinea / Guinea 0,6 0,7 0,6 0,6 0,6 0,5 0,5 0,9 0,8 1,0 kirguistán / kyrgyzstan 1,0 0,8 0,8 0,9 0,6 0,4 0,4 0,8 0,7 0,7 turquía / turkey 0,1 0,2 0,3 0,1 0,2 0,3 0,4 0,5 0,6 0,7 Surinam 0,0 - - 0,4 0,4 0,4 0,4 0,5 0,5 0,5 nueva Zelandia / new Zealand 0,4 0,4 0,4 0,4 0,4 0,5 0,5 0,6 0,6 0,5 Guyana 0,6 0,5 0,5 0,5 0,3 0,3 0,3 0,4 0,4 0,4 Guatemala - - - - 0,0 0,2 0,3 0,3 0,4 0,4 otroS / other 6,0 6,2 6,0 7,1 7,5 7,5 6,7 6,5 6,7 6,4
totAl 100,0 100,0 100,0 100,0 100,0 100,0 100,0 100,0 100,0 100,0
Fuente / Source: -World Metal Statistics March 2011 and Yearbook 2010. -Comisión Chilena del Cobre: Cifras de producción de Chile / Chile data: Chilean Copper Commission.
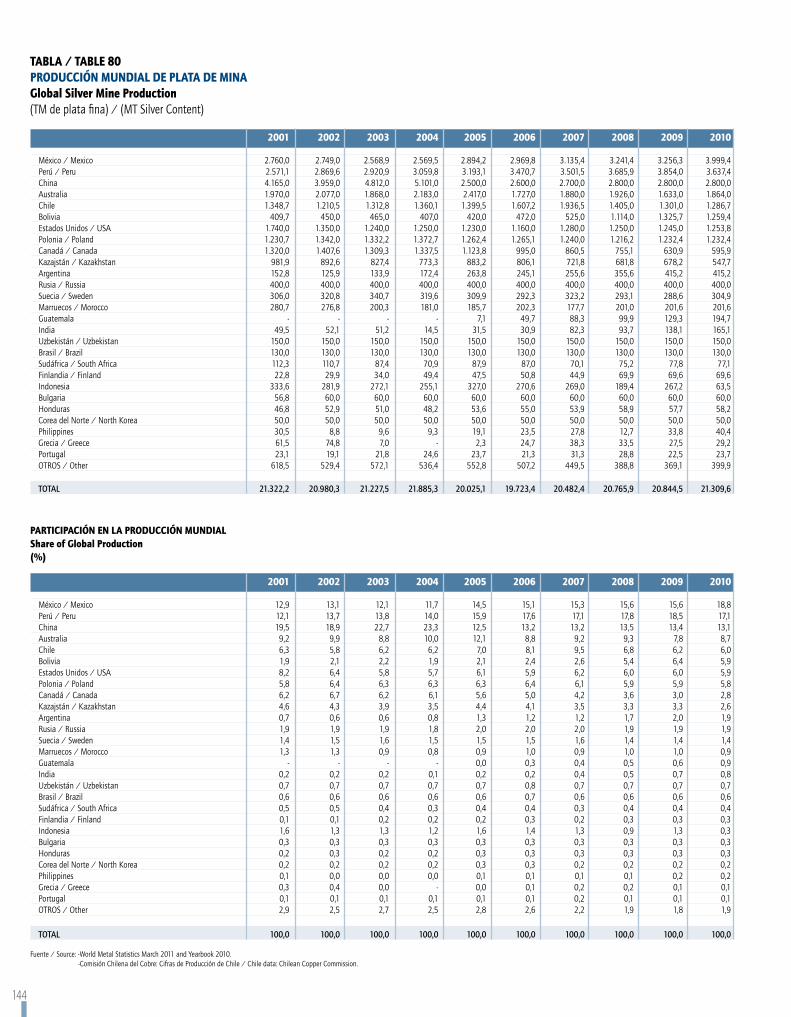
144
TABLA / TABLE 80 PRODUCCIÓN MUNDIAL DE PLATA DE MINAGlobal Silver Mine Production(tM de plata fina) / (Mt Silver Content) 2001 2002 2003 2004 2005 2006 2007 2008 2009 2010 México / Mexico 2.760,0 2.749,0 2.568,9 2.569,5 2.894,2 2.969,8 3.135,4 3.241,4 3.256,3 3.999,4 perú / peru 2.571,1 2.869,6 2.920,9 3.059,8 3.193,1 3.470,7 3.501,5 3.685,9 3.854,0 3.637,4 China 4.165,0 3.959,0 4.812,0 5.101,0 2.500,0 2.600,0 2.700,0 2.800,0 2.800,0 2.800,0 australia 1.970,0 2.077,0 1.868,0 2.183,0 2.417,0 1.727,0 1.880,0 1.926,0 1.633,0 1.864,0 Chile 1.348,7 1.210,5 1.312,8 1.360,1 1.399,5 1.607,2 1.936,5 1.405,0 1.301,0 1.286,7 bolivia 409,7 450,0 465,0 407,0 420,0 472,0 525,0 1.114,0 1.325,7 1.259,4 estados Unidos / USa 1.740,0 1.350,0 1.240,0 1.250,0 1.230,0 1.160,0 1.280,0 1.250,0 1.245,0 1.253,8 polonia / poland 1.230,7 1.342,0 1.332,2 1.372,7 1.262,4 1.265,1 1.240,0 1.216,2 1.232,4 1.232,4 Canadá / Canada 1.320,0 1.407,6 1.309,3 1.337,5 1.123,8 995,0 860,5 755,1 630,9 595,9 kazajstán / kazakhstan 981,9 892,6 827,4 773,3 883,2 806,1 721,8 681,8 678,2 547,7 argentina 152,8 125,9 133,9 172,4 263,8 245,1 255,6 355,6 415,2 415,2 rusia / russia 400,0 400,0 400,0 400,0 400,0 400,0 400,0 400,0 400,0 400,0 Suecia / Sweden 306,0 320,8 340,7 319,6 309,9 292,3 323,2 293,1 288,6 304,9 Marruecos / Morocco 280,7 276,8 200,3 181,0 185,7 202,3 177,7 201,0 201,6 201,6 Guatemala - - - - 7,1 49,7 88,3 99,9 129,3 194,7 india 49,5 52,1 51,2 14,5 31,5 30,9 82,3 93,7 138,1 165,1 Uzbekistán / Uzbekistan 150,0 150,0 150,0 150,0 150,0 150,0 150,0 150,0 150,0 150,0 brasil / brazil 130,0 130,0 130,0 130,0 130,0 130,0 130,0 130,0 130,0 130,0 Sudáfrica / South africa 112,3 110,7 87,4 70,9 87,9 87,0 70,1 75,2 77,8 77,1 Finlandia / Finland 22,8 29,9 34,0 49,4 47,5 50,8 44,9 69,9 69,6 69,6 indonesia 333,6 281,9 272,1 255,1 327,0 270,6 269,0 189,4 267,2 63,5 bulgaria 56,8 60,0 60,0 60,0 60,0 60,0 60,0 60,0 60,0 60,0 honduras 46,8 52,9 51,0 48,2 53,6 55,0 53,9 58,9 57,7 58,2 Corea del norte / north korea 50,0 50,0 50,0 50,0 50,0 50,0 50,0 50,0 50,0 50,0 philippines 30,5 8,8 9,6 9,3 19,1 23,5 27,8 12,7 33,8 40,4 Grecia / Greece 61,5 74,8 7,0 - 2,3 24,7 38,3 33,5 27,5 29,2 portugal 23,1 19,1 21,8 24,6 23,7 21,3 31,3 28,8 22,5 23,7 otroS / other 618,5 529,4 572,1 536,4 552,8 507,2 449,5 388,8 369,1 399,9 totAl 21.322,2 20.980,3 21.227,5 21.885,3 20.025,1 19.723,4 20.482,4 20.765,9 20.844,5 21.309,6
PARTICIPACIÓN EN LA PRODUCCIÓN MUNDIAL Share of Global Production(%) 2001 2002 2003 2004 2005 2006 2007 2008 2009 2010 México / Mexico 12,9 13,1 12,1 11,7 14,5 15,1 15,3 15,6 15,6 18,8 perú / peru 12,1 13,7 13,8 14,0 15,9 17,6 17,1 17,8 18,5 17,1 China 19,5 18,9 22,7 23,3 12,5 13,2 13,2 13,5 13,4 13,1 australia 9,2 9,9 8,8 10,0 12,1 8,8 9,2 9,3 7,8 8,7 Chile 6,3 5,8 6,2 6,2 7,0 8,1 9,5 6,8 6,2 6,0 bolivia 1,9 2,1 2,2 1,9 2,1 2,4 2,6 5,4 6,4 5,9 estados Unidos / USa 8,2 6,4 5,8 5,7 6,1 5,9 6,2 6,0 6,0 5,9 polonia / poland 5,8 6,4 6,3 6,3 6,3 6,4 6,1 5,9 5,9 5,8 Canadá / Canada 6,2 6,7 6,2 6,1 5,6 5,0 4,2 3,6 3,0 2,8 kazajstán / kazakhstan 4,6 4,3 3,9 3,5 4,4 4,1 3,5 3,3 3,3 2,6 argentina 0,7 0,6 0,6 0,8 1,3 1,2 1,2 1,7 2,0 1,9 rusia / russia 1,9 1,9 1,9 1,8 2,0 2,0 2,0 1,9 1,9 1,9 Suecia / Sweden 1,4 1,5 1,6 1,5 1,5 1,5 1,6 1,4 1,4 1,4 Marruecos / Morocco 1,3 1,3 0,9 0,8 0,9 1,0 0,9 1,0 1,0 0,9 Guatemala - - - - 0,0 0,3 0,4 0,5 0,6 0,9 india 0,2 0,2 0,2 0,1 0,2 0,2 0,4 0,5 0,7 0,8 Uzbekistán / Uzbekistan 0,7 0,7 0,7 0,7 0,7 0,8 0,7 0,7 0,7 0,7 brasil / brazil 0,6 0,6 0,6 0,6 0,6 0,7 0,6 0,6 0,6 0,6 Sudáfrica / South africa 0,5 0,5 0,4 0,3 0,4 0,4 0,3 0,4 0,4 0,4 Finlandia / Finland 0,1 0,1 0,2 0,2 0,2 0,3 0,2 0,3 0,3 0,3 indonesia 1,6 1,3 1,3 1,2 1,6 1,4 1,3 0,9 1,3 0,3 bulgaria 0,3 0,3 0,3 0,3 0,3 0,3 0,3 0,3 0,3 0,3 honduras 0,2 0,3 0,2 0,2 0,3 0,3 0,3 0,3 0,3 0,3 Corea del norte / north korea 0,2 0,2 0,2 0,2 0,3 0,3 0,2 0,2 0,2 0,2 philippines 0,1 0,0 0,0 0,0 0,1 0,1 0,1 0,1 0,2 0,2 Grecia / Greece 0,3 0,4 0,0 - 0,0 0,1 0,2 0,2 0,1 0,1 portugal 0,1 0,1 0,1 0,1 0,1 0,1 0,2 0,1 0,1 0,1 otroS / other 2,9 2,5 2,7 2,5 2,8 2,6 2,2 1,9 1,8 1,9
totAl 100,0 100,0 100,0 100,0 100,0 100,0 100,0 100,0 100,0 100,0 Fuente / Source: -World Metal Statistics March 2011 and Yearbook 2010. -Comisión Chilena del Cobre: Cifras de producción de Chile / Chile data: Chilean Copper Commission.
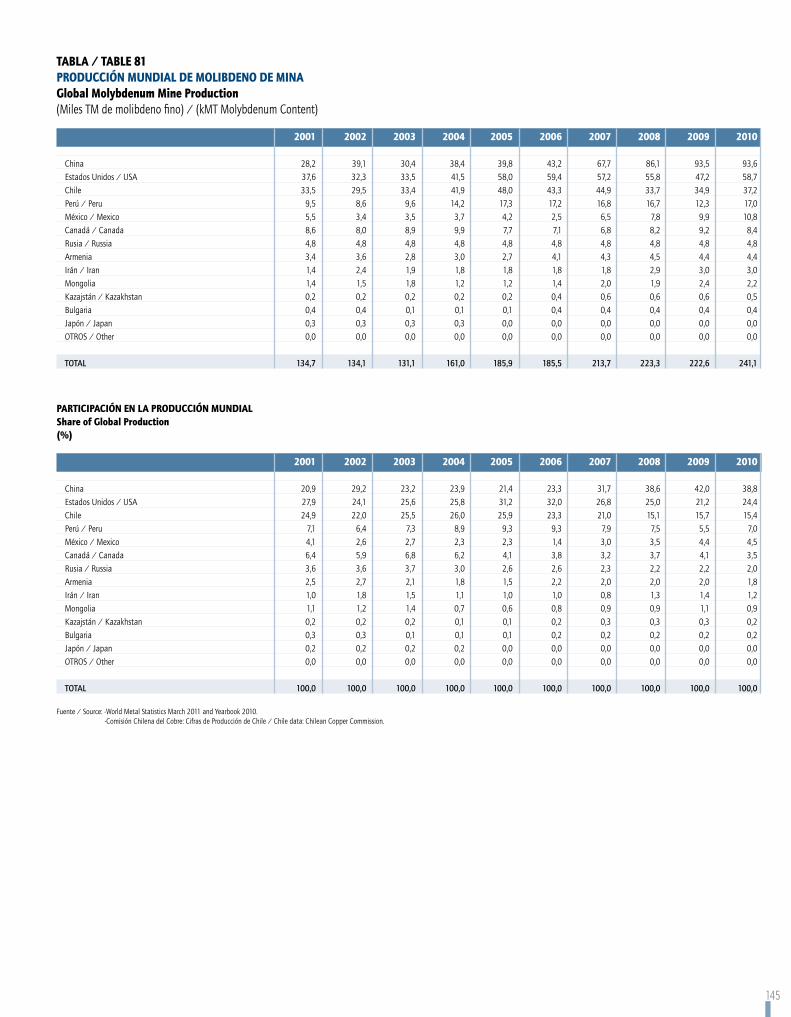
145
TABLA / TABLE 81PRODUCCIÓN MUNDIAL DE MOLIBDENO DE MINAGlobal Molybdenum Mine Production(Miles tM de molibdeno fino) / (kMt Molybdenum Content)
2001 2002 2003 2004 2005 2006 2007 2008 2009 2010
China 28,2 39,1 30,4 38,4 39,8 43,2 67,7 86,1 93,5 93,6
estados Unidos / USa 37,6 32,3 33,5 41,5 58,0 59,4 57,2 55,8 47,2 58,7
Chile 33,5 29,5 33,4 41,9 48,0 43,3 44,9 33,7 34,9 37,2
perú / peru 9,5 8,6 9,6 14,2 17,3 17,2 16,8 16,7 12,3 17,0
México / Mexico 5,5 3,4 3,5 3,7 4,2 2,5 6,5 7,8 9,9 10,8
Canadá / Canada 8,6 8,0 8,9 9,9 7,7 7,1 6,8 8,2 9,2 8,4
rusia / russia 4,8 4,8 4,8 4,8 4,8 4,8 4,8 4,8 4,8 4,8
armenia 3,4 3,6 2,8 3,0 2,7 4,1 4,3 4,5 4,4 4,4
irán / iran 1,4 2,4 1,9 1,8 1,8 1,8 1,8 2,9 3,0 3,0
Mongolia 1,4 1,5 1,8 1,2 1,2 1,4 2,0 1,9 2,4 2,2
kazajstán / kazakhstan 0,2 0,2 0,2 0,2 0,2 0,4 0,6 0,6 0,6 0,5
bulgaria 0,4 0,4 0,1 0,1 0,1 0,4 0,4 0,4 0,4 0,4
Japón / Japan 0,3 0,3 0,3 0,3 0,0 0,0 0,0 0,0 0,0 0,0
otroS / other 0,0 0,0 0,0 0,0 0,0 0,0 0,0 0,0 0,0 0,0
totAl 134,7 134,1 131,1 161,0 185,9 185,5 213,7 223,3 222,6 241,1
PARTICIPACIÓN EN LA PRODUCCIÓN MUNDIALShare of Global Production(%)
2001 2002 2003 2004 2005 2006 2007 2008 2009 2010
China 20,9 29,2 23,2 23,9 21,4 23,3 31,7 38,6 42,0 38,8
estados Unidos / USa 27,9 24,1 25,6 25,8 31,2 32,0 26,8 25,0 21,2 24,4
Chile 24,9 22,0 25,5 26,0 25,9 23,3 21,0 15,1 15,7 15,4
perú / peru 7,1 6,4 7,3 8,9 9,3 9,3 7,9 7,5 5,5 7,0
México / Mexico 4,1 2,6 2,7 2,3 2,3 1,4 3,0 3,5 4,4 4,5
Canadá / Canada 6,4 5,9 6,8 6,2 4,1 3,8 3,2 3,7 4,1 3,5
rusia / russia 3,6 3,6 3,7 3,0 2,6 2,6 2,3 2,2 2,2 2,0
armenia 2,5 2,7 2,1 1,8 1,5 2,2 2,0 2,0 2,0 1,8
irán / iran 1,0 1,8 1,5 1,1 1,0 1,0 0,8 1,3 1,4 1,2
Mongolia 1,1 1,2 1,4 0,7 0,6 0,8 0,9 0,9 1,1 0,9
kazajstán / kazakhstan 0,2 0,2 0,2 0,1 0,1 0,2 0,3 0,3 0,3 0,2
bulgaria 0,3 0,3 0,1 0,1 0,1 0,2 0,2 0,2 0,2 0,2
Japón / Japan 0,2 0,2 0,2 0,2 0,0 0,0 0,0 0,0 0,0 0,0
otroS / other 0,0 0,0 0,0 0,0 0,0 0,0 0,0 0,0 0,0 0,0
totAl 100,0 100,0 100,0 100,0 100,0 100,0 100,0 100,0 100,0 100,0 Fuente / Source: -World Metal Statistics March 2011 and Yearbook 2010. -Comisión Chilena del Cobre: Cifras de producción de Chile / Chile data: Chilean Copper Commission.

146

147
2.2CONSUMO Y PRECIOS INTERNACIONALESWorld consuMPtion And Prices
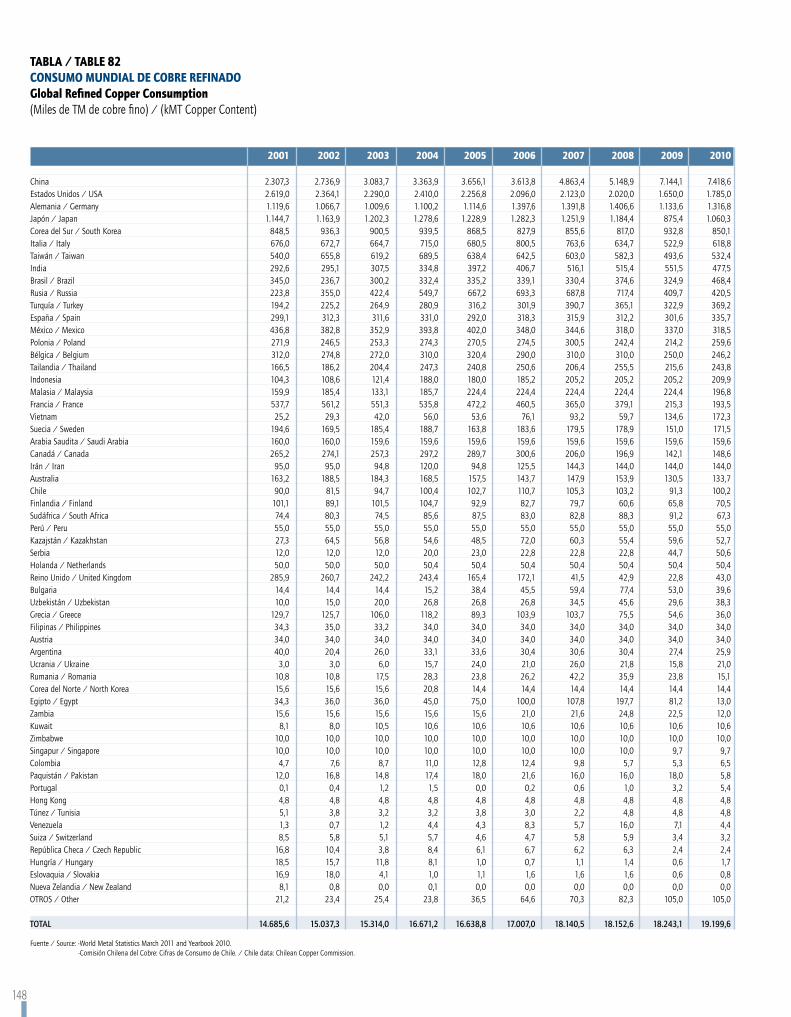
148
TABLA / TABLE 82CONSUMO MUNDIAL DE COBRE REFINADO Global Refined Copper Consumption (Miles de tM de cobre fino) / (kMt Copper Content)
2001 2002 2003 2004 2005 2006 2007 2008 2009 2010 China 2.307,3 2.736,9 3.083,7 3.363,9 3.656,1 3.613,8 4.863,4 5.148,9 7.144,1 7.418,6estados Unidos / USa 2.619,0 2.364,1 2.290,0 2.410,0 2.256,8 2.096,0 2.123,0 2.020,0 1.650,0 1.785,0alemania / Germany 1.119,6 1.066,7 1.009,6 1.100,2 1.114,6 1.397,6 1.391,8 1.406,6 1.133,6 1.316,8Japón / Japan 1.144,7 1.163,9 1.202,3 1.278,6 1.228,9 1.282,3 1.251,9 1.184,4 875,4 1.060,3Corea del Sur / South korea 848,5 936,3 900,5 939,5 868,5 827,9 855,6 817,0 932,8 850,1italia / italy 676,0 672,7 664,7 715,0 680,5 800,5 763,6 634,7 522,9 618,8taiwán / taiwan 540,0 655,8 619,2 689,5 638,4 642,5 603,0 582,3 493,6 532,4india 292,6 295,1 307,5 334,8 397,2 406,7 516,1 515,4 551,5 477,5brasil / brazil 345,0 236,7 300,2 332,4 335,2 339,1 330,4 374,6 324,9 468,4rusia / russia 223,8 355,0 422,4 549,7 667,2 693,3 687,8 717,4 409,7 420,5turquía / turkey 194,2 225,2 264,9 280,9 316,2 301,9 390,7 365,1 322,9 369,2españa / Spain 299,1 312,3 311,6 331,0 292,0 318,3 315,9 312,2 301,6 335,7México / Mexico 436,8 382,8 352,9 393,8 402,0 348,0 344,6 318,0 337,0 318,5polonia / poland 271,9 246,5 253,3 274,3 270,5 274,5 300,5 242,4 214,2 259,6bélgica / belgium 312,0 274,8 272,0 310,0 320,4 290,0 310,0 310,0 250,0 246,2tailandia / thailand 166,5 186,2 204,4 247,3 240,8 250,6 206,4 255,5 215,6 243,8indonesia 104,3 108,6 121,4 188,0 180,0 185,2 205,2 205,2 205,2 209,9Malasia / Malaysia 159,9 185,4 133,1 185,7 224,4 224,4 224,4 224,4 224,4 196,8Francia / France 537,7 561,2 551,3 535,8 472,2 460,5 365,0 379,1 215,3 193,5Vietnam 25,2 29,3 42,0 56,0 53,6 76,1 93,2 59,7 134,6 172,3Suecia / Sweden 194,6 169,5 185,4 188,7 163,8 183,6 179,5 178,9 151,0 171,5arabia Saudita / Saudi arabia 160,0 160,0 159,6 159,6 159,6 159,6 159,6 159,6 159,6 159,6Canadá / Canada 265,2 274,1 257,3 297,2 289,7 300,6 206,0 196,9 142,1 148,6irán / iran 95,0 95,0 94,8 120,0 94,8 125,5 144,3 144,0 144,0 144,0australia 163,2 188,5 184,3 168,5 157,5 143,7 147,9 153,9 130,5 133,7Chile 90,0 81,5 94,7 100,4 102,7 110,7 105,3 103,2 91,3 100,2Finlandia / Finland 101,1 89,1 101,5 104,7 92,9 82,7 79,7 60,6 65,8 70,5Sudáfrica / South africa 74,4 80,3 74,5 85,6 87,5 83,0 82,8 88,3 91,2 67,3perú / peru 55,0 55,0 55,0 55,0 55,0 55,0 55,0 55,0 55,0 55,0kazajstán / kazakhstan 27,3 64,5 56,8 54,6 48,5 72,0 60,3 55,4 59,6 52,7Serbia 12,0 12,0 12,0 20,0 23,0 22,8 22,8 22,8 44,7 50,6holanda / netherlands 50,0 50,0 50,0 50,4 50,4 50,4 50,4 50,4 50,4 50,4reino Unido / United kingdom 285,9 260,7 242,2 243,4 165,4 172,1 41,5 42,9 22,8 43,0bulgaria 14,4 14,4 14,4 15,2 38,4 45,5 59,4 77,4 53,0 39,6Uzbekistán / Uzbekistan 10,0 15,0 20,0 26,8 26,8 26,8 34,5 45,6 29,6 38,3Grecia / Greece 129,7 125,7 106,0 118,2 89,3 103,9 103,7 75,5 54,6 36,0Filipinas / philippines 34,3 35,0 33,2 34,0 34,0 34,0 34,0 34,0 34,0 34,0austria 34,0 34,0 34,0 34,0 34,0 34,0 34,0 34,0 34,0 34,0argentina 40,0 20,4 26,0 33,1 33,6 30,4 30,6 30,4 27,4 25,9Ucrania / Ukraine 3,0 3,0 6,0 15,7 24,0 21,0 26,0 21,8 15,8 21,0rumania / romania 10,8 10,8 17,5 28,3 23,8 26,2 42,2 35,9 23,8 15,1Corea del norte / north korea 15,6 15,6 15,6 20,8 14,4 14,4 14,4 14,4 14,4 14,4egipto / egypt 34,3 36,0 36,0 45,0 75,0 100,0 107,8 197,7 81,2 13,0Zambia 15,6 15,6 15,6 15,6 15,6 21,0 21,6 24,8 22,5 12,0kuwait 8,1 8,0 10,5 10,6 10,6 10,6 10,6 10,6 10,6 10,6Zimbabwe 10,0 10,0 10,0 10,0 10,0 10,0 10,0 10,0 10,0 10,0Singapur / Singapore 10,0 10,0 10,0 10,0 10,0 10,0 10,0 10,0 9,7 9,7Colombia 4,7 7,6 8,7 11,0 12,8 12,4 9,8 5,7 5,3 6,5paquistán / pakistan 12,0 16,8 14,8 17,4 18,0 21,6 16,0 16,0 18,0 5,8portugal 0,1 0,4 1,2 1,5 0,0 0,2 0,6 1,0 3,2 5,4hong kong 4,8 4,8 4,8 4,8 4,8 4,8 4,8 4,8 4,8 4,8túnez / tunisia 5,1 3,8 3,2 3,2 3,8 3,0 2,2 4,8 4,8 4,8Venezuela 1,3 0,7 1,2 4,4 4,3 8,3 5,7 16,0 7,1 4,4Suiza / Switzerland 8,5 5,8 5,1 5,7 4,6 4,7 5,8 5,9 3,4 3,2república Checa / Czech republic 16,8 10,4 3,8 8,4 6,1 6,7 6,2 6,3 2,4 2,4hungría / hungary 18,5 15,7 11,8 8,1 1,0 0,7 1,1 1,4 0,6 1,7eslovaquia / Slovakia 16,9 18,0 4,1 1,0 1,1 1,6 1,6 1,6 0,6 0,8nueva Zelandia / new Zealand 8,1 0,8 0,0 0,1 0,0 0,0 0,0 0,0 0,0 0,0otroS / other 21,2 23,4 25,4 23,8 36,5 64,6 70,3 82,3 105,0 105,0 totAl 14.685,6 15.037,3 15.314,0 16.671,2 16.638,8 17.007,0 18.140,5 18.152,6 18.243,1 19.199,6 Fuente / Source: -World Metal Statistics March 2011 and Yearbook 2010. -Comisión Chilena del Cobre: Cifras de Consumo de Chile. / Chile data: Chilean Copper Commission.
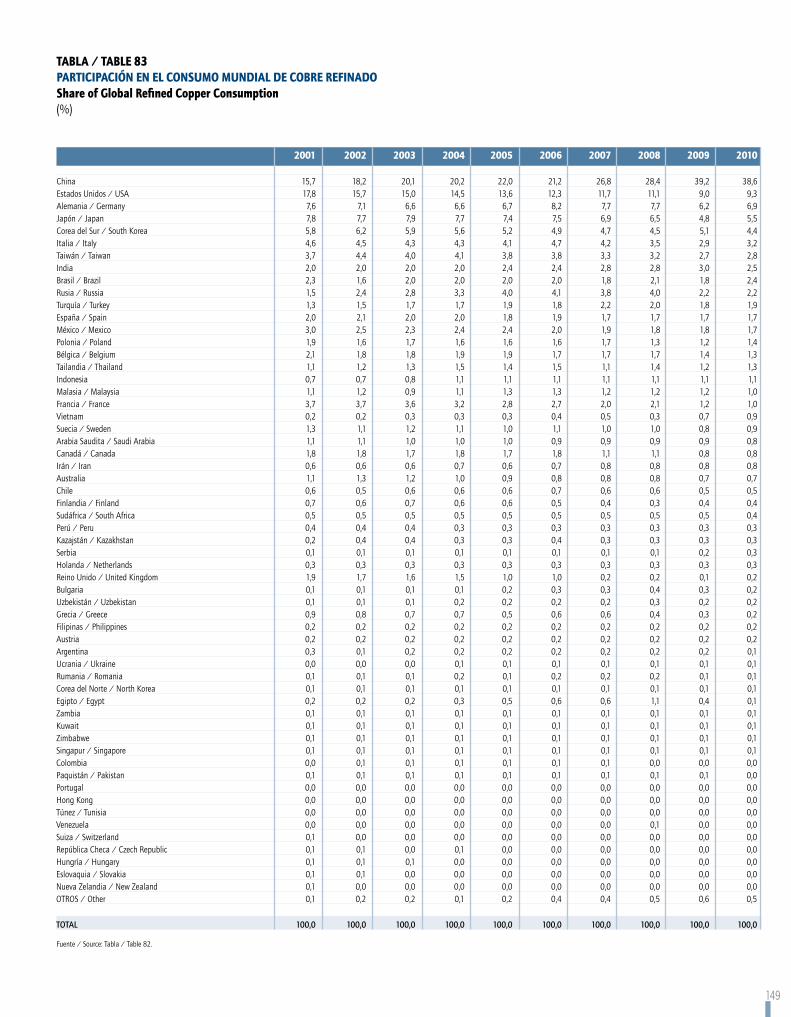
149
TABLA / TABLE 83PARTICIPACIÓN EN EL CONSUMO MUNDIAL DE COBRE REFINADOShare of Global Refined Copper Consumption(%)
2001 2002 2003 2004 2005 2006 2007 2008 2009 2010 China 15,7 18,2 20,1 20,2 22,0 21,2 26,8 28,4 39,2 38,6estados Unidos / USa 17,8 15,7 15,0 14,5 13,6 12,3 11,7 11,1 9,0 9,3alemania / Germany 7,6 7,1 6,6 6,6 6,7 8,2 7,7 7,7 6,2 6,9Japón / Japan 7,8 7,7 7,9 7,7 7,4 7,5 6,9 6,5 4,8 5,5Corea del Sur / South korea 5,8 6,2 5,9 5,6 5,2 4,9 4,7 4,5 5,1 4,4italia / italy 4,6 4,5 4,3 4,3 4,1 4,7 4,2 3,5 2,9 3,2taiwán / taiwan 3,7 4,4 4,0 4,1 3,8 3,8 3,3 3,2 2,7 2,8india 2,0 2,0 2,0 2,0 2,4 2,4 2,8 2,8 3,0 2,5brasil / brazil 2,3 1,6 2,0 2,0 2,0 2,0 1,8 2,1 1,8 2,4rusia / russia 1,5 2,4 2,8 3,3 4,0 4,1 3,8 4,0 2,2 2,2turquía / turkey 1,3 1,5 1,7 1,7 1,9 1,8 2,2 2,0 1,8 1,9españa / Spain 2,0 2,1 2,0 2,0 1,8 1,9 1,7 1,7 1,7 1,7México / Mexico 3,0 2,5 2,3 2,4 2,4 2,0 1,9 1,8 1,8 1,7polonia / poland 1,9 1,6 1,7 1,6 1,6 1,6 1,7 1,3 1,2 1,4bélgica / belgium 2,1 1,8 1,8 1,9 1,9 1,7 1,7 1,7 1,4 1,3tailandia / thailand 1,1 1,2 1,3 1,5 1,4 1,5 1,1 1,4 1,2 1,3indonesia 0,7 0,7 0,8 1,1 1,1 1,1 1,1 1,1 1,1 1,1Malasia / Malaysia 1,1 1,2 0,9 1,1 1,3 1,3 1,2 1,2 1,2 1,0Francia / France 3,7 3,7 3,6 3,2 2,8 2,7 2,0 2,1 1,2 1,0Vietnam 0,2 0,2 0,3 0,3 0,3 0,4 0,5 0,3 0,7 0,9Suecia / Sweden 1,3 1,1 1,2 1,1 1,0 1,1 1,0 1,0 0,8 0,9arabia Saudita / Saudi arabia 1,1 1,1 1,0 1,0 1,0 0,9 0,9 0,9 0,9 0,8Canadá / Canada 1,8 1,8 1,7 1,8 1,7 1,8 1,1 1,1 0,8 0,8irán / iran 0,6 0,6 0,6 0,7 0,6 0,7 0,8 0,8 0,8 0,8australia 1,1 1,3 1,2 1,0 0,9 0,8 0,8 0,8 0,7 0,7Chile 0,6 0,5 0,6 0,6 0,6 0,7 0,6 0,6 0,5 0,5Finlandia / Finland 0,7 0,6 0,7 0,6 0,6 0,5 0,4 0,3 0,4 0,4Sudáfrica / South africa 0,5 0,5 0,5 0,5 0,5 0,5 0,5 0,5 0,5 0,4perú / peru 0,4 0,4 0,4 0,3 0,3 0,3 0,3 0,3 0,3 0,3kazajstán / kazakhstan 0,2 0,4 0,4 0,3 0,3 0,4 0,3 0,3 0,3 0,3Serbia 0,1 0,1 0,1 0,1 0,1 0,1 0,1 0,1 0,2 0,3holanda / netherlands 0,3 0,3 0,3 0,3 0,3 0,3 0,3 0,3 0,3 0,3reino Unido / United kingdom 1,9 1,7 1,6 1,5 1,0 1,0 0,2 0,2 0,1 0,2bulgaria 0,1 0,1 0,1 0,1 0,2 0,3 0,3 0,4 0,3 0,2Uzbekistán / Uzbekistan 0,1 0,1 0,1 0,2 0,2 0,2 0,2 0,3 0,2 0,2Grecia / Greece 0,9 0,8 0,7 0,7 0,5 0,6 0,6 0,4 0,3 0,2Filipinas / philippines 0,2 0,2 0,2 0,2 0,2 0,2 0,2 0,2 0,2 0,2austria 0,2 0,2 0,2 0,2 0,2 0,2 0,2 0,2 0,2 0,2argentina 0,3 0,1 0,2 0,2 0,2 0,2 0,2 0,2 0,2 0,1Ucrania / Ukraine 0,0 0,0 0,0 0,1 0,1 0,1 0,1 0,1 0,1 0,1rumania / romania 0,1 0,1 0,1 0,2 0,1 0,2 0,2 0,2 0,1 0,1Corea del norte / north korea 0,1 0,1 0,1 0,1 0,1 0,1 0,1 0,1 0,1 0,1egipto / egypt 0,2 0,2 0,2 0,3 0,5 0,6 0,6 1,1 0,4 0,1Zambia 0,1 0,1 0,1 0,1 0,1 0,1 0,1 0,1 0,1 0,1kuwait 0,1 0,1 0,1 0,1 0,1 0,1 0,1 0,1 0,1 0,1Zimbabwe 0,1 0,1 0,1 0,1 0,1 0,1 0,1 0,1 0,1 0,1Singapur / Singapore 0,1 0,1 0,1 0,1 0,1 0,1 0,1 0,1 0,1 0,1Colombia 0,0 0,1 0,1 0,1 0,1 0,1 0,1 0,0 0,0 0,0paquistán / pakistan 0,1 0,1 0,1 0,1 0,1 0,1 0,1 0,1 0,1 0,0portugal 0,0 0,0 0,0 0,0 0,0 0,0 0,0 0,0 0,0 0,0hong kong 0,0 0,0 0,0 0,0 0,0 0,0 0,0 0,0 0,0 0,0túnez / tunisia 0,0 0,0 0,0 0,0 0,0 0,0 0,0 0,0 0,0 0,0Venezuela 0,0 0,0 0,0 0,0 0,0 0,0 0,0 0,1 0,0 0,0Suiza / Switzerland 0,1 0,0 0,0 0,0 0,0 0,0 0,0 0,0 0,0 0,0república Checa / Czech republic 0,1 0,1 0,0 0,1 0,0 0,0 0,0 0,0 0,0 0,0hungría / hungary 0,1 0,1 0,1 0,0 0,0 0,0 0,0 0,0 0,0 0,0eslovaquia / Slovakia 0,1 0,1 0,0 0,0 0,0 0,0 0,0 0,0 0,0 0,0nueva Zelandia / new Zealand 0,1 0,0 0,0 0,0 0,0 0,0 0,0 0,0 0,0 0,0otroS / other 0,1 0,2 0,2 0,1 0,2 0,4 0,4 0,5 0,6 0,5
totAl 100,0 100,0 100,0 100,0 100,0 100,0 100,0 100,0 100,0 100,0 Fuente / Source: tabla / table 82.
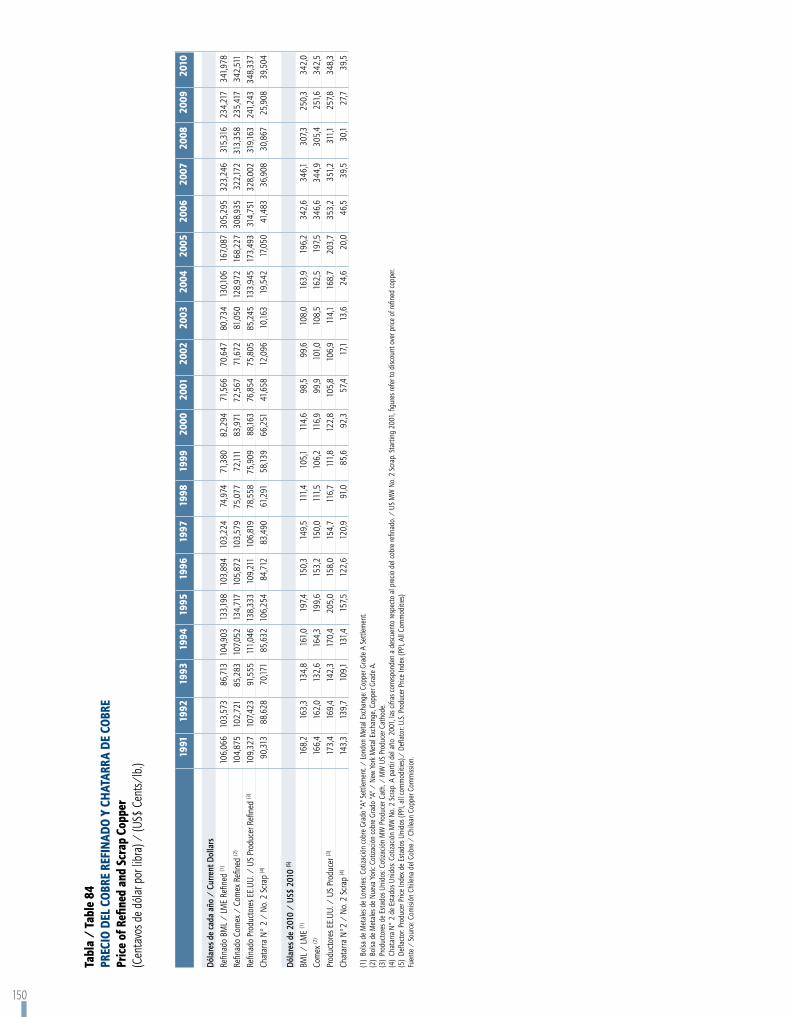
150
Tabl
a /
Tabl
e 84
PR
ECIO
DEL
COB
RE R
EFIN
ADO
Y CH
ATAR
RA D
E CO
BRE
Pric
e of
Refi
ned
and
Scra
p Co
pper
(C
enta
vos d
e dó
lar p
or li
bra)
/ (U
S$ C
ents/
lb.)
19
91
1992
19
93
1994
19
95
1996
19
97
1998
19
99
2000
20
01
2002
20
03
2004
20
05
2006
20
07
2008
20
09
2010
dól
ares
de
cada
año
/ c
urre
nt d
olla
rs
refin
ado
bMl
/ lM
e re
fined
(1)
106,
066
103,
573
86,7
13
104,
903
133,
198
103,
894
103,
224
74,9
74
71,3
80
82,2
94
71,5
66
70,6
47
80,7
34
130,
106
167,0
87
305,
295
323,
246
315,
316
234,
217
341,
978
refin
ado
Com
ex /
Com
ex r
efine
d (2
) 10
4,87
5 10
2,72
1 85
,283
10
7,052
13
4,71
7 10
5,87
2 10
3,57
9 75
,077
72
,111
83,9
71
72,5
67
71,6
72
81,0
50
128,
972
168,
227
308,
935
322,
172
313,
358
235,
417
342,
511
refin
ado
prod
ucto
res e
e.U
U. /
US
prod
ucer
refi
ned
(3)
109,
327
107,4
23
91,5
55
111,
046
138,
333
109,
211
106,
819
78,5
58
75,9
09
88,16
3 76
,854
75
,805
85
,245
13
3,94
5 17
3,49
3 31
4,75
1 32
8,00
2 31
9,16
3 24
1,24
3 34
8,33
7
Chat
arra
n°
2 /
no.
2 S
crap
(4)
90,3
13
88,6
28
70,17
1 85
,632
10
6,25
4 84
,712
83
,490
61
,291
58
,139
66,2
51
41,6
58
12,0
96
10,16
3 19
,542
17
,050
41
,483
36
,908
30
,867
25
,908
39
,504
dól
ares
de
2010
/ u
s$ 2
010
(5)
bMl
/ lM
e (1
) 16
8,2
163,
3 13
4,8
161,
0 19
7,4
150,
3 14
9,5
111,
4 10
5,1
114,
6 98
,5
99,6
10
8,0
163,
9 19
6,2
342,
6 34
6,1
307,3
25
0,3
342,
0
Com
ex (2
) 16
6,4
162,
0 13
2,6
164,
3 19
9,6
153,
2 15
0,0
111,
5 10
6,2
116,
9 99
,9
101,
0 10
8,5
162,
5 19
7,5
346,
6 34
4,9
305,
4 25
1,6
342,
5
prod
ucto
res e
e.U
U. /
US
prod
ucer
(3)
173,
4 16
9,4
142,
3 17
0,4
205,
0 15
8,0
154,
7 11
6,7
111,
8 12
2,8
105,
8 10
6,9
114,
1 16
8,7
203,
7 35
3,2
351,
2 31
1,1
257,8
34
8,3
Chat
arra
n°2
/ n
o. 2
Scr
ap (4
) 14
3,3
139,
7 10
9,1
131,
4 15
7,5
122,
6 12
0,9
91,0
85
,6
92,3
57
,4
17,1
13
,6
24,6
20
,0
46,5
39
,5
30,1
27
,7
39,5
(1)
bolsa
de
Met
ales
de
lond
res:
Cotiz
ació
n co
bre
Grad
o "a
" Set
tlem
ent.
/ lo
ndon
Met
al e
xcha
nge:
Cop
per G
rade
a S
ettle
men
t.(2
) bo
lsa d
e M
etal
es d
e n
ueva
Yor
k: Co
tizac
ión
cobr
e Gr
ado
"a" /
new
Yor
k M
etal
exc
hang
e, C
oppe
r Gra
de a
.(3
) pr
oduc
tore
s de
esta
dos U
nido
s: Co
tizac
ión
MW
pro
duce
r Cat
h. /
MW
US
prod
ucer
Cat
hode
.(4
) Ch
atar
ra n
° 2
de e
stad
os U
nido
s: Co
tizac
ión
MW
no.
2 S
crap
. a p
artir
del
año
200
1, la
s cifr
as c
orre
spon
den
a de
scue
nto
resp
ecto
al p
recio
del
cob
re re
finad
o. /
US
MW
no.
2 S
crap
. Sta
rting
200
1, fi
gure
s ref
er to
disc
ount
ove
r pric
e of
refin
ed c
oppe
r.(5
) d
eflac
tor:
prod
ucer
pric
e in
dex
de e
stad
os U
nido
s (pp
i, al
l com
mod
ities
)./ d
eflat
or: U
.S. p
rodu
cer p
rice
inde
x (p
pi, a
ll Co
mm
oditi
es)
Fuen
te /
Sou
rce:
Com
isión
Chi
lena
del
Cob
re /
Chi
lean
Cop
per C
omm
issio
n.
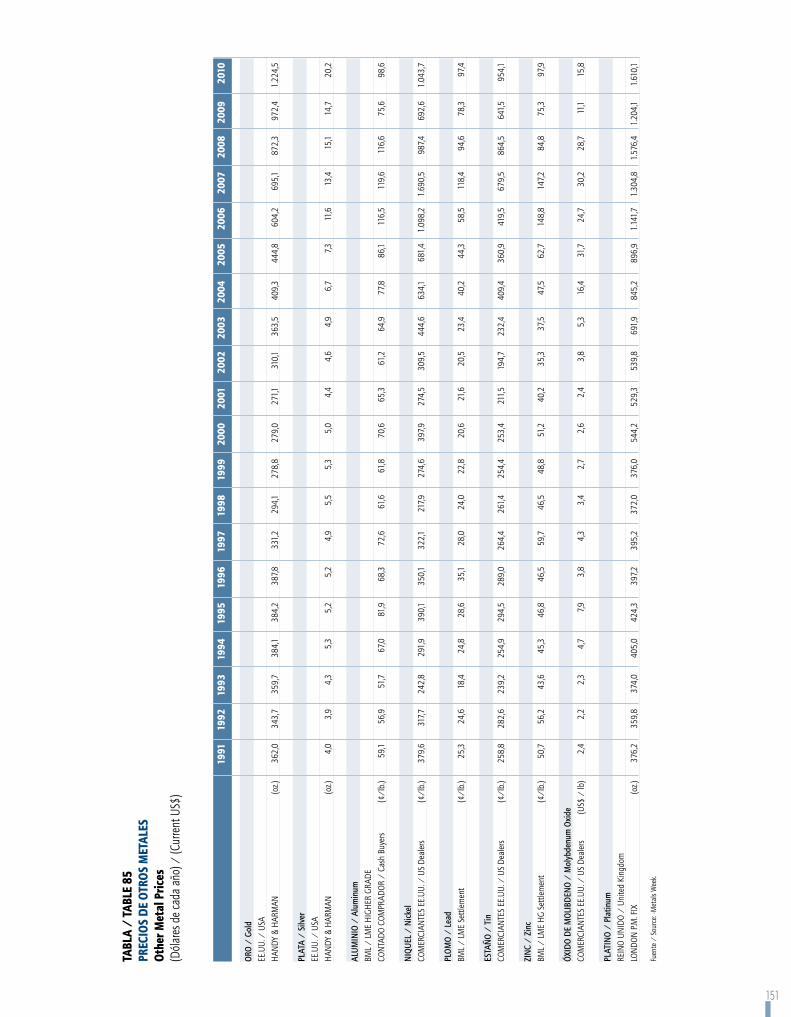
151
TABL
A /
TABL
E 85
PR
ECIO
S D
E OT
ROS
MET
ALES
Othe
r Met
al P
rices
(d
ólar
es d
e ca
da a
ño) /
(Cur
rent
US$
)
1991
19
92
1993
19
94
1995
19
96
1997
19
98
1999
20
00
2001
20
02
2003
20
04
2005
20
06
2007
20
08
2009
20
10
oro
/ G
old
ee
.UU.
/ U
Sa
han
dY &
har
Man
(o
z.)
362,
0 34
3,7
359,
7 38
4,1
384,
2 38
7,8
331,
2 29
4,1
278,
8 27
9,0
271,1
31
0,1
363,
5 40
9,3
444,
8 60
4,2
695,
1 87
2,3
972,
4 1.
224,
5
Pl
AtA
/ si
lver
ee.U
U. /
USa
han
dY &
har
Man
(o
z.)
4,0
3,9
4,3
5,3
5,2
5,2
4,9
5,5
5,3
5,0
4,4
4,6
4,9
6,7
7,3
11,6
13
,4
15,1
14
,7
20,2
Alu
Min
io /
Alu
min
um
bM
l /
lMe
hiG
her
Gra
de
Con
tad
o Co
Mpr
ador
/ C
ash
buye
rs
(¢/l
b.)
59,1
56
,9
51,7
67
,0
81,9
68
,3
72,6
61
,6
61,8
70
,6
65,3
61
,2
64,9
77
,8
86,1
11
6,5
119,
6 11
6,6
75,6
98
,6
niQ
uel
/ n
icke
l
CoM
erCi
ante
S ee
.UU.
/ U
S d
eale
rs
(¢/l
b.)
379,
6 31
7,7
242,
8 29
1,9
390,
1 35
0,1
322,
1 21
7,9
274,
6 39
7,9
274,
5 30
9,5
444,
6 63
4,1
681,
4 1.
098,
2 1.
690,
5 98
7,4
692,
6 1.
043,
7
Plo
Mo
/ l
ead
bM
l /
lMe
Settl
emen
t (¢
/lb.
) 25
,3
24,6
18
,4
24,8
28
,6
35,1
28
,0
24,0
22
,8
20,6
21
,6
20,5
23
,4
40,2
44
,3
58,5
11
8,4
94,6
78
,3
97,4
estA
Ño
/ t
in
Co
Mer
Cian
teS
ee.U
U. /
US
dea
lers
(¢
/lb.
) 25
8,8
282,
6 23
9,2
254,
9 29
4,5
289,
0 26
4,4
261,
4 25
4,4
253,
4 21
1,5
194,
7 23
2,4
409,
4 36
0,9
419,
5 67
9,5
864,
5 64
1,5
954,
1
Zin
c /
Zinc
bMl
/ lM
e h
G Se
ttlem
ent
(¢/l
b.)
50,7
56
,2
43,6
45
,3
46,8
46
,5
59,7
46
,5
48,8
51
,2
40,2
35
,3
37,5
47
,5
62,7
14
8,8
147,2
84
,8
75,3
97
,9
ÓXid
o d
e M
oli
bden
o /
Mol
ybde
num
oxi
de
Co
Mer
Cian
teS
ee.U
U. /
US
dea
lers
(U
S$ /
lb)
2,4
2,2
2,3
4,7
7,9
3,8
4,3
3,4
2,7
2,6
2,4
3,8
5,3
16,4
31
,7
24,7
30
,2
28,7
11
,1
15,8
PlAt
ino
/ P
latin
um
re
ino
Un
ido
/ Un
ited
king
dom
lon
don
p.M
. FiX
(o
z.)
376,
2 35
9,8
374,
0 40
5,0
424,
3 39
7,2
395,
2 37
2,0
376,
0 54
4,2
529,
3 53
9,8
691,
9 84
5,2
896,
9 1.
141,
7 1.
304,
8 1.
576,
4 1.
204,
1 1.
610,
1
Fuen
te /
Sou
rce:
-Met
als W
eek.
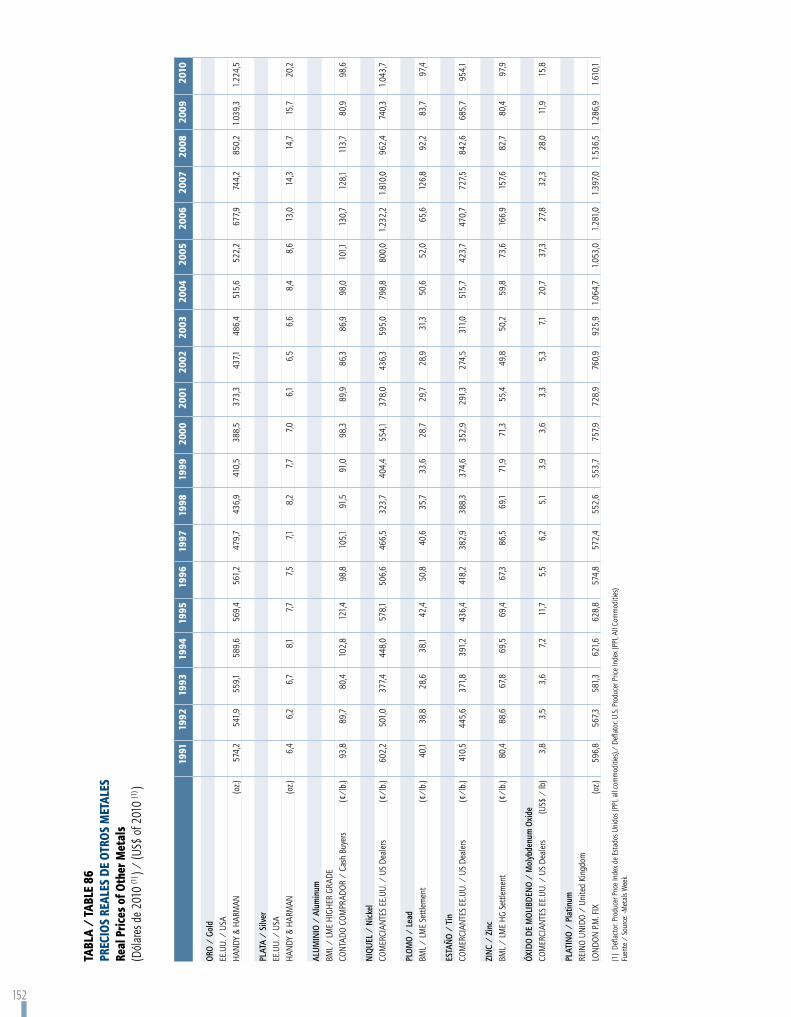
152
TABL
A /
TABL
E 86
PR
ECIO
S RE
ALES
DE
OTRO
S M
ETAL
ES
Real
Pric
es o
f Oth
er M
etal
s
(dól
ares
de
2010
(1) ) /
(US$
of 2
010
(1) )
1991
19
92
1993
19
94
1995
19
96
1997
19
98
1999
20
00
2001
20
02
2003
20
04
2005
20
06
2007
20
08
2009
20
10
oro
/ G
old
ee
.UU.
/ U
Sa
han
dY &
har
Man
(o
z.)
574,
2 54
1,9
559,
1 58
9,6
569,
4 56
1,2
479,
7 43
6,9
410,
5 38
8,5
373,
3 43
7,1
486,
4 51
5,6
522,
2 67
7,9
744,
2 85
0,2
1.03
9,3
1.22
4,5
PlAt
A /
silv
er
ee
.UU.
/ U
Sa
han
dY &
har
Man
(o
z.)
6,4
6,2
6,7
8,1
7,7
7,5
7,1
8,2
7,7
7,0
6,1
6,5
6,6
8,4
8,6
13,0
14
,3
14,7
15
,7
20,2
Alu
Min
io /
Alu
min
um
bM
l /
lMe
hiG
her
Gra
de
Con
tad
o Co
Mpr
ador
/ C
ash
buye
rs
(¢/l
b.)
93,8
89
,7
80,4
10
2,8
121,
4 98
,8
105,
1 91
,5
91,0
98
,3
89,9
86
,3
86,9
98
,0
101,1
13
0,7
128,
1 11
3,7
80,9
98
,6
niQ
uel
/ n
icke
l
CoM
erCi
ante
S ee
.UU.
/ U
S d
eale
rs
(¢/l
b.)
602,
2 50
1,0
377,4
44
8,0
578,
1 50
6,6
466,
5 32
3,7
404,
4 55
4,1
378,
0 43
6,3
595,
0 79
8,8
800,
0 1.
232,
2 1.
810,
0 96
2,4
740,
3 1.
043,
7
Plo
Mo
/ l
ead
bM
l /
lMe
Settl
emen
t (¢
/lb.
) 40
,1
38,8
28
,6
38,1
42
,4
50,8
40
,6
35,7
33
,6
28,7
29
,7
28,9
31
,3
50,6
52
,0
65,6
12
6,8
92,2
83
,7
97,4
estA
Ño
/ t
in
Co
Mer
Cian
teS
ee.U
U. /
US
dea
lers
(¢
/lb.
) 41
0,5
445,
6 37
1,8
391,
2 43
6,4
418,
2 38
2,9
388,
3 37
4,6
352,
9 29
1,3
274,
5 31
1,0
515,
7 42
3,7
470,
7 72
7,5
842,
6 68
5,7
954,
1
Zin
c /
Zinc
bMl
/ lM
e h
G Se
ttlem
ent
(¢/l
b.)
80,4
88
,6
67,8
69
,5
69,4
67
,3
86,5
69
,1
71,9
71
,3
55,4
49
,8
50,2
59
,8
73,6
16
6,9
157,6
82
,7
80,4
97
,9
ÓXid
o d
e M
oli
bden
o /
Mol
ybde
num
oxi
de
Co
Mer
Cian
teS
ee.U
U. /
US
dea
lers
(U
S$ /
lb)
3,8
3,5
3,6
7,2
11,7
5,
5 6,
2 5,
1 3,
9 3,
6 3,
3 5,
3 7,1
20
,7
37,3
27
,8
32,3
28
,0
11,9
15
,8
PlAt
ino
/ P
latin
um
re
ino
Un
ido
/ Un
ited
king
dom
lon
don
p.M
. FiX
(o
z.)
596,
8 56
7,3
581,
3 62
1,6
628,
8 57
4,8
572,
4 55
2,6
553,
7 75
7,9
728,
9 76
0,9
925,
9 1.
064,
7 1.
053,
0 1.
281,
0 1.
397,0
1.
536,
5 1.
286,
9 1.
610,
1 (1
) d
eflac
tor:
prod
ucer
pric
e in
dex
de e
stad
os U
nido
s (pp
i, al
l com
mod
ities
)./ d
eflat
or: U
.S. p
rodu
cer p
rice
inde
x (p
pi, a
ll Co
mm
oditi
es)
Fuen
te /
Sou
rce:
-Met
als W
eek.
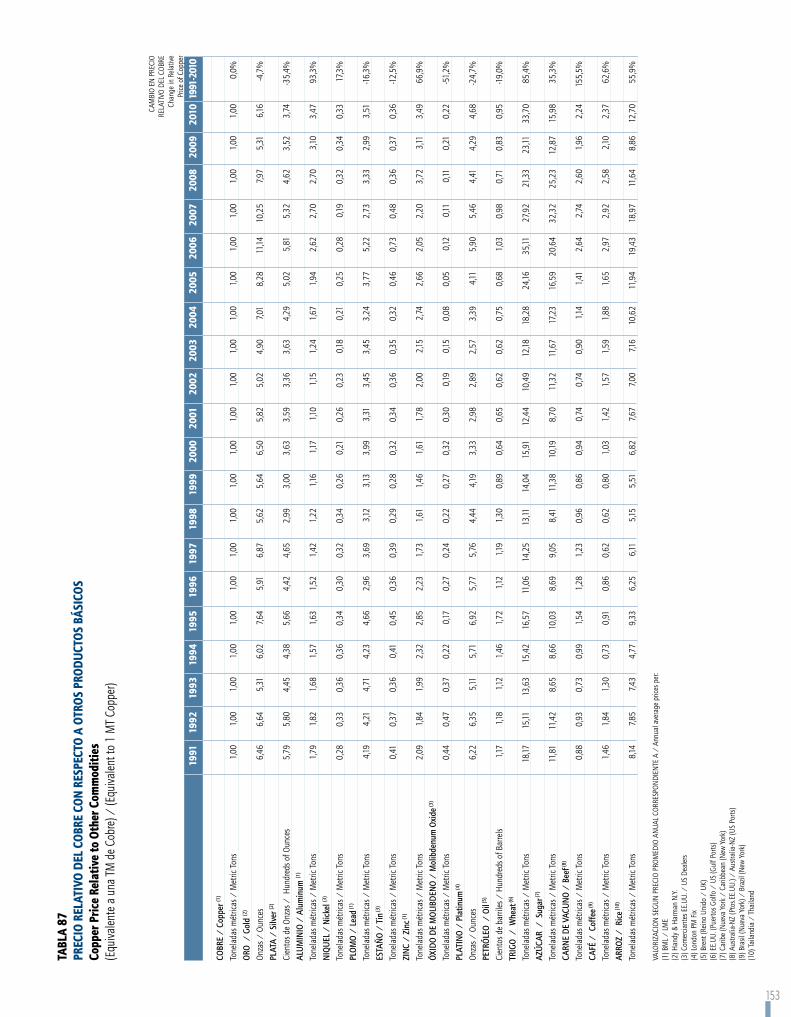
153
TABL
A 87
PREC
IO R
ELAT
IVO
DEL
COBR
E CO
N RE
SPEC
TO A
OTR
OS P
RODU
CTOS
BÁS
ICOS
Co
pper
Pric
e Re
lativ
e to
Oth
er C
omm
oditi
es
(equ
ivale
nte
a un
a tM
de
Cobr
e) /
(equ
ivale
nt to
1 M
t Co
pper
)
Ca
Mbi
o en
pre
Cio
rela
tiVo
del
Cob
re
Chan
ge in
rel
ative
pr
ice o
f Cop
per
19
91
1992
19
93
1994
19
95
1996
19
97
1998
19
99
2000
20
01
2002
20
03
2004
20
05
2006
20
07
2008
20
09
2010
199
1-20
10
cobr
e /
copp
er (1
)
tone
lada
s mét
ricas
/ M
etric
ton
s 1,
00
1,00
1,
00
1,00
1,
00
1,00
1,
00
1,00
1,
00
1,00
1,
00
1,00
1,
00
1,00
1,
00
1,00
1,
00
1,00
1,
00
1,00
0,
0%
oro
/ G
old
(2)
on
zas /
oun
ces
6,46
6,
64
5,31
6,
02
7,64
5,91
6,
87
5,62
5,
64
6,50
5,
82
5,02
4,
90
7,01
8,28
11
,14
10,2
5 7,9
7 5,
31
6,16
-4
,7%
PlAt
A /
silv
er (2
)
Cien
tos d
e on
zas /
hun
dred
s of o
unce
s 5,
79
5,80
4,
45
4,38
5,
66
4,42
4,
65
2,99
3,
00
3,63
3,
59
3,36
3,
63
4,29
5,
02
5,81
5,
32
4,62
3,
52
3,74
-3
5,4%
Alu
Min
io /
Alu
min
um (1
)
tone
lada
s mét
ricas
/ M
etric
ton
s 1,
79
1,82
1,
68
1,57
1,
63
1,52
1,
42
1,22
1,1
6 1,1
7 1,1
0 1,1
5 1,
24
1,67
1,
94
2,62
2,
70
2,70
3,
10
3,47
93
,3%
niQ
uel
/ n
icke
l (3)
to
nela
das m
étric
as /
Met
ric t
ons
0,28
0,
33
0,36
0,
36
0,34
0,
30
0,32
0,
34
0,26
0,
21
0,26
0,
23
0,18
0,
21
0,25
0,
28
0,19
0,
32
0,34
0,
33
17,3
%
Plo
Mo
/ l
ead (1
)
tone
lada
s mét
ricas
/ M
etric
ton
s 4,
19
4,21
4,
71
4,23
4,
66
2,96
3,
69
3,12
3,
13
3,99
3,
31
3,45
3,
45
3,24
3,
77
5,22
2,
73
3,33
2,
99
3,51
-1
6,3%
estA
Ño
/ t
in (3
)
tone
lada
s mét
ricas
/ M
etric
ton
s 0,
41
0,37
0,
36
0,41
0,
45
0,36
0,
39
0,29
0,
28
0,32
0,
34
0,36
0,
35
0,32
0,
46
0,73
0,
48
0,36
0,
37
0,36
-1
2,5%
Zin
c /
Zinc
(1)
to
nela
das m
étric
as /
Met
ric t
ons
2,09
1,
84
1,99
2,
32
2,85
2,
23
1,73
1,
61
1,46
1,
61
1,78
2,
00
2,15
2,
74
2,66
2,
05
2,20
3,
72
3,11
3,
49
66,9
%
ÓXid
o d
e M
oli
bden
o /
Mol
ibde
num
oxi
de (3
)
tone
lada
s mét
ricas
/ M
etric
ton
s 0,
44
0,47
0,
37
0,22
0,
17
0,27
0,
24
0,22
0,
27
0,32
0,
30
0,19
0,
15
0,08
0,
05
0,12
0,
11
0,11
0,
21
0,22
-5
1,2%
PlAt
ino
/ P
latin
um (4
)
onza
s / o
unce
s 6,
22
6,35
5,
11
5,71
6,
92
5,77
5,
76
4,44
4,
19
3,33
2,
98
2,89
2,
57
3,39
4,
11
5,90
5,
46
4,41
4,
29
4,68
-2
4,7%
Petr
Óle
o /
oil (5
)
Cien
tos d
e ba
rrile
s / h
undr
eds o
f bar
rels
1,17
1,18
1,12
1,46
1,
72
1,12
1,19
1,30
0,
89
0,64
0,
65
0,62
0,
62
0,75
0,
68
1,03
0,
98
0,71
0,
83
0,95
-1
9,0%
triG
o /
Whe
at (6
)
tone
lada
s mét
ricas
/ M
etric
ton
s 18
,17
15,11
13
,63
15,4
2 16
,57
11,0
6 14
,25
13,11
14
,04
15,9
1 12
,44
10,4
9 12
,18
18,2
8 24
,16
35,11
27
,92
21,3
3 23
,11
33,7
0 85
,4%
AZÚ
cAr
/ s
ugar
(7)
to
nela
das m
étric
as /
Met
ric t
ons
11,8
1 11
,42
8,65
8,
66
10,0
3 8,
69
9,05
8,
41
11,3
8 10
,19
8,70
11
,32
11,6
7 17
,23
16,5
9 20
,64
32,3
2 25
,23
12,8
7 15
,98
35,3
%
cArn
e d
e VA
cun
o /
bee
f (8)
to
nela
das m
étric
as /
Met
ric t
ons
0,88
0,
93
0,73
0,
99
1,54
1,
28
1,23
0,
96
0,86
0,
94
0,74
0,
74
0,90
1,1
4 1,
41
2,64
2,
74
2,60
1,
96
2,24
15
5,5%
cAFÉ
/ c
offe
e (9)
to
nela
das m
étric
as /
Met
ric t
ons
1,46
1,
84
1,30
0,
73
0,91
0,
86
0,62
0,
62
0,80
1,
03
1,42
1,
57
1,59
1,
88
1,65
2,
97
2,92
2,
58
2,10
2,
37
62,6
%
Arro
Z /
ric
e (10)
tone
lada
s mét
ricas
/ M
etric
ton
s 8,
14
7,85
7,43
4,77
9,
33
6,25
6,
11
5,15
5,
51
6,82
7,6
7 7,0
0 7,1
6 10
,62
11,9
4 19
,43
18,9
7 11
,64
8,86
12
,70
55,9
%
Valo
riZa
Cion
SeG
Un
pre
Cio
proM
edio
an
Ual
Corr
eSpo
nd
ien
te a
/ a
nnua
l ave
rage
pric
es p
er:
(1
) bM
l /
lMe
(2) h
andy
& h
arm
an n
.Y.
(3) C
omer
ciant
es e
e.U
U. /
US
dea
lers
(4) l
ondo
n pM
Fix
(5
) bre
nt (r
eino
Uni
do /
Uk)
(6) e
e.U
U. (p
uerto
s Gol
fo /
US
(Gul
f por
ts)
(7
) Car
ibe
(nue
va Y
ork
/ Ca
ribbe
an (n
ew Y
ork)
(8) a
ustra
lia-n
Z (p
tos.e
e.U
U.) /
aus
tralia
-nZ
(US
ports
)
(9
) bra
sil (n
ueva
Yor
k) /
bra
zil (n
ew Y
ork)
(10)
taila
ndia
/ t
haila
nd
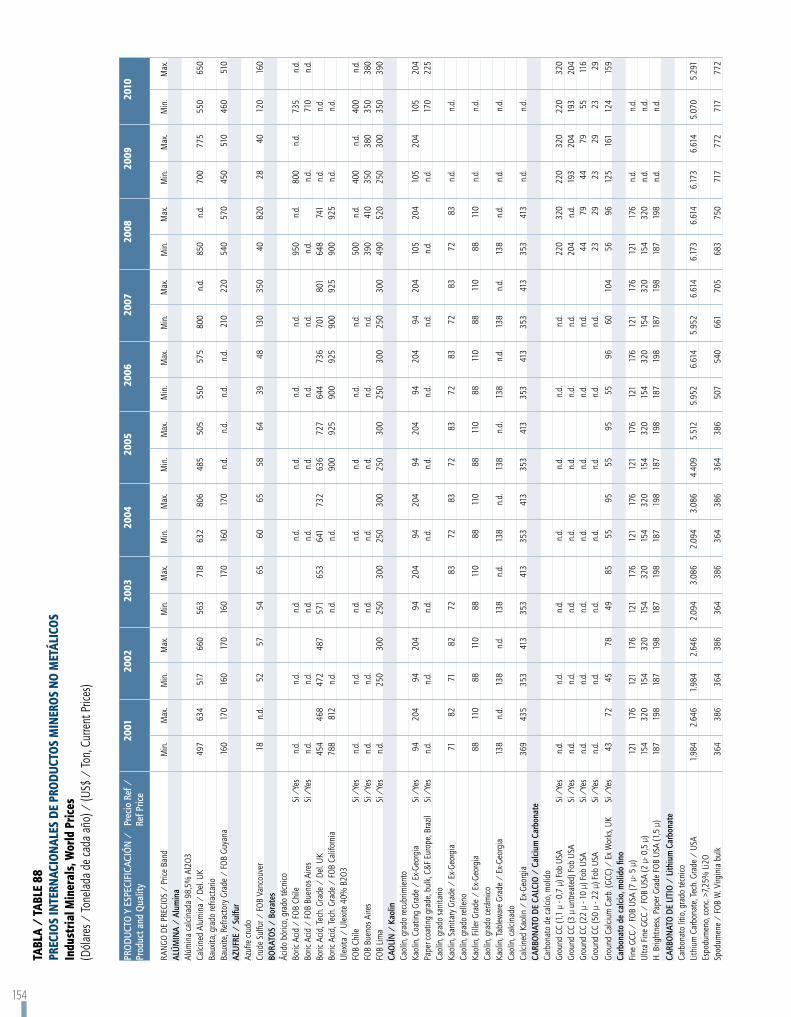
154
TABL
A /
TABL
E 88
PR
ECIO
S IN
TERN
ACIO
NALE
S DE
PRO
DUCT
OS M
INER
OS N
O M
ETÁL
ICOS
Indu
stria
l Min
eral
s, W
orld
Pric
es
(d
ólar
es /
tone
lada
de
cada
año
) / (U
S$ /
ton,
Cur
rent
pric
es)
Pro
du
cto
y e
sPec
iFic
AciÓ
n /
Pr
ecio
ref
/
2001
2002
2003
2004
2005
2006
2007
2008
2009
2010
Prod
uct a
nd Q
ualit
y
ref
Pric
e
ran
Go d
e pr
eCio
S /
price
ban
d
Min
. M
ax.
Min
. M
ax.
Min
. M
ax.
Min
. M
ax.
Min
. M
ax.
Min
. M
ax.
Min
. M
ax.
Min
. M
ax.
Min
. M
ax.
Min
. M
ax.
AlÚ
Min
A /
Alum
ina
al
úmin
a ca
lcina
da 9
8,5%
al2
o3
Calci
ned
alum
ina
/ d
el. U
k
497
634
517
660
563
718
632
806
485
505
550
575
800
n.d.
85
0 n.
d.
700
775
550
650
baux
ita, g
rado
refra
ctar
io
baux
ite, r
efra
ctor
y Gr
ade
/ Fo
b Gu
yana
160
170
160
170
160
170
160
170
n.d.
n.
d.
n.d.
n.
d.
210
220
540
570
450
510
460
510
AZu
Fre
/ su
lfur
az
ufre
cru
do
Crud
e Su
lfur /
Fob
Van
couv
er
18
n.
d.
52
57
54
65
60
65
58
64
39
48
130
350
40
820
28
40
120
160
borA
tos
/ bo
rate
s
Ácid
o bó
rico,
gra
do té
cnico
bo
ric a
cid /
Fob
Chi
le
Si /
Yes
n.d.
n.d.
n.d.
n.d.
n.d.
n.d.
n.d.
950
n.d.
80
0 n.
d.
735
n.d.
boric
acid
/ F
ob b
ueno
s aire
s Si
/Ye
s n.
d.
n.
d.
n.
d.
n.
d.
n.
d.
n.
d.
n.
d.
n.
d.
n.
d.
71
0 n.
d.bo
ric a
cid, t
ech.
Gra
de /
del
. Uk
45
4 46
8 47
2 48
7 57
1 65
3 64
1 73
2 63
6 72
7 64
4 73
6 70
1 80
1 64
8 74
1 n.
d.
n.
d.
boric
acid
, tec
h. G
rade
/ F
ob C
alifo
rnia
788
812
n.d.
n.d.
n.d.
900
925
900
925
900
925
900
925
n.d.
n.d.
U
lexi
ta /
Ule
xite
40%
b2o
3
Fo
b Ch
ile
Si /
Yes
n.d.
n.d.
n.d.
n.d.
n.d.
n.d.
n.d.
500
n.d.
40
0 n.
d.
400
n.d.
Fob
buen
os a
ires
Si /
Yes
n.d.
n.d.
n.d.
n.d.
n.d.
n.d.
n.d.
390
410
350
380
350
380
Fob
lim
a Si
/Ye
s n.
d.
25
0 30
0 25
0 30
0 25
0 30
0 25
0 30
0 25
0 30
0 25
0 30
0 49
0 52
0 25
0 30
0 35
0 39
0cA
olí
n /
Kao
lin
Ca
olín
, gra
do re
cubr
imie
nto
kaol
in, C
oatin
g Gr
ade
/ ex
-Geo
rgia
Si
/Ye
s 94
20
4 94
20
4 94
20
4 94
20
4 94
20
4 94
20
4 94
20
4 10
5 20
4 10
5 20
4 10
5 20
4pa
per c
oatin
g gr
ade,
bul
k, C&
F eu
rope
, bra
zil
Si /
Yes
n.d.
n.d.
n.d.
n.d.
n.d.
n.d.
n.d.
n.d.
n.d.
170
225
Caol
ín, g
rado
sani
tario
ka
olin
, San
itary
Gra
de /
ex-
Geor
gia
71
82
71
82
72
83
72
83
72
83
72
83
72
83
72
83
n.
d.
n.
d.
Caol
ín, g
rado
relle
no
kaol
in, F
iller
Gra
de /
ex-
Geor
gia
88
11
0 88
11
0 88
11
0 88
11
0 88
11
0 88
11
0 88
11
0 88
11
0 n.
d.
n.
d.
Caol
ín, g
rado
cer
ámico
ka
olin
, tab
lew
are
Grad
e /
ex-G
eorg
ia
13
8 n.
d.
138
n.d.
13
8 n.
d.
138
n.d.
13
8 n.
d.
138
n.d.
13
8 n.
d.
138
n.d.
n.
d.
n.
d.
Caol
ín, c
alcin
ado
Calci
ned
kaol
in /
ex-
Geor
gia
36
9 43
5 35
3 41
3 35
3 41
3 35
3 41
3 35
3 41
3 35
3 41
3 35
3 41
3 35
3 41
3 n.
d.
n.
d.
cArb
on
Ato
de
cAlc
io /
cal
cium
car
bona
te
Ca
rbon
ato
de c
alcio
, mol
ido
Grou
nd C
C (1
,1 µ
- 0,
7 µ)
Fob
USa
Si
/Ye
s n.
d.
n.
d.
n.
d.
n.
d.
n.
d.
n.
d.
n.
d.
22
0 32
0 22
0 32
0 22
0 32
0Gr
ound
CC
(3 µ
unt
reat
ed) F
ob U
Sa
Si /
Yes
n.d.
n.d.
n.d.
n.d.
n.d.
n.d.
n.d.
204
n.d.
19
3 20
4 19
3 20
4Gr
ound
CC
(22
µ - 1
0 µ)
Fob
USa
Si
/Ye
s n.
d.
n.
d.
n.
d.
n.
d.
n.
d.
n.
d.
n.
d.
44
79
44
79
55
11
6Gr
ound
CC
(50
µ - 2
2 µ)
Fob
USa
Si
/Ye
s n.
d.
n.
d.
n.
d.
n.
d.
n.
d.
n.
d.
n.
d.
23
29
23
29
23
29
Grou
nd C
alciu
m C
arb.
(GCC
) / e
x W
orks
, Uk
Si /
Yes
43
72
45
78
49
85
55
95
55
95
55
96
60
104
56
96
125
161
124
159
carb
onat
o de
cal
cio,
mol
ido
fino
Fine
GCC
/ F
ob U
Sa (7
µ- 5
µ)
12
1 17
6 12
1 17
6 12
1 17
6 12
1 17
6 12
1 17
6 12
1 17
6 12
1 17
6 12
1 17
6 n.
d.
n.
d.
Ultr
a Fi
ne G
CC /
Fob
USa
(2 µ
- 0,5
µ)
15
4 32
0 15
4 32
0 15
4 32
0 15
4 32
0 15
4 32
0 15
4 32
0 15
4 32
0 15
4 32
0 n.
d.
n.
d.
h. b
right
ness
, pap
er G
rade
Fob
USa
(1,5
µ)
18
7 19
8 18
7 19
8 18
7 19
8 18
7 19
8 18
7 19
8 18
7 19
8 18
7 19
8 18
7 19
8 n.
d.
n.
d.
cArb
on
Ato
de
liti
o /
lith
ium
car
bona
te
Ca
rbon
ato
litio
, gra
do té
cnico
li
thiu
m C
arbo
nate
, tec
h. G
rade
/ U
Sa
1.
984
2.64
6 1.
984
2.64
6 2.
094
3.08
6 2.
094
3.08
6 4.
409
5.51
2 5.
952
6.61
4 5.
952
6.61
4 6.
173
6.61
4 6.
173
6.61
4 5.
070
5.29
1es
podu
men
o, c
onc.
>7,2
5% l
i2o
Spod
umen
e /
Fob
W. V
irgin
ia b
ulk
36
4 38
6 36
4 38
6 36
4 38
6 36
4 38
6 36
4 38
6 50
7 54
0 66
1 70
5 68
3 75
0 71
7 77
2 71
7 77
2
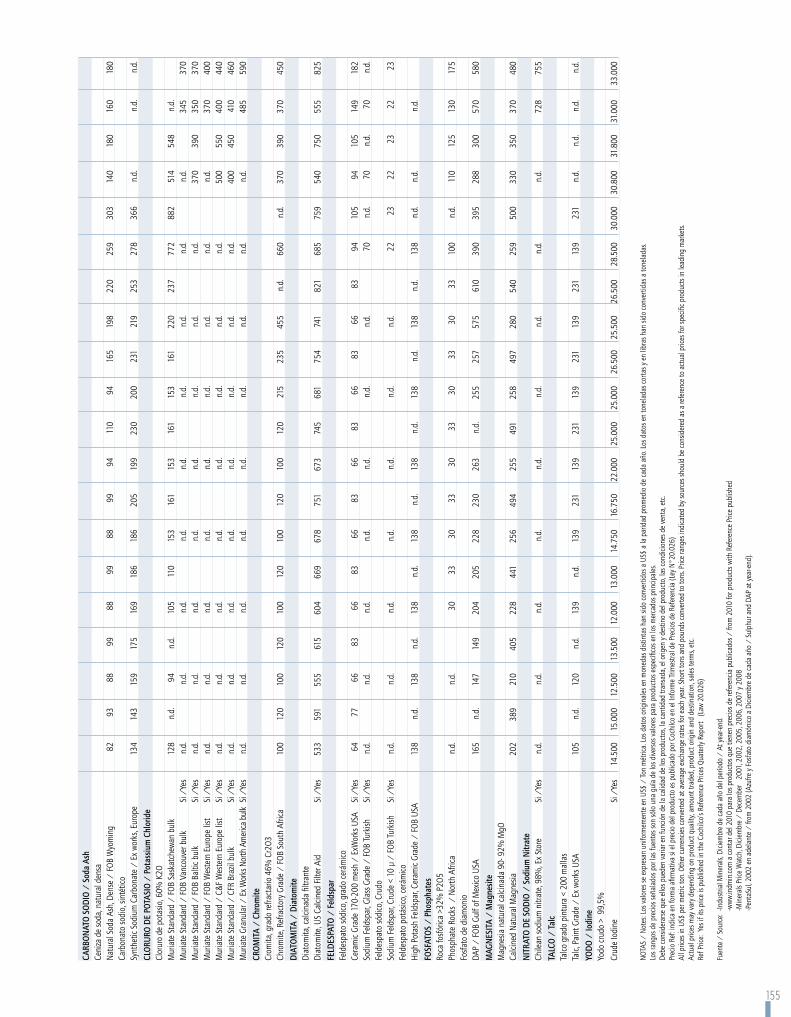
155
cArb
on
Ato
so
dio
/ s
oda
Ash
Ce
niza
de
soda
, nat
ural
den
sa
natu
ral S
oda
ash,
den
se /
Fob
Wyo
min
g
82
93
88
99
88
99
88
99
94
110
94
165
198
220
259
303
140
180
160
180
Carb
onat
o so
dio,
sint
ético
Sy
nthe
tic S
odiu
m C
arbo
nate
/ e
x w
orks
, eur
ope
13
4 14
3 15
9 17
5 16
9 18
6 18
6 20
5 19
9 23
0 20
0 23
1 21
9 25
3 27
8 36
6 n.
d.
n.
d.
n.d.
clo
ruro
de
PotA
sio
/ P
otas
sium
chl
orid
e
Clor
uro
de p
otas
io, 6
0% k
2o
Mur
iate
Sta
ndar
d /
Fob
Sask
atch
ewan
bul
k
128
n.d.
94
n.
d.
105
110
153
161
153
161
153
161
220
237
772
882
514
548
n.d.
M
uria
te S
tand
ard
/ Fo
b Va
ncou
ver b
ulk
Si /
Yes
n.d.
n.d.
n.d.
n.d.
n.d.
n.d.
n.d.
n.d.
n.d.
345
370
Mur
iate
Sta
ndar
d /
Fob
balti
c bu
lk
Si /
Yes
n.d.
n.d.
n.d.
n.d.
n.d.
n.d.
n.d.
n.d.
370
390
350
370
Mur
iate
Sta
ndar
d /
Fob
Wes
tern
eur
ope
list
Si /
Yes
n.d.
n.d.
n.d.
n.d.
n.d.
n.d.
n.d.
n.d.
n.d.
370
400
Mur
iate
Sta
ndar
d /
C&F
Wes
tern
eur
ope
list
Si /
Yes
n.d.
n.d.
n.d.
n.d.
n.d.
n.d.
n.d.
n.d.
500
550
400
440
Mur
iate
Sta
ndar
d /
CFr
braz
il bu
lk
Si /
Yes
n.d.
n.d.
n.d.
n.d.
n.d.
n.d.
n.d.
n.d.
400
450
410
460
Mur
iate
Gra
nula
r / e
x Wor
ks n
orth
am
erica
bul
k Si
/Ye
s n.
d.
n.
d.
n.
d.
n.
d.
n.
d.
n.
d.
n.
d.
n.
d.
n.
d.
48
5 59
0
cro
Mit
A /
chro
mite
Crom
ita, g
rado
refra
ctar
io 4
6% C
r2o3
Ch
rom
ite, r
efra
ctor
y Gr
ade
/ Fo
b So
uth
afric
a
100
120
100
120
100
120
100
120
100
120
215
235
455
n.d.
66
0 n.
d.
370
390
370
450
diA
toM
itA
/ d
iato
mite
dia
tom
ita, c
alcin
ada
filtra
nte
dia
tom
ite, U
S Ca
lcine
d Fi
lter a
id
Si /
Yes
533
591
555
615
604
669
678
751
673
745
681
754
741
821
685
759
540
750
555
825
Feld
esPA
to /
Fel
dspa
r
Feld
espa
to só
dico
, gra
do c
erám
ico
Cera
mic
Grad
e 17
0-20
0 m
esh
/ ex
Wor
ks U
Sa
Si /
Yes
64
77
66
83
66
83
66
83
66
83
66
83
66
83
94
105
94
105
149
182
Sodi
um F
elds
par,
Glas
s Gra
de /
Fob
tur
kish
Si
/Ye
s n.
d.
n.
d.
n.
d.
n.
d.
n.
d.
n.
d.
n.
d.
70
n.
d.
70
n.d.
70
n.
d.Fe
ldes
pato
sódi
co, C
rudo
So
dium
Fel
dspa
r, Cr
ude
< 10
µ /
Fob
tur
kish
Si
/Ye
s n.
d.
n.
d.
n.
d.
n.
d.
n.
d.
n.
d.
n.
d.
22
23
22
23
22
23
Feld
espa
to p
otás
ico, c
erám
ico
hig
h po
tash
Fel
dspa
r, Ce
ram
ic Gr
ade
/ Fo
b U
Sa
13
8 n.
d.
138
n.d.
13
8 n.
d.
138
n.d.
13
8 n.
d.
138
n.d.
13
8 n.
d.
138
n.d.
n.
d.
n.
d.
FosF
Ato
s /
Phos
phat
es
ro
ca fo
sfór
ica >
32%
p2o
5
ph
osph
ate
rock
s /
nor
th a
frica
n.d.
n.d.
30
33
30
33
30
33
30
33
30
33
100
n.d.
11
0 12
5 13
0 17
5Fo
sfat
o de
dia
mon
io
dap
/ Fo
b Gu
lf of
Mex
ico U
Sa
16
5 n.
d.
147
149
204
205
228
230
263
n.d.
25
5 25
7 57
5 61
0 39
0 39
5 28
8 30
0 57
0 58
0
MAG
nes
itA
/ M
agne
site
Mag
nesia
nat
ural
cal
cinad
a 90
- 92%
Mgo
Ca
lcine
d na
tura
l Mag
nesia
202
389
210
405
228
441
256
494
255
491
258
497
280
540
259
500
330
350
370
480
nit
rAto
de
sod
io /
sod
ium
nitr
ate
Ch
ilean
sodi
um n
itrat
e, 9
8%, e
x St
ore
Si /
Yes
n.d.
n.d.
n.d.
n.d.
n.d.
n.d.
n.d.
n.d.
n.d.
728
755
tAlc
o /
tal
c
talco
gra
do p
intu
ra <
200
mal
las
talc,
pai
nt G
rade
/ e
x w
orks
USa
105
n.d.
12
0 n.
d.
139
n.d.
13
9 23
1 13
9 23
1 13
9 23
1 13
9 23
1 13
9 23
1 n.
d.
n.d.
n.
d.
n.d.
yod
o /
iodi
ne
Yo
do c
rudo
> 9
9,5%
Crud
e io
dine
Si
/Ye
s 14
.500
15
.000
12
.500
13
.500
12
.000
13
.000
14
.750
16
.750
22
.000
25
.000
25
.000
26
.500
25
.500
26
.500
28
.500
30
.000
30
.800
31
.800
31
.000
33
.000
not
aS /
not
es: l
os v
alor
es se
exp
resa
n un
iform
emen
te e
n U
S$ /
ton
mét
rica.
los
dat
os o
rigin
ales
en
mon
edas
dist
inta
s han
sido
con
verti
dos a
US$
a la
par
idad
pro
med
io d
e ca
da a
ño. l
os d
atos
en
tone
lada
s cor
tas y
en
libra
s han
sido
con
verti
das a
tone
lada
s. lo
s ran
gos d
e pr
ecio
s señ
alad
os p
or la
s fue
ntes
son
sólo
una
guí
a de
los d
ivers
os v
alor
es p
ara
prod
ucto
s esp
ecífi
cos e
n lo
s mer
cado
s prin
cipal
es.
deb
e co
nsid
erar
se q
ue e
llos p
uede
n va
riar e
n fu
nció
n de
la c
alid
ad d
e lo
s pro
duct
os, l
a ca
ntid
ad tr
ansa
da, e
l orig
en y
des
tino
del p
rodu
cto,
las c
ondi
cione
s de
vent
a, e
tc.
prec
io r
ef: i
ndica
en
form
a afi
rmat
iva
si el
pre
cio d
el p
rodu
cto
es p
ublic
ado
por C
ochi
lco e
n el
info
rme
trim
estra
l de
prec
ios d
e re
fere
ncia
(ley
n°2
0.02
6)
all p
rices
in U
S$ p
er m
etric
ton.
oth
er c
urre
ncie
s con
verte
d at
ave
rage
exc
hang
e ra
tes f
or e
ach
year
. Sho
rt to
ns a
nd p
ound
s con
verte
d to
tons
. pric
e ra
nges
indi
cate
d by
sour
ces s
houl
d be
con
sider
ed a
s a re
fere
nce
to a
ctua
l pric
es fo
r spe
cific
prod
ucts
in le
adin
g m
arke
ts.
actu
al p
rices
may
var
y de
pend
ing
on p
rodu
ct q
ualit
y, am
ount
trad
ed, p
rodu
ct o
rigin
and
des
tinat
ion,
sale
s ter
ms,
etc.
ref p
rice:
Yes
if it
s pric
e is
publ
ished
in th
e Co
chilc
o’s r
efer
ence
pric
es Q
uate
rly r
epor
t (l
aw 2
0.02
6)
Fuen
te /
Sou
rce:
-in
dust
rial M
iner
als,
dici
embr
e de
cad
a añ
o de
l per
íodo
/ a
t yea
r-end
.
-w
ww.
indm
in.co
m a
con
tar d
el 2
010
para
los p
rodu
ctos
que
tien
en p
recio
s de
refe
renc
ia p
ublic
ados
/ fr
om 2
010
for p
rodu
cts w
ith r
efer
ence
pric
e pu
blish
ed
-M
iner
als p
rice
Wat
ch, d
iciem
bre
/ d
ecem
ber
200
1, 2
002,
200
5, 2
006,
200
7 y
2008
-pen
taSu
l, 20
02 e
n ad
elan
te /
from
200
2 (a
zufre
y F
osfa
to d
iam
ónico
a d
iciem
bre
de c
ada
año
/ Su
lphu
r and
dap
at y
ear-e
nd).

156
157
2.3COMERCIO INTERNACIONAL DEL COBREWorld coPPer trAde
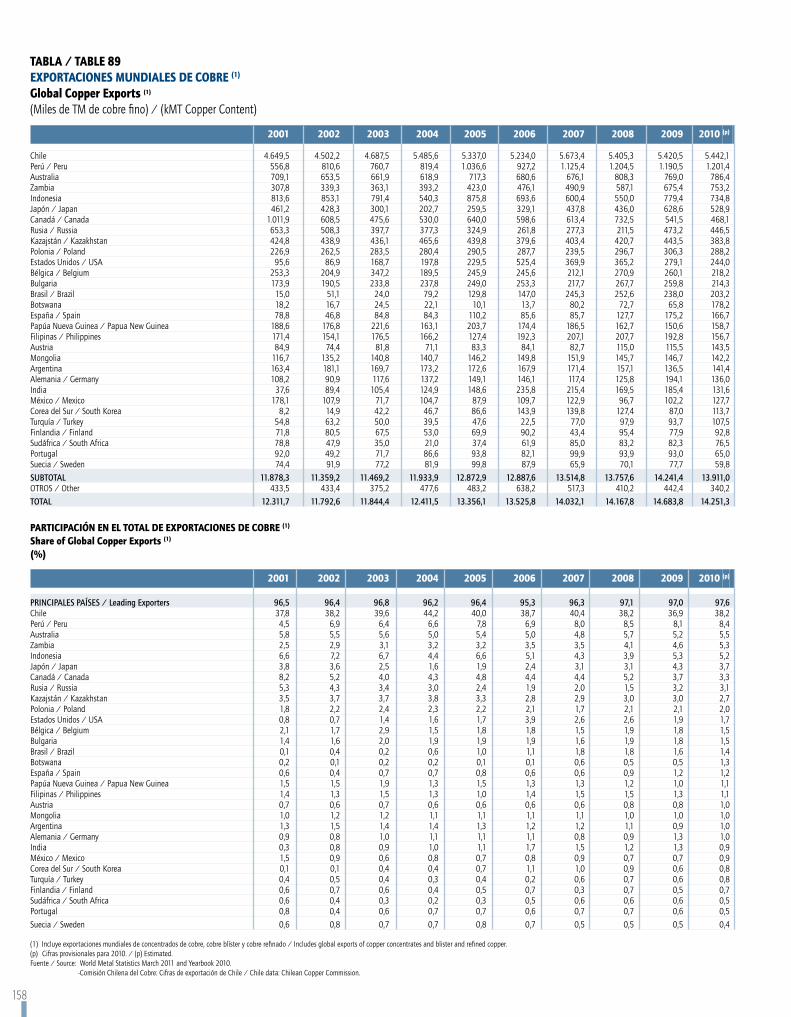
158
TABLA / TABLE 89 EXPORTACIONES MUNDIALES DE COBRE (1) Global Copper Exports (1) (Miles de tM de cobre fino) / (kMt Copper Content) 2001 2002 2003 2004 2005 2006 2007 2008 2009 2010 (p) Chile 4.649,5 4.502,2 4.687,5 5.485,6 5.337,0 5.234,0 5.673,4 5.405,3 5.420,5 5.442,1perú / peru 556,8 810,6 760,7 819,4 1.036,6 927,2 1.125,4 1.204,5 1.190,5 1.201,4australia 709,1 653,5 661,9 618,9 717,3 680,6 676,1 808,3 769,0 786,4Zambia 307,8 339,3 363,1 393,2 423,0 476,1 490,9 587,1 675,4 753,2indonesia 813,6 853,1 791,4 540,3 875,8 693,6 600,4 550,0 779,4 734,8Japón / Japan 461,2 428,3 300,1 202,7 259,5 329,1 437,8 436,0 628,6 528,9Canadá / Canada 1.011,9 608,5 475,6 530,0 640,0 598,6 613,4 732,5 541,5 468,1rusia / russia 653,3 508,3 397,7 377,3 324,9 261,8 277,3 211,5 473,2 446,5kazajstán / kazakhstan 424,8 438,9 436,1 465,6 439,8 379,6 403,4 420,7 443,5 383,8polonia / poland 226,9 262,5 283,5 280,4 290,5 287,7 239,5 296,7 306,3 288,2estados Unidos / USa 95,6 86,9 168,7 197,8 229,5 525,4 369,9 365,2 279,1 244,0bélgica / belgium 253,3 204,9 347,2 189,5 245,9 245,6 212,1 270,9 260,1 218,2bulgaria 173,9 190,5 233,8 237,8 249,0 253,3 217,7 267,7 259,8 214,3brasil / brazil 15,0 51,1 24,0 79,2 129,8 147,0 245,3 252,6 238,0 203,2botswana 18,2 16,7 24,5 22,1 10,1 13,7 80,2 72,7 65,8 178,2españa / Spain 78,8 46,8 84,8 84,3 110,2 85,6 85,7 127,7 175,2 166,7papúa nueva Guinea / papua new Guinea 188,6 176,8 221,6 163,1 203,7 174,4 186,5 162,7 150,6 158,7Filipinas / philippines 171,4 154,1 176,5 166,2 127,4 192,3 207,1 207,7 192,8 156,7austria 84,9 74,4 81,8 71,1 83,3 84,1 82,7 115,0 115,5 143,5Mongolia 116,7 135,2 140,8 140,7 146,2 149,8 151,9 145,7 146,7 142,2argentina 163,4 181,1 169,7 173,2 172,6 167,9 171,4 157,1 136,5 141,4alemania / Germany 108,2 90,9 117,6 137,2 149,1 146,1 117,4 125,8 194,1 136,0india 37,6 89,4 105,4 124,9 148,6 235,8 215,4 169,5 185,4 131,6México / Mexico 178,1 107,9 71,7 104,7 87,9 109,7 122,9 96,7 102,2 127,7Corea del Sur / South korea 8,2 14,9 42,2 46,7 86,6 143,9 139,8 127,4 87,0 113,7turquía / turkey 54,8 63,2 50,0 39,5 47,6 22,5 77,0 97,9 93,7 107,5Finlandia / Finland 71,8 80,5 67,5 53,0 69,9 90,2 43,4 95,4 77,9 92,8Sudáfrica / South africa 78,8 47,9 35,0 21,0 37,4 61,9 85,0 83,2 82,3 76,5portugal 92,0 49,2 71,7 86,6 93,8 82,1 99,9 93,9 93,0 65,0Suecia / Sweden 74,4 91,9 77,2 81,9 99,8 87,9 65,9 70,1 77,7 59,8
subtotAl 11.878,3 11.359,2 11.469,2 11.933,9 12.872,9 12.887,6 13.514,8 13.757,6 14.241,4 13.911,0 otroS / other 433,5 433,4 375,2 477,6 483,2 638,2 517,3 410,2 442,4 340,2
totAl 12.311,7 11.792,6 11.844,4 12.411,5 13.356,1 13.525,8 14.032,1 14.167,8 14.683,8 14.251,3
PARTICIPACIÓN EN EL TOTAL DE EXPORTACIONES DE COBRE (1)
Share of Global Copper Exports (1)
(%) 2001 2002 2003 2004 2005 2006 2007 2008 2009 2010 (p)
PrinciPAles PAíses / leading exporters 96,5 96,4 96,8 96,2 96,4 95,3 96,3 97,1 97,0 97,6 Chile 37,8 38,2 39,6 44,2 40,0 38,7 40,4 38,2 36,9 38,2perú / peru 4,5 6,9 6,4 6,6 7,8 6,9 8,0 8,5 8,1 8,4australia 5,8 5,5 5,6 5,0 5,4 5,0 4,8 5,7 5,2 5,5Zambia 2,5 2,9 3,1 3,2 3,2 3,5 3,5 4,1 4,6 5,3indonesia 6,6 7,2 6,7 4,4 6,6 5,1 4,3 3,9 5,3 5,2Japón / Japan 3,8 3,6 2,5 1,6 1,9 2,4 3,1 3,1 4,3 3,7Canadá / Canada 8,2 5,2 4,0 4,3 4,8 4,4 4,4 5,2 3,7 3,3rusia / russia 5,3 4,3 3,4 3,0 2,4 1,9 2,0 1,5 3,2 3,1kazajstán / kazakhstan 3,5 3,7 3,7 3,8 3,3 2,8 2,9 3,0 3,0 2,7polonia / poland 1,8 2,2 2,4 2,3 2,2 2,1 1,7 2,1 2,1 2,0estados Unidos / USa 0,8 0,7 1,4 1,6 1,7 3,9 2,6 2,6 1,9 1,7bélgica / belgium 2,1 1,7 2,9 1,5 1,8 1,8 1,5 1,9 1,8 1,5bulgaria 1,4 1,6 2,0 1,9 1,9 1,9 1,6 1,9 1,8 1,5brasil / brazil 0,1 0,4 0,2 0,6 1,0 1,1 1,8 1,8 1,6 1,4botswana 0,2 0,1 0,2 0,2 0,1 0,1 0,6 0,5 0,5 1,3españa / Spain 0,6 0,4 0,7 0,7 0,8 0,6 0,6 0,9 1,2 1,2papúa nueva Guinea / papua new Guinea 1,5 1,5 1,9 1,3 1,5 1,3 1,3 1,2 1,0 1,1Filipinas / philippines 1,4 1,3 1,5 1,3 1,0 1,4 1,5 1,5 1,3 1,1austria 0,7 0,6 0,7 0,6 0,6 0,6 0,6 0,8 0,8 1,0Mongolia 1,0 1,2 1,2 1,1 1,1 1,1 1,1 1,0 1,0 1,0argentina 1,3 1,5 1,4 1,4 1,3 1,2 1,2 1,1 0,9 1,0alemania / Germany 0,9 0,8 1,0 1,1 1,1 1,1 0,8 0,9 1,3 1,0india 0,3 0,8 0,9 1,0 1,1 1,7 1,5 1,2 1,3 0,9México / Mexico 1,5 0,9 0,6 0,8 0,7 0,8 0,9 0,7 0,7 0,9Corea del Sur / South korea 0,1 0,1 0,4 0,4 0,7 1,1 1,0 0,9 0,6 0,8turquía / turkey 0,4 0,5 0,4 0,3 0,4 0,2 0,6 0,7 0,6 0,8Finlandia / Finland 0,6 0,7 0,6 0,4 0,5 0,7 0,3 0,7 0,5 0,7Sudáfrica / South africa 0,6 0,4 0,3 0,2 0,3 0,5 0,6 0,6 0,6 0,5portugal 0,8 0,4 0,6 0,7 0,7 0,6 0,7 0,7 0,6 0,5
Suecia / Sweden 0,6 0,8 0,7 0,7 0,8 0,7 0,5 0,5 0,5 0,4
(1) incluye exportaciones mundiales de concentrados de cobre, cobre blíster y cobre refinado / includes global exports of copper concentrates and blister and refined copper. (p) Cifras provisionales para 2010. / (p) estimated. Fuente / Source: World Metal Statistics March 2011 and Yearbook 2010. -Comisión Chilena del Cobre: Cifras de exportación de Chile / Chile data: Chilean Copper Commission.
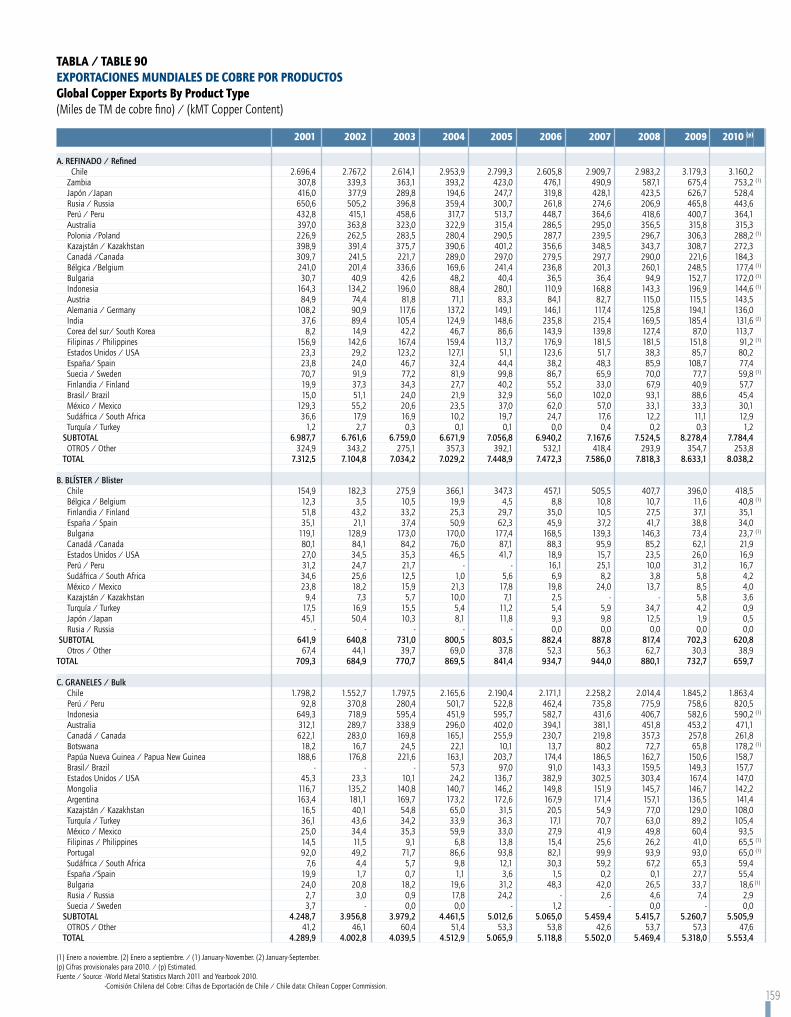
159
TABLA / TABLE 90EXPORTACIONES MUNDIALES DE COBRE POR PRODUCTOS Global Copper Exports By Product Type(Miles de tM de cobre fino) / (kMt Copper Content)
2001 2002 2003 2004 2005 2006 2007 2008 2009 2010 (p)
A. reFinAdo / refined Chile 2.696,4 2.767,2 2.614,1 2.953,9 2.799,3 2.605,8 2.909,7 2.983,2 3.179,3 3.160,2 Zambia 307,8 339,3 363,1 393,2 423,0 476,1 490,9 587,1 675,4 753,2 (1)
Japón /Japan 416,0 377,9 289,8 194,6 247,7 319,8 428,1 423,5 626,7 528,4 rusia / russia 650,6 505,2 396,8 359,4 300,7 261,8 274,6 206,9 465,8 443,6 perú / peru 432,8 415,1 458,6 317,7 513,7 448,7 364,6 418,6 400,7 364,1 australia 397,0 363,8 323,0 322,9 315,4 286,5 295,0 356,5 315,8 315,3 polonia /poland 226,9 262,5 283,5 280,4 290,5 287,7 239,5 296,7 306,3 288,2 (1)
kazajstán / kazakhstan 398,9 391,4 375,7 390,6 401,2 356,6 348,5 343,7 308,7 272,3 Canadá /Canada 309,7 241,5 221,7 289,0 297,0 279,5 297,7 290,0 221,6 184,3 bélgica /belgium 241,0 201,4 336,6 169,6 241,4 236,8 201,3 260,1 248,5 177,4 (1)
bulgaria 30,7 40,9 42,6 48,2 40,4 36,5 36,4 94,9 152,7 172,0 (1)
indonesia 164,3 134,2 196,0 88,4 280,1 110,9 168,8 143,3 196,9 144,6 (1)
austria 84,9 74,4 81,8 71,1 83,3 84,1 82,7 115,0 115,5 143,5 alemania / Germany 108,2 90,9 117,6 137,2 149,1 146,1 117,4 125,8 194,1 136,0 india 37,6 89,4 105,4 124,9 148,6 235,8 215,4 169,5 185,4 131,6 (2)
Corea del sur/ South korea 8,2 14,9 42,2 46,7 86,6 143,9 139,8 127,4 87,0 113,7 Filipinas / philippines 156,9 142,6 167,4 159,4 113,7 176,9 181,5 181,5 151,8 91,2 (1)
estados Unidos / USa 23,3 29,2 123,2 127,1 51,1 123,6 51,7 38,3 85,7 80,2 españa/ Spain 23,8 24,0 46,7 32,4 44,4 38,2 48,3 85,9 108,7 77,4 Suecia / Sweden 70,7 91,9 77,2 81,9 99,8 86,7 65,9 70,0 77,7 59,8 (1)
Finlandia / Finland 19,9 37,3 34,3 27,7 40,2 55,2 33,0 67,9 40,9 57,7 brasil/ brazil 15,0 51,1 24,0 21,9 32,9 56,0 102,0 93,1 88,6 45,4 México / Mexico 129,3 55,2 20,6 23,5 37,0 62,0 57,0 33,1 33,3 30,1 Sudáfrica / South africa 36,6 17,9 16,9 10,2 19,7 24,7 17,6 12,2 11,1 12,9 turquía / turkey 1,2 2,7 0,3 0,1 0,1 0,0 0,4 0,2 0,3 1,2 subtotAl 6.987,7 6.761,6 6.759,0 6.671,9 7.056,8 6.940,2 7.167,6 7.524,5 8.278,4 7.784,4 otroS / other 324,9 343,2 275,1 357,3 392,1 532,1 418,4 293,9 354,7 253,8 totAl 7.312,5 7.104,8 7.034,2 7.029,2 7.448,9 7.472,3 7.586,0 7.818,3 8.633,1 8.038,2
b. blíster / blister Chile 154,9 182,3 275,9 366,1 347,3 457,1 505,5 407,7 396,0 418,5 bélgica / belgium 12,3 3,5 10,5 19,9 4,5 8,8 10,8 10,7 11,6 40,8 (1)
Finlandia / Finland 51,8 43,2 33,2 25,3 29,7 35,0 10,5 27,5 37,1 35,1 españa / Spain 35,1 21,1 37,4 50,9 62,3 45,9 37,2 41,7 38,8 34,0 bulgaria 119,1 128,9 173,0 170,0 177,4 168,5 139,3 146,3 73,4 23,7 (1)
Canadá /Canada 80,1 84,1 84,2 76,0 87,1 88,3 95,9 85,2 62,1 21,9 estados Unidos / USa 27,0 34,5 35,3 46,5 41,7 18,9 15,7 23,5 26,0 16,9 perú / peru 31,2 24,7 21,7 - - 16,1 25,1 10,0 31,2 16,7 Sudáfrica / South africa 34,6 25,6 12,5 1,0 5,6 6,9 8,2 3,8 5,8 4,2 México / Mexico 23,8 18,2 15,9 21,3 17,8 19,8 24,0 13,7 8,5 4,0 kazajstán / kazakhstan 9,4 7,3 5,7 10,0 7,1 2,5 - - 5,8 3,6 turquía / turkey 17,5 16,9 15,5 5,4 11,2 5,4 5,9 34,7 4,2 0,9 Japón /Japan 45,1 50,4 10,3 8,1 11,8 9,3 9,8 12,5 1,9 0,5 rusia / russia - - - - - 0,0 0,0 0,0 0,0 0,0 subtotAl 641,9 640,8 731,0 800,5 803,5 882,4 887,8 817,4 702,3 620,8 otros / other 67,4 44,1 39,7 69,0 37,8 52,3 56,3 62,7 30,3 38,9totAl 709,3 684,9 770,7 869,5 841,4 934,7 944,0 880,1 732,7 659,7
c. GrAneles / bulk Chile 1.798,2 1.552,7 1.797,5 2.165,6 2.190,4 2.171,1 2.258,2 2.014,4 1.845,2 1.863,4 perú / peru 92,8 370,8 280,4 501,7 522,8 462,4 735,8 775,9 758,6 820,5 indonesia 649,3 718,9 595,4 451,9 595,7 582,7 431,6 406,7 582,6 590,2 (1)
australia 312,1 289,7 338,9 296,0 402,0 394,1 381,1 451,8 453,2 471,1 Canadá / Canada 622,1 283,0 169,8 165,1 255,9 230,7 219,8 357,3 257,8 261,8 botswana 18,2 16,7 24,5 22,1 10,1 13,7 80,2 72,7 65,8 178,2 (1)
papúa nueva Guinea / papua new Guinea 188,6 176,8 221,6 163,1 203,7 174,4 186,5 162,7 150,6 158,7 brasil/ brazil - - - 57,3 97,0 91,0 143,3 159,5 149,3 157,7 estados Unidos / USa 45,3 23,3 10,1 24,2 136,7 382,9 302,5 303,4 167,4 147,0 Mongolia 116,7 135,2 140,8 140,7 146,2 149,8 151,9 145,7 146,7 142,2 argentina 163,4 181,1 169,7 173,2 172,6 167,9 171,4 157,1 136,5 141,4 kazajstán / kazakhstan 16,5 40,1 54,8 65,0 31,5 20,5 54,9 77,0 129,0 108,0 turquía / turkey 36,1 43,6 34,2 33,9 36,3 17,1 70,7 63,0 89,2 105,4 México / Mexico 25,0 34,4 35,3 59,9 33,0 27,9 41,9 49,8 60,4 93,5 Filipinas / philippines 14,5 11,5 9,1 6,8 13,8 15,4 25,6 26,2 41,0 65,5 (1)
portugal 92,0 49,2 71,7 86,6 93,8 82,1 99,9 93,9 93,0 65,0 (1)
Sudáfrica / South africa 7,6 4,4 5,7 9,8 12,1 30,3 59,2 67,2 65,3 59,4 españa /Spain 19,9 1,7 0,7 1,1 3,6 1,5 0,2 0,1 27,7 55,4 bulgaria 24,0 20,8 18,2 19,6 31,2 48,3 42,0 26,5 33,7 18,6 (1)
rusia / russia 2,7 3,0 0,9 17,8 24,2 - 2,6 4,6 7,4 2,9 Suecia / Sweden 3,7 - 0,0 0,0 - 1,2 - 0,0 - 0,0 subtotAl 4.248,7 3.956,8 3.979,2 4.461,5 5.012,6 5.065,0 5.459,4 5.415,7 5.260,7 5.505,9 otroS / other 41,2 46,1 60,4 51,4 53,3 53,8 42,6 53,7 57,3 47,6 totAl 4.289,9 4.002,8 4.039,5 4.512,9 5.065,9 5.118,8 5.502,0 5.469,4 5.318,0 5.553,4
(1) enero a noviembre. (2) enero a septiembre. / (1) January-november. (2) January-September. (p) Cifras provisionales para 2010. / (p) estimated. Fuente / Source: -World Metal Statistics March 2011 and Yearbook 2010. -Comisión Chilena del Cobre: Cifras de exportación de Chile / Chile data: Chilean Copper Commission.
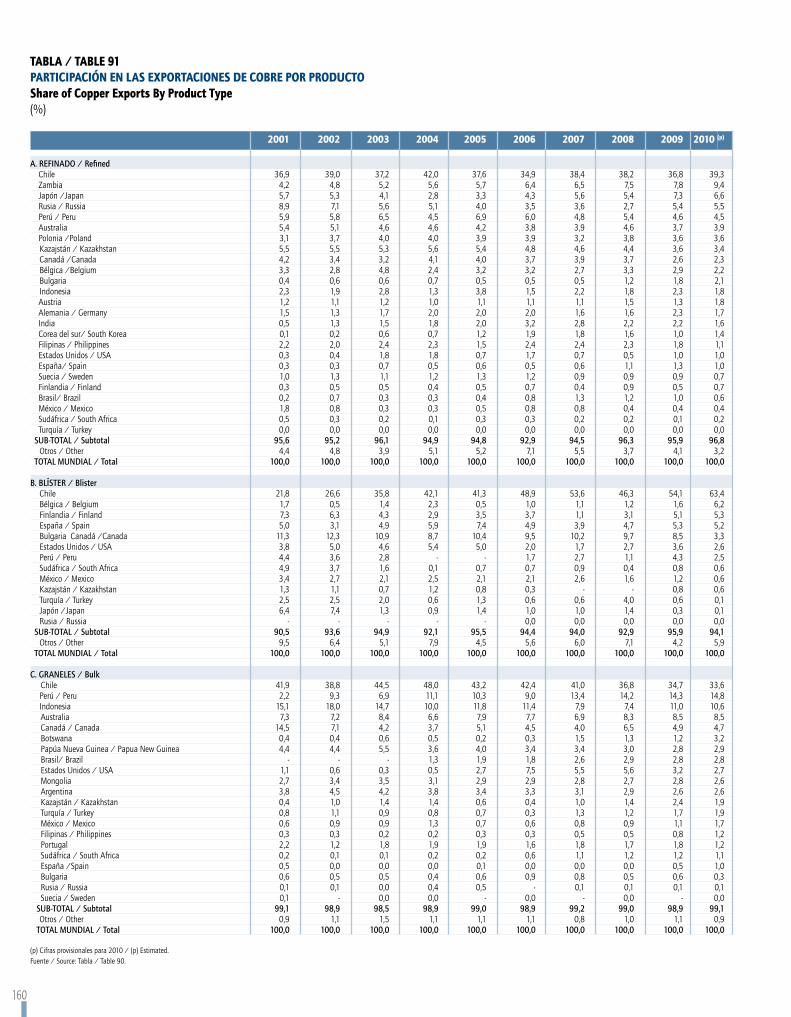
160
TABLA / TABLE 91 PARTICIPACIÓN EN LAS EXPORTACIONES DE COBRE POR PRODUCTO Share of Copper Exports By Product Type (%)
2001 2002 2003 2004 2005 2006 2007 2008 2009 2010 (p)
A. reFinAdo / refined Chile 36,9 39,0 37,2 42,0 37,6 34,9 38,4 38,2 36,8 39,3 Zambia 4,2 4,8 5,2 5,6 5,7 6,4 6,5 7,5 7,8 9,4 Japón /Japan 5,7 5,3 4,1 2,8 3,3 4,3 5,6 5,4 7,3 6,6 rusia / russia 8,9 7,1 5,6 5,1 4,0 3,5 3,6 2,7 5,4 5,5 perú / peru 5,9 5,8 6,5 4,5 6,9 6,0 4,8 5,4 4,6 4,5 australia 5,4 5,1 4,6 4,6 4,2 3,8 3,9 4,6 3,7 3,9 polonia /poland 3,1 3,7 4,0 4,0 3,9 3,9 3,2 3,8 3,6 3,6 kazajstán / kazakhstan 5,5 5,5 5,3 5,6 5,4 4,8 4,6 4,4 3,6 3,4 Canadá /Canada 4,2 3,4 3,2 4,1 4,0 3,7 3,9 3,7 2,6 2,3 bélgica /belgium 3,3 2,8 4,8 2,4 3,2 3,2 2,7 3,3 2,9 2,2 bulgaria 0,4 0,6 0,6 0,7 0,5 0,5 0,5 1,2 1,8 2,1 indonesia 2,3 1,9 2,8 1,3 3,8 1,5 2,2 1,8 2,3 1,8 austria 1,2 1,1 1,2 1,0 1,1 1,1 1,1 1,5 1,3 1,8 alemania / Germany 1,5 1,3 1,7 2,0 2,0 2,0 1,6 1,6 2,3 1,7 india 0,5 1,3 1,5 1,8 2,0 3,2 2,8 2,2 2,2 1,6 Corea del sur/ South korea 0,1 0,2 0,6 0,7 1,2 1,9 1,8 1,6 1,0 1,4 Filipinas / philippines 2,2 2,0 2,4 2,3 1,5 2,4 2,4 2,3 1,8 1,1 estados Unidos / USa 0,3 0,4 1,8 1,8 0,7 1,7 0,7 0,5 1,0 1,0 españa/ Spain 0,3 0,3 0,7 0,5 0,6 0,5 0,6 1,1 1,3 1,0 Suecia / Sweden 1,0 1,3 1,1 1,2 1,3 1,2 0,9 0,9 0,9 0,7 Finlandia / Finland 0,3 0,5 0,5 0,4 0,5 0,7 0,4 0,9 0,5 0,7 brasil/ brazil 0,2 0,7 0,3 0,3 0,4 0,8 1,3 1,2 1,0 0,6 México / Mexico 1,8 0,8 0,3 0,3 0,5 0,8 0,8 0,4 0,4 0,4 Sudáfrica / South africa 0,5 0,3 0,2 0,1 0,3 0,3 0,2 0,2 0,1 0,2 turquía / turkey 0,0 0,0 0,0 0,0 0,0 0,0 0,0 0,0 0,0 0,0 sub-totAl / subtotal 95,6 95,2 96,1 94,9 94,8 92,9 94,5 96,3 95,9 96,8 otros / other 4,4 4,8 3,9 5,1 5,2 7,1 5,5 3,7 4,1 3,2 totAl MundiAl / total 100,0 100,0 100,0 100,0 100,0 100,0 100,0 100,0 100,0 100,0 b. blíster / blister Chile 21,8 26,6 35,8 42,1 41,3 48,9 53,6 46,3 54,1 63,4 bélgica / belgium 1,7 0,5 1,4 2,3 0,5 1,0 1,1 1,2 1,6 6,2 Finlandia / Finland 7,3 6,3 4,3 2,9 3,5 3,7 1,1 3,1 5,1 5,3 españa / Spain 5,0 3,1 4,9 5,9 7,4 4,9 3,9 4,7 5,3 5,2 bulgaria Canadá /Canada 11,3 12,3 10,9 8,7 10,4 9,5 10,2 9,7 8,5 3,3 estados Unidos / USa 3,8 5,0 4,6 5,4 5,0 2,0 1,7 2,7 3,6 2,6 perú / peru 4,4 3,6 2,8 - - 1,7 2,7 1,1 4,3 2,5 Sudáfrica / South africa 4,9 3,7 1,6 0,1 0,7 0,7 0,9 0,4 0,8 0,6 México / Mexico 3,4 2,7 2,1 2,5 2,1 2,1 2,6 1,6 1,2 0,6 kazajstán / kazakhstan 1,3 1,1 0,7 1,2 0,8 0,3 - - 0,8 0,6 turquía / turkey 2,5 2,5 2,0 0,6 1,3 0,6 0,6 4,0 0,6 0,1 Japón /Japan 6,4 7,4 1,3 0,9 1,4 1,0 1,0 1,4 0,3 0,1 rusia / russia - - - - - 0,0 0,0 0,0 0,0 0,0 sub-totAl / subtotal 90,5 93,6 94,9 92,1 95,5 94,4 94,0 92,9 95,9 94,1 otros / other 9,5 6,4 5,1 7,9 4,5 5,6 6,0 7,1 4,2 5,9 totAl MundiAl / total 100,0 100,0 100,0 100,0 100,0 100,0 100,0 100,0 100,0 100,0
c. GrAneles / bulk Chile 41,9 38,8 44,5 48,0 43,2 42,4 41,0 36,8 34,7 33,6 perú / peru 2,2 9,3 6,9 11,1 10,3 9,0 13,4 14,2 14,3 14,8 indonesia 15,1 18,0 14,7 10,0 11,8 11,4 7,9 7,4 11,0 10,6 australia 7,3 7,2 8,4 6,6 7,9 7,7 6,9 8,3 8,5 8,5 Canadá / Canada 14,5 7,1 4,2 3,7 5,1 4,5 4,0 6,5 4,9 4,7 botswana 0,4 0,4 0,6 0,5 0,2 0,3 1,5 1,3 1,2 3,2 papúa nueva Guinea / papua new Guinea 4,4 4,4 5,5 3,6 4,0 3,4 3,4 3,0 2,8 2,9 brasil/ brazil - - - 1,3 1,9 1,8 2,6 2,9 2,8 2,8 estados Unidos / USa 1,1 0,6 0,3 0,5 2,7 7,5 5,5 5,6 3,2 2,7 Mongolia 2,7 3,4 3,5 3,1 2,9 2,9 2,8 2,7 2,8 2,6 argentina 3,8 4,5 4,2 3,8 3,4 3,3 3,1 2,9 2,6 2,6 kazajstán / kazakhstan 0,4 1,0 1,4 1,4 0,6 0,4 1,0 1,4 2,4 1,9 turquía / turkey 0,8 1,1 0,9 0,8 0,7 0,3 1,3 1,2 1,7 1,9 México / Mexico 0,6 0,9 0,9 1,3 0,7 0,6 0,8 0,9 1,1 1,7 Filipinas / philippines 0,3 0,3 0,2 0,2 0,3 0,3 0,5 0,5 0,8 1,2 portugal 2,2 1,2 1,8 1,9 1,9 1,6 1,8 1,7 1,8 1,2 Sudáfrica / South africa 0,2 0,1 0,1 0,2 0,2 0,6 1,1 1,2 1,2 1,1 españa /Spain 0,5 0,0 0,0 0,0 0,1 0,0 0,0 0,0 0,5 1,0 bulgaria 0,6 0,5 0,5 0,4 0,6 0,9 0,8 0,5 0,6 0,3 rusia / russia 0,1 0,1 0,0 0,4 0,5 - 0,1 0,1 0,1 0,1 Suecia / Sweden 0,1 - 0,0 0,0 - 0,0 - 0,0 - 0,0 sub-totAl / subtotal 99,1 98,9 98,5 98,9 99,0 98,9 99,2 99,0 98,9 99,1 otros / other 0,9 1,1 1,5 1,1 1,1 1,1 0,8 1,0 1,1 0,9 totAl MundiAl / total 100,0 100,0 100,0 100,0 100,0 100,0 100,0 100,0 100,0 100,0
(p) Cifras provisionales para 2010 / (p) estimated. Fuente / Source: tabla / table 90.
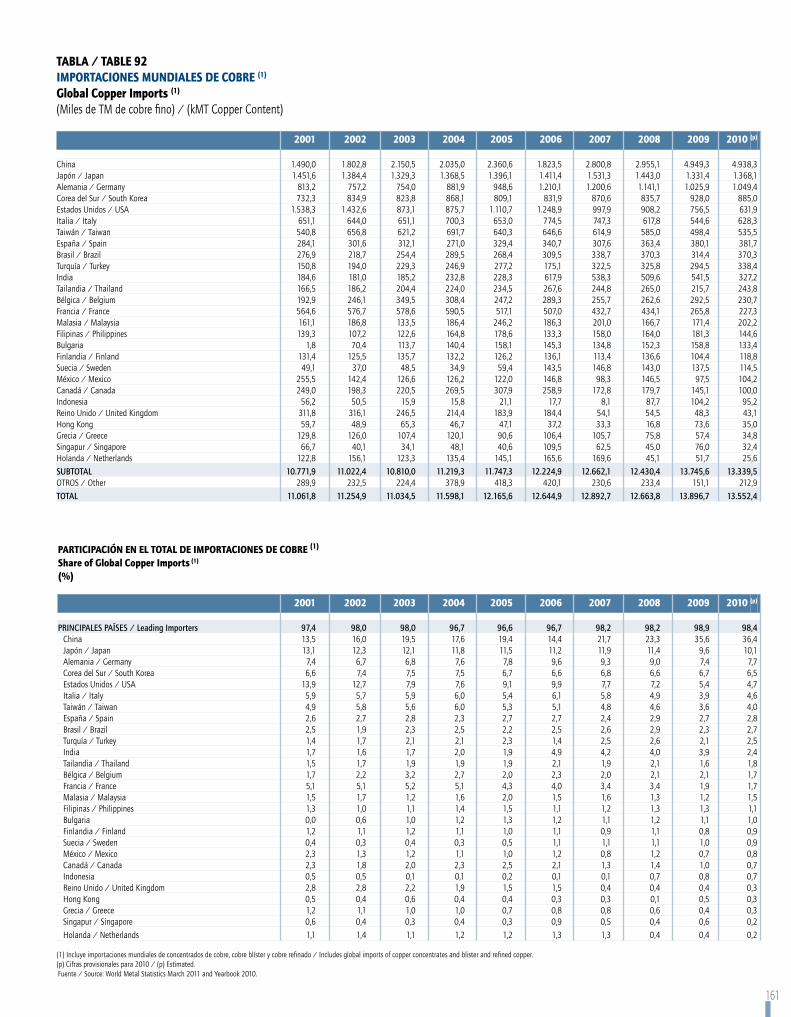
161
TABLA / TABLE 92IMPORTACIONES MUNDIALES DE COBRE (1)
Global Copper Imports (1)
(Miles de tM de cobre fino) / (kMt Copper Content)
2001 2002 2003 2004 2005 2006 2007 2008 2009 2010 (p) China 1.490,0 1.802,8 2.150,5 2.035,0 2.360,6 1.823,5 2.800,8 2.955,1 4.949,3 4.938,3Japón / Japan 1.451,6 1.384,4 1.329,3 1.368,5 1.396,1 1.411,4 1.531,3 1.443,0 1.331,4 1.368,1alemania / Germany 813,2 757,2 754,0 881,9 948,6 1.210,1 1.200,6 1.141,1 1.025,9 1.049,4 Corea del Sur / South korea 732,3 834,9 823,8 868,1 809,1 831,9 870,6 835,7 928,0 885,0 estados Unidos / USa 1.538,3 1.432,6 873,1 875,7 1.110,7 1.248,9 997,9 908,2 756,5 631,9italia / italy 651,1 644,0 651,1 700,3 653,0 774,5 747,3 617,8 544,6 628,3 taiwán / taiwan 540,8 656,8 621,2 691,7 640,3 646,6 614,9 585,0 498,4 535,5españa / Spain 284,1 301,6 312,1 271,0 329,4 340,7 307,6 363,4 380,1 381,7brasil / brazil 276,9 218,7 254,4 289,5 268,4 309,5 338,7 370,3 314,4 370,3turquía / turkey 150,8 194,0 229,3 246,9 277,2 175,1 322,5 325,8 294,5 338,4india 184,6 181,0 185,2 232,8 228,3 617,9 538,3 509,6 541,5 327,2tailandia / thailand 166,5 186,2 204,4 224,0 234,5 267,6 244,8 265,0 215,7 243,8bélgica / belgium 192,9 246,1 349,5 308,4 247,2 289,3 255,7 262,6 292,5 230,7Francia / France 564,6 576,7 578,6 590,5 517,1 507,0 432,7 434,1 265,8 227,3Malasia / Malaysia 161,1 186,8 133,5 186,4 246,2 186,3 201,0 166,7 171,4 202,2Filipinas / philippines 139,3 107,2 122,6 164,8 178,6 133,3 158,0 164,0 181,3 144,6bulgaria 1,8 70,4 113,7 140,4 158,1 145,3 134,8 152,3 158,8 133,4 Finlandia / Finland 131,4 125,5 135,7 132,2 126,2 136,1 113,4 136,6 104,4 118,8 Suecia / Sweden 49,1 37,0 48,5 34,9 59,4 143,5 146,8 143,0 137,5 114,5 México / Mexico 255,5 142,4 126,6 126,2 122,0 146,8 98,3 146,5 97,5 104,2 Canadá / Canada 249,0 198,3 220,5 269,5 307,9 258,9 172,8 179,7 145,1 100,0 indonesia 56,2 50,5 15,9 15,8 21,1 17,7 8,1 87,7 104,2 95,2reino Unido / United kingdom 311,8 316,1 246,5 214,4 183,9 184,4 54,1 54,5 48,3 43,1hong kong 59,7 48,9 65,3 46,7 47,1 37,2 33,3 16,8 73,6 35,0Grecia / Greece 129,8 126,0 107,4 120,1 90,6 106,4 105,7 75,8 57,4 34,8Singapur / Singapore 66,7 40,1 34,1 48,1 40,6 109,5 62,5 45,0 76,0 32,4holanda / netherlands 122,8 156,1 123,3 135,4 145,1 165,6 169,6 45,1 51,7 25,6
subtotAl 10.771,9 11.022,4 10.810,0 11.219,3 11.747,3 12.224,9 12.662,1 12.430,4 13.745,6 13.339,5 otroS / other 289,9 232,5 224,4 378,9 418,3 420,1 230,6 233,4 151,1 212,9
totAl 11.061,8 11.254,9 11.034,5 11.598,1 12.165,6 12.644,9 12.892,7 12.663,8 13.896,7 13.552,4
PARTICIPACIÓN EN EL TOTAL DE IMPORTACIONES DE COBRE (1)
Share of Global Copper Imports (1)
(%)
2001 2002 2003 2004 2005 2006 2007 2008 2009 2010 (p) PrinciPAles PAíses / leading importers 97,4 98,0 98,0 96,7 96,6 96,7 98,2 98,2 98,9 98,4
China 13,5 16,0 19,5 17,6 19,4 14,4 21,7 23,3 35,6 36,4Japón / Japan 13,1 12,3 12,1 11,8 11,5 11,2 11,9 11,4 9,6 10,1alemania / Germany 7,4 6,7 6,8 7,6 7,8 9,6 9,3 9,0 7,4 7,7Corea del Sur / South korea 6,6 7,4 7,5 7,5 6,7 6,6 6,8 6,6 6,7 6,5estados Unidos / USa 13,9 12,7 7,9 7,6 9,1 9,9 7,7 7,2 5,4 4,7italia / italy 5,9 5,7 5,9 6,0 5,4 6,1 5,8 4,9 3,9 4,6taiwán / taiwan 4,9 5,8 5,6 6,0 5,3 5,1 4,8 4,6 3,6 4,0españa / Spain 2,6 2,7 2,8 2,3 2,7 2,7 2,4 2,9 2,7 2,8brasil / brazil 2,5 1,9 2,3 2,5 2,2 2,5 2,6 2,9 2,3 2,7turquía / turkey 1,4 1,7 2,1 2,1 2,3 1,4 2,5 2,6 2,1 2,5india 1,7 1,6 1,7 2,0 1,9 4,9 4,2 4,0 3,9 2,4tailandia / thailand 1,5 1,7 1,9 1,9 1,9 2,1 1,9 2,1 1,6 1,8bélgica / belgium 1,7 2,2 3,2 2,7 2,0 2,3 2,0 2,1 2,1 1,7Francia / France 5,1 5,1 5,2 5,1 4,3 4,0 3,4 3,4 1,9 1,7Malasia / Malaysia 1,5 1,7 1,2 1,6 2,0 1,5 1,6 1,3 1,2 1,5Filipinas / philippines 1,3 1,0 1,1 1,4 1,5 1,1 1,2 1,3 1,3 1,1bulgaria 0,0 0,6 1,0 1,2 1,3 1,2 1,1 1,2 1,1 1,0Finlandia / Finland 1,2 1,1 1,2 1,1 1,0 1,1 0,9 1,1 0,8 0,9Suecia / Sweden 0,4 0,3 0,4 0,3 0,5 1,1 1,1 1,1 1,0 0,9México / Mexico 2,3 1,3 1,2 1,1 1,0 1,2 0,8 1,2 0,7 0,8Canadá / Canada 2,3 1,8 2,0 2,3 2,5 2,1 1,3 1,4 1,0 0,7indonesia 0,5 0,5 0,1 0,1 0,2 0,1 0,1 0,7 0,8 0,7reino Unido / United kingdom 2,8 2,8 2,2 1,9 1,5 1,5 0,4 0,4 0,4 0,3hong kong 0,5 0,4 0,6 0,4 0,4 0,3 0,3 0,1 0,5 0,3Grecia / Greece 1,2 1,1 1,0 1,0 0,7 0,8 0,8 0,6 0,4 0,3Singapur / Singapore 0,6 0,4 0,3 0,4 0,3 0,9 0,5 0,4 0,6 0,2
holanda / netherlands 1,1 1,4 1,1 1,2 1,2 1,3 1,3 0,4 0,4 0,2
(1) incluye importaciones mundiales de concentrados de cobre, cobre blíster y cobre refinado / includes global imports of copper concentrates and blister and refined copper. (p) Cifras provisionales para 2010 / (p) estimated. Fuente / Source: World Metal Statistics March 2011 and Yearbook 2010.
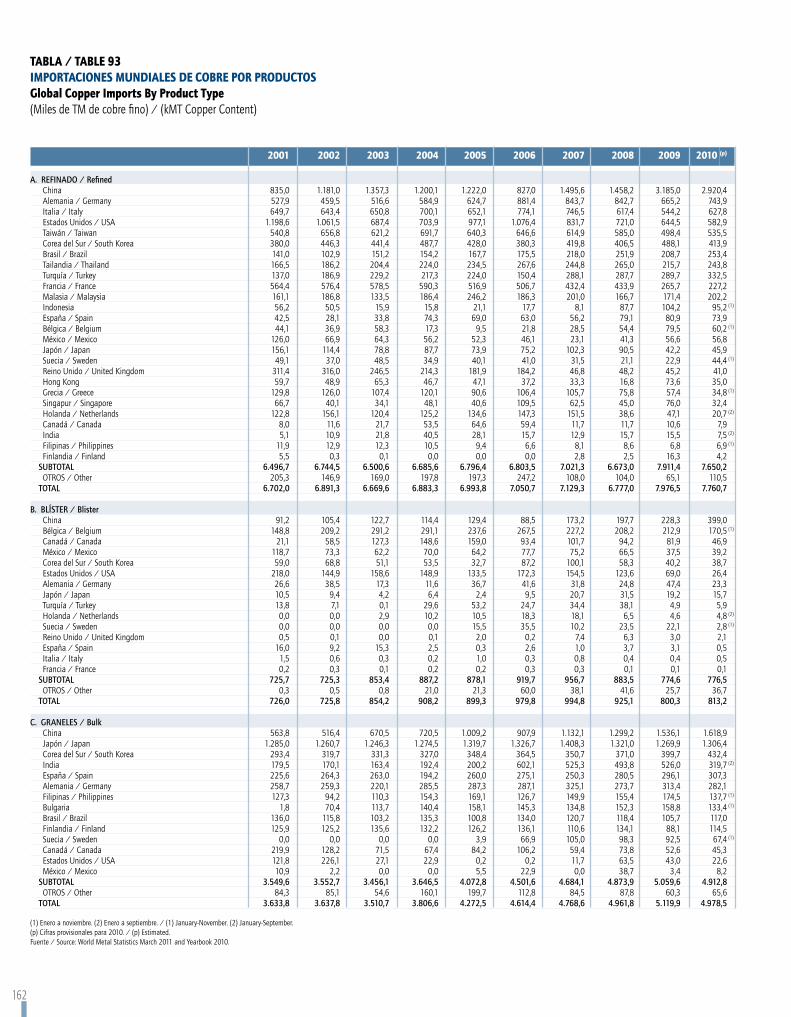
162
TABLA / TABLE 93 IMPORTACIONES MUNDIALES DE COBRE POR PRODUCTOS Global Copper Imports By Product Type (Miles de tM de cobre fino) / (kMt Copper Content)
2001 2002 2003 2004 2005 2006 2007 2008 2009 2010 (p)
A. reFinAdo / refined China 835,0 1.181,0 1.357,3 1.200,1 1.222,0 827,0 1.495,6 1.458,2 3.185,0 2.920,4 alemania / Germany 527,9 459,5 516,6 584,9 624,7 881,4 843,7 842,7 665,2 743,9 italia / italy 649,7 643,4 650,8 700,1 652,1 774,1 746,5 617,4 544,2 627,8 estados Unidos / USa 1.198,6 1.061,5 687,4 703,9 977,1 1.076,4 831,7 721,0 644,5 582,9 taiwán / taiwan 540,8 656,8 621,2 691,7 640,3 646,6 614,9 585,0 498,4 535,5 Corea del Sur / South korea 380,0 446,3 441,4 487,7 428,0 380,3 419,8 406,5 488,1 413,9 brasil / brazil 141,0 102,9 151,2 154,2 167,7 175,5 218,0 251,9 208,7 253,4 tailandia / thailand 166,5 186,2 204,4 224,0 234,5 267,6 244,8 265,0 215,7 243,8 turquía / turkey 137,0 186,9 229,2 217,3 224,0 150,4 288,1 287,7 289,7 332,5 Francia / France 564,4 576,4 578,5 590,3 516,9 506,7 432,4 433,9 265,7 227,2 Malasia / Malaysia 161,1 186,8 133,5 186,4 246,2 186,3 201,0 166,7 171,4 202,2 indonesia 56,2 50,5 15,9 15,8 21,1 17,7 8,1 87,7 104,2 95,2 (1)
españa / Spain 42,5 28,1 33,8 74,3 69,0 63,0 56,2 79,1 80,9 73,9 bélgica / belgium 44,1 36,9 58,3 17,3 9,5 21,8 28,5 54,4 79,5 60,2 (1)
México / Mexico 126,0 66,9 64,3 56,2 52,3 46,1 23,1 41,3 56,6 56,8 Japón / Japan 156,1 114,4 78,8 87,7 73,9 75,2 102,3 90,5 42,2 45,9 Suecia / Sweden 49,1 37,0 48,5 34,9 40,1 41,0 31,5 21,1 22,9 44,4 (1)
reino Unido / United kingdom 311,4 316,0 246,5 214,3 181,9 184,2 46,8 48,2 45,2 41,0 hong kong 59,7 48,9 65,3 46,7 47,1 37,2 33,3 16,8 73,6 35,0 Grecia / Greece 129,8 126,0 107,4 120,1 90,6 106,4 105,7 75,8 57,4 34,8 (1)
Singapur / Singapore 66,7 40,1 34,1 48,1 40,6 109,5 62,5 45,0 76,0 32,4 holanda / netherlands 122,8 156,1 120,4 125,2 134,6 147,3 151,5 38,6 47,1 20,7 (2)
Canadá / Canada 8,0 11,6 21,7 53,5 64,6 59,4 11,7 11,7 10,6 7,9 india 5,1 10,9 21,8 40,5 28,1 15,7 12,9 15,7 15,5 7,5 (2)
Filipinas / philippines 11,9 12,9 12,3 10,5 9,4 6,6 8,1 8,6 6,8 6,9 (1)
Finlandia / Finland 5,5 0,3 0,1 0,0 0,0 0,0 2,8 2,5 16,3 4,2 subtotAl 6.496,7 6.744,5 6.500,6 6.685,6 6.796,4 6.803,5 7.021,3 6.673,0 7.911,4 7.650,2 otroS / other 205,3 146,9 169,0 197,8 197,3 247,2 108,0 104,0 65,1 110,5 totAl 6.702,0 6.891,3 6.669,6 6.883,3 6.993,8 7.050,7 7.129,3 6.777,0 7.976,5 7.760,7 b. blíster / blister China 91,2 105,4 122,7 114,4 129,4 88,5 173,2 197,7 228,3 399,0 bélgica / belgium 148,8 209,2 291,2 291,1 237,6 267,5 227,2 208,2 212,9 170,5 (1)
Canadá / Canada 21,1 58,5 127,3 148,6 159,0 93,4 101,7 94,2 81,9 46,9 México / Mexico 118,7 73,3 62,2 70,0 64,2 77,7 75,2 66,5 37,5 39,2 Corea del Sur / South korea 59,0 68,8 51,1 53,5 32,7 87,2 100,1 58,3 40,2 38,7 estados Unidos / USa 218,0 144,9 158,6 148,9 133,5 172,3 154,5 123,6 69,0 26,4 alemania / Germany 26,6 38,5 17,3 11,6 36,7 41,6 31,8 24,8 47,4 23,3 Japón / Japan 10,5 9,4 4,2 6,4 2,4 9,5 20,7 31,5 19,2 15,7 turquía / turkey 13,8 7,1 0,1 29,6 53,2 24,7 34,4 38,1 4,9 5,9 holanda / netherlands 0,0 0,0 2,9 10,2 10,5 18,3 18,1 6,5 4,6 4,8 (2)
Suecia / Sweden 0,0 0,0 0,0 0,0 15,5 35,5 10,2 23,5 22,1 2,8 (1)
reino Unido / United kingdom 0,5 0,1 0,0 0,1 2,0 0,2 7,4 6,3 3,0 2,1 españa / Spain 16,0 9,2 15,3 2,5 0,3 2,6 1,0 3,7 3,1 0,5 italia / italy 1,5 0,6 0,3 0,2 1,0 0,3 0,8 0,4 0,4 0,5 Francia / France 0,2 0,3 0,1 0,2 0,2 0,3 0,3 0,1 0,1 0,1 subtotAl 725,7 725,3 853,4 887,2 878,1 919,7 956,7 883,5 774,6 776,5 otroS / other 0,3 0,5 0,8 21,0 21,3 60,0 38,1 41,6 25,7 36,7 totAl 726,0 725,8 854,2 908,2 899,3 979,8 994,8 925,1 800,3 813,2
c. GrAneles / bulk China 563,8 516,4 670,5 720,5 1.009,2 907,9 1.132,1 1.299,2 1.536,1 1.618,9 Japón / Japan 1.285,0 1.260,7 1.246,3 1.274,5 1.319,7 1.326,7 1.408,3 1.321,0 1.269,9 1.306,4 Corea del Sur / South korea 293,4 319,7 331,3 327,0 348,4 364,5 350,7 371,0 399,7 432,4 india 179,5 170,1 163,4 192,4 200,2 602,1 525,3 493,8 526,0 319,7 (2)
españa / Spain 225,6 264,3 263,0 194,2 260,0 275,1 250,3 280,5 296,1 307,3 alemania / Germany 258,7 259,3 220,1 285,5 287,3 287,1 325,1 273,7 313,4 282,1 Filipinas / philippines 127,3 94,2 110,3 154,3 169,1 126,7 149,9 155,4 174,5 137,7 (1)
bulgaria 1,8 70,4 113,7 140,4 158,1 145,3 134,8 152,3 158,8 133,4 (1)
brasil / brazil 136,0 115,8 103,2 135,3 100,8 134,0 120,7 118,4 105,7 117,0 Finlandia / Finland 125,9 125,2 135,6 132,2 126,2 136,1 110,6 134,1 88,1 114,5 Suecia / Sweden 0,0 0,0 0,0 0,0 3,9 66,9 105,0 98,3 92,5 67,4 (1)
Canadá / Canada 219,9 128,2 71,5 67,4 84,2 106,2 59,4 73,8 52,6 45,3 estados Unidos / USa 121,8 226,1 27,1 22,9 0,2 0,2 11,7 63,5 43,0 22,6 México / Mexico 10,9 2,2 0,0 0,0 5,5 22,9 0,0 38,7 3,4 8,2 subtotAl 3.549,6 3.552,7 3.456,1 3.646,5 4.072,8 4.501,6 4.684,1 4.873,9 5.059,6 4.912,8 otroS / other 84,3 85,1 54,6 160,1 199,7 112,8 84,5 87,8 60,3 65,6 totAl 3.633,8 3.637,8 3.510,7 3.806,6 4.272,5 4.614,4 4.768,6 4.961,8 5.119,9 4.978,5
(1) enero a noviembre. (2) enero a septiembre. / (1) January-november. (2) January-September. (p) Cifras provisionales para 2010. / (p) estimated. Fuente / Source: World Metal Statistics March 2011 and Yearbook 2010.
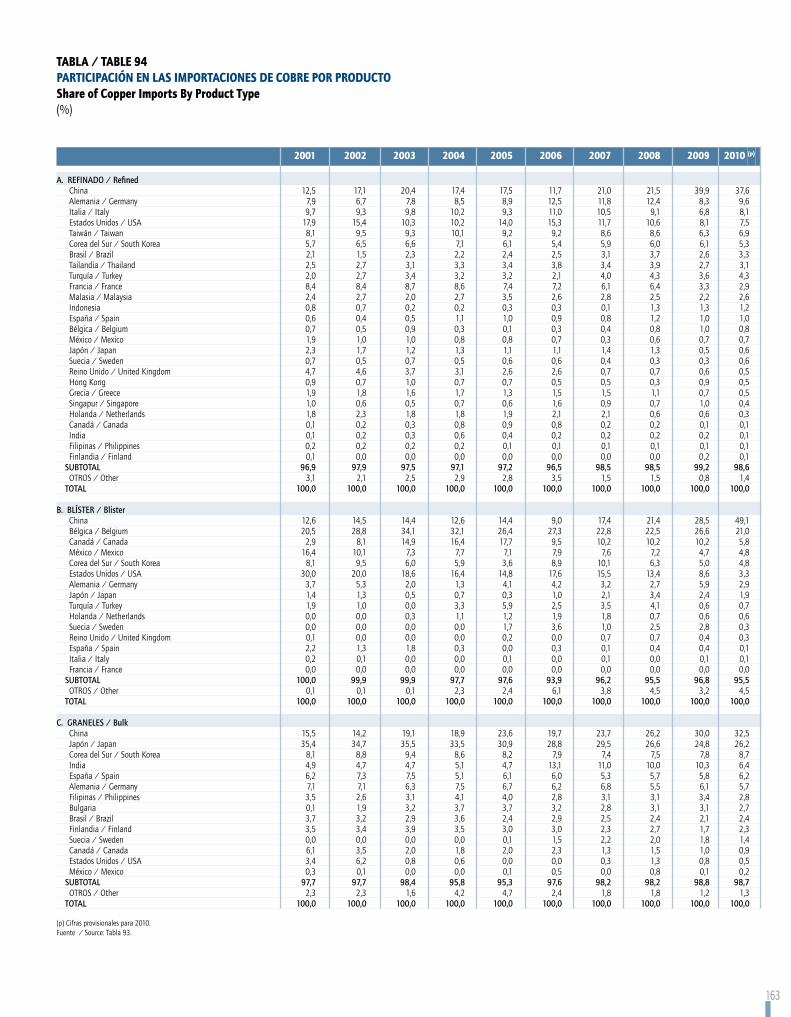
163
TABLA / TABLE 94PARTICIPACIÓN EN LAS IMPORTACIONES DE COBRE POR PRODUCTO Share of Copper Imports By Product Type(%)
2001 2002 2003 2004 2005 2006 2007 2008 2009 2010 (p) A. reFinAdo / refined China 12,5 17,1 20,4 17,4 17,5 11,7 21,0 21,5 39,9 37,6 alemania / Germany 7,9 6,7 7,8 8,5 8,9 12,5 11,8 12,4 8,3 9,6 italia / italy 9,7 9,3 9,8 10,2 9,3 11,0 10,5 9,1 6,8 8,1 estados Unidos / USa 17,9 15,4 10,3 10,2 14,0 15,3 11,7 10,6 8,1 7,5 taiwán / taiwan 8,1 9,5 9,3 10,1 9,2 9,2 8,6 8,6 6,3 6,9 Corea del Sur / South korea 5,7 6,5 6,6 7,1 6,1 5,4 5,9 6,0 6,1 5,3 brasil / brazil 2,1 1,5 2,3 2,2 2,4 2,5 3,1 3,7 2,6 3,3 tailandia / thailand 2,5 2,7 3,1 3,3 3,4 3,8 3,4 3,9 2,7 3,1 turquía / turkey 2,0 2,7 3,4 3,2 3,2 2,1 4,0 4,3 3,6 4,3 Francia / France 8,4 8,4 8,7 8,6 7,4 7,2 6,1 6,4 3,3 2,9 Malasia / Malaysia 2,4 2,7 2,0 2,7 3,5 2,6 2,8 2,5 2,2 2,6 indonesia 0,8 0,7 0,2 0,2 0,3 0,3 0,1 1,3 1,3 1,2 españa / Spain 0,6 0,4 0,5 1,1 1,0 0,9 0,8 1,2 1,0 1,0 bélgica / belgium 0,7 0,5 0,9 0,3 0,1 0,3 0,4 0,8 1,0 0,8 México / Mexico 1,9 1,0 1,0 0,8 0,8 0,7 0,3 0,6 0,7 0,7 Japón / Japan 2,3 1,7 1,2 1,3 1,1 1,1 1,4 1,3 0,5 0,6 Suecia / Sweden 0,7 0,5 0,7 0,5 0,6 0,6 0,4 0,3 0,3 0,6 reino Unido / United kingdom 4,7 4,6 3,7 3,1 2,6 2,6 0,7 0,7 0,6 0,5 hong kong 0,9 0,7 1,0 0,7 0,7 0,5 0,5 0,3 0,9 0,5 Grecia / Greece 1,9 1,8 1,6 1,7 1,3 1,5 1,5 1,1 0,7 0,5 Singapur / Singapore 1,0 0,6 0,5 0,7 0,6 1,6 0,9 0,7 1,0 0,4 holanda / netherlands 1,8 2,3 1,8 1,8 1,9 2,1 2,1 0,6 0,6 0,3 Canadá / Canada 0,1 0,2 0,3 0,8 0,9 0,8 0,2 0,2 0,1 0,1 india 0,1 0,2 0,3 0,6 0,4 0,2 0,2 0,2 0,2 0,1 Filipinas / philippines 0,2 0,2 0,2 0,2 0,1 0,1 0,1 0,1 0,1 0,1 Finlandia / Finland 0,1 0,0 0,0 0,0 0,0 0,0 0,0 0,0 0,2 0,1 subtotAl 96,9 97,9 97,5 97,1 97,2 96,5 98,5 98,5 99,2 98,6 otroS / other 3,1 2,1 2,5 2,9 2,8 3,5 1,5 1,5 0,8 1,4 totAl 100,0 100,0 100,0 100,0 100,0 100,0 100,0 100,0 100,0 100,0 b. blíster / blister China 12,6 14,5 14,4 12,6 14,4 9,0 17,4 21,4 28,5 49,1 bélgica / belgium 20,5 28,8 34,1 32,1 26,4 27,3 22,8 22,5 26,6 21,0 Canadá / Canada 2,9 8,1 14,9 16,4 17,7 9,5 10,2 10,2 10,2 5,8 México / Mexico 16,4 10,1 7,3 7,7 7,1 7,9 7,6 7,2 4,7 4,8 Corea del Sur / South korea 8,1 9,5 6,0 5,9 3,6 8,9 10,1 6,3 5,0 4,8 estados Unidos / USa 30,0 20,0 18,6 16,4 14,8 17,6 15,5 13,4 8,6 3,3 alemania / Germany 3,7 5,3 2,0 1,3 4,1 4,2 3,2 2,7 5,9 2,9 Japón / Japan 1,4 1,3 0,5 0,7 0,3 1,0 2,1 3,4 2,4 1,9 turquía / turkey 1,9 1,0 0,0 3,3 5,9 2,5 3,5 4,1 0,6 0,7 holanda / netherlands 0,0 0,0 0,3 1,1 1,2 1,9 1,8 0,7 0,6 0,6 Suecia / Sweden 0,0 0,0 0,0 0,0 1,7 3,6 1,0 2,5 2,8 0,3 reino Unido / United kingdom 0,1 0,0 0,0 0,0 0,2 0,0 0,7 0,7 0,4 0,3 españa / Spain 2,2 1,3 1,8 0,3 0,0 0,3 0,1 0,4 0,4 0,1 italia / italy 0,2 0,1 0,0 0,0 0,1 0,0 0,1 0,0 0,1 0,1 Francia / France 0,0 0,0 0,0 0,0 0,0 0,0 0,0 0,0 0,0 0,0 subtotAl 100,0 99,9 99,9 97,7 97,6 93,9 96,2 95,5 96,8 95,5 otroS / other 0,1 0,1 0,1 2,3 2,4 6,1 3,8 4,5 3,2 4,5 totAl 100,0 100,0 100,0 100,0 100,0 100,0 100,0 100,0 100,0 100,0
c. GrAneles / bulk China 15,5 14,2 19,1 18,9 23,6 19,7 23,7 26,2 30,0 32,5 Japón / Japan 35,4 34,7 35,5 33,5 30,9 28,8 29,5 26,6 24,8 26,2 Corea del Sur / South korea 8,1 8,8 9,4 8,6 8,2 7,9 7,4 7,5 7,8 8,7 india 4,9 4,7 4,7 5,1 4,7 13,1 11,0 10,0 10,3 6,4 españa / Spain 6,2 7,3 7,5 5,1 6,1 6,0 5,3 5,7 5,8 6,2 alemania / Germany 7,1 7,1 6,3 7,5 6,7 6,2 6,8 5,5 6,1 5,7 Filipinas / philippines 3,5 2,6 3,1 4,1 4,0 2,8 3,1 3,1 3,4 2,8 bulgaria 0,1 1,9 3,2 3,7 3,7 3,2 2,8 3,1 3,1 2,7 brasil / brazil 3,7 3,2 2,9 3,6 2,4 2,9 2,5 2,4 2,1 2,4 Finlandia / Finland 3,5 3,4 3,9 3,5 3,0 3,0 2,3 2,7 1,7 2,3 Suecia / Sweden 0,0 0,0 0,0 0,0 0,1 1,5 2,2 2,0 1,8 1,4 Canadá / Canada 6,1 3,5 2,0 1,8 2,0 2,3 1,3 1,5 1,0 0,9 estados Unidos / USa 3,4 6,2 0,8 0,6 0,0 0,0 0,3 1,3 0,8 0,5 México / Mexico 0,3 0,1 0,0 0,0 0,1 0,5 0,0 0,8 0,1 0,2 subtotAl 97,7 97,7 98,4 95,8 95,3 97,6 98,2 98,2 98,8 98,7 otroS / other 2,3 2,3 1,6 4,2 4,7 2,4 1,8 1,8 1,2 1,3 totAl 100,0 100,0 100,0 100,0 100,0 100,0 100,0 100,0 100,0 100,0
(p) Cifras provisionales para 2010.Fuente / Source: tabla 93.

164

165
2.4OTROS INDICADORES DEL MERCADO INTERNACIONAL DEL COBREotHer World coPPer MArKet indicAtors
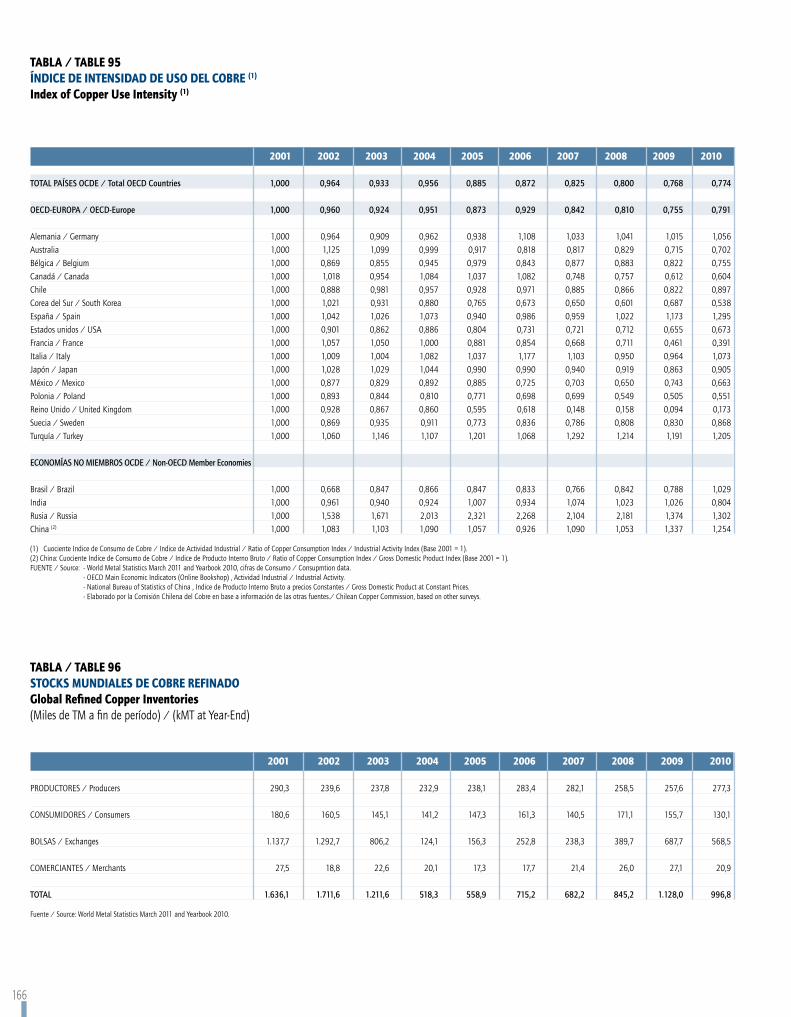
166
TABLA / TABLE 95ÍNDICE DE INTENSIDAD DE USO DEL COBRE (1)
Index of Copper Use Intensity (1)
2001 2002 2003 2004 2005 2006 2007 2008 2009 2010
totAl PAíses ocde / total oecd countries 1,000 0,964 0,933 0,956 0,885 0,872 0,825 0,800 0,768 0,774
oecd-euroPA / oecd-europe 1,000 0,960 0,924 0,951 0,873 0,929 0,842 0,810 0,755 0,791
alemania / Germany 1,000 0,964 0,909 0,962 0,938 1,108 1,033 1,041 1,015 1,056
australia 1,000 1,125 1,099 0,999 0,917 0,818 0,817 0,829 0,715 0,702
bélgica / belgium 1,000 0,869 0,855 0,945 0,979 0,843 0,877 0,883 0,822 0,755
Canadá / Canada 1,000 1,018 0,954 1,084 1,037 1,082 0,748 0,757 0,612 0,604
Chile 1,000 0,888 0,981 0,957 0,928 0,971 0,885 0,866 0,822 0,897
Corea del Sur / South korea 1,000 1,021 0,931 0,880 0,765 0,673 0,650 0,601 0,687 0,538
españa / Spain 1,000 1,042 1,026 1,073 0,940 0,986 0,959 1,022 1,173 1,295
estados unidos / USa 1,000 0,901 0,862 0,886 0,804 0,731 0,721 0,712 0,655 0,673
Francia / France 1,000 1,057 1,050 1,000 0,881 0,854 0,668 0,711 0,461 0,391
italia / italy 1,000 1,009 1,004 1,082 1,037 1,177 1,103 0,950 0,964 1,073
Japón / Japan 1,000 1,028 1,029 1,044 0,990 0,990 0,940 0,919 0,863 0,905
México / Mexico 1,000 0,877 0,829 0,892 0,885 0,725 0,703 0,650 0,743 0,663
polonia / poland 1,000 0,893 0,844 0,810 0,771 0,698 0,699 0,549 0,505 0,551
reino Unido / United kingdom 1,000 0,928 0,867 0,860 0,595 0,618 0,148 0,158 0,094 0,173
Suecia / Sweden 1,000 0,869 0,935 0,911 0,773 0,836 0,786 0,808 0,830 0,868
turquía / turkey 1,000 1,060 1,146 1,107 1,201 1,068 1,292 1,214 1,191 1,205
econoMíAs no MieMbros ocde / non-oecd Member economies
brasil / brazil 1,000 0,668 0,847 0,866 0,847 0,833 0,766 0,842 0,788 1,029
india 1,000 0,961 0,940 0,924 1,007 0,934 1,074 1,023 1,026 0,804
rusia / russia 1,000 1,538 1,671 2,013 2,321 2,268 2,104 2,181 1,374 1,302
China (2) 1,000 1,083 1,103 1,090 1,057 0,926 1,090 1,053 1,337 1,254
(1) Cuociente indice de Consumo de Cobre / indice de actividad industrial / ratio of Copper Consumption index / industrial activity index (base 2001 = 1).(2) China: Cuociente indice de Consumo de Cobre / indice de producto interno bruto / ratio of Copper Consumption index / Gross domestic product index (base 2001 = 1). FUente / Source: - World Metal Statistics March 2011 and Yearbook 2010, cifras de Consumo / Consupmtion data. - oeCd Main economic indicators (online bookshop) , actividad industrial / industrial activity. - national bureau of Statistics of China , indice de producto interno bruto a precios Constantes / Gross domestic product at Constant prices. - elaborado por la Comisión Chilena del Cobre en base a información de las otras fuentes./ Chilean Copper Commission, based on other surveys.
TABLA / TABLE 96 STOCKS MUNDIALES DE COBRE REFINADO Global Refined Copper Inventories (Miles de tM a fin de período) / (kMt at Year-end)
2001 2002 2003 2004 2005 2006 2007 2008 2009 2010
prodUCtoreS / producers 290,3 239,6 237,8 232,9 238,1 283,4 282,1 258,5 257,6 277,3
ConSUMidoreS / Consumers 180,6 160,5 145,1 141,2 147,3 161,3 140,5 171,1 155,7 130,1
bolSaS / exchanges 1.137,7 1.292,7 806,2 124,1 156,3 252,8 238,3 389,7 687,7 568,5
CoMerCianteS / Merchants 27,5 18,8 22,6 20,1 17,3 17,7 21,4 26,0 27,1 20,9
totAl 1.636,1 1.711,6 1.211,6 518,3 558,9 715,2 682,2 845,2 1.128,0 996,8
Fuente / Source: World Metal Statistics March 2011 and Yearbook 2010.
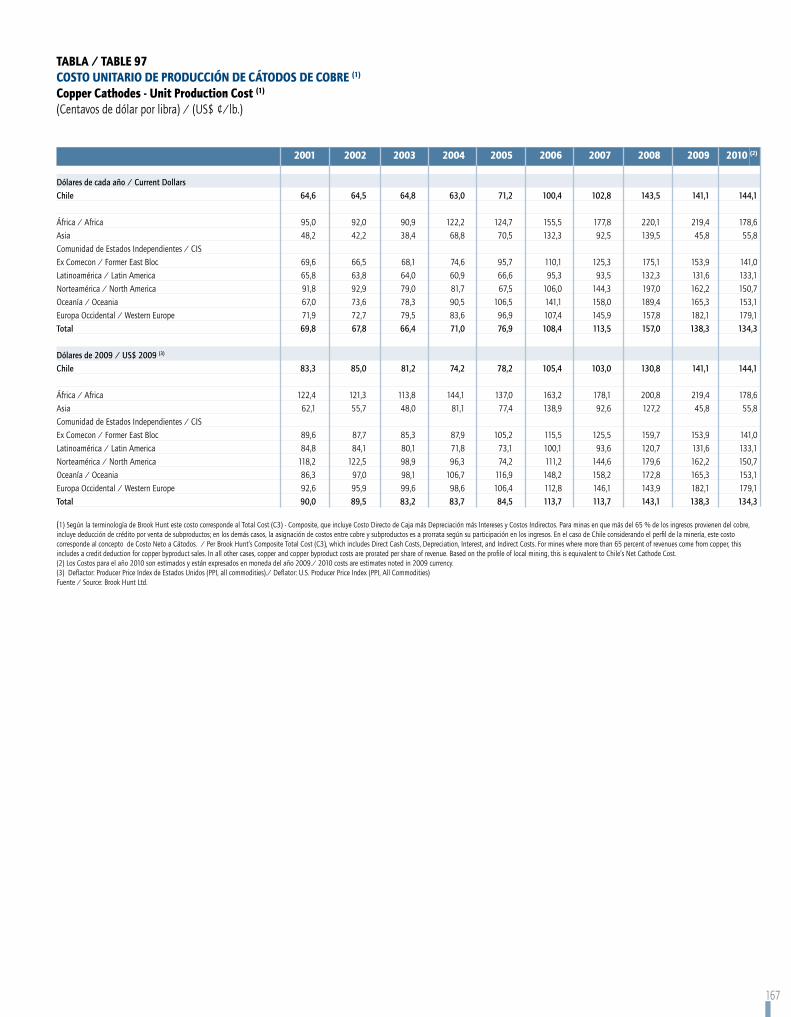
167
TABLA / TABLE 97 COSTO UNITARIO DE PRODUCCIÓN DE CÁTODOS DE COBRE (1)
Copper Cathodes - Unit Production Cost (1)
(Centavos de dólar por libra) / (US$ ¢/lb.)
2001 2002 2003 2004 2005 2006 2007 2008 2009 2010 (2)
dólares de cada año / current dollars chile 64,6 64,5 64,8 63,0 71,2 100,4 102,8 143,5 141,1 144,1
África / africa 95,0 92,0 90,9 122,2 124,7 155,5 177,8 220,1 219,4 178,6
asia 48,2 42,2 38,4 68,8 70,5 132,3 92,5 139,5 45,8 55,8
Comunidad de estados independientes / CiS
ex Comecon / Former east bloc 69,6 66,5 68,1 74,6 95,7 110,1 125,3 175,1 153,9 141,0
latinoamérica / latin america 65,8 63,8 64,0 60,9 66,6 95,3 93,5 132,3 131,6 133,1
norteamérica / north america 91,8 92,9 79,0 81,7 67,5 106,0 144,3 197,0 162,2 150,7
oceanía / oceania 67,0 73,6 78,3 90,5 106,5 141,1 158,0 189,4 165,3 153,1
europa occidental / Western europe 71,9 72,7 79,5 83,6 96,9 107,4 145,9 157,8 182,1 179,1
total 69,8 67,8 66,4 71,0 76,9 108,4 113,5 157,0 138,3 134,3
dólares de 2009 / us$ 2009 (3) chile 83,3 85,0 81,2 74,2 78,2 105,4 103,0 130,8 141,1 144,1
África / africa 122,4 121,3 113,8 144,1 137,0 163,2 178,1 200,8 219,4 178,6
asia 62,1 55,7 48,0 81,1 77,4 138,9 92,6 127,2 45,8 55,8
Comunidad de estados independientes / CiS
ex Comecon / Former east bloc 89,6 87,7 85,3 87,9 105,2 115,5 125,5 159,7 153,9 141,0
latinoamérica / latin america 84,8 84,1 80,1 71,8 73,1 100,1 93,6 120,7 131,6 133,1
norteamérica / north america 118,2 122,5 98,9 96,3 74,2 111,2 144,6 179,6 162,2 150,7
oceanía / oceania 86,3 97,0 98,1 106,7 116,9 148,2 158,2 172,8 165,3 153,1
europa occidental / Western europe 92,6 95,9 99,6 98,6 106,4 112,8 146,1 143,9 182,1 179,1
total 90,0 89,5 83,2 83,7 84,5 113,7 113,7 143,1 138,3 134,3
(1) Según la terminología de brook hunt este costo corresponde al total Cost (C3) - Composite, que incluye Costo directo de Caja más depreciación más intereses y Costos indirectos. para minas en que más del 65 % de los ingresos provienen del cobre, incluye deducción de crédito por venta de subproductos; en los demás casos, la asignación de costos entre cobre y subproductos es a prorrata según su participación en los ingresos. en el caso de Chile considerando el perfil de la minería, este costo corresponde al concepto de Costo neto a Cátodos. / per brook hunt’s Composite total Cost (C3), which includes direct Cash Costs, depreciation, interest, and indirect Costs. For mines where more than 65 percent of revenues come from copper, this includes a credit deduction for copper byproduct sales. in all other cases, copper and copper byproduct costs are prorated per share of revenue. based on the profile of local mining, this is equivalent to Chile’s net Cathode Cost. (2) los Costos para el año 2010 son estimados y están expresados en moneda del año 2009./ 2010 costs are estimates noted in 2009 currency. (3) deflactor: producer price index de estados Unidos (ppi, all commodities)./ deflator: U.S. producer price index (ppi, all Commodities) Fuente / Source: brook hunt ltd.
168
director de estudios y políticas públicas:
alberto Ugalde abaroa
trabajo elaborado por:
Juan ocaranza a.
Con la Colaboración de:
oscar arce U.
Vicente pérez V.
rossana brantes a.
Joaquín Jara d.
luis Venegas S.
periodista:
paula Maldonado V.
diseño:
Channing & eberhard
Fotografía:
archivo Cochilco
impresión:
GraFhika
CoChilCo
agustinas 1161 – 4° piso
teléfono: (562) 382 8100
Fax: (562) 382 8300
Casilla 9493 – Correo Central
Santiago de Chile
www.cochilco.cl
iSSn 0716-8462
edición de 800 ejemplares.
800 printed copies.
reproducción permitida siempre que se mencione la fuente.
excepts may be published if source is named.

169