Embed Size (px)
Citation preview
Curso de Citología de Sangre Periférica
Barcelona, Abril 2013
Leucemia mieloide crónica
Francisco Cervantes
Neoplasia mieloproliferativa crónica clonal con origen
en una stem cell pluripotencial común a las tres series
hemopoyéticas, cuya alteración molecular (el
reordenamiento del gen BCR-ABL) origina una
proliferación caracterizada por una marcada
leucocitosis granulocítica con hiperplasia granulocítica
de la médula ósea.
LMC: definición
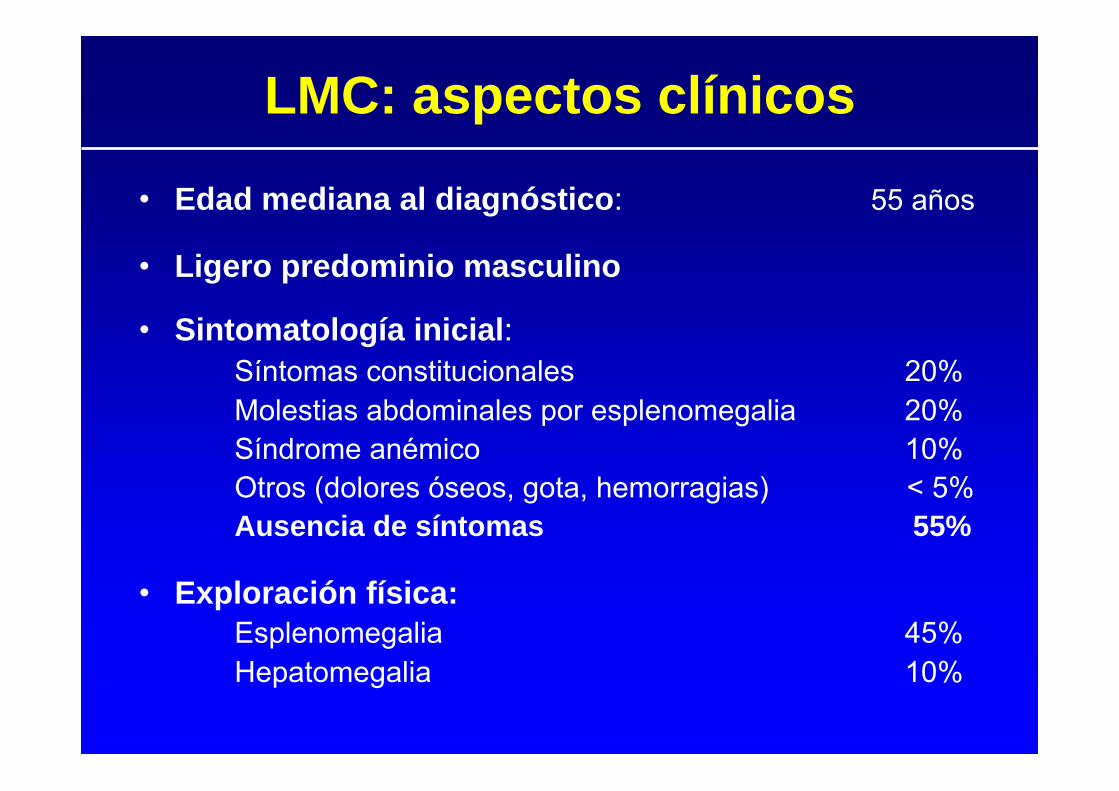
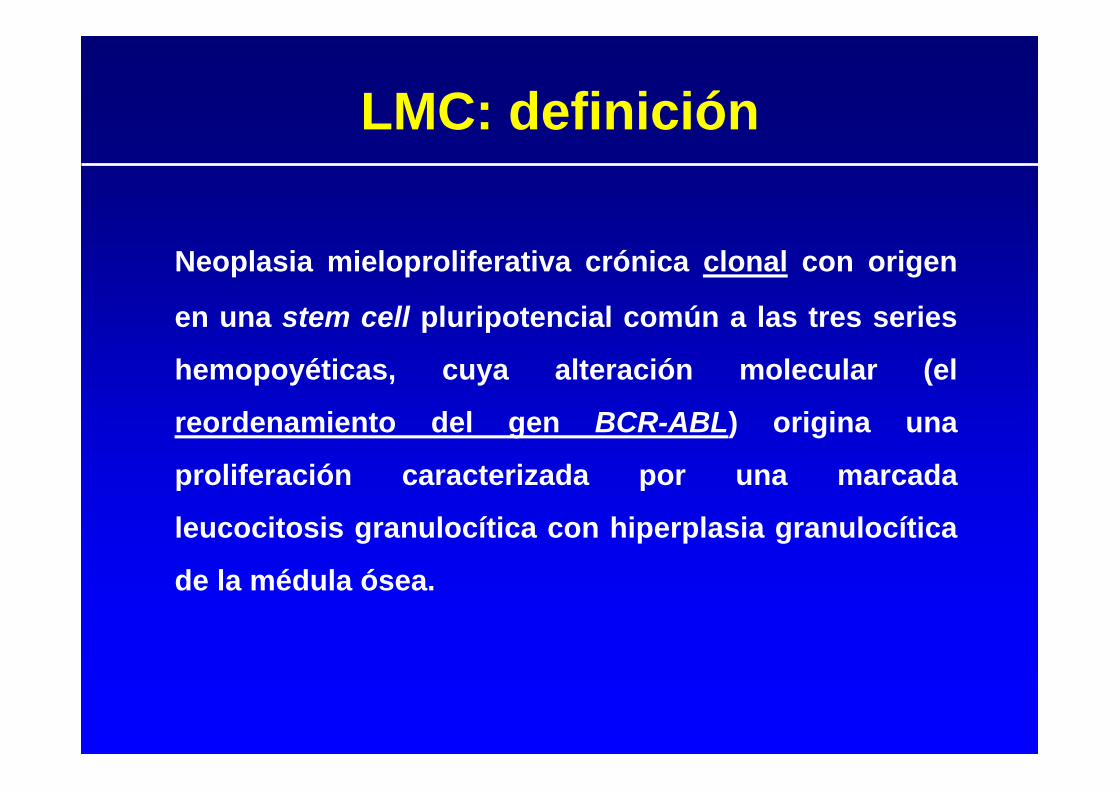
• Edad mediana al diagnóstico: 55 años
• Ligero predominio masculino
• Sintomatología inicial:Síntomas constitucionales 20%Molestias abdominales por esplenomegalia 20%Síndrome anémico 10%Otros (dolores óseos, gota, hemorragias) < 5%Ausencia de síntomas 55%
• Exploración física:Esplenomegalia 45%Hepatomegalia 10%
LMC: aspectos clínicos
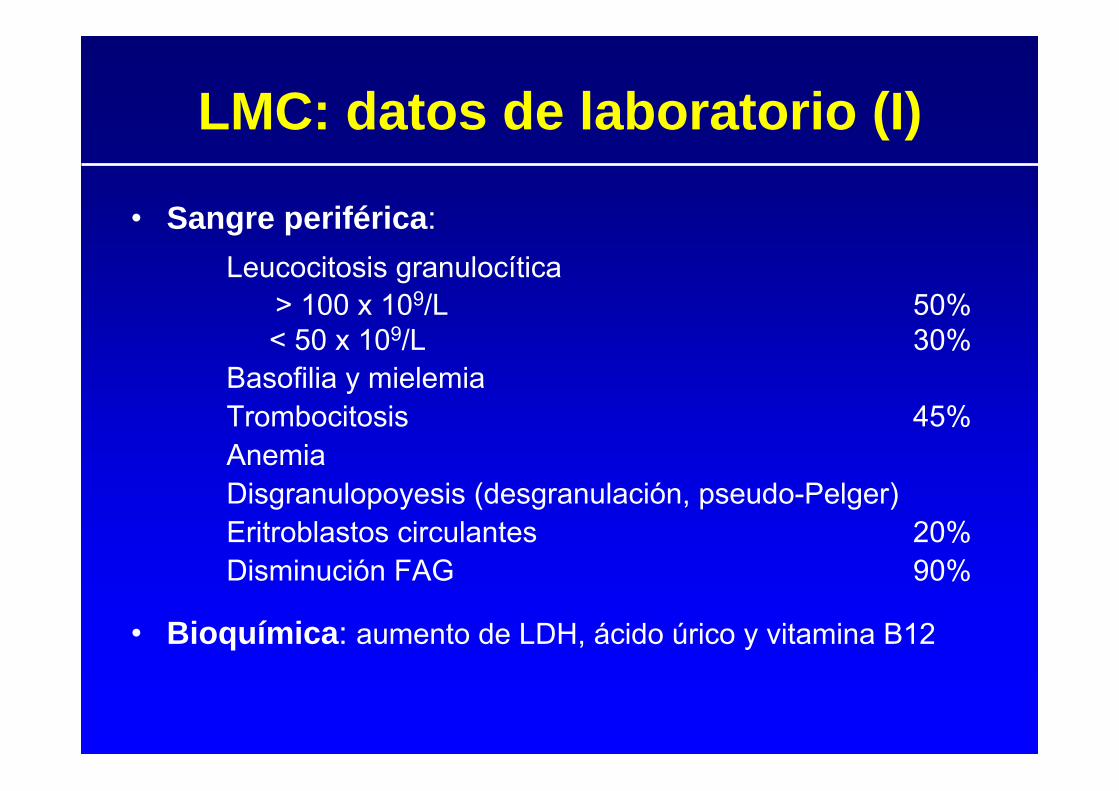
• Sangre periférica:Leucocitosis granulocítica
> 100 x 109/L 50%< 50 x 109/L 30%
Basofilia y mielemiaTrombocitosis 45%AnemiaDisgranulopoyesis (desgranulación, pseudo-Pelger)Eritroblastos circulantes 20%Disminución FAG 90%
• Bioquímica: aumento de LDH, ácido úrico y vitamina B12
LMC: datos de laboratorio (I)
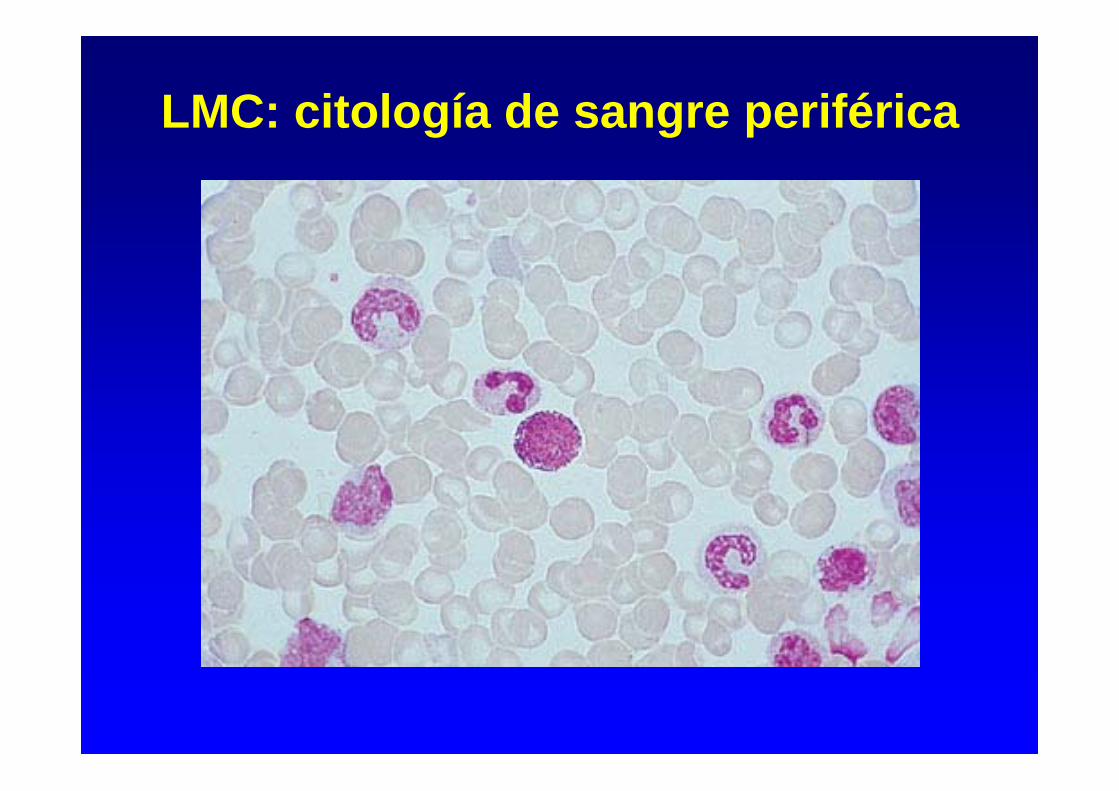
LMC: citología de sangre periférica
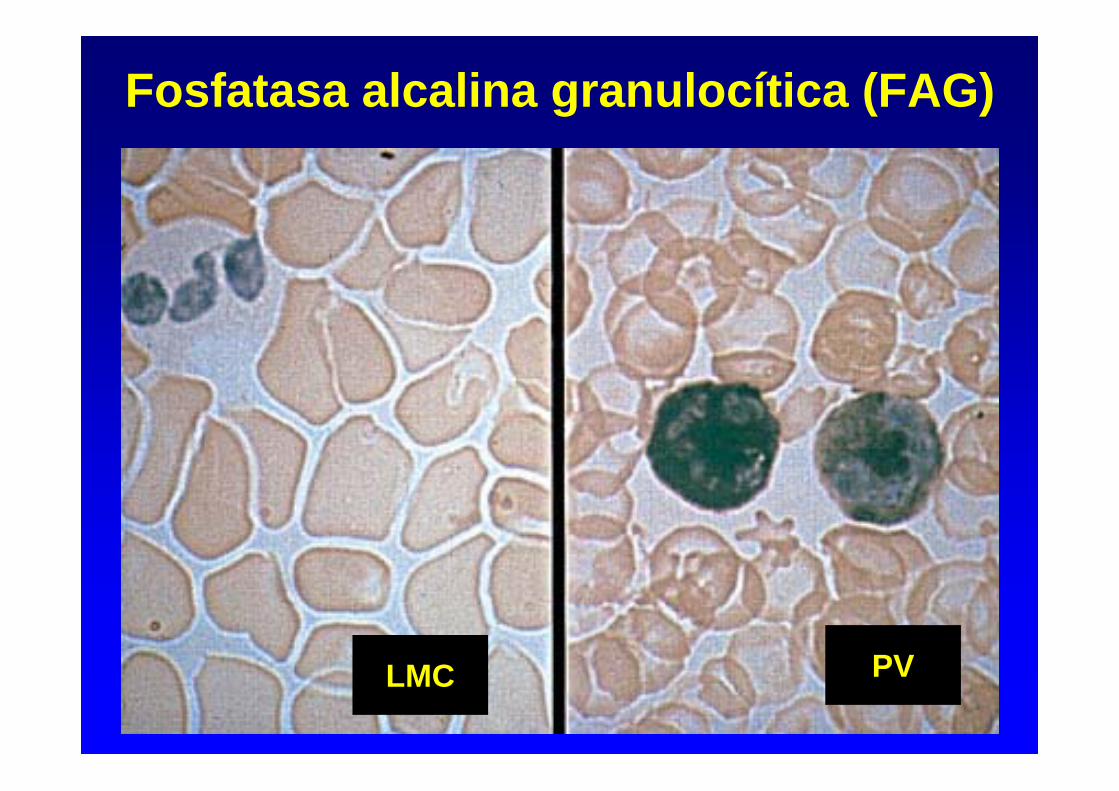
Fosfatasa alcalina granulocítica (FAG)
LMC PV
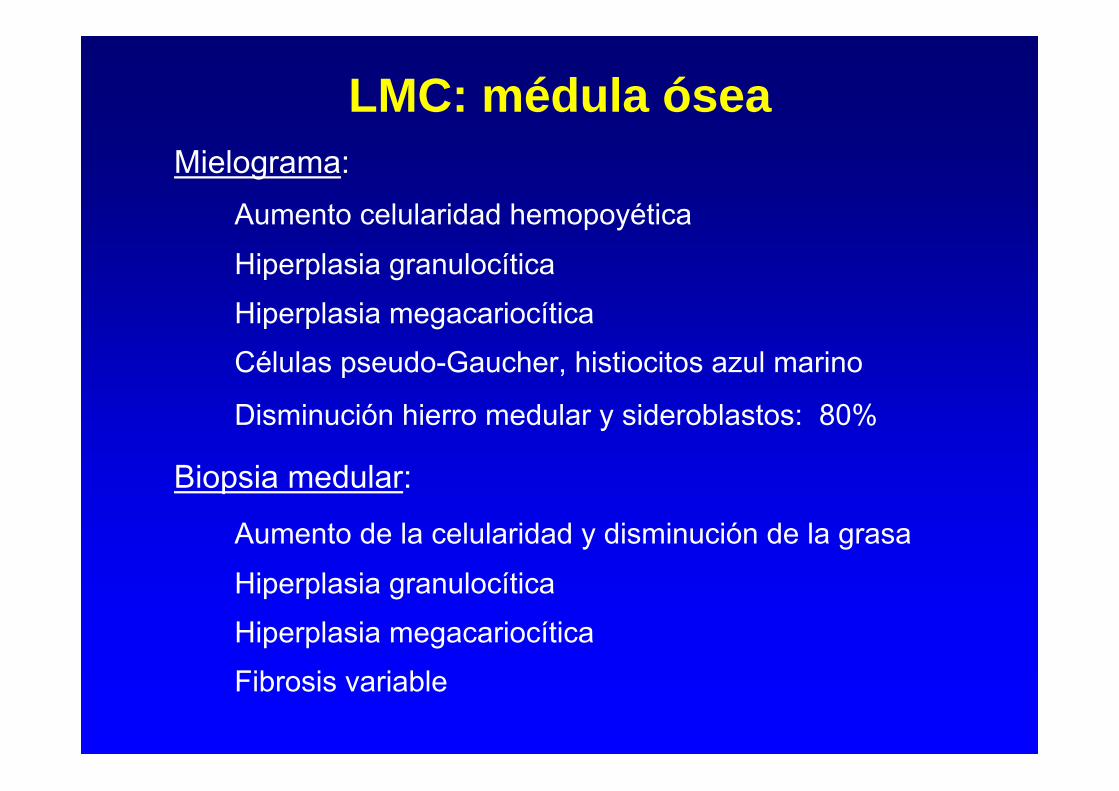
Mielograma:Aumento celularidad hemopoyética
Hiperplasia granulocítica
Hiperplasia megacariocítica
Células pseudo-Gaucher, histiocitos azul marino
Disminución hierro medular y sideroblastos: 80%
Biopsia medular:
Aumento de la celularidad y disminución de la grasa
Hiperplasia granulocítica
Hiperplasia megacariocítica
Fibrosis variable
LMC: médula ósea
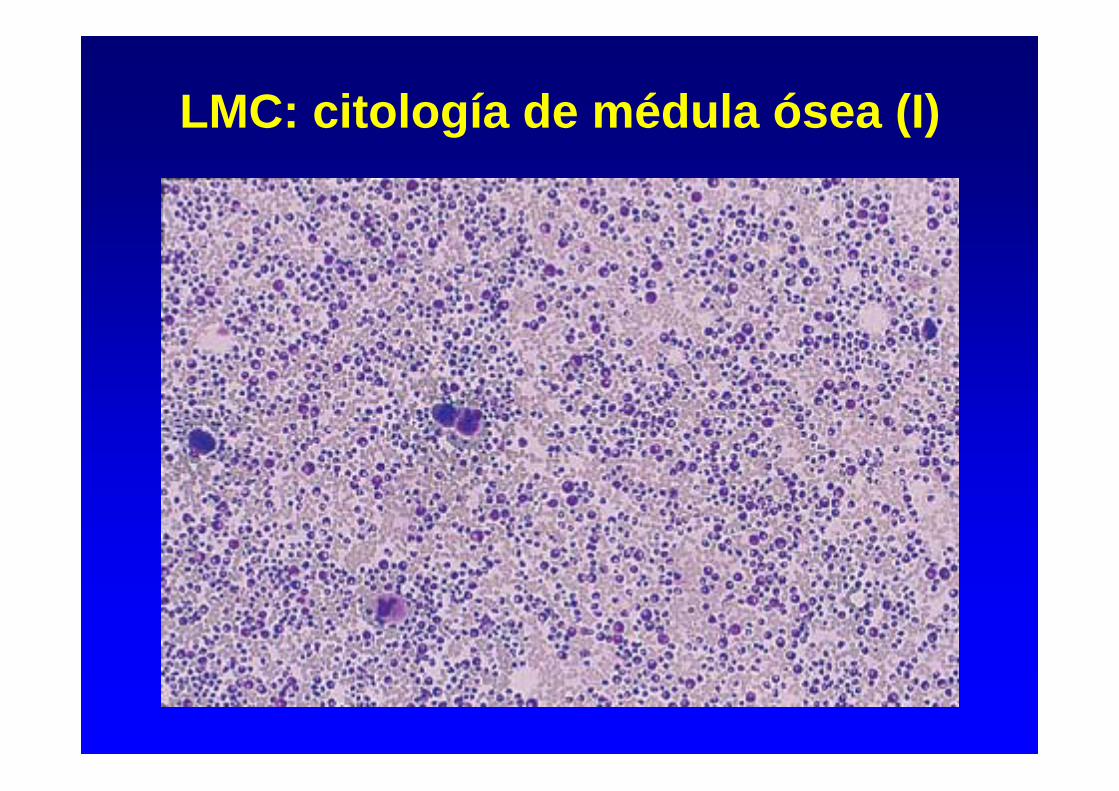
LMC: citología de médula ósea (I)
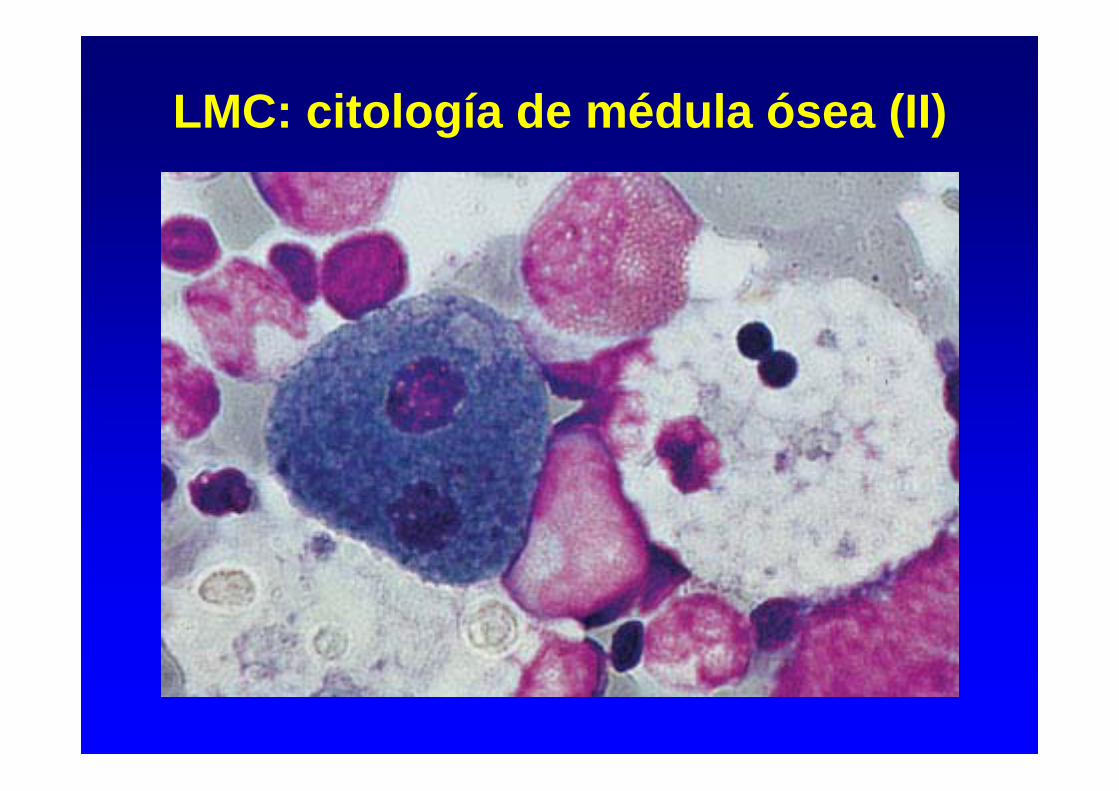
LMC: citología de médula ósea (II)
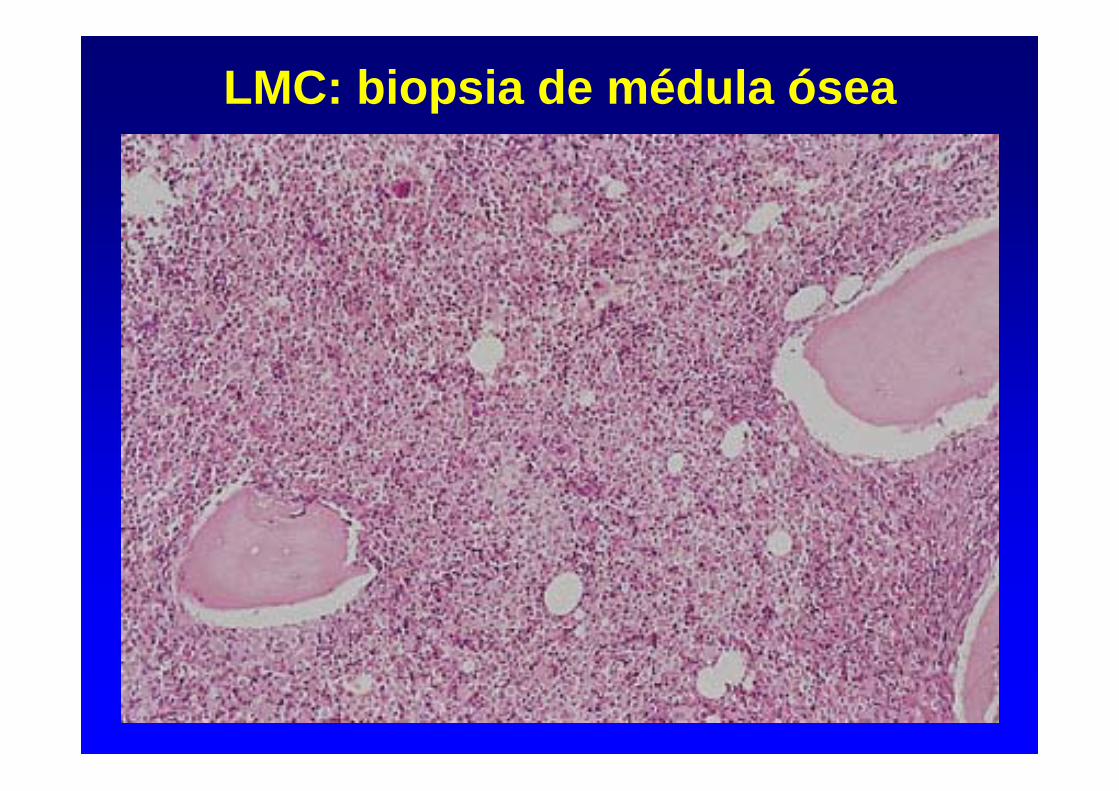
LMC: biopsia de médula ósea
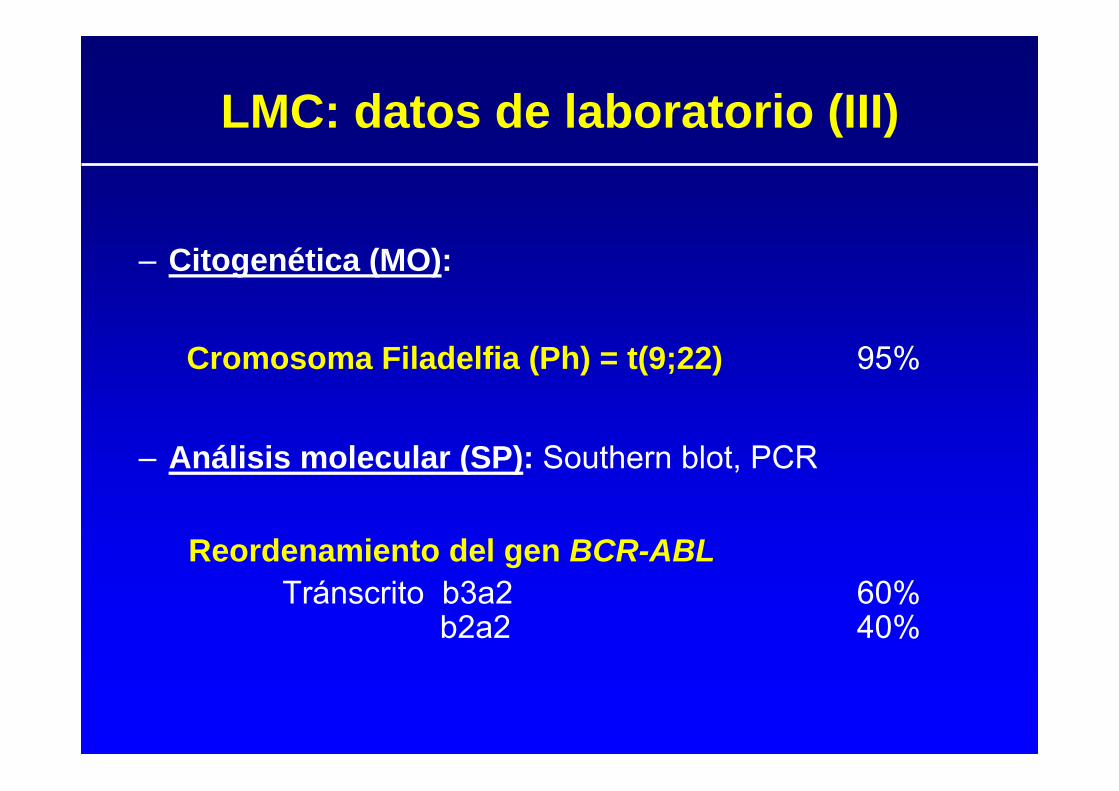
– Citogenética (MO):
Cromosoma Filadelfia (Ph) = t(9;22) 95%
– Análisis molecular (SP): Southern blot, PCR
Reordenamiento del gen BCR-ABLTránscrito b3a2 60%
b2a2 40%
LMC: datos de laboratorio (III)
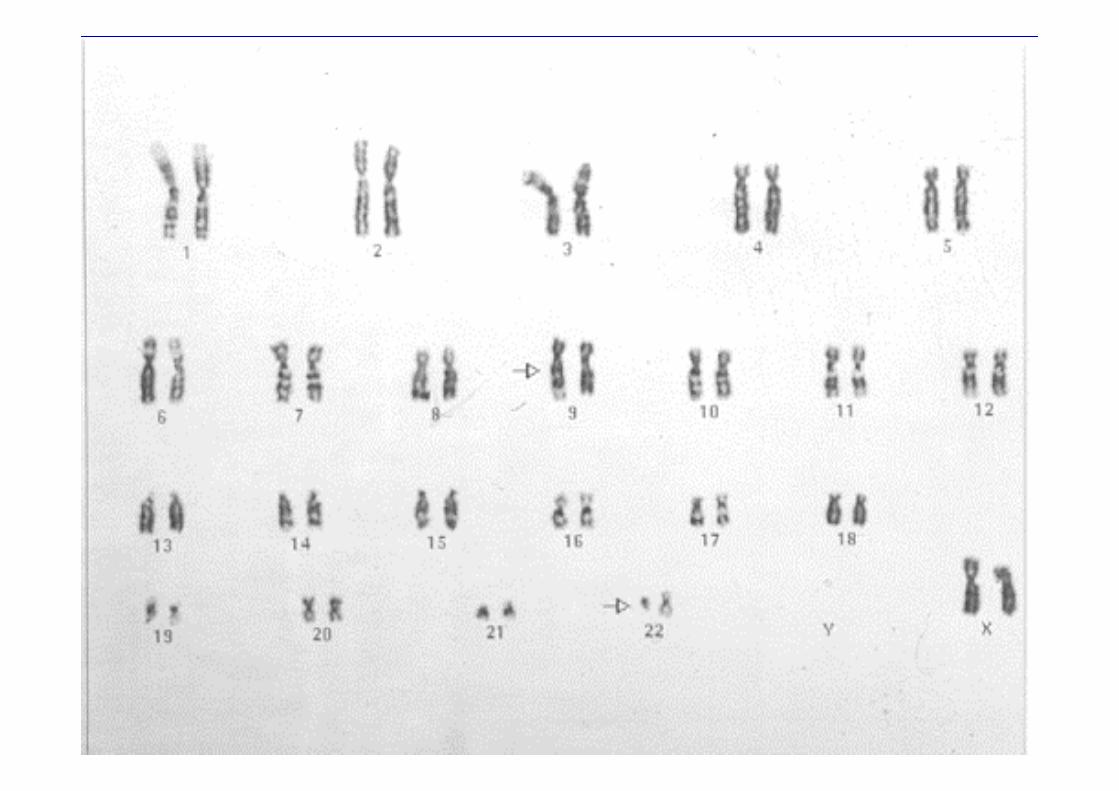
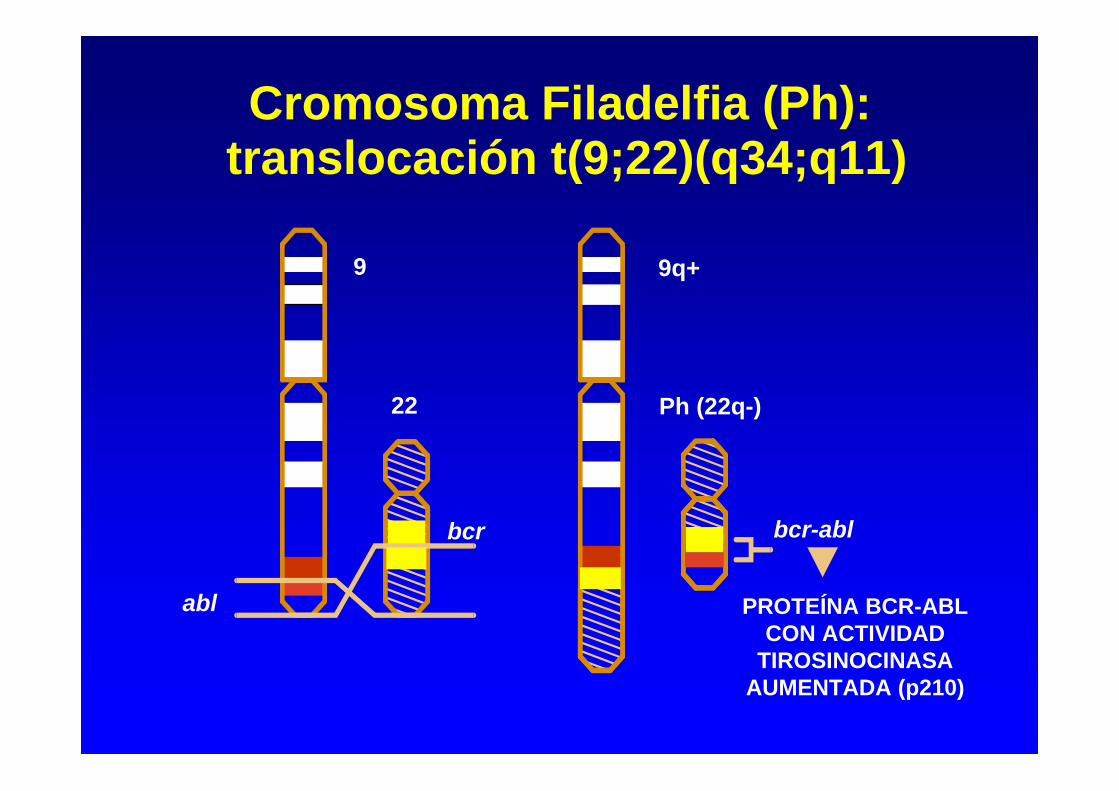
Cromosoma Filadelfia (Ph): translocación t(9;22)(q34;q11)
22
bcr
abl
Ph (22q-)
bcr-abl
PROTEÍNA BCR-ABL CON ACTIVIDAD
TIROSINOCINASA AUMENTADA (p210)
9 9q+
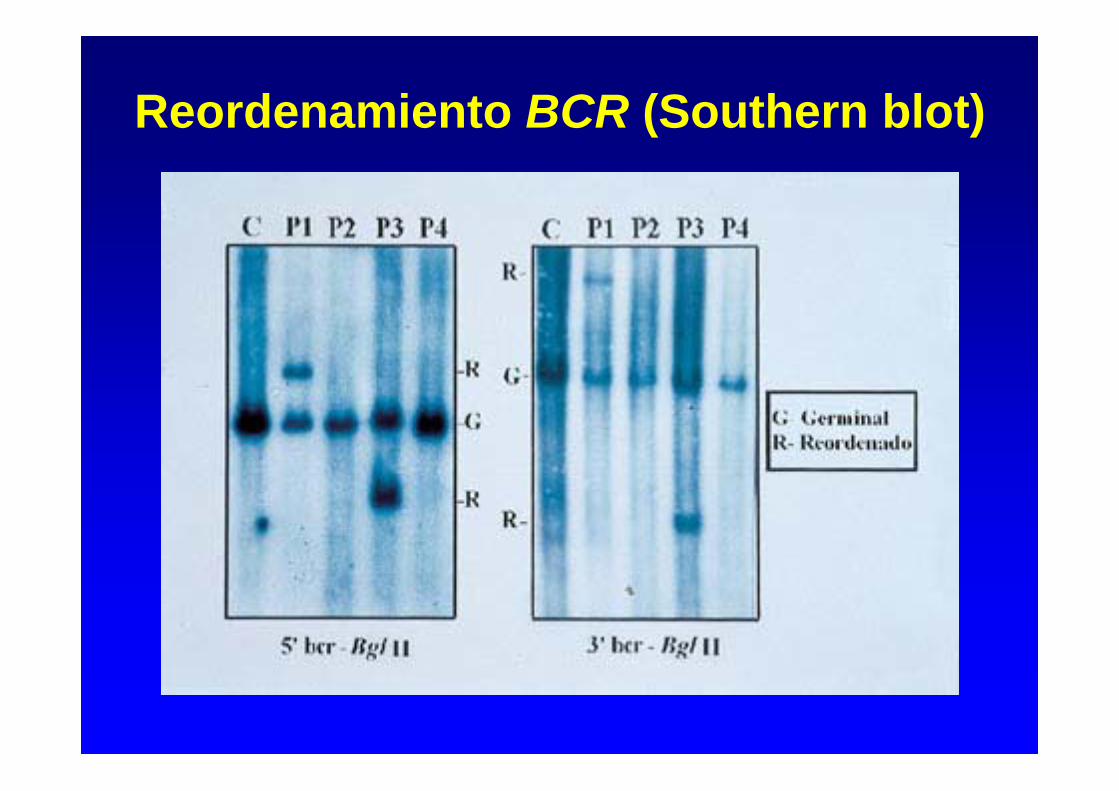
Reordenamiento BCR (Southern blot)
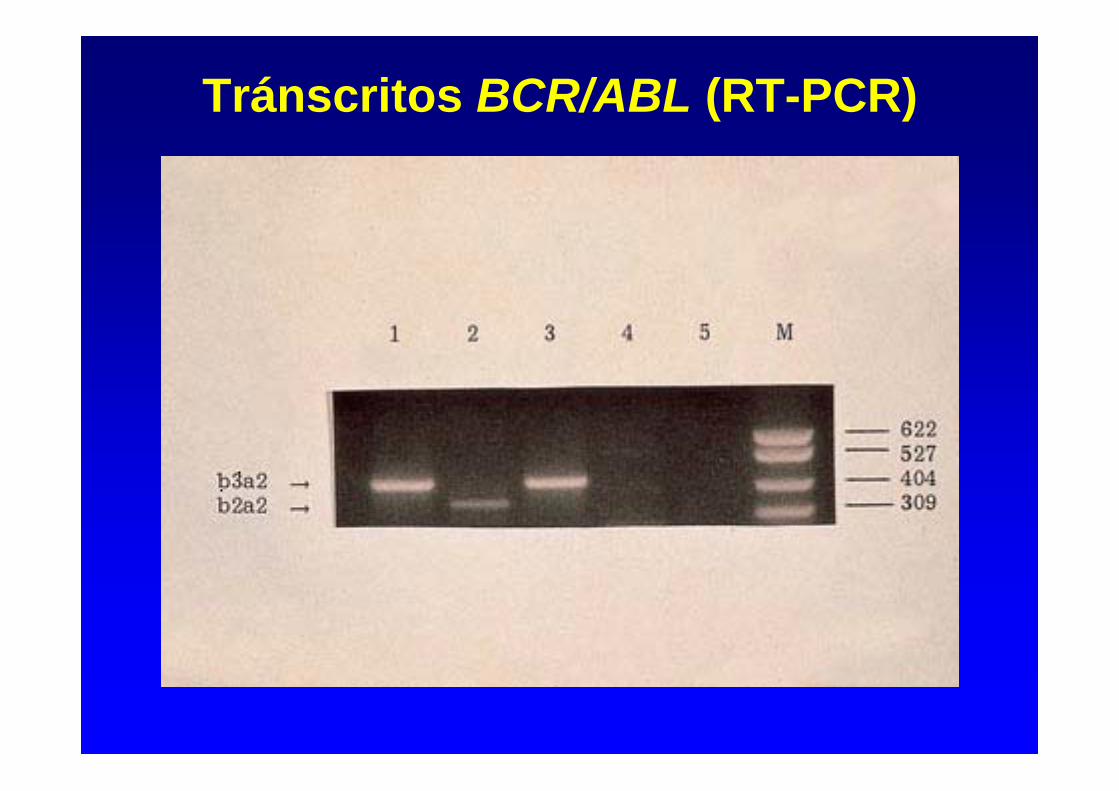
Tránscritos BCR/ABL (RT-PCR)
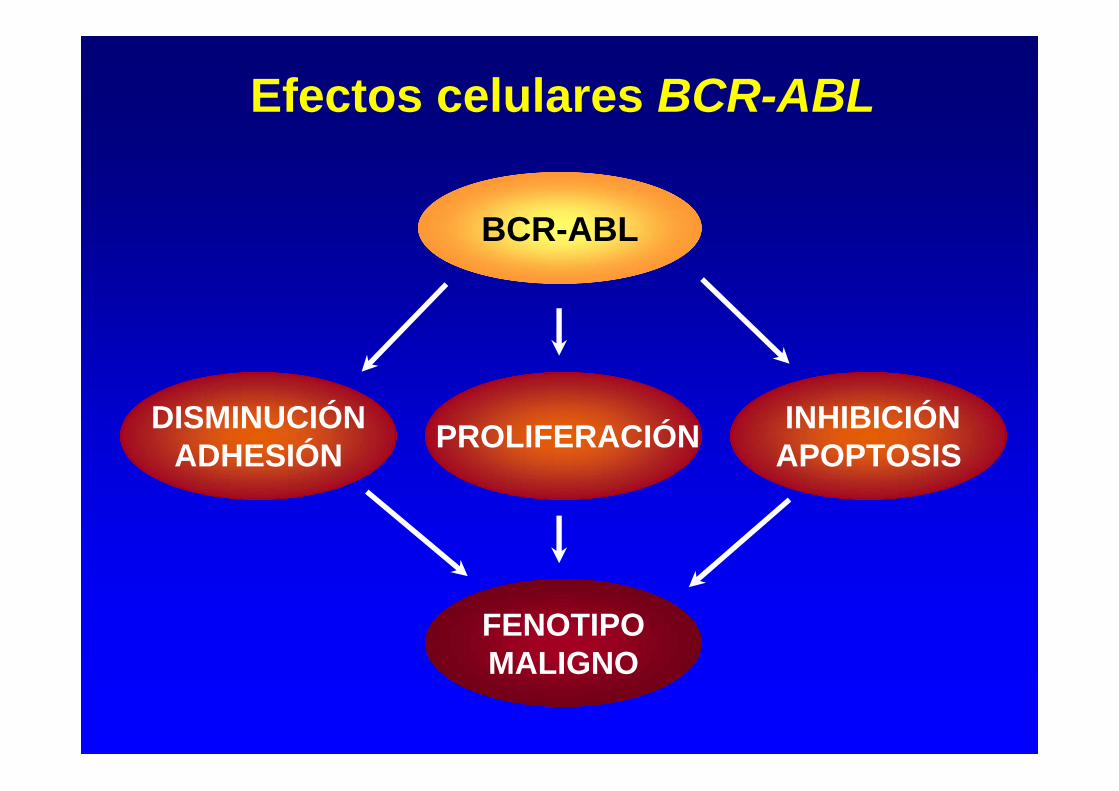
Efectos celulares BCR-ABL
INHIBICIÓNAPOPTOSISPROLIFERACIÓNDISMINUCIÓN
ADHESIÓN
FENOTIPOMALIGNO
BCR-ABL
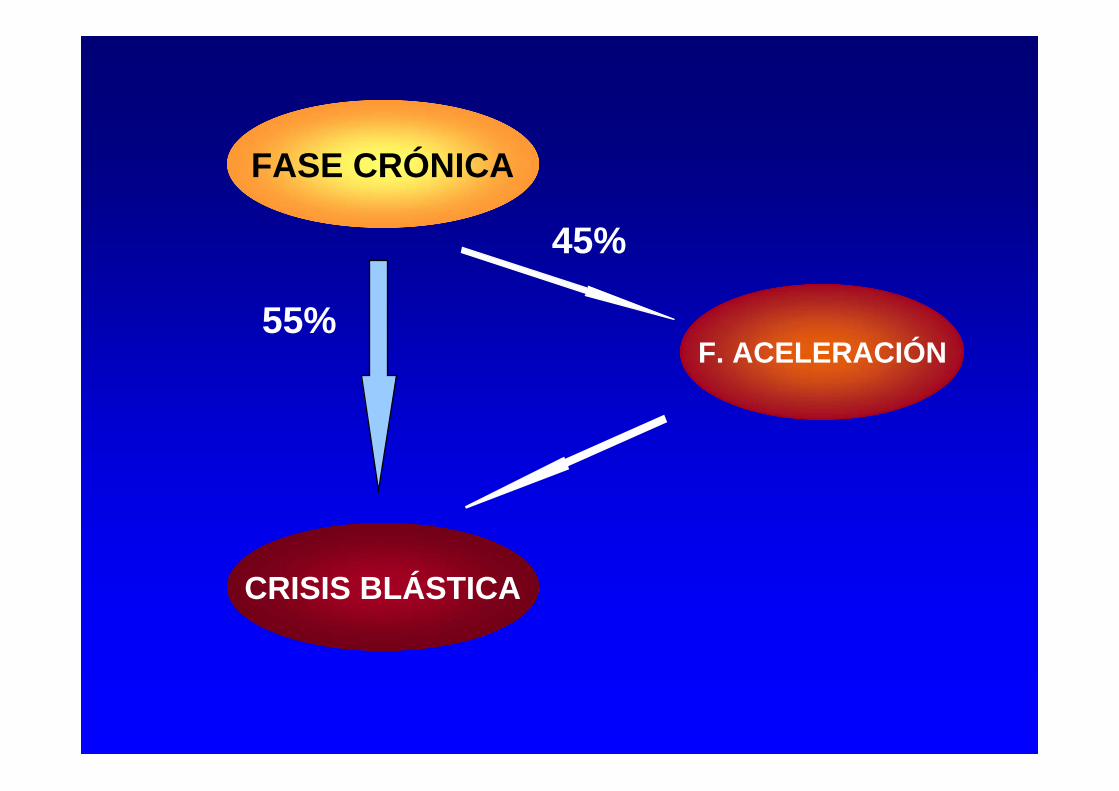
55%
45%
FASE CRÓNICA
F. ACELERACIÓN
CRISIS BLÁSTICA
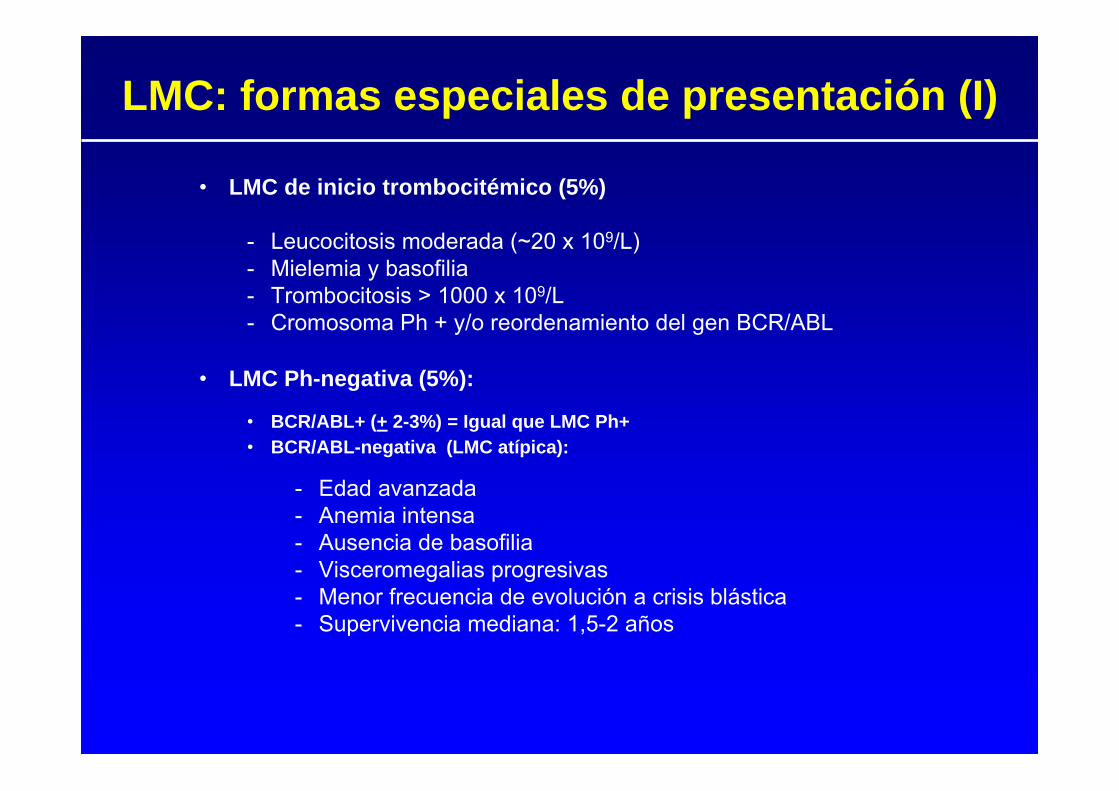
• LMC de inicio trombocitémico (5%)
- Leucocitosis moderada (~20 x 109/L)- Mielemia y basofilia- Trombocitosis > 1000 x 109/L- Cromosoma Ph + y/o reordenamiento del gen BCR/ABL
• LMC Ph-negativa (5%):
• BCR/ABL+ (+ 2-3%) = Igual que LMC Ph+• BCR/ABL-negativa (LMC atípica):
- Edad avanzada- Anemia intensa- Ausencia de basofilia- Visceromegalias progresivas - Menor frecuencia de evolución a crisis blástica- Supervivencia mediana: 1,5-2 años
LMC: formas especiales de presentación (I)
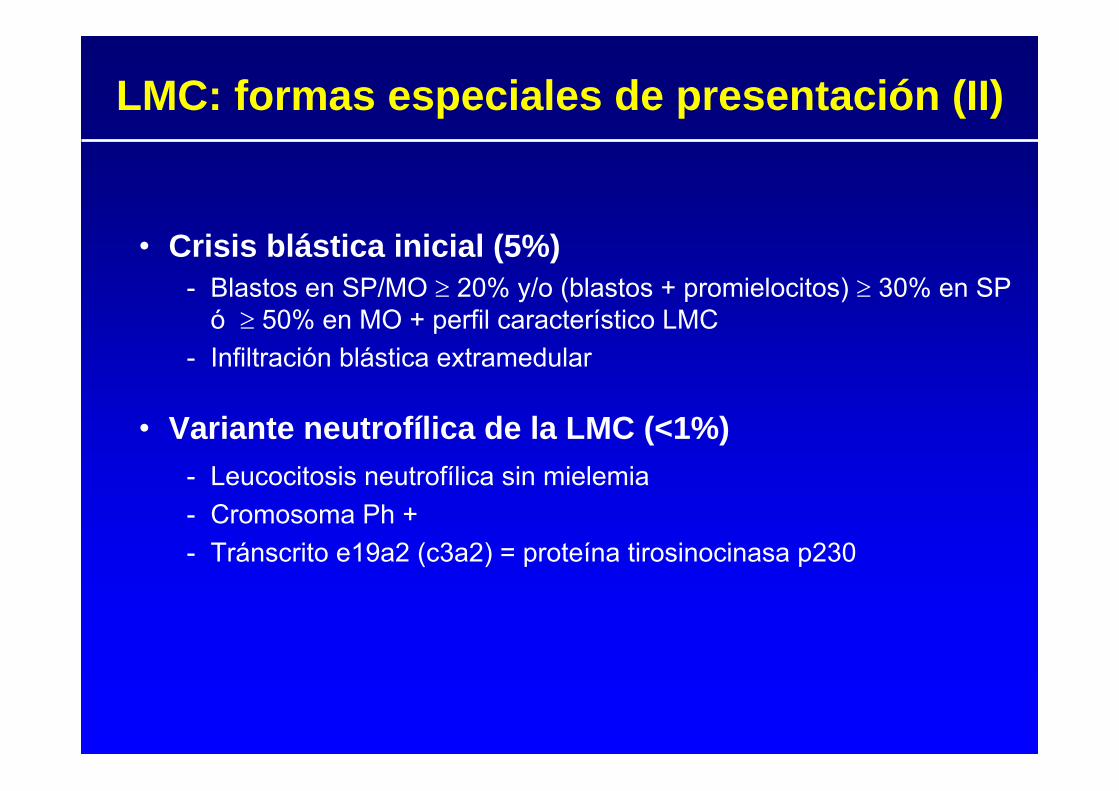
• Crisis blástica inicial (5%)- Blastos en SP/MO 20% y/o (blastos + promielocitos) 30% en SP
ó 50% en MO + perfil característico LMC - Infiltración blástica extramedular
• Variante neutrofílica de la LMC (<1%)- Leucocitosis neutrofílica sin mielemia- Cromosoma Ph +- Tránscrito e19a2 (c3a2) = proteína tirosinocinasa p230
LMC: formas especiales de presentación (II)
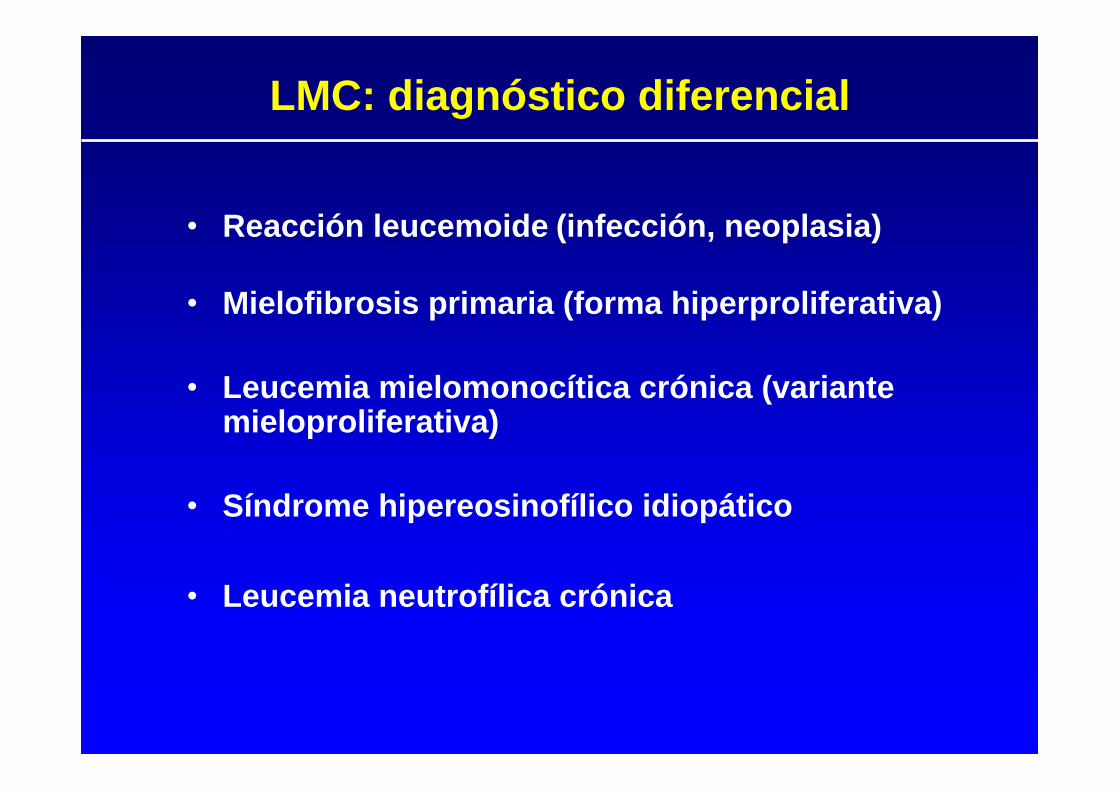
• Reacción leucemoide (infección, neoplasia)
• Mielofibrosis primaria (forma hiperproliferativa)
• Leucemia mielomonocítica crónica (variante mieloproliferativa)
• Síndrome hipereosinofílico idiopático
• Leucemia neutrofílica crónica
LMC: diagnóstico diferencial
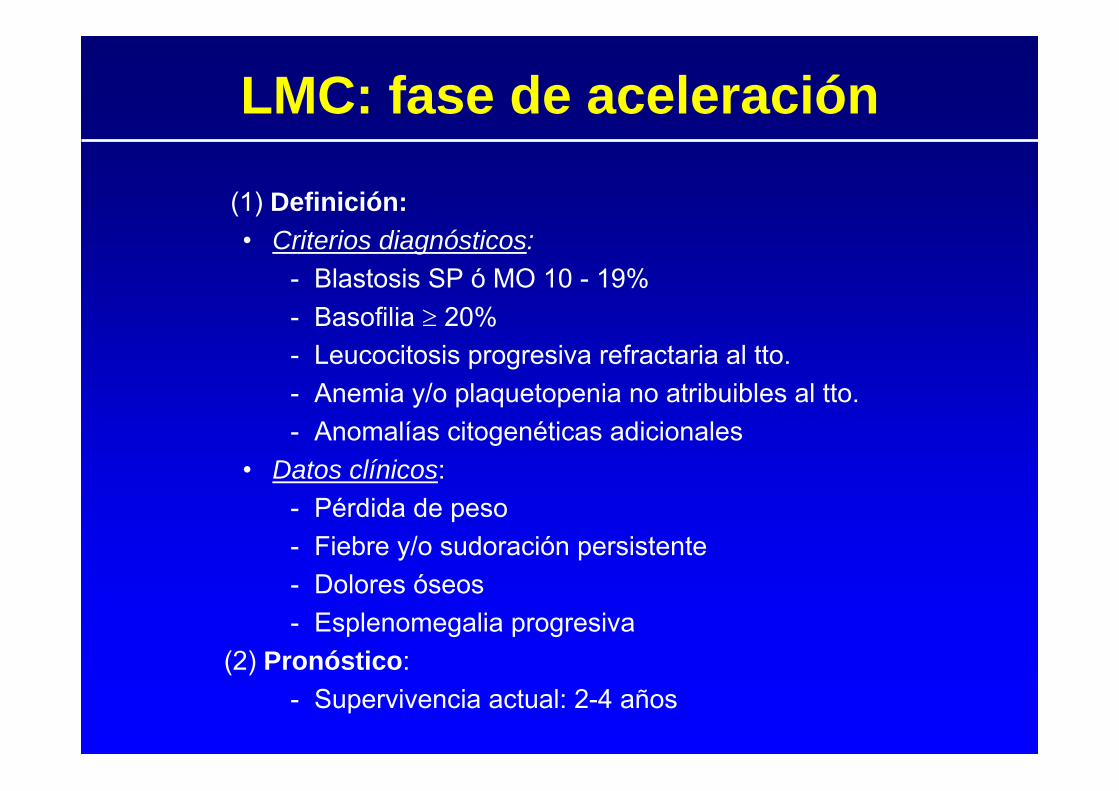
LMC: fase de aceleración
(1) Definición:• Criterios diagnósticos:
- Blastosis SP ó MO 10 - 19%- Basofilia 20%- Leucocitosis progresiva refractaria al tto.- Anemia y/o plaquetopenia no atribuibles al tto.- Anomalías citogenéticas adicionales
• Datos clínicos:- Pérdida de peso- Fiebre y/o sudoración persistente- Dolores óseos- Esplenomegalia progresiva
(2) Pronóstico:- Supervivencia actual: 2-4 años
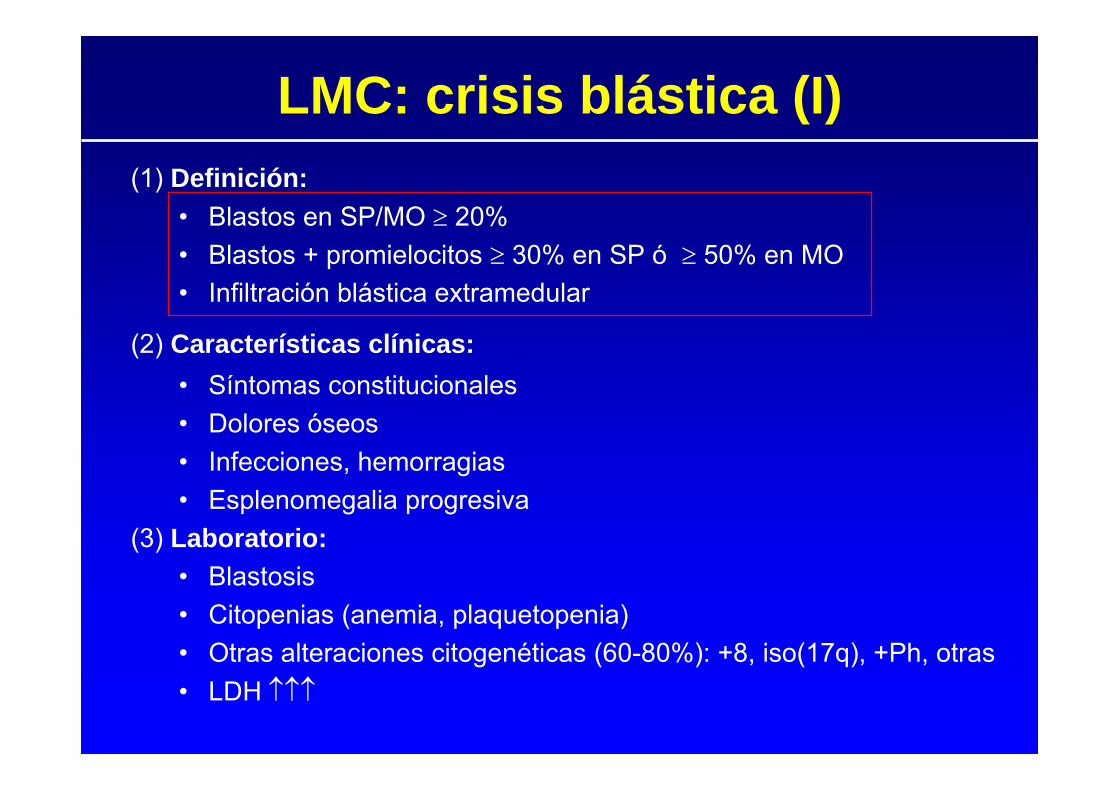
LMC: crisis blástica (I)(1) Definición:
• Blastos en SP/MO 20% • Blastos + promielocitos 30% en SP ó 50% en MO• Infiltración blástica extramedular
(2) Características clínicas:• Síntomas constitucionales• Dolores óseos• Infecciones, hemorragias• Esplenomegalia progresiva
(3) Laboratorio:• Blastosis• Citopenias (anemia, plaquetopenia)• Otras alteraciones citogenéticas (60-80%): +8, iso(17q), +Ph, otras• LDH
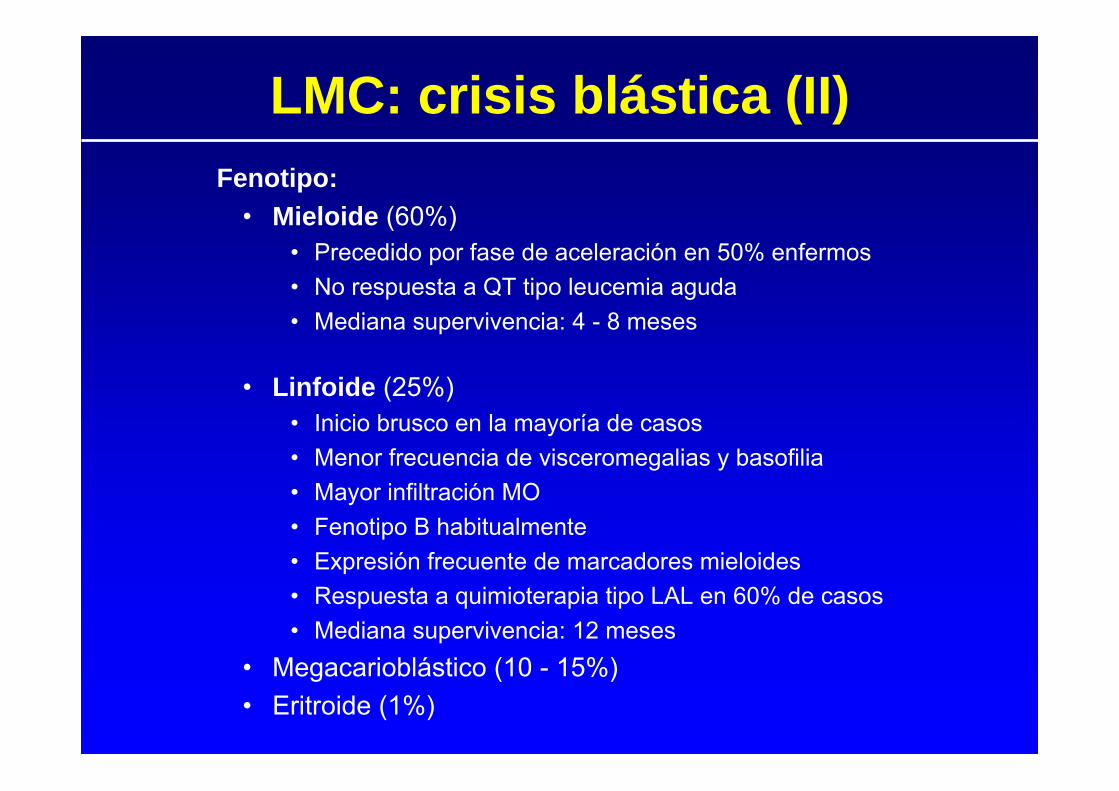
LMC: crisis blástica (II)Fenotipo:
• Mieloide (60%)• Precedido por fase de aceleración en 50% enfermos• No respuesta a QT tipo leucemia aguda• Mediana supervivencia: 4 - 8 meses
• Linfoide (25%)• Inicio brusco en la mayoría de casos• Menor frecuencia de visceromegalias y basofilia• Mayor infiltración MO• Fenotipo B habitualmente • Expresión frecuente de marcadores mieloides• Respuesta a quimioterapia tipo LAL en 60% de casos• Mediana supervivencia: 12 meses
• Megacarioblástico (10 - 15%)• Eritroide (1%)
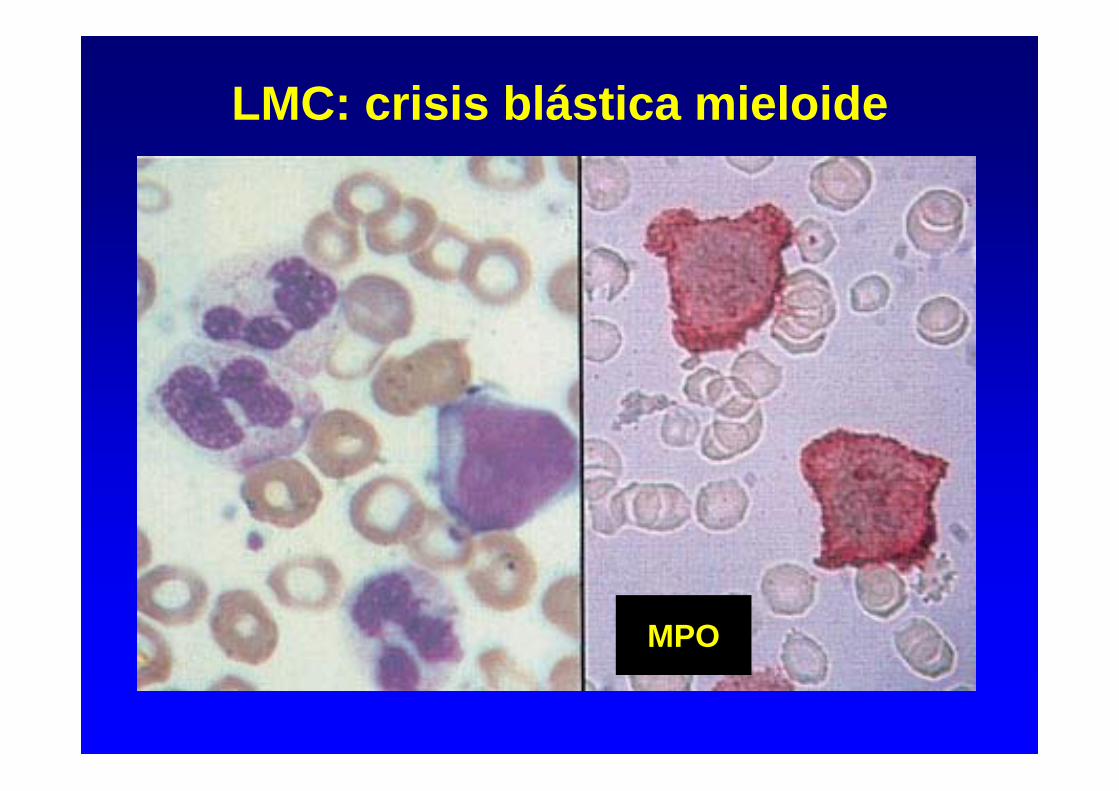
LMC: crisis blástica mieloide
MPO
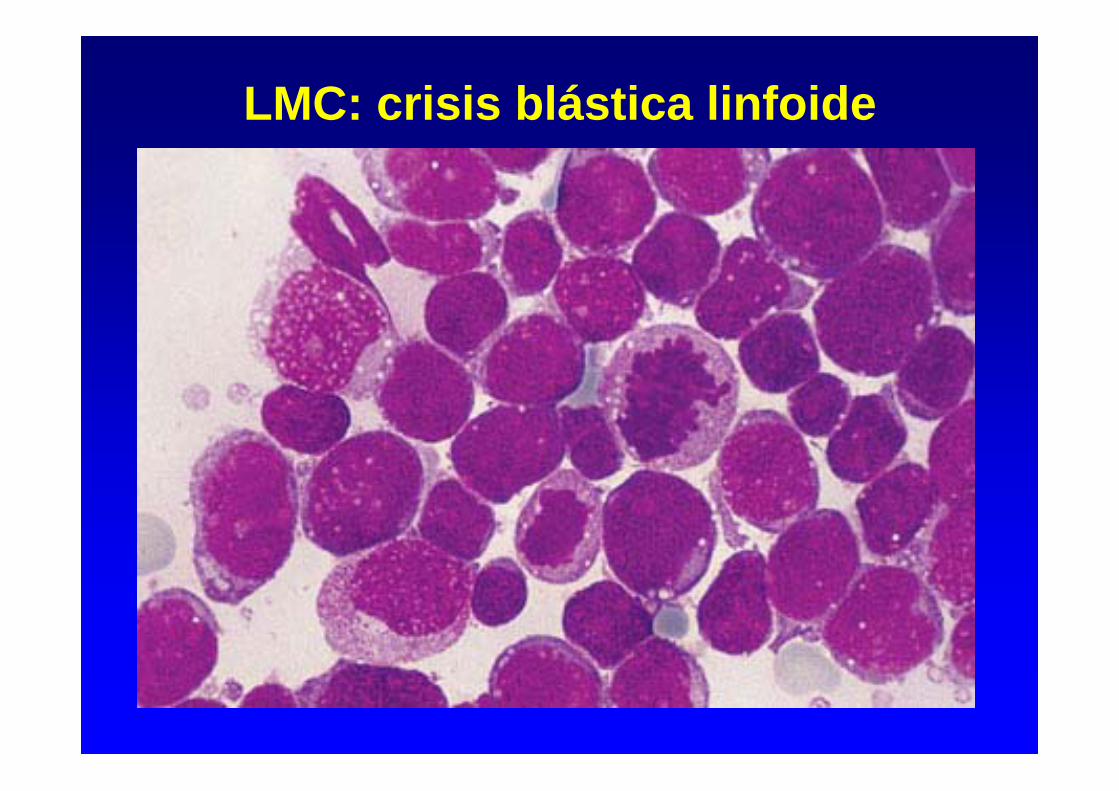
LMC: crisis blástica linfoide
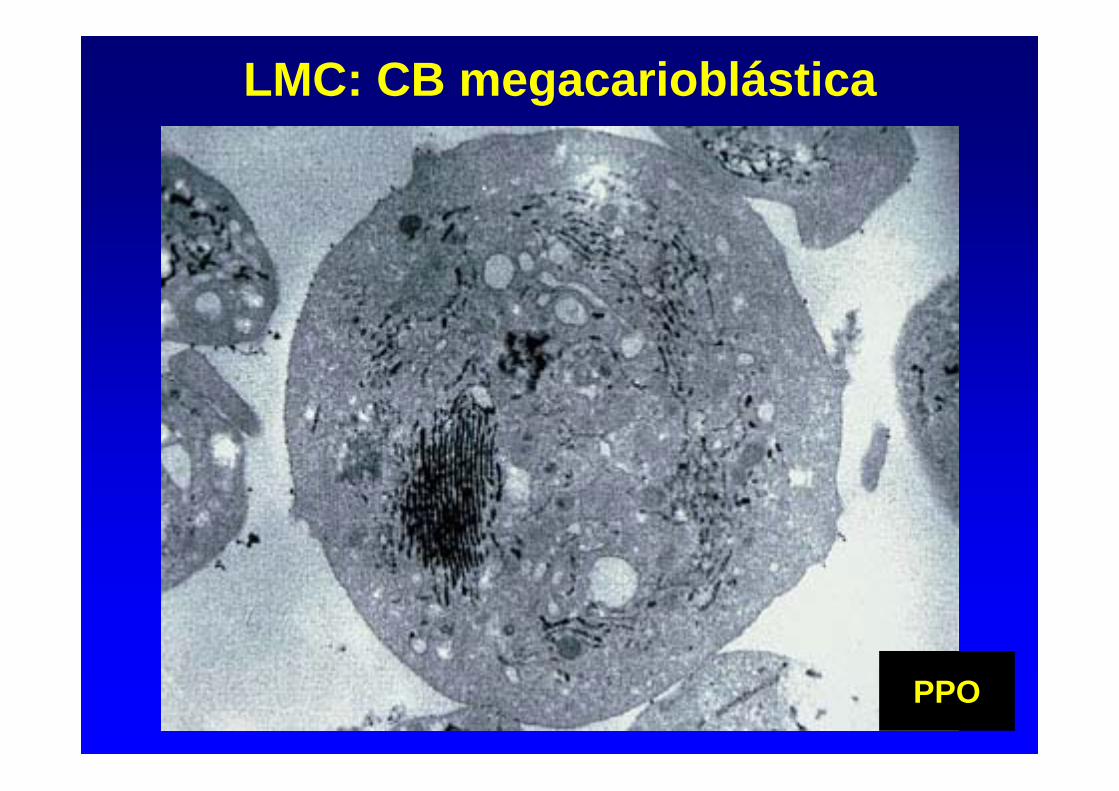
LMC: CB megacarioblástica
PPO
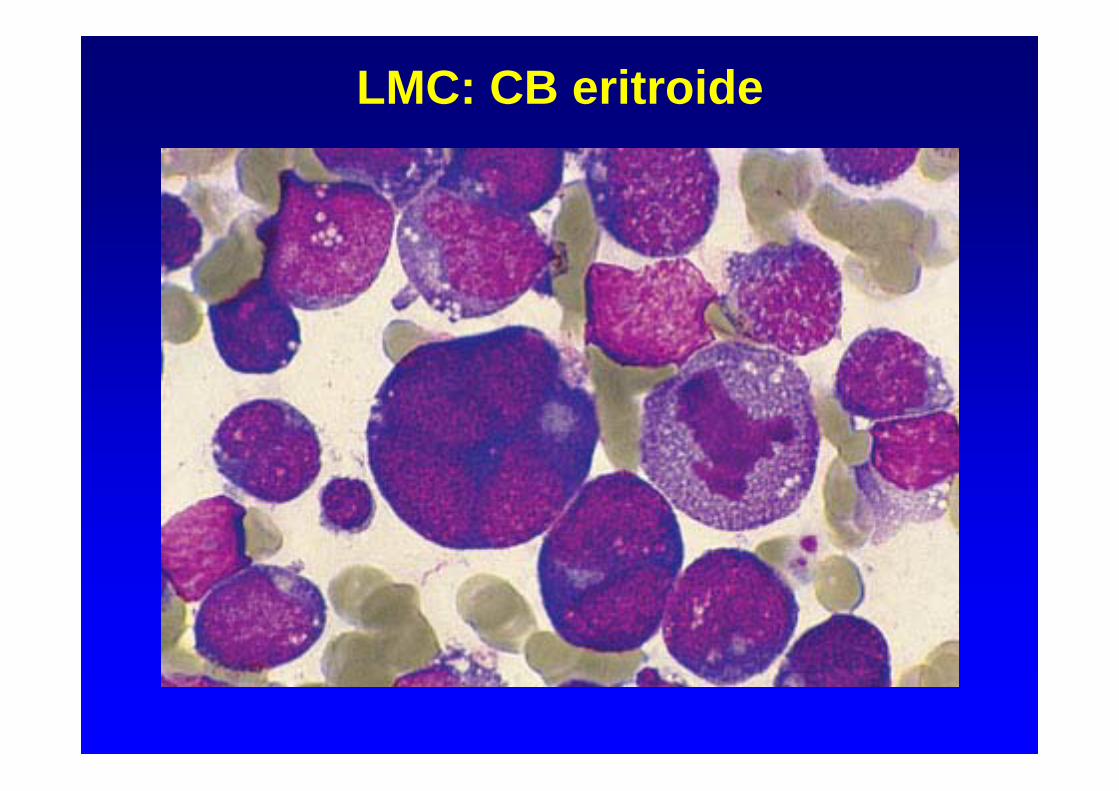
LMC: CB eritroide
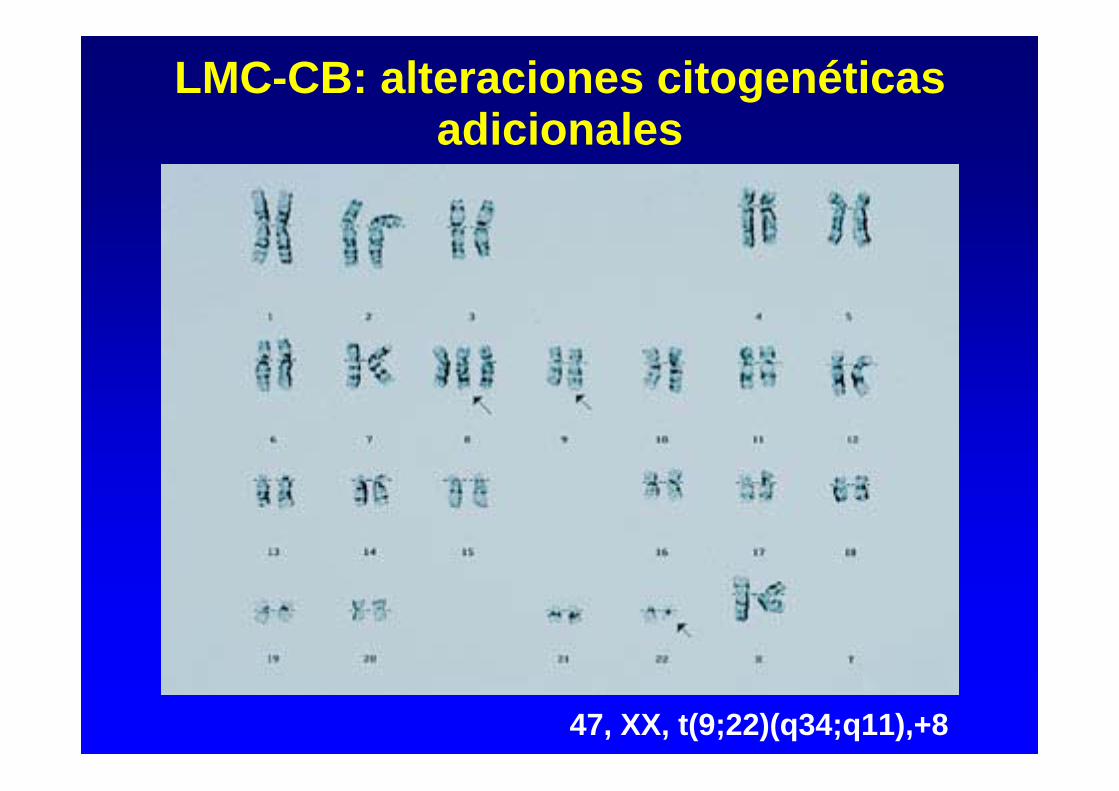
LMC-CB: alteraciones citogenéticas adicionales
47, XX, t(9;22)(q34;q11),+8
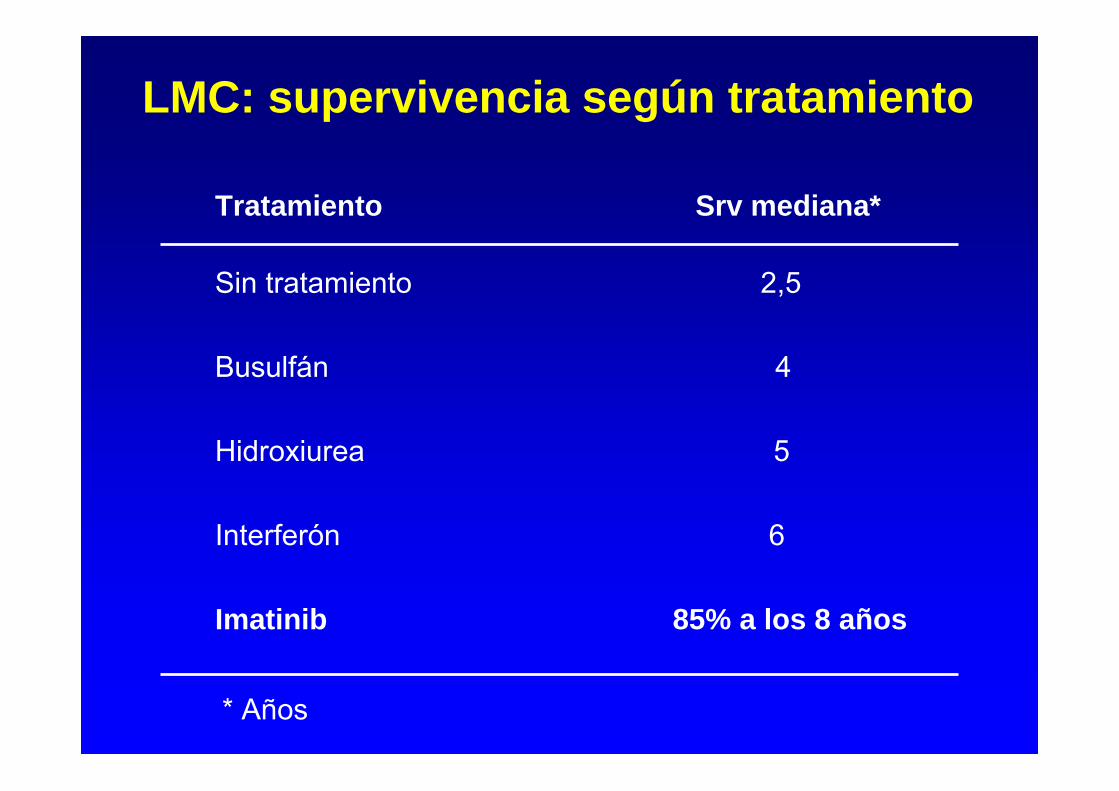
LMC: supervivencia según tratamiento
Tratamiento Srv mediana*
Sin tratamiento 2,5
Busulfán 4
Hidroxiurea 5
Interferón 6
Imatinib 85% a los 8 años
* Años
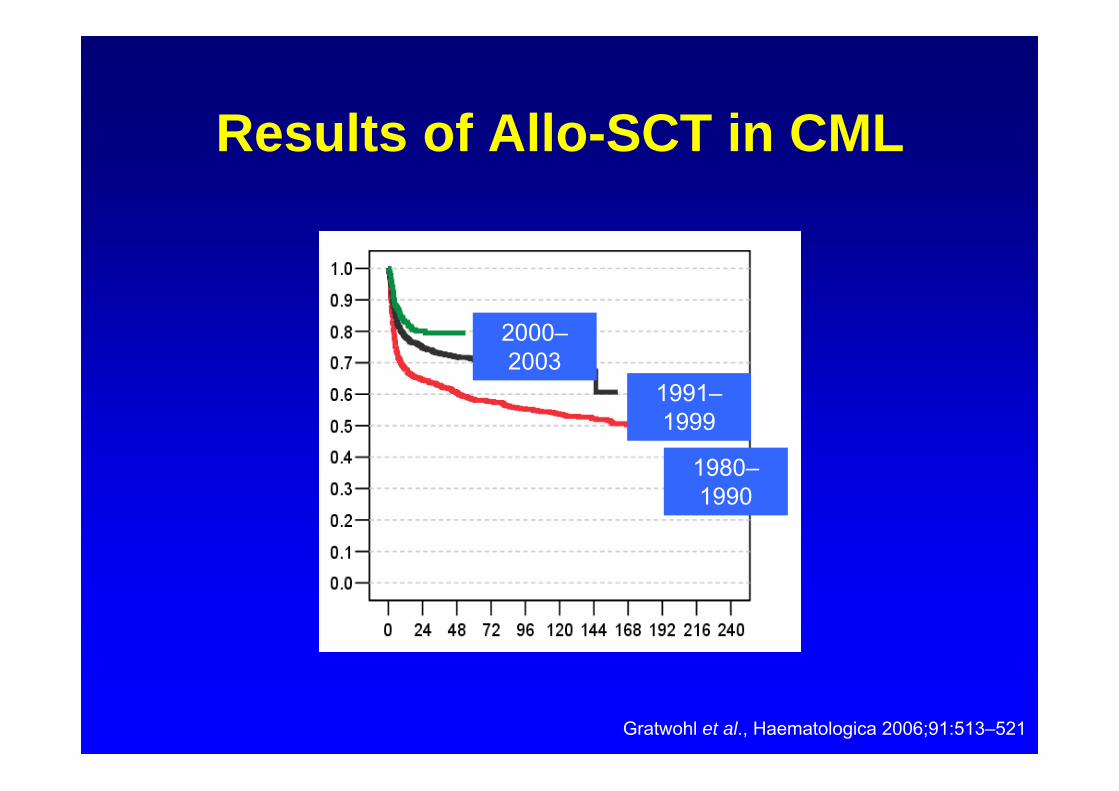
Results of Allo-SCT in CML
2000–2003
1991–1999
1980–1990
Gratwohl et al., Haematologica 2006;91:513–521
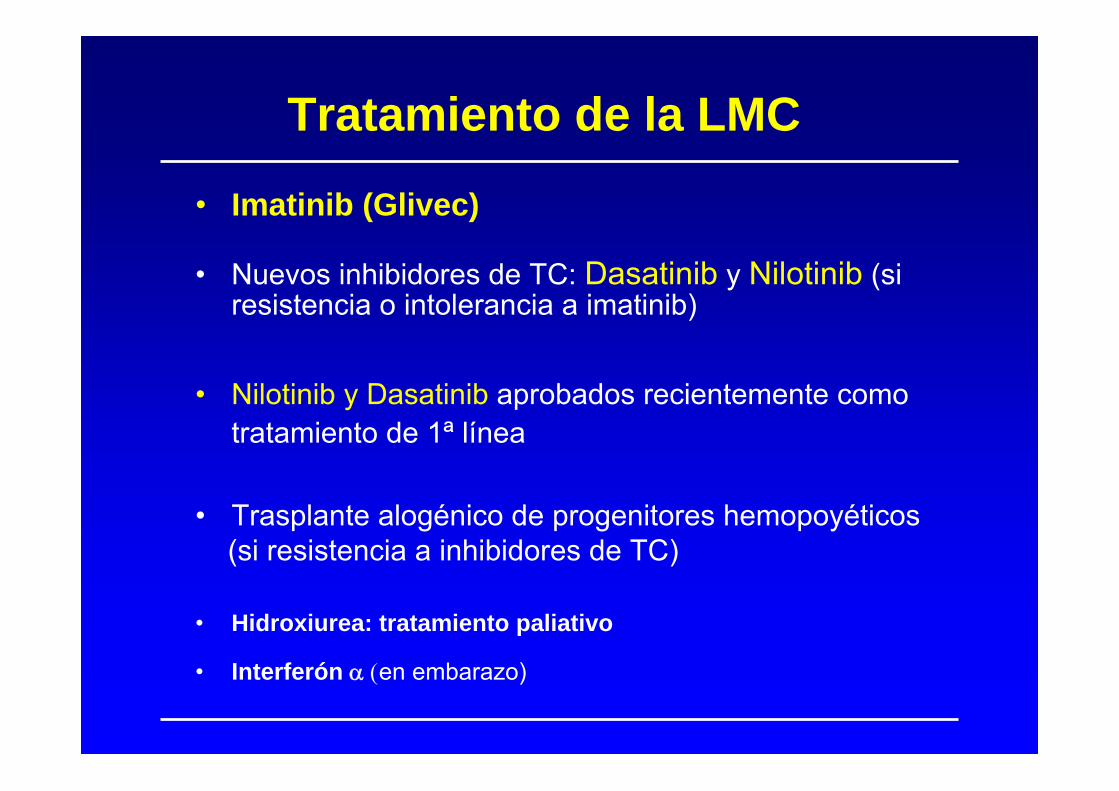
• Imatinib (Glivec)
• Nuevos inhibidores de TC: Dasatinib y Nilotinib (si resistencia o intolerancia a imatinib)
• Nilotinib y Dasatinib aprobados recientemente como tratamiento de 1ª línea
• Trasplante alogénico de progenitores hemopoyéticos(si resistencia a inhibidores de TC)
• Hidroxiurea: tratamiento paliativo
• Interferón en embarazo)
Tratamiento de la LMC
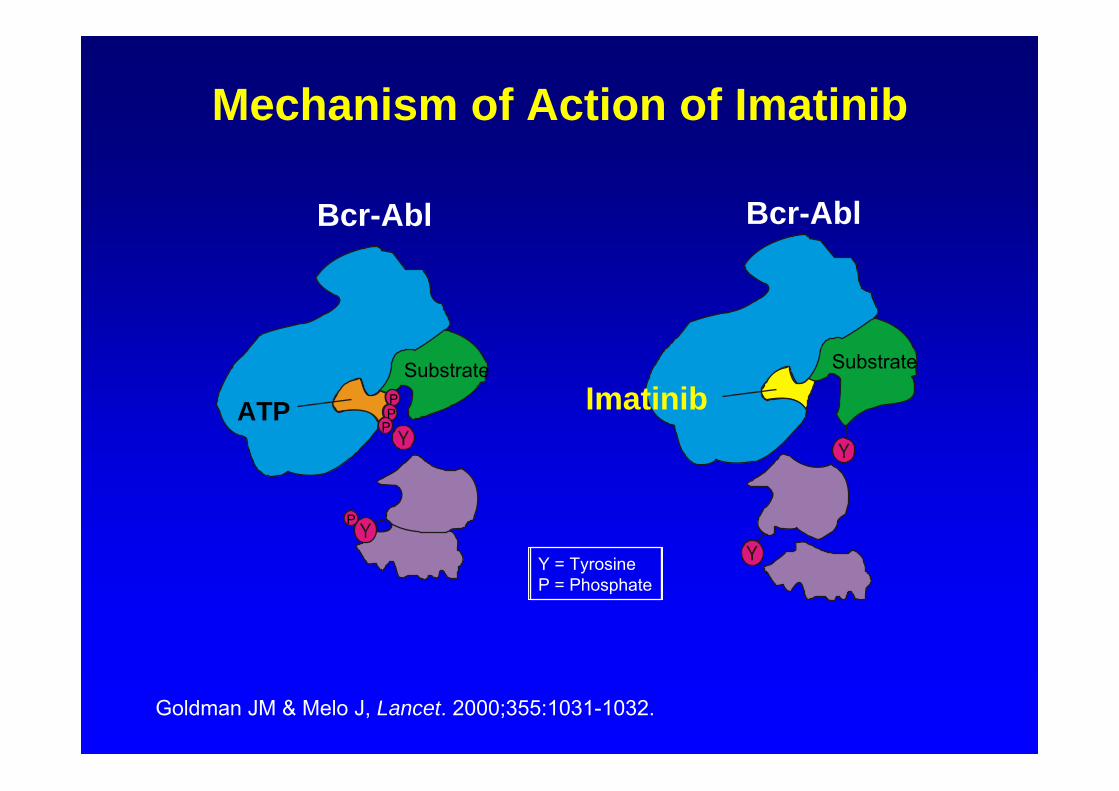
Mechanism of Action of Imatinib
Goldman JM & Melo J, Lancet. 2000;355:1031-1032.
Y = TyrosineP = Phosphate
Substrate
Bcr-AblBcr-Abl
ATPSubstrate
PPP
P
Imatinib
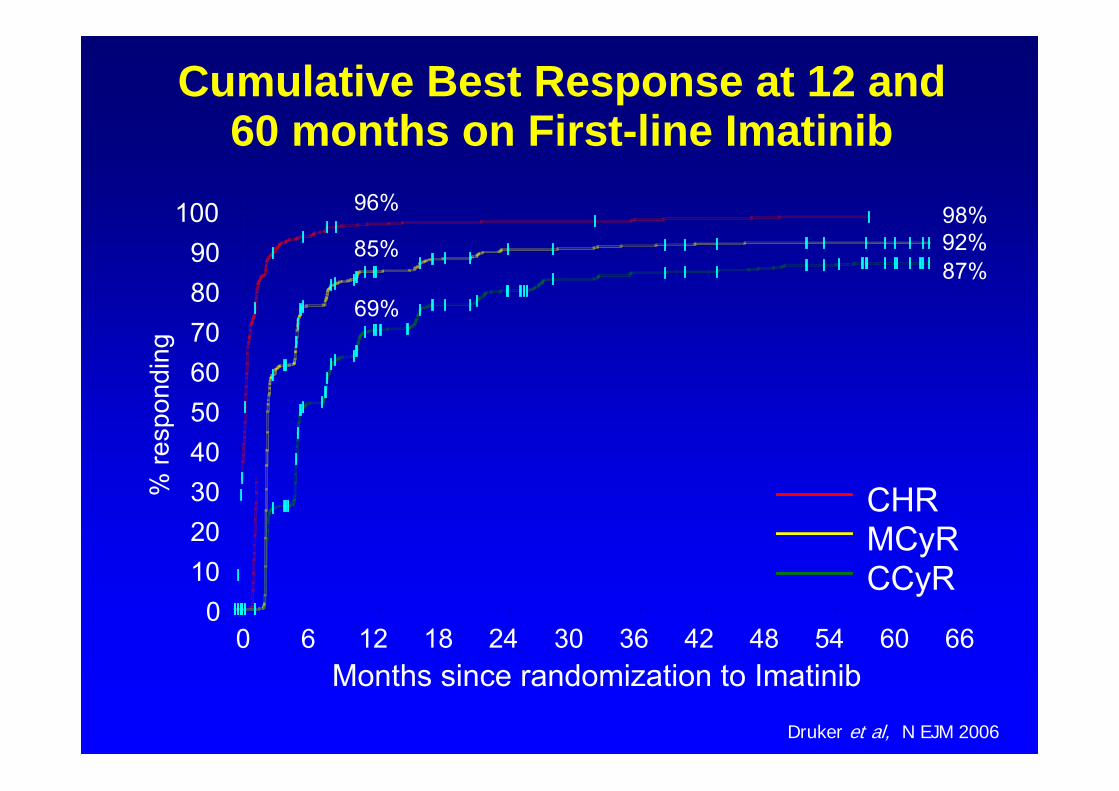
CHRMCyRCCyR
% re
spon
ding
0102030405060708090
100
Months since randomization to Imatinib0 6 12 18 24 30 36 42 48 54 60 66
Cumulative Best Response at 12 and 60 months on First-line Imatinib
96%
85%
69%
98%92%87%
Druker et al, N EJM 2006
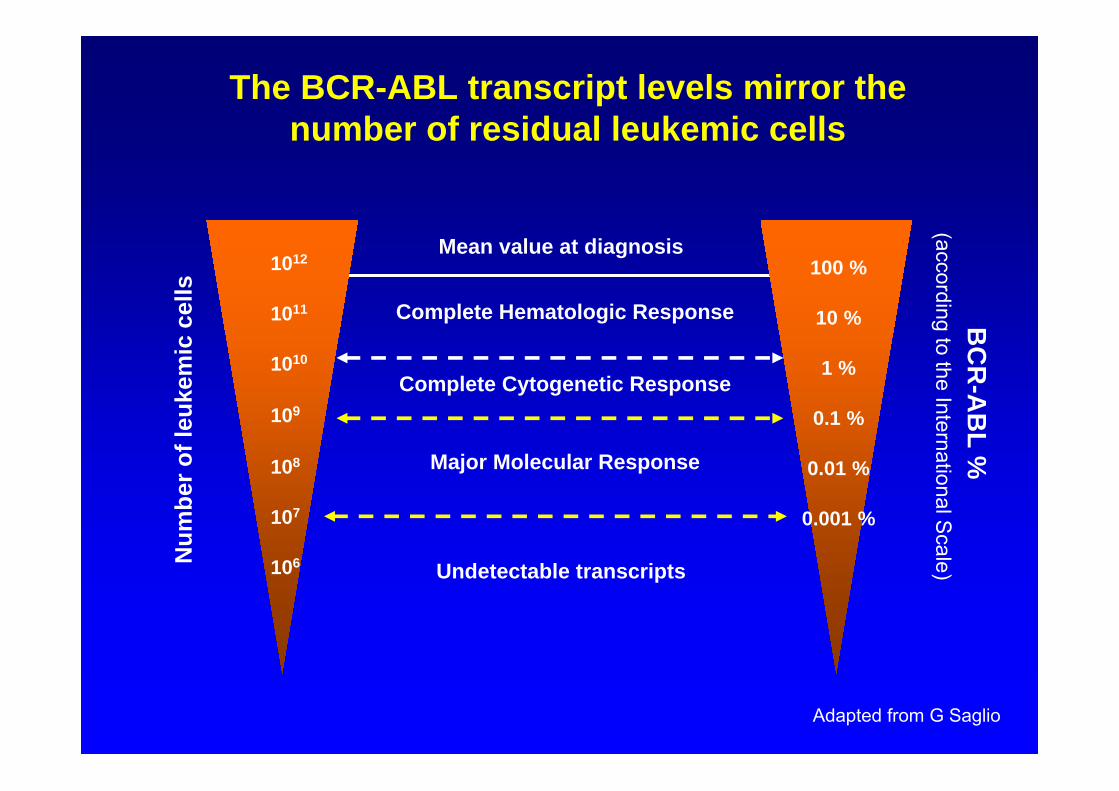
1012
1011
1010
109
108
107
106
100 %
10 %
1 %
0.1 %
0.01 %
0.001 %
Mean value at diagnosis
Complete Hematologic Response
Complete Cytogenetic Response
Major Molecular Response
Undetectable transcripts
BC
R-A
BL %
(according to the International Scale)N
umbe
r of l
euke
mic
cel
ls
The BCR-ABL transcript levels mirror the number of residual leukemic cells
Adapted from G Saglio
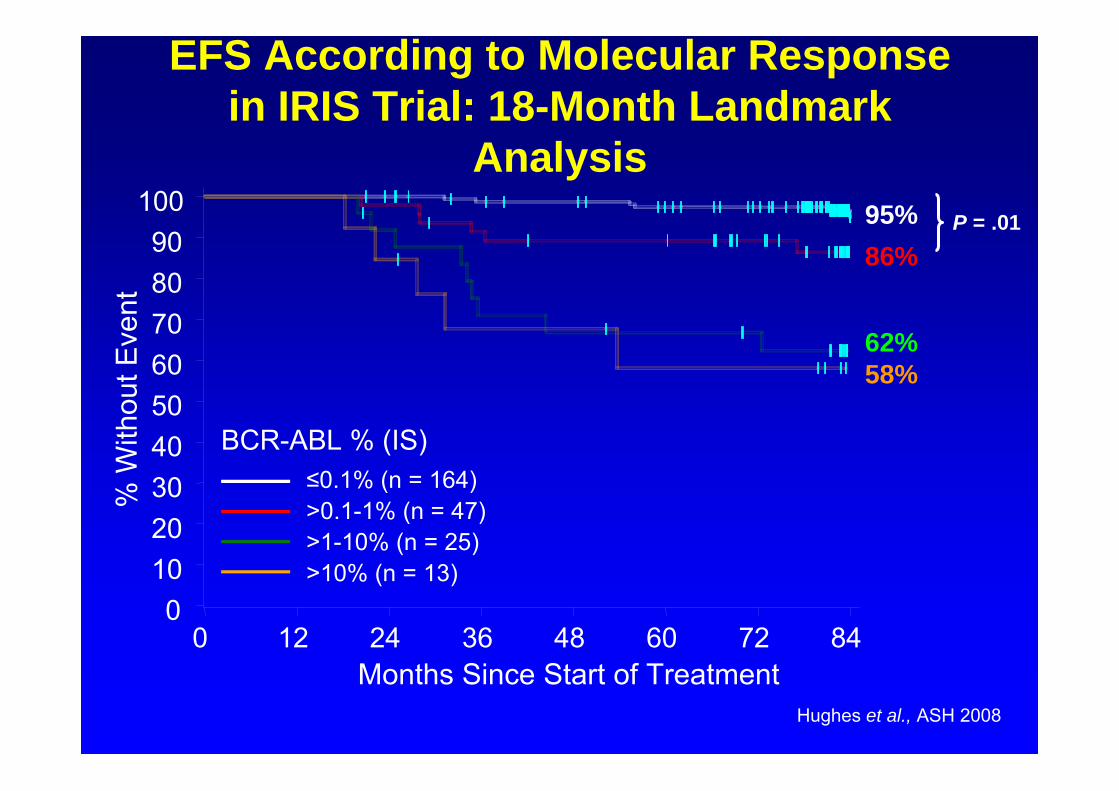
EFS According to Molecular Response in IRIS Trial: 18-Month Landmark
AnalysisP = .01
BCR-ABL % (IS)<=0.01%>0.1-1%>1-10%
% W
ithou
t Eve
nt
0102030405060708090
100
Months Since Start of Treatment0 12 24 36 48 60 72 84
86%95%
62%58%
≤0.1% (n = 164)>0.1-1% (n = 47)>1-10% (n = 25)>10% (n = 13)
Hughes et al., ASH 2008
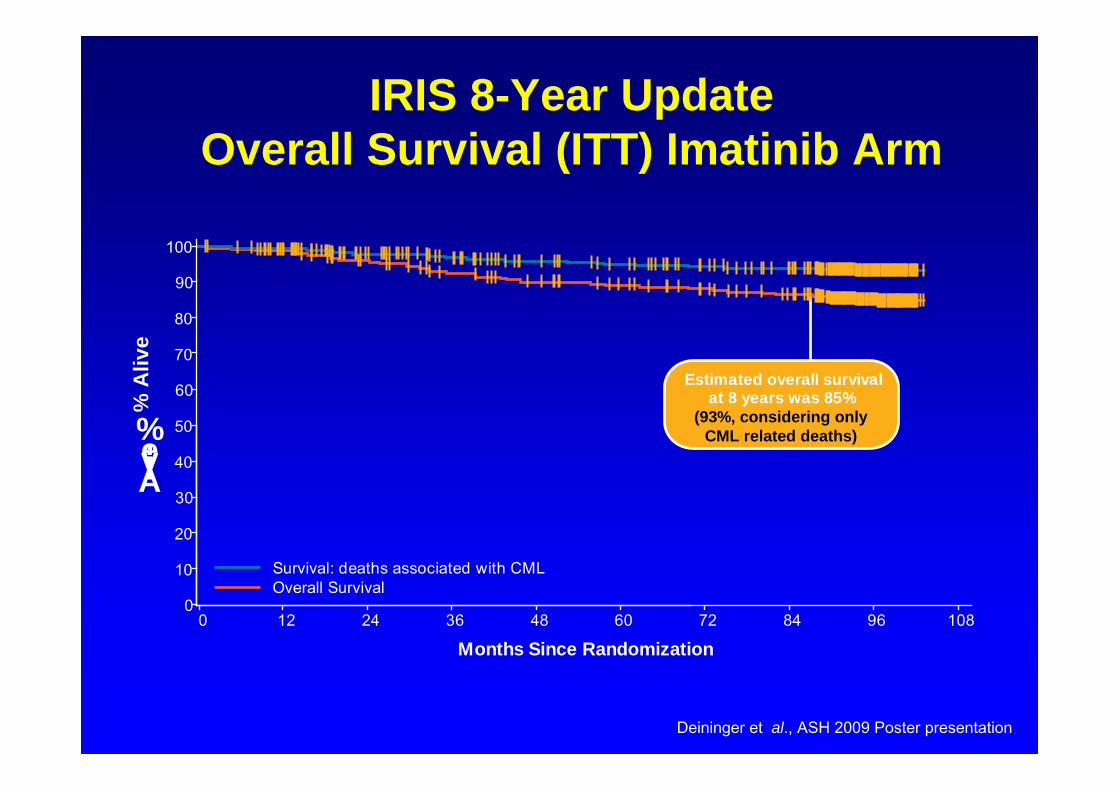
IRIS 8-Year UpdateOverall Survival (ITT) Imatinib Arm
Estimated overall survivalat 8 years was 85%
(93%, considering onlyCML related deaths)
0
10
20
30
40
50
60
70
80
90
100
Alive,%
0 12 24 36 48 60 72 84 96 108
Months Since Randomization
Survival: deaths associated with CMLOverall Survival
% A
live
Deininger et al., ASH 2009 Poster presentation
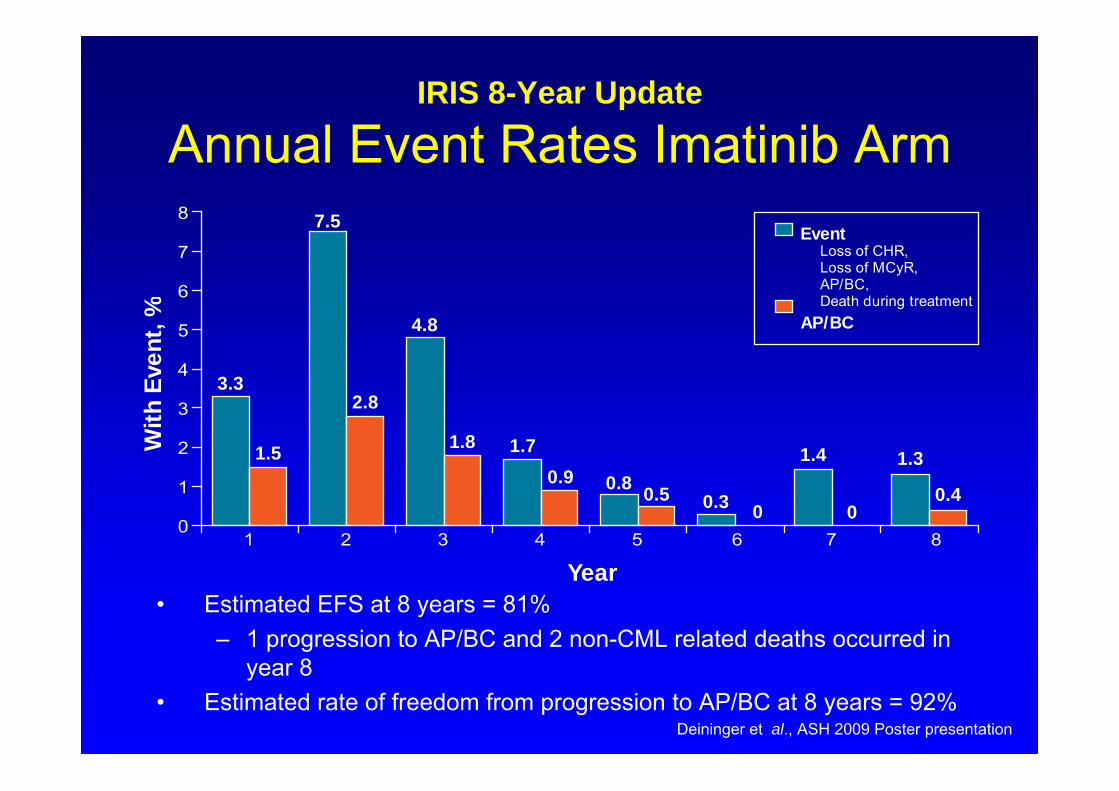
IRIS 8-Year Update
Annual Event Rates Imatinib Arm
• Estimated EFS at 8 years = 81%– 1 progression to AP/BC and 2 non-CML related deaths occurred in
year 8• Estimated rate of freedom from progression to AP/BC at 8 years = 92%
With
Even
t,%
3.3
7.5
4.8
1.7
0.80.3
1.4 1.31.5
2.8
1.8
0.90.5
0 00.4
0
1
2
3
4
5
6
7
8
1 2 3 4 5 6 7 8
Year
EventLoss of CHR,Loss of MCyR,AP/BC,Death during treatment
AP/BC
Deininger et al., ASH 2009 Poster presentation
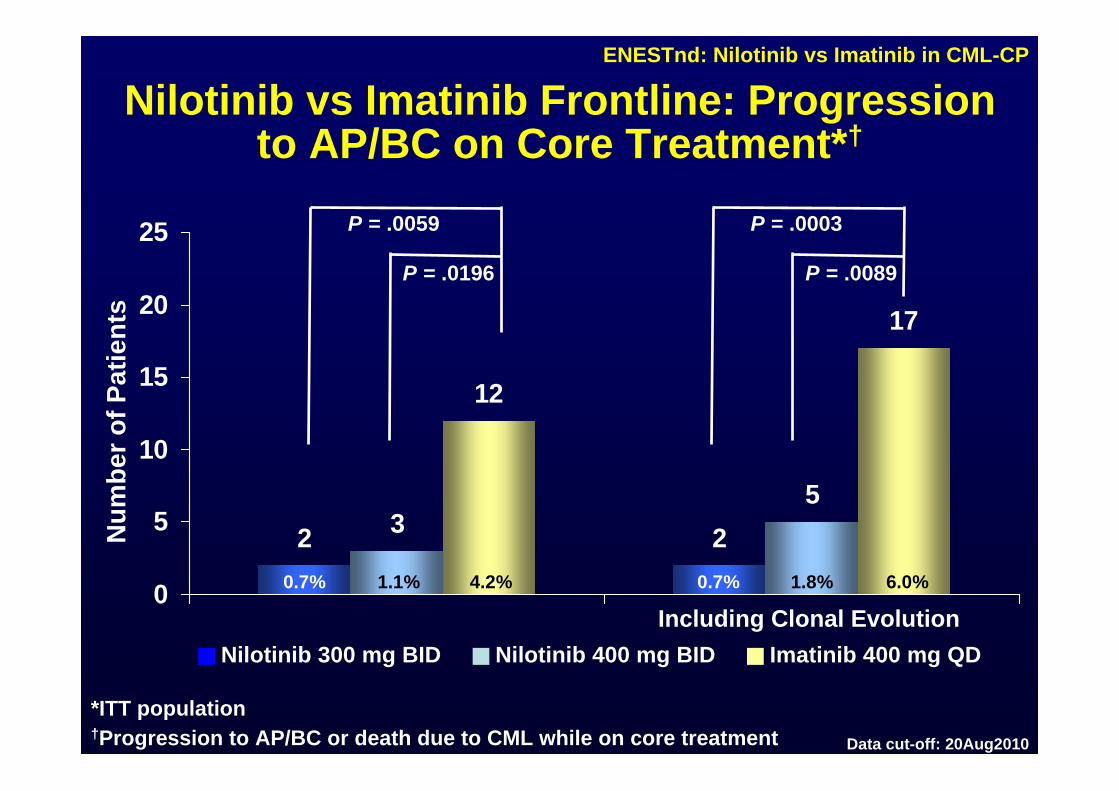
ENESTnd: Nilotinib vs Imatinib in CML-CP
2 235
12
17
0
5
10
15
20
25
Nilotinib vs Imatinib Frontline: Progression to AP/BC on Core Treatment*†
Num
ber o
f Pat
ient
s
0.7% 0.7%
Nilotinib 300 mg BID Nilotinib 400 mg BID Imatinib 400 mg QD
P = .0059
P = .0196
P = .0003
P = .0089
Including Clonal Evolution
*ITT population†Progression to AP/BC or death due to CML while on core treatment
1.1% 4.2% 1.8% 6.0%
Data cut-off: 20Aug2010
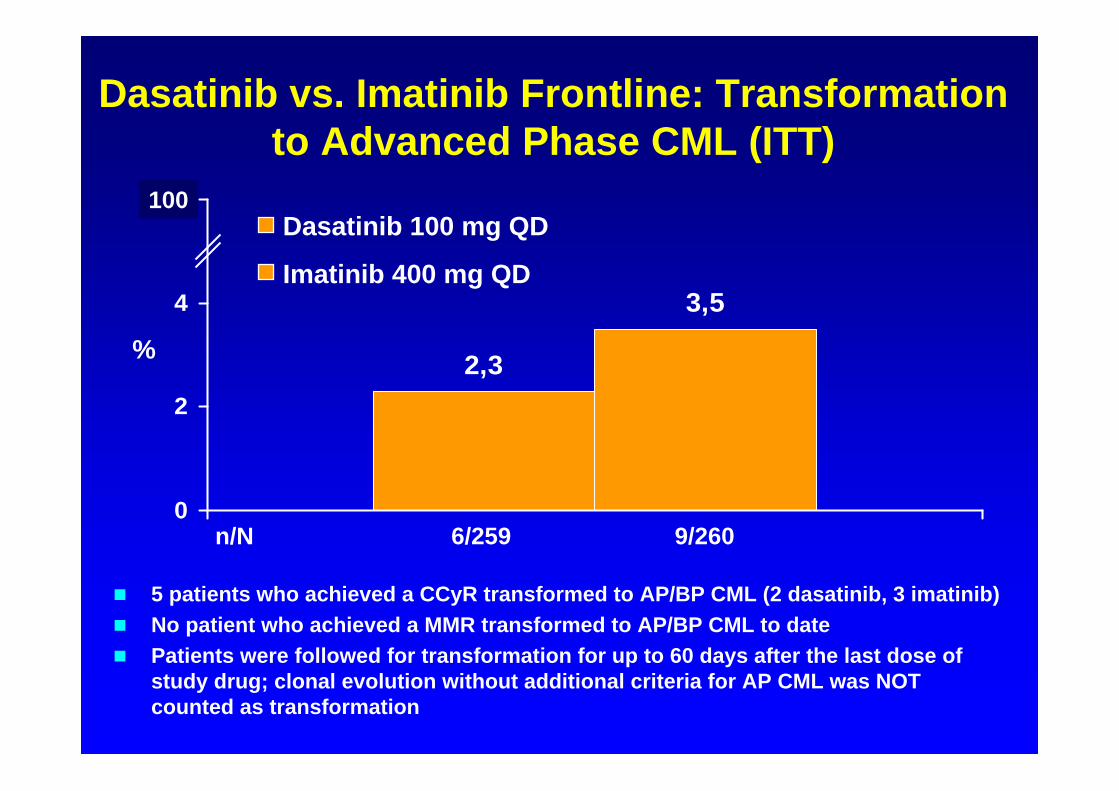
5 patients who achieved a CCyR transformed to AP/BP CML (2 dasatinib, 3 imatinib) No patient who achieved a MMR transformed to AP/BP CML to date Patients were followed for transformation for up to 60 days after the last dose of
study drug; clonal evolution without additional criteria for AP CML was NOT counted as transformation
2,3
3,5
0
2
4
6100
n/N 6/259 9/260
Dasatinib vs. Imatinib Frontline: Transformation to Advanced Phase CML (ITT)
Dasatinib 100 mg QD
Imatinib 400 mg QD
%