Embed Size (px)
Citation preview
8/12/2019 Hernández Et Al (2005)
http://slidepdf.com/reader/full/hernandez-et-al-2005 1/11
Biogeographical patterns and Rapoport’s rule in southeastern Pacificbenthic polychaetes of the Chilean coast
Cristian E. Hernandez, Rodrigo A. Moreno and Nicolas Rozbaczylo
Hernandez, C. E., Moreno, R. A. and Rozbaczylo, N. 2005. Biogeographicalpatterns and Rapoport’s rule in southeastern Pacific benthic polychaetes of theChilean coast. / Ecography 28: 363 /373.
Recently three biogeographical units were identified along the Chilean coast (theMagellanic Province, an Intermediate Area, and the Peruvian Province), however fewstudies have focused on the factors and dynamic processes that formed these spatialunits (e.g. Rapoport’s rule and its causal mechanisms). In this study we used benthicpolychaetes of the Chilean coast to evaluate patterns of latitudinal distribution andspecies richness, and the existence of the three main biogeographical provincesdescribed for the Chilean coast. Additionally, we evaluated the latitudinal Rapoporteffects and geometric constraint as a null hypothesis explaining the species richnessdistribution.We found that benthic polychaete diversity increased towards southern latitudes. Thecluster and ordination (non-metric MultiDimensional Scaling, nMDS) analyses of thedistribution data, presented only two statistically significant (bootstrapping techniques)biogeographic provinces along the Chilean coast, with a break occurring between418 and 428S. While, our results did not support a latitudinal Rapoport effect, they didsupport the view that latitudinal Rapoport effects are a local phenomenon, occurringonly for the Northeastern Pacific marine taxa. The relationship between latitudinal
range extent and mean latitude indicated the existence of two hard boundaries at eitherextreme of the Chilean coast, limiting the geographical ranges of the species. However,geometric constraints tested using a Monte Carlo simulation approach showed a weaklevel of mid-domain effect on species richness. Finally, we propose that geometricconstraint together with the geomorphology and historical characteristics of theChilean coast explain the biogeographical patterns of benthic polychaete taxa in Chile.
C. E. Hernandez ([email protected]), R. A. Moreno and N. Rozbaczylo, Dept deEcologıa and Center for Ad vanced Studies in Ecology & Biodi versity (CASEB), Fac. deCiencias Biologicas, Pontificia Uni v. Catolica de Chile, Alameda 340, Casilla114-D, Santiago, Chile (present address of C. E. H.: Dept de Zoologı a, Fac. deCiencias Naturales y Oceanogra ficas, Uni v. de Concepcio n, Casilla 160-C, Concepcio n,Chile).
The southeastern Pacific coast of Chile (18820?S /568S)
has traditionally been divided into two principal zoogeo-
graphic provinces: the Peruvian Province north of 308S,
which is under subtropical influence, and the Magellanic
Province south of 418S, which is under subantarctic
influence (Dahl 1960, Brattstrom and Johanssen 1983).
Between these zones (308 /418S) researchers distinguish a
transition zone (Balech 1954, Dell 1971, Viviani 1979,
Brattstrom and Johanssen 1983). Lancellotti and
Vasquez (1999) proposed new limits for this zone
ranging from 358S to 488S, and corresponding to an
area with a gradual change in species composition,
including a conventional biogeographical break around
418S /428S. Recently, Camus (2001) reviewed 27 biogeo-
graphic classifications proposed for the Chilean coast.
Based on this review, Camus (2001) identified three
Accepted 19 October 2004
Copyright# ECOGRAPHY 2005ISSN 0906-7590
ECOGRAPHY 28: 363 /373, 2005
ECOGRAPHY 28:3 (2005) 363

8/12/2019 Hernández Et Al (2005)
http://slidepdf.com/reader/full/hernandez-et-al-2005 2/11
principal spatial units: a Northern Area (188 /308S)
containing a warm temperate biota (i.e. the Peruvian
Province), a Southern Area (418 /568S) with an austral
biota (i.e. the Magellanic Province), and an extensive
Intermediate Area (308 /418S) lacking transitional ele-
ments, and containing a mixed biota without a distin-
guishing character or biogeographic range. In spite of
the numerous efforts made to describe macroscale
patterns on the Chilean coast, there are few studies
focused on understanding the factors that generate these
species distribution patterns (Fernandez et al. 2000)
(e.g. Rapoport’s Rule and its associated causal mechan-
isms, Santelices and Marquet 1998).
The zoogeographic study of polychaetes on the south-
eastern Pacific coast of Chile has historically received
little attention. However, during the last few years there
has been a progressive increase in studies attempting to
establish the faunistic affinities of this group between
distinct geographic areas. Recent comparative studies of
faunistic affinities between polychaetes in the Magellanic
and Antarctic Provinces (Gambi and Mariani 1999,
Canete et al. 1999), for the entire coast of Chile
(Lancellotti and Vasquez 2000), indicate two essential
faunistic units for the polychaete group: 1) taxa occurring
from Valparaıso (338S) towards the north, which is under
subtropical influence; and 2) taxa occurring from Con-
cepcion (368S) towards the south, showing greater
similarity to the subantarctic fauna, and a latitudinal
pattern of progressive increase in diversity from low
latitudes to more southern latitudes. This biodiversity
trend is contrary to that suggested by the general
biogeographical principle, Rapoport’s rule (Stevens
1989, 1992, 1996). Given that the number of polychaete
records on the southeastern Pacific coast has increased
considerably during the last few years (see Carrasco and
Palma 2000, 2003, Rozbaczylo and Quiroga 2000,
Hernandez et al. 2001, Moreno et al. 2002), it is necessary
to conduct a new analysis of biogeographical patterns
and an assessment of Rapoport’s rule for this taxa.
Rapoport’s rule was originally stated as a correlation
between the latitudinal extent of species’ geographical
range sizes and latitude, suggesting that the geographical
extent of species’ ranges increases towards one end of aphysical gradient; this is observed as a positive relation-
ship between latitudinal range extent and range mid-
point (Stevens 1989). Subsequently, it was suggested that
this rule also holds over elevational and bathymetric
gradients (Stevens 1992, 1996). Research on several
North American taxa supports the latitudinal relation-
ship, and bathymetric Rapoport effects have been
documented in northeastern Pacific taxa (Stevens 1996,
Smith and Brown 2002, Smith and Gaines 2003).
Nevertheless, the generality of this latitudinal pattern
has been questioned by studies of some Pacific and
Atlantic taxa (Rohde and Heap 1996, Santelices andMarquet 1998).
Stevens (1989, 1992, 1996) suggested seasonal varia-
tion as a causal mechanism of Rapoport’s rule. This
author hypothesizes that the geographical extent of
species’ ranges declines in more stable environments
(i.e. towards low latitudes), because this kind of envir-
onment promotes specialization, and consequently, the
coexistence of more species with smaller ranges. How-
ever, for many marine species water masses are relatively
stable throughout the year, and, thus, the distribution
patterns of these species may not be determined by
seasonal variation. In this sense, Rapoport’s rule may
not apply to marine species that do not experience
marked seasonal environmental variation. Recently, it
has been suggested that in the absence of environmental
gradients, patterns of species richness and distribution
may depend on geometric constraints of the species’
spatial distributions (Colwell and Hurtt 1994, Willig and
Lyons 1998, Colwell and Lees 2000, Jetz and Rahbek
2001, 2002, Bokma et al. 2001, Grytnes and Vetaas 2002,Grytnes 2003). Geometric constraints are geographical
features that limit the geographical ranges of species by
acting as barriers to dispersal (see Grytnes 2003). This
constraint produce the mid-domain effect, which refers
to the random placement of species’ geographical ranges
along a geographical gradient with hard boundaries
(i.e. a domain). This produces a hump-shaped pattern of
species richness, such that local species richness peaks at
the midpoint of the domain (Pineda 1993, Colwell
and Hurtt 1994, Willig and Lyons 1998, Lees et al.
1999, Colwell and Lees 2000, McCain 2003, 2004, see
Grytnes 2003).In this study we assessed the biogeographical patterns,
and the generality of Rapoport’s rule, for southeastern
Pacific benthic polychaete taxa. We first established
patterns of latitudinal distribution and species richness.
Next, we evaluated the consistency of the three main
biogeographical provinces described for the Pacific coast
of Chile by Camus (2001). Then, we evaluated whether
the extent of latitudinal range of southeastern Pacific
polychaetes shows a positive correlation with the range
midpoint, as predicted by Rapoport’s rule. Finally, we
evaluated geometric constraint as a null hypothesis
explaining the species richness distribution.
Methods
Data base and patterns of latitudinal distribution
The database used in this study consists of a list of 467
species of benthic polychaetes obtained from sampling
conducted in littoral and sublittoral benthic habitats on
the continental shelf (B/200 m depth), compiled by
Rozbaczylo (1985), and unpubl. The species list includes
polychaete taxa from the southeastern Pacific coast of
Chile ranging from 188S (Arica) to 568S (Cape Horn). Atotal of 29 species were omitted from the original
364 ECOGRAPHY 28:3 (2005)

8/12/2019 Hernández Et Al (2005)
http://slidepdf.com/reader/full/hernandez-et-al-2005 3/11
database (504 species) because their distributional range
was beyond the continental shelf, and another eight
species were omitted because their reported geographic
distributions were imprecise. The database compiled for
this study is the most current and complete database for
this region of the world, and is based on an exhaustive
literature search, reviews of museum collections and field
expeditions.
Maps of species’ distributions were created using data
with a spatial resolution of 18 of latitude, and ranges
were assumed to be continuous between points.
To describe latitudinal patterns and compare species’
distributions with the biogeographical units described by
Camus (2001) we categorized species’ distribution ranges
into four groups: a) species recorded within only 18 of
latitude; b) species with medium-small ranges of dis-
tribution from 28 to 148 of latitude; c) species with
medium-large distributions ranging from 158 to 268 of
latitude; and d) species with large distributions rangingfrom 278 to 378 of latitude. To evaluate latitudinal
patterns of distribution in benthic polychaete taxa, we
divided the coast of Chile into 38 bands of latitude,
registering the presence or absence of each taxa in each
38 segment of the coast. Species richness (alpha diver-
sity) was calculated as the sum of all species within each
latitudinal band along the coast of Chile. To describe the
latitudinal trend in species richness, we estimated
the relationship between the lower latitudinal limit of
the 38 bands versus species richness, and evaluated
the significance of this relationship in EcoSim 7.68
software (Gotelli and Entsminger 2004). In this softwarewe fit a standard linear regression to the data and then
used the randomization approach (50 000 random ma-
trices, random number seed/12345) to test the null
hypothesis that the slope was equal to 0 (a significance
level of pB/0.05 was assumed in this study).
Evaluation of biogeographical provinces
The degree of faunistic similarity between 38 latitudinal
bands was calculated using the Jaccard coefficient of
similarity based on presence/absence records of the
benthic polychaete taxa. To evaluate the existence of
biogeographical units (i.e. provinces) we conducted a
cluster analysis using the Jaccard similarity values. For
this analysis we utilized the unweighted pair/group
method with arithmetic averages (UPGMA) as the
agglomeration algorithm (Sokal and Rohlf 1995). We
determined the significance level (p/0.05) of the result-
ing clusters by calculating the 95th percentile of the
pseudovalues of similitude. These pseudovalues were
obtained using the bootstrapping technique (Manly
1997) with 10 000 iterations, implemented in SYSTAT
9.0 software for Windows (SPS, Chicago, IL, USA).To confirm the existence of biogeographic patterns
we performed non-metric MultiDimensional Scaling
(nMDS) ordination (Field et al. 1982, Clarke 1993) on
the Jaccard similarity matrix.
Rapoport’s rule: latitudinal range extent vs rangemidpoint relationships
We registered the latitudinal range extent of a species as
the difference between the maximum and minimum
latitude in its range of distribution. The range midpoint
was calculated as the average latitude between the
maximum and minimum latitude the distribution. The
relationship between latitudinal range extent and range
midpoint was evaluated using simple regression analyses,
as well as polynomial models to the second degree,
implemented in JMP-IN ver. 4.0.3 (SAS Inst. 2001).
When the relationship between both variables was
positive, we concluded the existence of a latitudinalRapoport effect. Additionally, we assessed the geometric
shape (e.g. left triangle, right triangle, pyramid, or
inverted pyramid) that best explained the distribution
of data points between both axes, using EcoSim
7.68 software (Gotelli and Entsminger 2004). In this
software we used the macroecology options to generate
50 000 random matrices of data (random number seed/
12 345). Next we evaluated: a) the dispersion index (DI)
of points, by dividing the bivariate space into four
quadrants; b) the number of points within the shape; c)
the number of points falling outside the boundary of the
shape (i.e. upper left and upper right boundaries); and d)only for the points falling beyond the boundary
(i.e. beyond the upper left or upper right boundaries),
we calculated the deviation of the points from the
boundary (i.e. sum of squares, SS).
Geometric constraint and species richness
We tested for the existence of geometric constraints
using the Monte Carlo simulation program, Mid-Do-
main Null (McCain 2003, 2004), implemented in Excel
software. The species richness data for each 38 latitude
band were compared with null model predictions using a
Monte Carlo simulation of species richness curves. The
simulated curves were based on empirical range sizes
within a bounded domain, using the analytical stochastic
models of Colwell and Hurtt (1994) and Colwell (1999).
We used 50 000 Monte Carlo simulations sampled with
replacement (i.e. the bootstrap method) and without
replacement (i.e. the randomization procedure) from
empirical range sizes, to calculate the amplitude of the
95% confidence simulation prediction curves (Manly
1997, McCain 2004). As stated by Manly (1997), in
randomization procedures ‘‘the hypothesis under inves-
tigation suggests that there will be a tendency for acertain type of pattern to appear in data, whereas the
ECOGRAPHY 28:3 (2005) 365

8/12/2019 Hernández Et Al (2005)
http://slidepdf.com/reader/full/hernandez-et-al-2005 4/11
null hypothesis says that if this pattern is present then
this is a purely chance effect of observations in a random
order’’. This situation (the randomization procedure)
corresponds precisely to the mid-domain and geometric
constraints model (McCain 2004).
Results
Patterns of latitudinal distribution
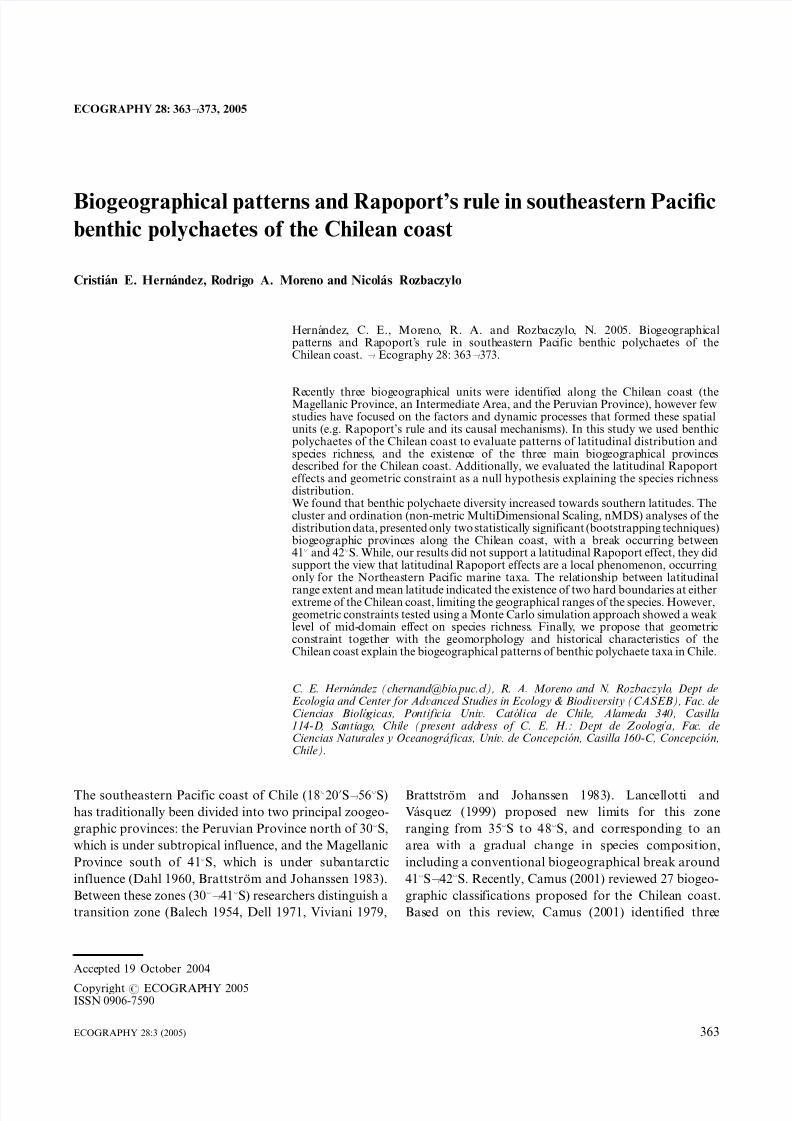
Of the 467 species analyzed in this study, 180 (38.5% of
total species) presented recorded within only 18 of
latitude, of which 24 were distributed in the Peruvian
Province (PP), 50 in the Intermediate Area (IA) and 106
in the Magellanic Province (MP) (Fig. 1A). On the other
hand, 157 species (33.6%) presented medium-small
ranges of distribution, with 7 species restricted to PP,
27 in IA, and 73 in MP (Fig. 1B). The rest of the specieswith medium- small ranges (n/50, 31.8%) was shared
between two or three provinces (Fig. 1B). The species
group with medium-large ranges included 97 species
(20.7%) (Fig. 1C), of which 15 species were restricted to
the MP (15.5%), a large proportion overlapped between
the PP and the IA (60.8%), and a lesser number were
shared with the MP (23.7%). The most widely distrib-
uted species group included 33 species (7%) extending
over all three provinces (Fig. 1D).
The latitudinal pattern of diversity shows two zones
with a greater number of species along the Chilean
coast (Fig. 2): 1) the latitudinal band corresponding to398 /418S (215 species, 12.1%), and 2) the area between
518 and 538S (187 species, 10%). On the other hand, the
zones with least species richness occurred at the geo-
graphic extremes of the Chilean coast. In the northern
extreme the lowest richness was found in the first
three latitudinal bands (18820?S /208S, n/82 species,
4.6%; 218 /238S, n/94 species, 5.3%; 248 /268S, n/96
species, 5.4%), and in the southern extreme the lowest
richness occurred in the most southern latitudinal band
(548 /568S, n/107 species, 6%) (Fig. 2). The relationship
between the lower latitudinal limit of 38 bands of latitude
versus species richness indicated that species richness
increased towards southern latitudes, however this
relationship was marginally non-significant (p/0.0567,
R2/0.214) (Fig. 2).
Evaluation of the biogeographical provinces
Cluster analysis of benthic polychaete distributions
indicated only two statistically significant biogeographic
units (bootstrap analysis: 95th percentile/28.4%
similarity) (Fig. 3), of the three biogeographical units
proposed by Camus (2001). The first unit includes
the latitudinal bands between 188 and 418S, coincidingthe biogeographic units described by Camus (2001) as
the PP and the IA. The second unit includes the
latitudinal bands between 428 and 568S, coinciding
with the MP described by Camus (2001). The nMDS
ordination analysis supported the existence of these two
major biogeographic units along the Chilean coast
(stress/0.004) (Fig. 4).
Rapoport’s rule: latitudinal range extent vs range
midpoint relationships
The simple regression analysis of the relationship
between latitudinal range extent and range midpoint
showed a significant negative slope (pB/0.0001) and a
low R2 value (R2/0.07, Fig. 5). A second degree
polynomial model showed the maximum latitudinal
ranges at middle latitudes, with minimum range size at
extreme latitudes (pB/0.0001; R2
/0.17; Fig. 5). These
analyses do not support a latitudinal Rapoport’s effect.
On the other hand, the our assessment of geometric
shapes indicated that an asymmetric pyramid was the
most appropriate model to describe this data set (Fig. 5).
The observed dispersion (DI/287.42) was significantly
greater than the average dispersion of the simulated data
sets (mean of simulated DI/126.29, variance/1851.60;
number of times observed DI/simulated DI/49 345;
p/0.0131). The dispersion index demostrated that the
points were unusually concentrated in some corners of
the shape space. The observed number of points that fell
within the shape (n/
385) was significantly greater thanthe number found in most of the simulated data sets
(mean of simulated number of points/367.23,
variance/29.87; number of times observed number of
points/simulated number of points/49 9 68; p/
0.0006), indicating that the points are unusually clus-
tered within the shape. The observed number of points
that fell outside of the upper right boundary of the shape
(n/0) was significantly smaller than the number found
in most of the simulated data sets (mean of simulated
number of points/54.40, variance/25.17; number of
times observed number of pointsB/simulated number
of points/50 000; pB/0.0001), indicating that the points
were unusually sparse beyond this boundary. The
observed number of points that fell outside of the
upper left boundary of the shape (n/67) was signifi-
cantly greater than the number found in most of the
simulated data sets (mean of simulated number of
points/27.93, variance/15.80; number of times ob-
served number of points/simulated number of points/
50 000; pB/0.0001), indicating that the points were
usually sparse beyond the boundary. The points that
fell beyond the upper left boundary showed a deviation
of the points from the boundary, or observed sum of
squares (SS/568.15) significantly smaller than the sum
of squares found in most of the simulated data sets(mean of simulated SS/3362.35, variance/1 084725.0;
366 ECOGRAPHY 28:3 (2005)

8/12/2019 Hernández Et Al (2005)
http://slidepdf.com/reader/full/hernandez-et-al-2005 5/11
Figure 1. (Continued )
ECOGRAPHY 28:3 (2005) 367
8/12/2019 Hernández Et Al (2005)
http://slidepdf.com/reader/full/hernandez-et-al-2005 6/11
number of times observed SSB/simulated SS/49 999;
p/0.0001), indicating that the sum of squares was
unusually low, and that the points that fell beyond the
upper left boundary were clustered near to the boundary.
Geometric constraint and species richness
The species-richness curves of each 38 band of latitudeshowed a weak mid-domain effect (Fig. 2). A compar-
ison of the empirical data with the prediction curves
from the 95% simulation without replacement
(i.e. randomization procedures) showed that 39% of
empirical diversity points (5 of 13 points) occurred
within the predicted range of the analytical /stochastic
null model (Fig. 2). These points include one northern
band of latitude (218 /238S), one central band of
latitude (368 /388S), and three southern bands of latitude
(428 /508S). A comparison of the empirical data with theprediction curves from the 95% simulation with replace-
Fig. 1. The latitudinal extent of benthic polychaete species foundalong the Chilean coast. (A) 180species recorded within only 18 of latitude; (B) 157 species withmedium-small ranges of distribu-tion from 28 to 148; (C) 97 species
with medium-large distributionsranging from 158 to 268; and (D)33 species with large distributionsranging from 278 to 378.Each vertical bar represents thedistribution of a single species.The horizontal gray lines showthe limits of the three majorbiogeografical units described byCamus (2001): Peruvian Province(PP), Intermediate Area (IA), andMagellanic Province (MP).
368 ECOGRAPHY 28:3 (2005)

8/12/2019 Hernández Et Al (2005)
http://slidepdf.com/reader/full/hernandez-et-al-2005 7/11
ment (i.e. bootstrap method) showed that 46% of
empirical diversity points (6 of 13 points) occurred
within the predicted range of the analytical /stochastic
null model (Fig. 2). This analysis included the same
points as the prior analysis, but with one additional
central band of latitude (338 /358S). The two maximum
points of species richness (398 /418S and 518 /538S) were
in disagreement with the mid-domain peak in species
richness.
Discussion
Patterns of latitudinal distribution
The analysis of distribution patterns of benthic poly-
chaetes showed a progressive increase in diversity (alpha)
from low latitudes towards more southern latitudes
along the Chilean coast (Fig. 2). This pattern is in
accordance with patterns of mollusk diversity in the
southern Pacific (Valdovinos et al. 2003), as well as with
the proposed pattern for polychaetes on the Chilean
coast described by Lancellotti and Vasquez (2000).
Nevertheless, of the four zones of maximum diversity
registered by Lancellotti and Vasquez (2000) only that
located in the zone of the Chiloe Archipelago corre-
sponds to one of the two bands of maximum diversity
registered in our analysis (i.e. 398 /418S). In this band of
maximum diversity the final points of distribution of
various benthic polychaete species from the north and
the south converge (Fig. 1B and C), whatsmore there are
also various species with single records (n/21, Fig. 1A).This situation suggests the existence of an ecotone
located at the Chiloe Archipelago, likely due to the great
divergence of the oceanic current system around 418S
(corresponding to the Subtropical Convergence), which
provokes a spatial differentiation of great magnitude
along the coast (Castilla et al. 1993, Ahumada et al.
2000, Camus 2001). Around 418S the West Wind Drift
Current divides before reaching the coast, splitting into
the north flowing Humboldt Current and the south
flowing Cape Horn Current, from which the Fjord
Current arises. This ecotonal boarder (i.e. the Chiloe
Archipelago) between two coastal zones, could limit the
patterns of distribution of various benthic polychaete
taxa (Fig. 1B and C), which are not able extend their
ranges of distribution due to tolerance limits to environ-
mental variations (Camus 2001). This pattern has been
reported for Porifera Demospongiae, Decapod Crusta-
ceans, Bryozoans and Echinoderms (see Moyano 1991
and references therein). The zone south of 418S has
historically experienced the combined effects of climaticprocesses, tectonic activity and glaciers, provoking the
formation of a great system of archipelagos with an
abundance of golfs, fjords, and canals (Camus 2001).
This has been associated with changes in local conditions
(i.e. substrate types, tidal amplitude, temperature, and
salinity) (Santelices and Meneses 2000), which would
generate a highly diversified mosaic of different biotopes
(Mariani et al. 1996), which would act as refuges during
repeated glacial advances over the last 40 million years
(Crame 1997). The sum of these factors would favor
local radiation of the taxa, leading to the current area of
high taxonomic diversity between 418 and 568S(140 species with restricted distribution south of 418S,
Fig. 2. Total number of benthic polychaete species found alongthe Chilean coast at each 38 band of latitude (black lines withdata points). The dotted black line shows the standard linearregression fit to the data. The p-value is the result of randomization analysis (50000 random matrices, random
number seed/12 345) to test the null hypothesis that the slopeequals 0. The gray lines show the 95% prediction curvessampled without replacement (solid gray lines) and withreplacement (dotted gray lines) using the program ‘‘Mid-Domain Null’’ (50 000 simulations).
Fig. 3. Latitudinal similarity phenogram based on the presenceor absence of benthic polychaete species found in 38 latitudinalsections along the Chilean coast. The dotted line indicates the
level of similarity between pairs of latitudinal sections for whichsignificant biogeographic units could be recognized in thephenograms after the application of a bootstrapping procedure.The different line tones in the phenogram indicate the threemajor biogeografical units described by Camus (2001): Magel-lanic Province (black lines), Intermediate Area (dark gray lines),and Peruvian Province (bright gray lines).
ECOGRAPHY 28:3 (2005) 369

8/12/2019 Hernández Et Al (2005)
http://slidepdf.com/reader/full/hernandez-et-al-2005 8/11
Fig. 1 and 2), first affecting the presence of the second
zone of maximum diversity, reported in our study for the
subantarctic latitudinal band between 518 and 538S, and
secondarily causing a low faunistic affinity with the
benthic polychaete taxa of the Antarctic Peninsula
(Canete et al. 1999).
In the northern zone, the bands of lowest diversity
(188 /268S) are characterized as being strongly influ-
enced by the large-scale of low frequency spatial
disturbances called El Nino/Southern Oscillation
(ENSO), a phenomenon which provokes a series of alterations in the structure of the current system, and
thus the coastal biota of the region, with regional scale
influences up to 308 /368S (Camus 1990, Gutierrez et al.
2000). Since the appearance of ENSO ca 5000 yr ago
(Rollins et al. 1986), the Southeastern Pacific biota has
experienced a continuing disturbing influence, now
ENSO is a critical component of the regional dynamic,
which has played an important role in defining the
current biogeography of the area (Fernandez et al. 2000).
According to Camus (1990), the characteristics of ENSO
likely submitted local populations to frequent bottle-
necks, and non-selective extinctions, which could gen-erate high interpopulational variability and even provoke
founder effects. These population level processes, to-
gether with ENSO should have produced increases in
local diversity, however, our results did not support this
hypothesis, although they did support the ENSO hy-
pothesis as a cause of extinctions and low diversity in the
zone. The low diversity of benthic polychaetes observed
in the northern zone can probably also be attributed to a
low speciation rate, due to the low differentiation of
niches (i.e. low diversity of microhabitats) observed in
this zone with respect to the zone south of 418S, which
would function as a biological mechanism determininglocal scale diversity (Shmida and Wilson 1985).
Evaluation of the biogeographical provinces
The results of the degree of faunistic similarity analyses
between 38 latitudinal bands suggests the existence of
two biogeographical units along the Chilean coast, the
first occurring between 188 and 418S, and the second
between 428 and 568S. These biogeographical units are in
agreement with those previously described at the level of
biogeographic provinces (i.e. the warm temperate zoneand a cold temperate zone), based on the patterns of
distribution of various benthic marine invertebrate taxa
(see Dall 1909, Ekman 1953, Fernandez et al. 2000).
Nevertheless, our results do not concur with studies that
recognize an extensive transition zone between both
biogeographical units (Dahl 1960, Knox 1960, Bratt-
strom and Johanssen 1983, Thiel 2002) or an extensive
(but not transitional) Intermediate Area, which includes
mixed components of biota lacking a defined character
and biogeographic range (Camus 2001). With respect to
the polychaete fauna of the Chilean coast, the only
previous extensive biogeographic study (Lancellotti andVasquez 2000) also recognizes only two faunistic units,
although, these units did not coincide with those
proposed in our study. This discrepancy is probably
due to the fact that in the study by Lancelloti and
Vasquez (2000) the authors analyzed fewer species
(n/403), fewer latitudinal bands (n/10), and did not
use robust statistical analyses to determine the faunistic
units (e.g. bootstrapping and nMDS analysis). In this
sense, our results provide the first evaluation of the
biogeographic limits of benthic polychaetes on the
southeastern Pacific coast using robust statistical tests,
and the second study where two statistically significantbiogeographical units are recognized with a limit at the
Fig. 5. Relationship between latitudinal range extent and rangemidpoint. The straight gray line shows the simple regressionanalysis, and the curved gray line shows the second degreepolynomial model. The two dotted lines show the geometricshapes (pyramid) that best explained the data point distribution
between both axes. Results of the linear regression fit are shownin the upper lefthand box and results from the second degreepolynomial fit are shown in the upper righthand box.
Fig. 4. The ordination analysis (nMDS) and Kruskal stressvalue for the nMDS configuration based on the presence orabsence of benthic polychaete species found in 38 latitudinalsections along the Chilean coast.
370 ECOGRAPHY 28:3 (2005)
8/12/2019 Hernández Et Al (2005)
http://slidepdf.com/reader/full/hernandez-et-al-2005 9/11
zone of Chiloe (408 /418S; see the study conducted by
Ojeda et al. (2000) for littoral fish).
Finally, the general biogeographical model proposed
by Camus (2001) for the Chilean coast at the level of
biota (i.e. flora and fauna), only coincides with the
latitudinal distribution of benthic polychaetes in the MP,
in our study. The other two biogeographical units
proposed in the model by this author do not agree
with the results from our analysis of benthic polychaete
taxa, which indicate that the PP and the IA constitute a
single biogeographic unit (Figs 3 and 4). Nevertheless, it
should be considered that the hypothesis proposed by
Camus (2001) includes a review of distinct methodolo-
gical focuses (the majority of which are qualitative),
distinct types and quantities of data used, and distinct
selection criteria of the study units, which potentially
limit the recognition of general biogeographic patterns.
Rapoport’s rule and geometric constraint
Our results do not support a latitudinal Rapoport effect
in the southeastern Pacific benthic polychaetes of the
Chilean coast, as previously suggested for IndoPacific
and Atlantic taxa (Rohde et al. 1993, Rohde and Heap
1996, Santelices and Marquet 1998, but see Macpherson
and Duarte 1994). However, our data do support the
view that latitudinal Rapoport effects are a local
phenomenon (see Rohde 1996, 1999, Gaston and Chown
1999), occurring only for Northeastern Pacific marinetaxa (Stevens 1996, Smith and Brown 2002, Smith and
Gaines 2003). This means that southeastern Pacific
benthic polychaetes may not experience marked seasonal
environmental variation which Stevens (1989, 1992,
1996) suggested as a causal mechanism of Rapoport’s
rule. Specifically, for polychaete taxa found in the
southeastern Pacific, the relationship of latitudinal range
extent versus mean latitude can be explained by the
geomorphology and historical characteristics of the
Chilean coast (see discussion above in Patterns of
latitudinal distribution, and Evaluation of the biogeo-
graphical provinces). However, since the polychaete
species along the Chilean coast that occur in the lowest
and highest mean latitudes tend not to have large
geographic range extensions, and only species in middle
latitudes have large geographic range extensions (Fig. 5),
an alternative and complementary explanation for the
observed pattern is the random placement of species’
geographical ranges along a geographical gradient, like
the mid-domain effect. This explanation is also sup-
ported by the idea that in the absence of environmental
gradients, species’ distributions may form patterns that
depend on the geometric constraints of species’ spatial
distributions (Colwell and Hurtt 1994, Colwell and Lees
2000, Grytnes 2003). Nevertheless, our results onlyshowed a weak level of mid-domain effect on species
richness (Fig. 2), where the relationship between latitu-
dinal range extent and mean latitude indicates the
existence of two hard boundaries at both extremes of
the Chilean coast, limiting the geographical ranges of the
species (Fig. 5). In the northern latitudes (188S) this
boundary is the result of the intense influence of the cold
water of the Humboldt Current and the appearance of
the warm water of the Peru Current. At southern
latitudes (568S) the boundary is formed by the end of
the Cape Horn Current and the edge of continental
shelf. Finally, we propose that geometric constraint
together with the geomorphology and historical char-
acteristics of the Chilean coast explain the biogeogra-
phical patterns of benthic polychaete taxa in Chile.
Acknowledgements / The authors are very grateful to PaulaE. Neill for comments and suggestions that greatly improved themanuscript. This study was partially funded by grants awardedby IDEA WILD and FONDAP-FONDECYT 1501-0001
Programs 4 and 5 to the Center for Advanced Studies inEcology and Biodiversity. C. E. Hernandez was supported by aCONICYT Doctoral Fellowships.
References
Ahumada, R. B., Pinto, L. A. and Camus, P. A. 2000. TheChilean coast. / In: Sheppard, C. R. C. (ed.), Seas at theMillennium: an environmental evaluation. Pergamon Press,pp. 699 /717.
Balech, E. 1954. Division zoogeografica del litoral Sudamer-icano. / Rev. Biol. Mar. 4: 184 /195.
Bokma, F., Bokma, J. and Monkkonen, M. 2001. Random
processes and geographic species richness patterns: why sofew species in the north? / Ecography 24: 43 /49.
Brattstrom, H. and Johanssen, A. 1983. Ecological and regionalzoogeography of marine benthic fauna of Chile. / Sarsia 68:289 /339.
Camus, P. A. 1990. Procesos regionales y fitogeografıa en elPacıfico suroriental: el efecto de ‘‘El Nino-Oscilacion delSur’’. / Rev. Chil. Hist. Nat. 63: 11 /17.
Camus, P. A. 2001. Biogeografıa marina de Chile continental. / Rev. Chil. Hist. Nat. 74: 587 /617.
Canete, J. I., Leighton, G. L. and Aguilera, F. F. 1999.Polychaetes from Aysen Fjord, Chile: distribution, abun-dance and biogeographical comparison with the shallowsoft-bottom polychaete fauna from Antarctic and theMagellan Province. / Sci. Mar. 63: 243 /252.
Carrasco, F. D. and Palma, M. 2000. Two new species of Pettiboneia and Protodorvillea (Dorvilleidae, Polychaeta)from northern Chile. / Bull. Mar. Sci. 67: 597 /602.
Carrasco, F. D. and Palma, M. 2003. Two new species of polychaetes from the sublittoral bottom of Antofagasta,northern Chile: Clymenella fauchaldi n. sp (Maldanidae)and Mooreonuphis colosensis n. sp (Onuphidae). / Hydro-biologia 496: 35 /39.
Castilla, J. C., Navarrete, S. A. and Lubchenco, J. 1993.Southeastern Pacific coastal environments: main futures,large-scale perturbations, and global climate change. / In:Mooney, H. A., Fuentes, E. R. and Kronberg, B. I. (eds),Earth system responses to global change. Contrast betweenNorth and South America. Academic Press, pp. 167 /188.
Clarke, K. R. 1993. Non-parametric multivariate analyses of changes in community structure. / Aust. J. Ecol. 18: 117 /143.
Colwell, R. K. 1999. RangeModel: a Monte Carlo simulationtool for assessing geometric constraints on species
ECOGRAPHY 28:3 (2005) 371

8/12/2019 Hernández Et Al (2005)
http://slidepdf.com/reader/full/hernandez-et-al-2005 10/11
richness, ver. 2. / User’s guide and application published atB/http:/www.viceroy.eeb.uconn.edu/RangeModel/.
Colwell, R. K. and Hurtt, G. C. 1994. Nonbiological gradientsin species richness and a spurious Rapoport effect. / Am.Nat. 144: 570 /595.
Colwell, R. K. and Lees, D. C. 2000. The mid-domain effect:geometric constraints on the geography of species richness.
/ Trends Ecol. Evol. 15: 70
/76.Crame, J. A. 1997. An evolutionary framework for the polarregions. / J. Biogeogr. 24: 1 /9.
Dahl, E. 1960. The cold temperate zone in Chilean seas. / Proc.R. Soc. Lond. B 152: 631 /633.
Dall, W. H. 1909. Report on a collection of shells from Peruwith a summary of the littoral marine Mollusca of thePeruvian zoological province. / Proc. U.S. Nat. Mus. 37:147 /294.
Dell, R. K. 1971. The marine mollusca of the Royal SocietyExpedition to southern Chile, 1958 /1959. / Rec. Dom.Mus. 7: 155 /233.
Ekman, S. 1953. Zoogeography of the sea. / Sidgwick andJackson.
Fernandez, M. et al. 2000. Diversity, dynamics and biogeogra-phy of Chilean benthic nearshore ecosystems: an overview
and guidelines for conservation. / Rev. Chil. Hist. Nat. 73:797 /830.
Field, J., Clarke, K. and Warwick, R. 1982. A practical strategyfor analysing multispecies distribution patterns. / Mar.Ecol. Progr. Ser. 8: 37 /52.
Gambi, M. C. and Mariani, S. 1999. Polychaetes of the softbottoms of the Straits of Magellan collected during theItalian oceanographic cruise in February-March 1991. / Sci.Mar. 63: 233 /242.
Gaston, K. J. and Chown, S. L. 1999. Why Rapoport‘s rule doesnot generalise. / Oikos 84: 309 /311.
Gotelli, N. J. and Entsminger, G. L. 2004. EcoSim: Null modelssoftware for ecology. Version 7. / Acquired Intelligence &Kesey-Bear, Burlington, VT 05465, B/http://homepages.together.net//gentsmin/ecosim.htm/.
Grytnes, J. A. 2003. Ecological interpretations of the mid-domain effect. / Ecol. Lett. 6: 883 /888.Grytnes, J. A. and Vetaas, O. R. 2002. Species richness and
altitude: a comparison between null models and interpolatedspecies richness along the Himalayan altitudinal gradient,Nepal. / Am. Nat. 159: 294 /304.
Gutierrez, D. et al. 2000. Effects of dissolved oxygen andfresh organic matter on the bioturbation potential of macrofauna in sublittoral sediments off central Chileduring the 1997/1998 El Nino. / Mar. Ecol. Progr. Ser.202: 81 /99.
Hernandez, C. E., Munoz, G. and Rozbaczylo, N. 2001.Poliquetos asociados con Austromegabalanus psittacus (Mo-lina, 1782) (Crustacea: Cirripedia) en Penınsula Gualpen,Chile central: Biodiversidad y efecto del tamano del sustratobiologico. / Rev. Biol. Mar. Oceanogr. 36: 99 /108.
Jetz, W. and Rahbek, C. 2001. A two-dimensional geometricconstraints model explains much of the species richnesspattern in African birds. / Proc. Nat. Acad. Sci. USA 98:5661 /5666.
Jetz, W. and Rahbek, C. 2002. Geographic range size anddeterminants of avian species richness. / Science 297: 1548 /1551.
Knox, G. A. 1960. Littoral ecology and biogeography of thesouthern oceans. / Proc. R. Soc. Lond. B 152: 577 /624.
Lancellotti, D. and Vasquez, J. A. 1999. Biogeographicalpatterns of benthic macroinvertebrates in the southernPacific littoral. / J. Biogeogr. 26: 1001 /1006.
Lancellotti, D. and Vasquez, J. A. 2000. Zoogeografıa demacroinvertebrados bentonicos de la costa de Chile: con-tribucion para la conservacion marina. / Rev. Chil. Hist.Nat. 73: 99 /129.
Lees, D. C., Kremen, C. and Andriamampianina, L. 1999. Nullmodel for species richness gradients: bounded range overlap
of butterflies and other rainforest endemics in Madagascar. / Biol. J. Linn. Soc. 67: 529 /584.
Macpherson, E. and Duarte, C. M. 1994. Patterns in speciesrichness, size, and latitudinal range of east Atlantic fishes. / Ecography 17: 242 /248.
Manly, B. F. J. 1997. Randomization, Bootstrap and MonteCarlo methods in Biology. / Chapman and Hall.
Mariani, S. et al. 1996. Benthic populations of the soft bottomsin the Strait of Magellan (Southern America): biodiversity,distribution and biogeography of polychaetes and crusta-cean isopods. / Biol. Mar. Medit. 3: 155 /158.
McCain, C. 2003. North American desert rodents: a test of themid-domain effect in species richness. / J. Mammal. 84:967 /980.
McCain, C. 2004. The mid-domain effect applied to elevationalgradients: species richness of small mammals in Costa Rica. / J. Biogeogr. 31: 19 /31.
Moreno, R. A. et al. 2002. Nuevos poliquetos de la familiaSpionidae Grube, 1850 (Polychaeta: Spionidae) para el nortede Chile. / Not. Mens. Mus. Nac. Hist. Nat. Chile 350: 9 /11.
Moyano, H. I. 1991. Bryozoa marinos chilenos VIII: unasintesis zoogeografica con consideraciones sistematicas y la
descripcion de diez especies y dos generos nuevos. / GayanaZool. 55: 305 /389.
Ojeda, F. P., Labra, F. A. and Munoz, A. A. 2000. Biogeo-graphic patterns of Chilean littoral fishes. / Rev. Chil. Hist.Nat. 73: 625 /641.
Pineda, J. 1993. Boundary effects on the vertical ranges of deep-sea benthic species. / Deep-Sea Res. I 40: 2179 /2192.
Rohde, K. 1996. Rapoport?s rule is a local phenomenon andcannot explain latitudinal gradients in species diversity. / Biodiv. Lett. 3: 10 /13.
Rohde, K. 1999. Latitudinal gradients in species diversity andRapoport’s rule revisited: a review of recent work, and whatcan parasites teach us about the causes of the gradients? / Ecography 22: 593 /613.
Rohde, K. and Heap, M. 1996. Latitudinal ranges of teleost fishin the Atlantic and Indo-Pacific Oceans. / Am. Nat. 147:
659 /665.Rohde, K., Heap, M. and Heap, D. 1993. Rapoport’s rule does
not apply to marine teleost and cannot explain latitudinalgradients in species richness. / Am. Nat. 142: 1 /16.
Rollins, H. B., Richardson, J. B. and Sandweiss, D. H. 1986. Thebirth of El Nino: geoarchaeological evidence. / Geoarch-aeology 1: 3 /15.
Rozbaczylo, N. 1985. Los anelidos poliquetos de Chile. Indicesinonımico y distribucion geografica de especies. / Ser.Monogr. Biol. 3: 1 /284.
Rozbaczylo, N. and Quiroga, E. 2000. Family Pilargidae(Polychaeta): new distributional ranges and a new recordfor the chilean coast. / Rev. Chil. Hist. Nat. 73: 643 /651.
Santelices, B. and Marquet, P. A. 1998. Seaweeds, latitudinaldiversity patterns, and Rapoport’s rule. / Div. Distrib. 4:71 /75.
Santelices, B. and Meneses, I. 2000. A reassessment of thephytogeographic characterization of Temperate PacificSouth America. / Rev. Chil. Hist. Nat. 73: 605 /614.
Shmida, A. and Wilson, M. V. 1985. Biological determinants of species diversity. / J. Biogeogr. 12: 1 /20.
Smith, K. F. and Brown, J. H. 2002. Patterns of diversity, depthrange, and body size among pelagic fishes along a gradientof depth. / Global Ecol. Biogeogr. 11: 313 /322.
Smith, K. F. and Gaines, S. D. 2003. Rapoport’s bathy-metric rule and the latitudinal species diversity gradientfor northeast Pacific fishes and northwest Atlantic gastro-pods: evidence against a causal link. / J. Biogeogr. 30:1153 /1159.
Sokal, R. and Rohlf, J. 1995. The principles and practice of statistics in biological research. / W. H. Freeman.
Stevens, G. C. 1989. The latitudinal gradient in geographicalrange: how so many species coexist in the tropics. / Am.Nat. 133: 240 /256.
372 ECOGRAPHY 28:3 (2005)
8/12/2019 Hernández Et Al (2005)
http://slidepdf.com/reader/full/hernandez-et-al-2005 11/11
Stevens, G. C. 1992. The elevational gradient in altitudinalrange: an extension of Rapoport’s latitudinal rule toaltitude. / Am. Nat. 140: 893 /911.
Stevens, G. C. 1996. Extending Rapoport’s rule to the Pacificmarine fishes. / J. Biogeogr. 23: 149 /154.
Thiel, M. 2002. The zoogeography of algae-associated peracar-ids along the Pacific coast of Chile. / J. Biogeogr. 29: 999 /
1008.Valdovinos, C., Navarrete, S. A. and Marquet, P. A. 2003.Mollusk species diversity in the southeastern Pacific: why
are there more species towards the pole? / Ecography 26:139 /144.
Viviani, C. A. 1979. Ecogeografıa del litoral chileno. / Stud.Neotrop. Fauna Environ. 14: 65 /123.
Willig, D. and Lyons, D. M. 1998. An analytical model of latitudinal gradients of species richness with an empiricaltest for marsupials and bats in the New World. / Oikos 81:
93 /98.
Subject Editor: John Spence.
ECOGRAPHY 28:3 (2005) 373