Embed Size (px)
Citation preview
NNoorrtthheerrnn GGuullff IInnssttiittuuttee CCooooppeerraattiivvee IInnssttiittuuttee PPrrooggrreessss RReeppoorrtt
NNOOAAAA AAwwaarrdd##:: NNAA0066OOAARR44332200226644 RReeppoorrttiinngg PPeerriioodd:: JJuullyy 11,, 22001100 tthhrroouugghh JJuunnee 3300,, 22001111
Photo: USM researchers conducting NGI research near site of MC 252, summer 2010; credit D. J. Joung
TABLE OF CONTENTS
EXECUTIVE SUMMARY .............................................................................................................................. 5
Northern Gulf Institute Progress from July 1, 2010 to June 30, 2011 ....................................................... 5
PART 1 – Program Overview ........................................................................................................................ 8
Introduction ................................................................................................................................................ 8
General Description of the Northern Gulf Institute .................................................................................... 8
NGI Direction, Organization and Operations ............................................................................................. 9
Organization and Operations .................................................................................................................. 10
NGI Fellows ............................................................................................................................................. 12
NGI Executive Council ............................................................................................................................. 12
NGI Advisory Council .............................................................................................................................. 13
NGI Research Focus Areas..................................................................................................................... 14
Research Highlights ................................................................................................................................ 16
Distribution of Funding Support to NGI from NOAA ................................................................................ 19
PART 2 – Performance of Projects ............................................................................................................. 22
List of NGI Projects by NOAA Award Amendment Number .................................................................... 22
Amendment Number 12
NGI File # 08-NGI-MOD-12 ..................................................................................................................... 24
Amendment Number 14, Year 1-3 Workplan
NGI File # 06-LSU-01 .............................................................................................................................. 26
NGI File # 06-LSU-02 .............................................................................................................................. 29
NGI File # 06-LSU-03 .............................................................................................................................. 37
NGI File # 06-LSU-04 .............................................................................................................................. 40
NGI File # 06-MSU-01 ............................................................................................................................. 54
NGI File # 06-MSU-07 ............................................................................................................................. 60
NGI File # 06-USM-01 ............................................................................................................................. 61
NGI File # 06-USM-03 ............................................................................................................................. 64
NGI File # 06-USM-05 ............................................................................................................................. 69
NGI File # 06-USM-06 ............................................................................................................................. 77
Amendments 19-29
NGI File # 09-NGI-MOD-19 ..................................................................................................................... 79
NGI File # 09-NGI-MOD-22/10-NGI-MOD-34 ......................................................................................... 84
NGI File # 09-NGI-MOD-23 ..................................................................................................................... 87
NGI File # 09-NGI-MOD-24 ..................................................................................................................... 88
NGI File # 09-NGI-MOD-26 ..................................................................................................................... 90
NGI File # 09-NGI-MOD-28 ..................................................................................................................... 92
NGI File # 09-NGI-MOD-29 ..................................................................................................................... 93
Amendments 32 and 36, Year 4-5 Workplan
NGI File # 09-NGI-01 ............................................................................................................................... 95
NGI File # 09-NGI-02 ............................................................................................................................. 106
NGI File # 09-NGI-03 ............................................................................................................................. 109
NGI File # 09-NGI-04 ............................................................................................................................. 111
NGI File # 09-NGI-05 ............................................................................................................................. 113
NGI File # 09-NGI-06 ............................................................................................................................. 118
NGI File # 09-NGI-07 ............................................................................................................................. 120
NGI File # 09-NGI-08 ............................................................................................................................. 123
NGI File # 09-NGI-09 ............................................................................................................................. 128
NGI File # 09-NGI-10 ............................................................................................................................. 131
NGI File # 09-NGI-11 ............................................................................................................................. 133
NGI File # 09-NGI-13 ............................................................................................................................. 139
NGI File # 09-NGI-14 ............................................................................................................................. 143
NGI File # 09-NGI-15 ............................................................................................................................. 145
NGI File # 09-NGI-17 ............................................................................................................................. 147
NGI File # 09-NGI-18 ............................................................................................................................. 152
NGI File # 09-NGI-19 ............................................................................................................................. 155
Amendments 35-51
NGI File # 10-NGI-MOD-35 ................................................................................................................... 161
NGI File # 10-NGI-MOD-37 ................................................................................................................... 162
NGI File # 10-NGI-MOD-38 ................................................................................................................... 163
NGI File # 10-NGI-MOD-39 ................................................................................................................... 164
NGI File # 10-NGI-MOD-40 ................................................................................................................... 166
NGI File # 10-NGI-MOD-41 ................................................................................................................... 168
NGI File # 09-NGI-MOD-42 ................................................................................................................... 170
NGI File # 10-NGI-MOD-43 ................................................................................................................... 172
NGI File # 10-NGI-MOD-44 ................................................................................................................... 174
NGI File # 10-NGI-MOD-45 ................................................................................................................... 178
NGI File # 10-NGI-MOD-46 ................................................................................................................... 182
NGI File # 10-NGI-MOD-47 ................................................................................................................... 183
NGI File # 10-NGI-MOD-48 ................................................................................................................... 185
NGI File # 10-NGI-MOD-49 ................................................................................................................... 187
NGI File # 10-NGI-MOD-50 ................................................................................................................... 188
NGI File # 10-NGI-MOD-51 ................................................................................................................... 189
APPENDIX 1. Publication Documentation ................................................................................................ 190
APPENDIX 2. Employee Support ............................................................................................................. 194
EXECUTIVE SUMMARY
Northern Gulf Institute Progress from July 1, 2010 to June 30, 2011 The Northern Gulf Institute (NGI) is a National Oceanic and Atmospheric Administration (NOAA) Cooperative Institute, a partnership of five complementary academic institutions and NOAA addressing important national strategic research and education goals. Mississippi State University leads this collaboration, partnering with the University of Southern Mississippi, Louisiana State University, Florida State University, Alabama’s Dauphin Island Sea Lab, and NOAA scientists at various laboratories and operational centers in the northern Gulf of Mexico region.
NGI was recognized by the NOAA Cooperative Institute Science Review Panel for its significant efforts to address important questions related to the NOAA Strategic Goals. NGI develops, operates, and maintains an increasingly integrated research and transition program, the results of which raise awareness and understanding of the Gulf region and fill priority gaps in and decision support for the region. NGI has been recognized as critical and well positioned to provide baseline, current, and future science and outreach needs to the region. The importance of NGI was underscored in the wake of the April 20, 2010 Deepwater Horizon Incident. NGI’s administrative structure, strategic location, and established relationships across its partner institutions facilitated rapid and coordinated response to priority needs as was demonstrated by expeditious coordination, leveraging the NOAA investment in NGI and the region.
The Institute contributes to NOAA’s priority interests in the four NGI research themes of Ecosystem Management, Geospatial Data Integration and Visualization in Environmental Science, Coastal Hazards and Resiliency, and Climate Change and Climate Variability Effects on Regional Ecosystems. Based on a recommendation by the Science Review Panel, the NGI leadership team developed an outcomes-based 10-Year Strategic Plan with input from its university, and NOAA partners (http://www.northerngulfinstitute.org/docs/NGI_Strategic_Plan_2011-2021.pdf). NGI’s goals, outcomes, and objectives align with and contribute to the success of the NOAA Next Generation Strategic Plan and with other national and regional agencies to include the Interagency Ocean Policy Task Force National Priority Objectives, the Gulf of Mexico Alliance Governors’ Action Plan II, the Sea Grant Gulf of Mexico Research Plan, the NOAA Gulf of Mexico Regional Collaboration Team Implementation Plan, and the Mississippi-Alabama Sea Grant Consortium Strategic Plan. Important recent research accomplishments focus on the issues and resources of the Gulf, but the tools and protocols are transferrable to other coastal environs. Listed below are several examples of these successes. Additional details are in the project descriptions in Part 2.
Research results indicate that the Barataria Bay estuary imports nitrogen and exports carbon to the coastal ocean. However, compared to the lower Mississippi River, the Barataria estuary appears to be a very small source of Total Organic Carbon for the northern Gulf of Mexico and is therefore unlikely to have a significant influence on the development of Gulf hypoxia. An interesting finding is that besides nutrients, wind appears to be an important controlling factor in productivity dynamics in Barataria Bay. Wind resuspends sediments that block light important for phytoplankton growth, but resuspension also liberates nutrients from sediment porewaters. Phytoplankton grow rapidly during daylight hours after calm evenings with ratios of gross productivity/respiration in the 1-3 range.
Phycotoxins, including Microcystis, have now been detected in water samples in Breton Sound estuary, as well as primary and secondary consumers (chironomids, clams, blue crab and catfish), in two estuaries and coastal Louisiana illustrating the need for continued monitoring and research to discover the
5
NGI Progress Report NOAA Award #: NA06OAR4320264
Reporting Period: Jul 1, 2010 - Jun 30, 2011
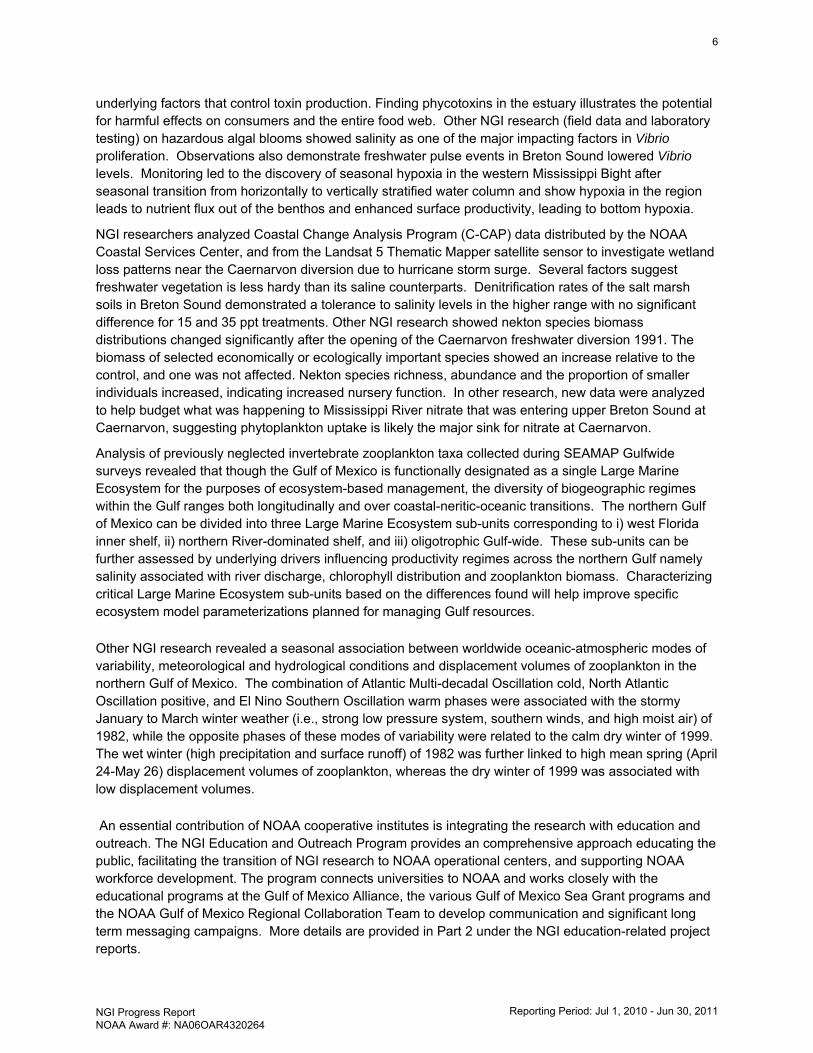
underlying factors that control toxin production. Finding phycotoxins in the estuary illustrates the potential for harmful effects on consumers and the entire food web. Other NGI research (field data and laboratory testing) on hazardous algal blooms showed salinity as one of the major impacting factors in Vibrio proliferation. Observations also demonstrate freshwater pulse events in Breton Sound lowered Vibrio levels. Monitoring led to the discovery of seasonal hypoxia in the western Mississippi Bight after seasonal transition from horizontally to vertically stratified water column and show hypoxia in the region leads to nutrient flux out of the benthos and enhanced surface productivity, leading to bottom hypoxia.
NGI researchers analyzed Coastal Change Analysis Program (C-CAP) data distributed by the NOAA Coastal Services Center, and from the Landsat 5 Thematic Mapper satellite sensor to investigate wetland loss patterns near the Caernarvon diversion due to hurricane storm surge. Several factors suggest freshwater vegetation is less hardy than its saline counterparts. Denitrification rates of the salt marsh soils in Breton Sound demonstrated a tolerance to salinity levels in the higher range with no significant difference for 15 and 35 ppt treatments. Other NGI research showed nekton species biomass distributions changed significantly after the opening of the Caernarvon freshwater diversion 1991. The biomass of selected economically or ecologically important species showed an increase relative to the control, and one was not affected. Nekton species richness, abundance and the proportion of smaller individuals increased, indicating increased nursery function. In other research, new data were analyzed to help budget what was happening to Mississippi River nitrate that was entering upper Breton Sound at Caernarvon, suggesting phytoplankton uptake is likely the major sink for nitrate at Caernarvon.
Analysis of previously neglected invertebrate zooplankton taxa collected during SEAMAP Gulfwide surveys revealed that though the Gulf of Mexico is functionally designated as a single Large Marine Ecosystem for the purposes of ecosystem-based management, the diversity of biogeographic regimes within the Gulf ranges both longitudinally and over coastal-neritic-oceanic transitions. The northern Gulf of Mexico can be divided into three Large Marine Ecosystem sub-units corresponding to i) west Florida inner shelf, ii) northern River-dominated shelf, and iii) oligotrophic Gulf-wide. These sub-units can be further assessed by underlying drivers influencing productivity regimes across the northern Gulf namely salinity associated with river discharge, chlorophyll distribution and zooplankton biomass. Characterizing critical Large Marine Ecosystem sub-units based on the differences found will help improve specific ecosystem model parameterizations planned for managing Gulf resources.
Other NGI research revealed a seasonal association between worldwide oceanic-atmospheric modes of variability, meteorological and hydrological conditions and displacement volumes of zooplankton in the northern Gulf of Mexico. The combination of Atlantic Multi-decadal Oscillation cold, North Atlantic Oscillation positive, and El Nino Southern Oscillation warm phases were associated with the stormy January to March winter weather (i.e., strong low pressure system, southern winds, and high moist air) of 1982, while the opposite phases of these modes of variability were related to the calm dry winter of 1999. The wet winter (high precipitation and surface runoff) of 1982 was further linked to high mean spring (April 24-May 26) displacement volumes of zooplankton, whereas the dry winter of 1999 was associated with low displacement volumes.
An essential contribution of NOAA cooperative institutes is integrating the research with education and outreach. The NGI Education and Outreach Program provides an comprehensive approach educating the public, facilitating the transition of NGI research to NOAA operational centers, and supporting NOAA workforce development. The program connects universities to NOAA and works closely with the educational programs at the Gulf of Mexico Alliance, the various Gulf of Mexico Sea Grant programs and the NOAA Gulf of Mexico Regional Collaboration Team to develop communication and significant long term messaging campaigns. More details are provided in Part 2 under the NGI education-related project reports.
6
NGI Progress Report NOAA Award #: NA06OAR4320264
Reporting Period: Jul 1, 2010 - Jun 30, 2011
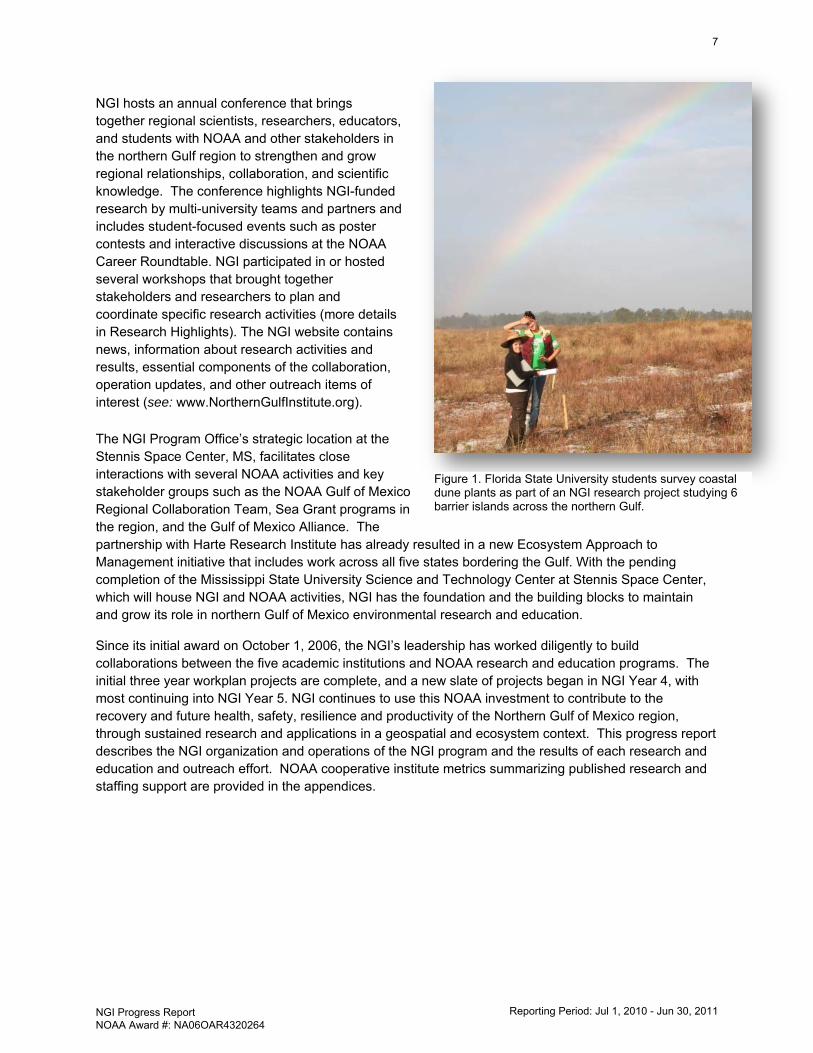
NGI hosts an annual conference that brings together regional scientists, researchers, educators, and students with NOAA and other stakeholders in the northern Gulf region to strengthen and grow regional relationships, collaboration, and scientific knowledge. The conference highlights NGI-funded research by multi-university teams and partners and includes student-focused events such as poster contests and interactive discussions at the NOAA Career Roundtable. NGI participated in or hosted several workshops that brought together stakeholders and researchers to plan and coordinate specific research activities (more details in Research Highlights). The NGI website contains news, information about research activities and results, essential components of the collaboration, operation updates, and other outreach items of interest (see: www.NorthernGulfInstitute.org).
The NGI Program Office’s strategic location at the Stennis Space Center, MS, facilitates close interactions with several NOAA activities and key stakeholder groups such as the NOAA Gulf of Mexico Regional Collaboration Team, Sea Grant programs in the region, and the Gulf of Mexico Alliance. The partnership with Harte Research Institute has already resulted in a new Ecosystem Approach to Management initiative that includes work across all five states bordering the Gulf. With the pending completion of the Mississippi State University Science and Technology Center at Stennis Space Center, which will house NGI and NOAA activities, NGI has the foundation and the building blocks to maintain and grow its role in northern Gulf of Mexico environmental research and education.
Since its initial award on October 1, 2006, the NGI’s leadership has worked diligently to build collaborations between the five academic institutions and NOAA research and education programs. The initial three year workplan projects are complete, and a new slate of projects began in NGI Year 4, with most continuing into NGI Year 5. NGI continues to use this NOAA investment to contribute to the recovery and future health, safety, resilience and productivity of the Northern Gulf of Mexico region, through sustained research and applications in a geospatial and ecosystem context. This progress report describes the NGI organization and operations of the NGI program and the results of each research and education and outreach effort. NOAA cooperative institute metrics summarizing published research and staffing support are provided in the appendices.
Figure 1. Florida State University students survey coastal dune plants as part of an NGI research project studying 6 barrier islands across the northern Gulf.
7
NGI Progress Report NOAA Award #: NA06OAR4320264
Reporting Period: Jul 1, 2010 - Jun 30, 2011
PART 1 – PROGRAM OVERVIEW
Introduction This NGI Annual Progress Report reviews and summarizes the research and the education and outreach goals accomplished during the reporting period of July 1, 2010 to June 30, 2011. The report consists of two (2) sections and appendices. Part 1 - Program Overview, provides the General Description of NGI, the NGI Direction, Organization and Operations, NGI Research Focus Areas and Highlights, and Distribution of funding to NGI from NOAA. Part 2 – Project Reports, begins with the list of all of the awards to the NGI with projects currently active. The Performance of Projects section details both base-funded projects and individually awarded projects. The reporting elements were outlined in a January 13, 2011 memo from NOAA OAR. Appendix A provides the total count of publications for this reporting period, and Appendix B summarizes the total number of employees and students supported by NOAA funding at NGI.
General Description of the Northern Gulf Institute The Northern Gulf Institute is a NOAA Cooperative Institute, a partnership of five complementary academic institutions and NOAA. The collaboration is led by Mississippi State University partnering with the University of Southern Mississippi, Louisiana State University, Florida State University, and the Dauphin Island Sea Lab in Alabama, and NOAA scientists at various laboratories and operational centers.
The Institute develops, operates, and maintains an increasingly integrated research and transition program, the results of which fill priority gaps or reduce limitations in current Northern Gulf of Mexico awareness, understanding and decision support—especially at the intersection of upland‐watershed systems and coastal waters, habitats, resources and hazards, integrating the interaction and impacts of people and communities. The NGI contributes to NOAA’s priority interest research themes in Ecosystem Management, Geospatial Data Integration and Visualization, Coastal Hazards, and Climate Effects on Regional Ecosystems.
The initial funding for the NGI was awarded on October 1, 2006. The Council of Fellows, consisting of the Senior Investigator from each of the member institutions, established an Executive Office at MSU in Starkville, Mississippi, and a Program Office at Stennis Space Center, Mississippi. Funding for the NOAA led research began in the spring of 2006 and research initiatives at the NGI partner institutions began in February 2007.
Significant efforts are being made to address important questions related to NOAA’s long-term goals of Climate Adaptation and Mitigation, Weather-Ready Nation, Healthy Oceans, and Resilient Coastal Communities and Economics. The original base funded activities were funded for NGI years 1 through 3, with a new slate of projects started in year 4 with most continuing into year 5. This progress report reflects the final reports for the last few initial projects completed, and progress to date on year 4-5 projects. In addition to the base funded research, many individually awarded activities are underway, and their progress is also reported herein.
The NGI Education and Outreach Program provides an integrated comprehensive approach to educate the public on NGI research and to facilitate the transition of NGI research to NOAA operational centers. The program connects universities to NOAA with career fair participation, EDAC and Diversity Internships, information outreach and student employment. NGI works closely with the educational
8
NGI Progress Report NOAA Award #: NA06OAR4320264
Reporting Period: Jul 1, 2010 - Jun 30, 2011
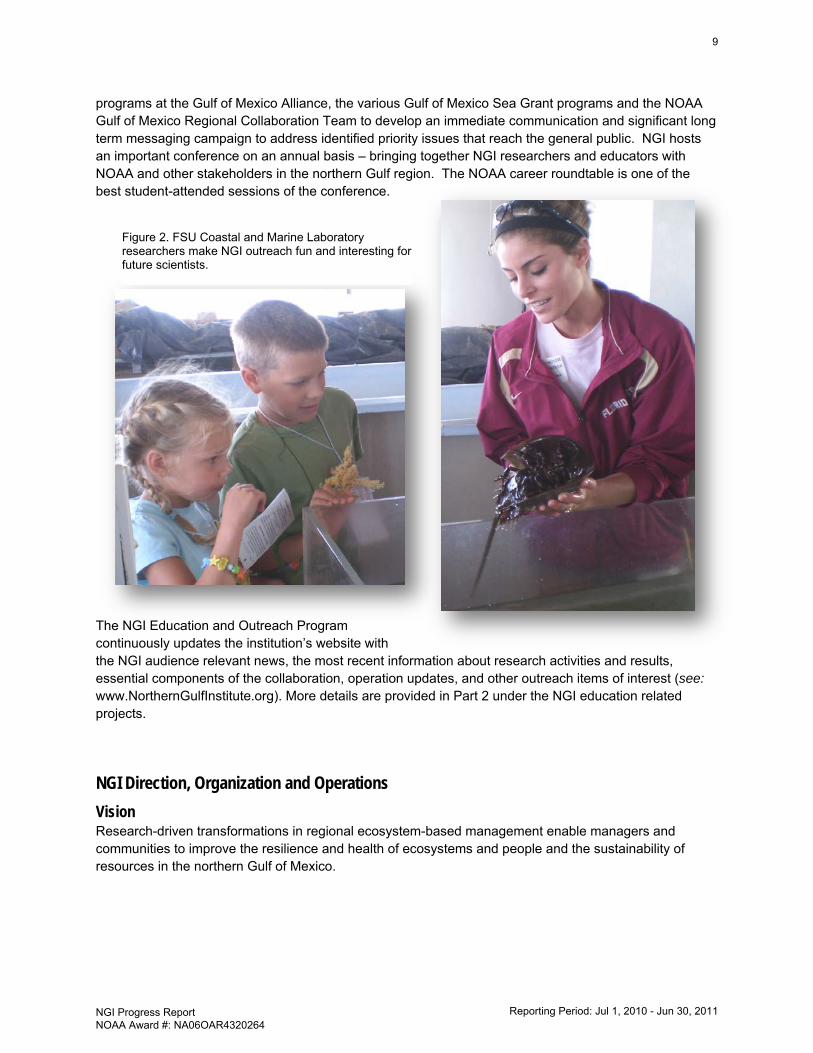
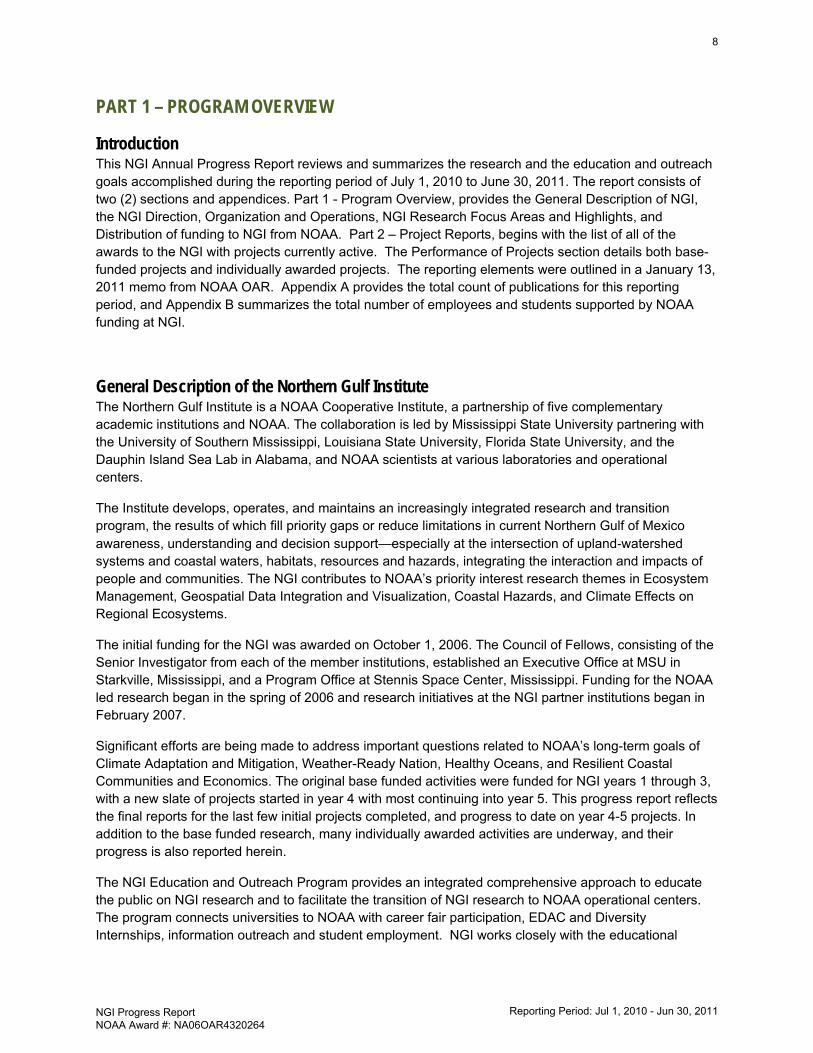
programs at the Gulf of Mexico Alliance, the various Gulf of Mexico Sea Grant programs and the NOAA Gulf of Mexico Regional Collaboration Team to develop an immediate communication and significant long term messaging campaign to address identified priority issues that reach the general public. NGI hosts an important conference on an annual basis – bringing together NGI researchers and educators with NOAA and other stakeholders in the northern Gulf region. The NOAA career roundtable is one of the best student-attended sessions of the conference.
The NGI Education and Outreach Program continuously updates the institution’s website with the NGI audience relevant news, the most recent information about research activities and results, essential components of the collaboration, operation updates, and other outreach items of interest (see: www.NorthernGulfInstitute.org). More details are provided in Part 2 under the NGI education related projects.
NGI Direction, Organization and Operations Vision Research-driven transformations in regional ecosystem-based management enable managers and communities to improve the resilience and health of ecosystems and people and the sustainability of resources in the northern Gulf of Mexico.
Figure 2. FSU Coastal and Marine Laboratory researchers make NGI outreach fun and interesting for future scientists.
9
NGI Progress Report NOAA Award #: NA06OAR4320264
Reporting Period: Jul 1, 2010 - Jun 30, 2011
Mission The Northern Gulf Institute conducts research that builds an integrated, comprehensive understanding of natural and human impacts on northern Gulf of Mexico ecosystems and economies to improve its management.
NGI Research Goals (1) Understand the structure, function, and services of ecosystems across land-sea, ocean-atmosphere,
and coastal waters-deep sea interfaces. NGI uses adaptive sampling, remote sensing in-situ monitoring, surveying, experimental approaches, and process studies to conduct research on natural systems and on the natural and human factors that influence them. Short- to long-term research and management needs drive the approaches to data collection, integration, archival, retrieval, and experimental design.
(2) Synthesize information across disciplines to reduce uncertainty and to forecast ecosystem responses.
NGI integrates research across land-sea and ocean-atmosphere interfaces using a combination of analyses, ecosystem modeling, and Earth-system modeling. This synthesis of research approach reduces scientific uncertainty and improves holistic understanding of changes in the structure and function of ecosystems and effects on ecosystem services and society.
(3) Develop applications that address regional management needs. NGI uses management needs to
drive the development of applications from data, knowledge, and tools. Researchers identify specific regional needs, develop applications, and establish a transition process or framework for projects and partners. Applications from research include capabilities for ecological forecasting, integrated ecosystem assessments, and ecosystems-based coastal and marine spatial planning.
NGI Engagement Goals (1) Develop, facilitate, disseminate, and transition research, knowledge, and applications. NGI develops
and facilitates research opportunities with strong ties to its core strengths and research priorities. NGI works with administrators and researchers at federal, regional, and state agencies involved in related efforts to leverage research capacity and impact. NGI builds multi-institutional and interdisciplinary research teams to respond to opportunities and support the successful completion of those projects. NGI researchers disseminate and transition findings and developments to scientific and resource management communities and partners involved with engagement efforts.
(2) Build internal and external connections for institutional sustainability. The NGI Program Office,
Council of Fellows, Executive Council, and Advisory Council communicate in order to plan, partner, and align NGI research objectives with national, regional, and state management priorities. NGI engages government, academia, industry, and community leaders in this process. NGI provides opportunities for graduate and undergraduate students and interns to conduct research. NGI supports educator professional development, coastal marine education centers, and citizen science groups.
Organization and Operations Figure 3. NGI Organization Diagram.Figure 3 illustrates the NGI organizational structure and collaborative connections. The top row reflects the oversight role of MSU. The Director of NGI, a tenured professor who reports to the MSU Vice President for Research, has his principal office on the MSU campus, but often visits Stennis Space Center, MS. The Director’s responsibilities are to serve as primary liaison to NOAA’s Executive Council and as the principal point of contact for the Cooperative Institute Program Manager. At the direction of the Director, the NGI Co-Director assists in this role.
10
NGI Progress Report NOAA Award #: NA06OAR4320264
Reporting Period: Jul 1, 2010 - Jun 30, 2011
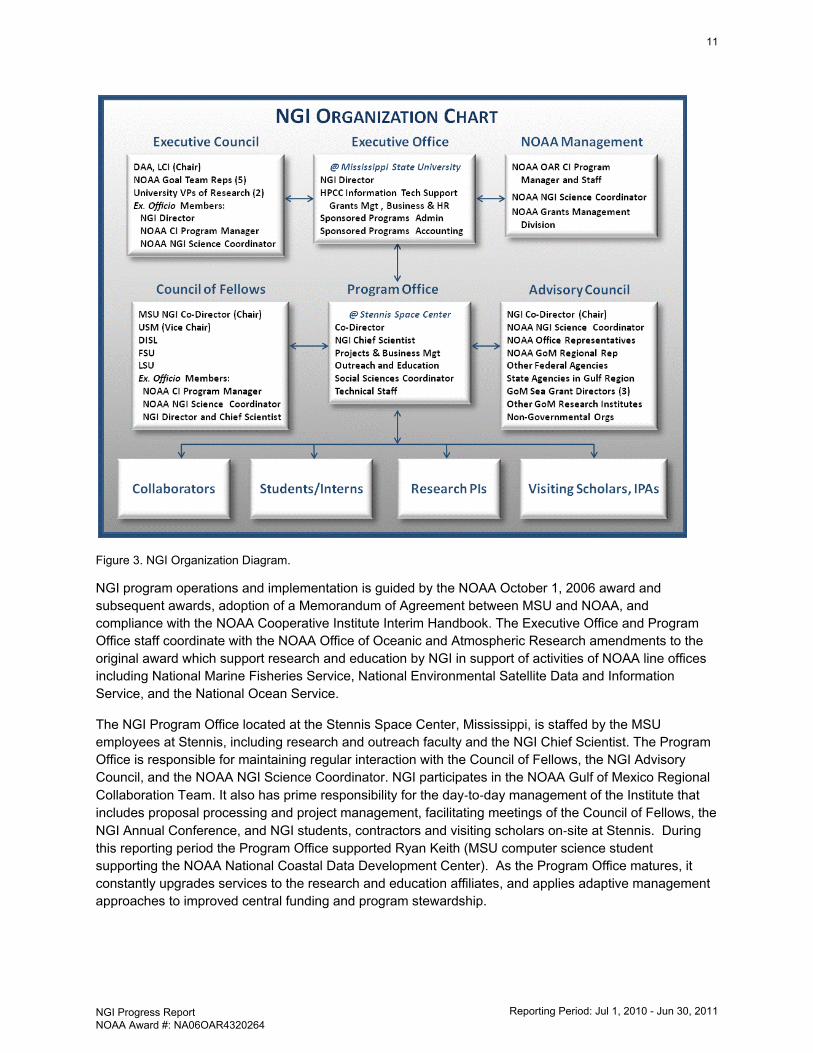
Figure 3. NGI Organization Diagram.
NGI program operations and implementation is guided by the NOAA October 1, 2006 award and subsequent awards, adoption of a Memorandum of Agreement between MSU and NOAA, and compliance with the NOAA Cooperative Institute Interim Handbook. The Executive Office and Program Office staff coordinate with the NOAA Office of Oceanic and Atmospheric Research amendments to the original award which support research and education by NGI in support of activities of NOAA line offices including National Marine Fisheries Service, National Environmental Satellite Data and Information Service, and the National Ocean Service.
The NGI Program Office located at the Stennis Space Center, Mississippi, is staffed by the MSU employees at Stennis, including research and outreach faculty and the NGI Chief Scientist. The Program Office is responsible for maintaining regular interaction with the Council of Fellows, the NGI Advisory Council, and the NOAA NGI Science Coordinator. NGI participates in the NOAA Gulf of Mexico Regional Collaboration Team. It also has prime responsibility for the day‐to‐day management of the Institute that includes proposal processing and project management, facilitating meetings of the Council of Fellows, the NGI Annual Conference, and NGI students, contractors and visiting scholars on‐site at Stennis. During this reporting period the Program Office supported Ryan Keith (MSU computer science student supporting the NOAA National Coastal Data Development Center). As the Program Office matures, it constantly upgrades services to the research and education affiliates, and applies adaptive management approaches to improved central funding and program stewardship.
11
NGI Progress Report NOAA Award #: NA06OAR4320264
Reporting Period: Jul 1, 2010 - Jun 30, 2011
NGI Fellows The Council of Fellows is composed of senior scientific/ technical representatives from each NGI member academic institution, as well as the NOAA NGI Science Coordinator, and the NOAA OAR CI Program Manager. At the direction of the NGI Director, the Council is chaired by the NGI Co-Director. The vice chair is the USM representative. The Council of Fellows is responsible for development of the Implementation Plan and its biannual review by the Advisory Council. It produces an Annual Progress Report to NOAA and oversees the Annual NGI Work Plan. It receives overarching guidance from the Executive Council, and builds the Annual Work Plan based on needs assessments and recommendations from the Advisory Council, the Gulf of Mexico Alliance Action Plan II and the Sea Grant Research Plan. This group is also responsible for ensuring that the highest quality research is conducted, both through stringent project review prior to implementation and through monitoring progress of these projects once initiated.
For period July 2010 through June 2011, the NGI Council of Fellows consisted of:
William McAnally, Ph.D., Mississippi State University (chair) Steven Lohrenz, Ph.D., University of Southern Mississippi Eric Chassignet, Ph.D., Florida State University Chris D’Elia, Ph.D., Louisiana State University George Crozier, Ph.D., Dauphin Island Sea Lab
Meetings of the NGI Council of Fellows for this reporting period were held on October 11-12, 2010 at Florida State University, on January 25, 2011, and in conjunction with the NGI Annual Conference on May 17 and 19, 2011 in Mobile, Alabama. At the May meeting, the Council of Fellows and the Advisory Council held a joint session to allow exchange of recommendations from the Advisory Council and updates on progress from the Fellows. The Fellows have established a monthly telecom to remain up to date between face-to-face meetings. At their fall meeting, the Fellows adopted long-term goals to improve ecosystem science and use and strengthen the Northern Gulf Institute research goals to: (1) Understand the structure, function, and services of ecosystems across land-sea, ocean-atmosphere, and coastal waters-deep sea interfaces, (2) Synthesize information across disciplines to reduce uncertainty and to forecast ecosystem, and responses, and (3) Develop applications that address regional management needs. In addition, on June 24, 2011, the NGI Council of Fellows adopted the 2011-2021 Strategic Plan.
NGI Executive Council The Executive Council consists of six Senior NOAA officials, representing the four NOAA Goal Teams, and vice presidents of two NGI academic partner institutions. Dr. Ponwith is serving as the Deputy Assistant Administrator for Laboratories and Cooperative Institutes’s representive as Chair. The NOAA OAR Cooperative Institute Program Manager, the NOAA NGI Science Coordinator, and the NGI Director serve as ex officio members of the Executive Council.
The Executive Council is primarily responsible for broad policy and program direction for the NGI. The Council plans to meet at least once yearly to review NGI programs and progress and to transmit NOAA strategic plans and priorities to the NGI management in order to ensure program alignment with these priorities. It last met on November 9, 2010. The Executive Council provides information regarding the NGI successes to the NOAA Administrator to justify inclusion of NGI funding in the NOAA core budget. The NGI is committed to transparency, accountability, governance control, and effective integration through the Executive Council. The NGI Executive Council members are:
12
NGI Progress Report NOAA Award #: NA06OAR4320264
Reporting Period: Jul 1, 2010 - Jun 30, 2011
Bonnie Ponwith, Ph.D., Director, NOAA SE Fisheries Science Center (Chair) Gary M. Carter, Director, Office of Hydrologic Development Margaret Davidson, Director, NOAA Coastal Services Center Louisa Koch, Director, NOAA Office of Education Al Powell, Ph.D., Director, Center for Satellite Applications and Research Alan Leonardi, Ph.D., NOAA Atlantic Oceanographic and Meteorological Laboratory David Shaw, Ph.D., VP for Research & Econ. Dev., Mississippi State University Denis Wiesenburg, Ph.D., VP for Research, University of Southern Mississippi Philip Hoffman, OAR CI Program Manager (Special Advisor, Ex-officio) Julien Lartigue, Ph.D., NOAA NGI Science Coordinator (Ex-officio) Robert Moorhead, Ph.D., NGI Director (Ex-officio)
NGI Advisory Council The NGI Advisory Council serves as the principal interface to the regional stakeholder community of the NGI. It has broad representation from the entities listed in the organizational chart, and meets regularly to identify and prioritize research and educational needs in the Northern Gulf region. The Advisory Council provides input on the current research and education/outreach programs of the NGI. The Advisory Council provides a bi‐annual report to the NGI Director and Executive Council on its findings and recommendations. NGI supports the formation and efforts of workgroups around each of the major themes of the NGI and accepts direction from the Advisory Council when they identify the need. The NGI Advisory Council members are:
Julien Lartigue, Ph.D., NOAA NGI Science Coordinator Russ Beard, NOAA National Coastal Data Development Center Miles Croom, NOAA‐National Marine Fisheries Service Todd Davison, NOAA Gulf Coast Services Center Kristen Fletcher, Coastal States Organization Gloria Car, EPA Gulf of Mexico Program Judy Haner, The Nature Conservancy Karl Havens, Ph.D., Florida Sea Grant College Program Alyssa Dausman, USGS Gulf Coast & LMV Larry McKinney, Harte Research Institute Kathleen O’Neil, NOAA National Data Buoy Center Duane Armstrong, NASA Stennis Space Center David Reed, NOAA National Weather Service LMRFC Matt Romkens, USDA National Sedimentation Lab David Ruple, Grand Bay National Estuarine Research Reserve Martha Segura, NPS Gulf Coast Network Buck Sutter, NOAA GoM Regional Collaboration Team Lead LaDon Swann, Ph.D., MS‐AL Sea Grant Consortium William Walker, Ph.D., MS Department of Marine Resources Jeff Waters, US Army Corps of Engineers Chuck Wilson, Ph.D., Louisiana Sea Grant College William McAnally, Ph.D., MSU/NGI Co-Director (Chair)
The Advisory Council met November 30, 2010 and May 19, 2011 (Mobile, AL) to assess NGI research directions and advise the Fellows on important issues facing the region.
13
NGI Progress Report NOAA Award #: NA06OAR4320264
Reporting Period: Jul 1, 2010 - Jun 30, 2011
NGI Research Focus Areas The Institute contributes to NOAA’s priority interests in four NGI research themes of Ecosystem Management, Geospatial Data Integration and Visualization, Coastal Hazards, and Climate Effects on Regional Ecosystems. Several examples of benefits and research highlights follow the descriptions of each theme.
Ecosystem Management The ecosystems in the northern Gulf are the home to valuable fisheries, important recreational activities, and many commercial operations including fossil fuel extraction and coastal industries. The region needs more monitoring and basic information to support resource management. Fisheries ecosystem based management is a fundamental element in NOAA’s Five Year Strategic Plan and a recommendation of the President’s Commission on Ocean Policy as part of an overall strategy to protect, preserve, and utilize our marine resources.
Theme Research Objectives
1. Monitoring and assessment of coastal marine ecosystems in the northern Gulf 2. Ecosystem-based fisheries management 3. Circulation modeling and observations for ecosystem management 4. Coastal ecosystem resiliency
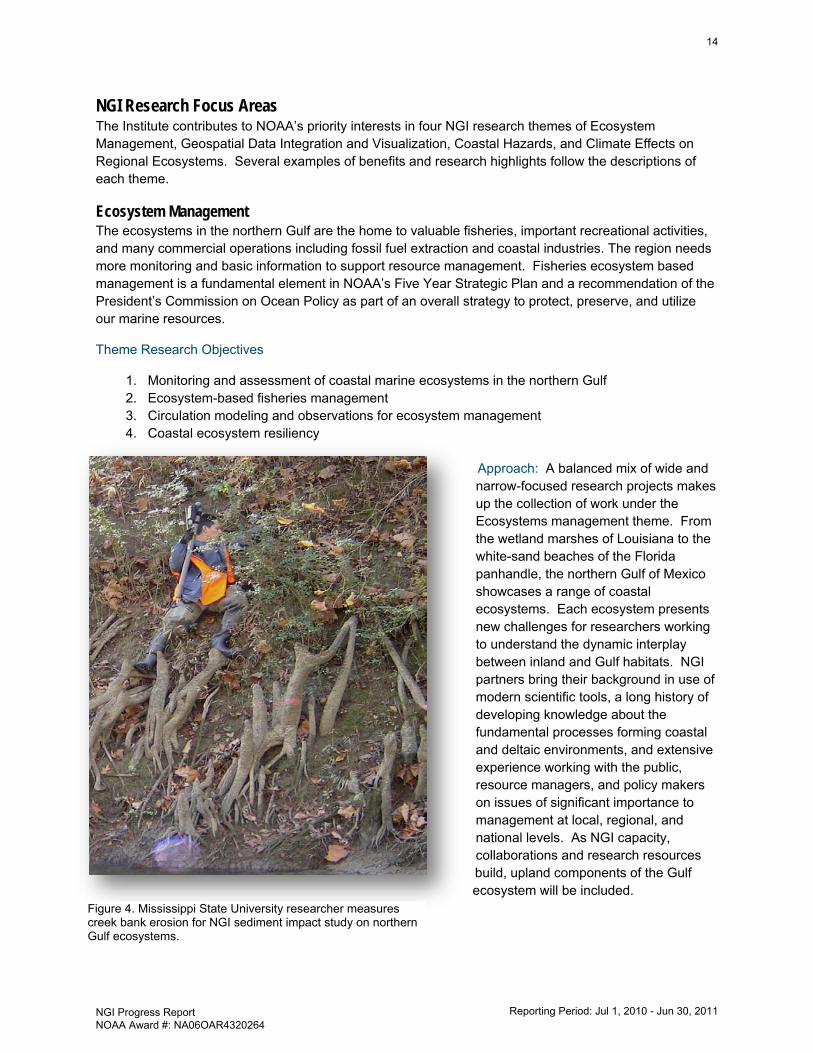
Approach: A balanced mix of wide and narrow-focused research projects makes up the collection of work under the Ecosystems management theme. From the wetland marshes of Louisiana to the white-sand beaches of the Florida panhandle, the northern Gulf of Mexico showcases a range of coastal ecosystems. Each ecosystem presents new challenges for researchers working to understand the dynamic interplay between inland and Gulf habitats. NGI partners bring their background in use of modern scientific tools, a long history of developing knowledge about the fundamental processes forming coastal and deltaic environments, and extensive experience working with the public, resource managers, and policy makers on issues of significant importance to management at local, regional, and national levels. As NGI capacity, collaborations and research resources build, upland components of the Gulf ecosystem will be included.
Figure 4. Mississippi State University researcher measures creek bank erosion for NGI sediment impact study on northern Gulf ecosystems.
14
NGI Progress Report NOAA Award #: NA06OAR4320264
Reporting Period: Jul 1, 2010 - Jun 30, 2011
Geospatial Data Integration and Visualization The ability to assess the distribution of features in the coastal environment has improved dramatically over recent decades. Many organizations are involved in collecting data to measure the primary properties of coastal zones using a variety of methods ranging from remote sensing to in situ sensors and sampling. There is a wealth of accumulated information about coastal zones in various databases, files, spreadsheets. Sharing generated datasets, information, and results between geographically distributed organizations often proves to be challenging. Further, use of higher resolution data has been limited because of the computational intensity required.
Theme Research Objectives
1. Geospatial assessment and strategic planning 2. Semantics-driven framework for understanding coastal/ocean data 3. Visualization technologies 4. Improvements to coastal mapping methodologies
Approach: One word describes this theme – capabilities. Projects under this theme emphasize development of capabilities for resource managers, scientists, and citizens. NGI partners provide capabilities in remote sensing, computational technologies, visualization techniques, natural resource management, and the transition of these into operational agency research, planning, and decision-support programs. The end-to-end approach involves a strong geospatial extension program in the development and execution of research programs with the end-user in mind at each step.
Coastal Hazards Improving understanding of several significant coastal hazards is more crucial now than ever before. Coastal populations have grown exponentially over the past 30 years. In addition, the Gulf of Mexico is one of the most economically critical ecosystems in the Nation. Coastal hazards and public health and safety are major concerns to agencies responsible for the public good of coastal regions. Weather and ocean phenomena considered in the context of anthropogenic factors pose considerable resource sustainability, financial and safety threats to the Gulf coast region.
Theme Research Objectives
1. Forecasting and valuing catastrophic natural events to coastal communities 2. Assessment of localized hypoxia in shelf waters 3. Address issues of oceans and public health 4. Economic assessment of coastal hazards
Approach: Several academic and research units explore the susceptibility of the Northern Gulf of Mexico to changes and risks of living and working in the coastal zone from cyclones, contaminants, climate change, and water resource issues. Innovative research in risk analysis and management, policy development, economic and community development, and natural resource economics is an important strength of NGI partners. A variety of research and academic units focused on coastal science and engineering and new approaches in dynamically developed system analysis enables integration of ecosystem restoration programs in concert with naturally occurring coastal disturbances.
15
NGI Progress Report NOAA Award #: NA06OAR4320264
Reporting Period: Jul 1, 2010 - Jun 30, 2011
Climate Effects on Regional Ecosystems NOAA believes that the nation needs targeted climate services at all scales and that this goal will require unprecedented levels of coordination between all agencies. Within the US, extensive climate-related changes have been documented. In the 2001 Southeast Regional Climate Assessment Study sponsored by NASA, the southeastern U.S. was the only region for which climate models simulated large and opposing changes in precipitation patterns over the next 100 years. The range of differences was so great that it was difficult to state with any degree of confidence that precipitation will increase or decrease in the Southeast over the next 30 to 100 years as atmospheric CO2 and other greenhouse gases increase. A highly developed global model with an embedded high resolution regional model is expected to provide more accurate site- and year-specific predictions of maximum and minimum temperature, precipitation frequency and amount, and net radiation than forecasts based on historic or El Nino Southern Oscillation climatology.
Theme Research Objectives
1. Impact of regional climate variability on watersheds and coastal activity 2. Explore the impacts of event-scale forcing linked with climate variability 3. Examine climate change impacts to fisheries ecosystems
Approach: Deployment of successful monitoring systems and highly sophisticated data analysis are just two of the strengths NGI has brought to bear on this theme. The collaboration between partners has created a synergistic approach to collecting data for climate model inputs and model interpretation. Effective climate models contribute to a better understanding of the northern Gulf of Mexico ecosystems and how they are affected by climate change.
Research Highlights Important recent research accomplishments by NGI researchers, in collaboration with multiple NOAA researchers, focus on the issues and resources of the Gulf with many of the tools and protocols transferrable to other coastal environs. Listed below are several examples of these successes with additional details available in the later project descriptions.
1. Research results indicated that Barataria Bay estuary imports nitrogen and exports carbon to the coastal ocean. The annual Total Organic Carbon export is 109 million kg, or 57 gC m2 yr-1 when prorated to the total water area of the estuary. This carbon export is equivalent to a loss of 0.5 m of wetland soil horizon over an area of 8.4 km2, and accounts for about 34 % of the observed annual wetland loss in the estuary between 1978 and 2000. However, compared to the lower Mississippi River, the Barataria estuary appears to be a very small source of Total Organic Carbon for the northern Gulf of Mexico (2.7 % of riverine Total Organic Carbon), and is therefore unlikely to have a significant influence on the development of Gulf hypoxia. An interesting finding is that besides nutrients, wind appears to be an important controlling factor in productivity dynamics in Barataria Bay. Wind resuspends sediments that block light important for phytoplankton growth, but resuspension also liberates nutrients from sediment porewaters. When winds die down, as they usually do overnight, phytoplankton grow rapidly during daylight hours with P/R ratios of (gross productivity/respiration) in the 1-3 range.
16
NGI Progress Report NOAA Award #: NA06OAR4320264
Reporting Period: Jul 1, 2010 - Jun 30, 2011
2. A Before-After-Control-Impact study demonstrated that nekton species biomass distributions changed significantly after the opening of the Caernarvon freshwater diversion 1991. The biomass of selected economically or ecologically important species showed an increase relative to the control (Micropterus salmoides, Micropogonias undulatus, Brevoortia patronus, Farfantepenaeus aztecus and Litopenaeus setiferus), and one was not affected (Cynoscion nebulosus). In addition, nekton species richness, abundance and the proportion of smaller individuals increased, indicating increased nursery function.
3. To better understand the impacts of Mississippi River diversions on wetland restoration strategies, new data were analyzed to help budget what was happening to Mississippi River nitrate that was entering upper Breton Sound at Caernarvon. The data suggest that phytoplankton uptake is likely the major sink for nitrate at Caernarvon. The strongest biological uptake signals occurred in July at moderate residence times, and presumably moderate river flows. Macrophyte uptake probably is also very important in Lake Leary, accounting for the strong "estuarine filter" effect and about 100% nitrate removal unless diversion flows are very strong, as they were in April 2008.
4. Consistent with the view that estuaries are generally highly productive systems, Breton Sound net productivity values are about 10x greater than average offshore values based on a model developed from averaging results from 24 hour incubations with results from field oxygen isotope measurements. For February – October 2009, Breton Sound phytoplankton productivity was about 2x higher in warmer than colder months where overall productivity averaged about 50 mmol C m-3/d and were sufficient to turnover and replace standing algal stocks about once every two days.
5. Phycotoxins, including Microcystis, have now been detected in water samples in Breton Sound estuary, as well as primary and secondary consumers (chironomids, clams, blue crab and catfish), in two estuaries and coastal Louisiana illustrating the need for continued monitoring and research to discover the underlying factors that control toxin production. Finding phycotoxins in the estuary illustrates the potential for harmful effects on consumers and the entire food web.
6. Relevant to understanding hazardous algal blooms, both field data and laboratory testing shows salinity as one of the major impacting factors in Vibrio proliferation. For example, a lower Barataria site with an annual average salinity of 18.7 g/L had an annual average putative Vibrio population of 277 CFU/100 mL in contrast to an average Vibrio population of 1 CFU/100 mL at an upper Barataria site with an average salinity of 0.15 g/L. Observations also demonstrated that freshwater pulse events in Breton Sound lowered Vibrio levels.
7. Denitrification rates of the salt marsh soils in Breton Sound demonstrated a tolerance to salinity levels in the higher salinity range with no significant difference in rate for the 15 and 35 ppt treatments. However, freshwater salinity treatment led to a dramatic decrease in denitrification rates for the salt marsh soil. This result has consequences for any proposed very large diversion which would be capable of discharging very large amounts (50,000 - 150,000 cfs) of Mississippi River water. Under such hydraulic loading to the coastal wetlands, some nitrate would bypass the fresh marsh and would undergo little denitrification in the salt marsh environment. This increased inorganic N loading to the coastal ocean would have consequences for increased coastal hypoxia.
17
NGI Progress Report NOAA Award #: NA06OAR4320264
Reporting Period: Jul 1, 2010 - Jun 30, 2011
8. Sampling continued at stations from Lower Pearl River estuary as well as in the Bay of Saint Louis, out into the Mississippi Sound and offshore to the 20 m isobath in the Mississippi Bight. This monitoring led to the discovery of seasonal hypoxia in the western Mississippi Bight after seasonal transition from horizontally to vertically stratified water column. These measurements show that hypoxia in the region leads to nutrient flux out of the benthos, and enhanced surface productivity, which can then lead to enhanced bottom hypoxia. Phosphate enhancement (N:P ratios < 1) in the Mississippi Sound was consistent with that originally found in the 1970s, but not appearing in the later literature.
9. Data from NOAA’s Coastal Change Analysis Program (C-CAP) program, distributed by the Coastal Services Center, and from the Landsat 5 Thematic Mapper satellite sensor were analyzed to investigate wetland loss patterns near the Caernarvon diversion due to hurricane storm surge. Before the 2005 hurricanes, wetland erosion occurred at a slow but steady pace throughout the region, from 0-2.4%. The most erosion was near the diversion in the freshwater region. After the 2005 hurricanes, land loss is evident throughout the basin. Both C-CAP and Landsat datasets show that, north of the Mississippi River Gulf Outlet, water coverage in the intermediate to saline regions increased from 1.5-3.7%. However, the freshwater regions increased as from 12.3-39.0%.The biggest proportional changes are in the diversion area. Hypotheses for this poor resiliency are currently being studied. The freshwater vegetation may be unable to withstand the shear stress from hurricane impacts on shallow low salinity root systems. Because of agricultural runoff into the Mississippi River, the Caernarvon’s nutrient-rich waters contribute to “weaker” soils by lowering biomass, below ground production, and organic accumulation. Additionally, the bulk density of freshwater marsh (0.07 g cm-3) is much less than saline marsh (0.24 g cm-3). All these factors suggest freshwater vegetation is less hardy than its saline counterparts.
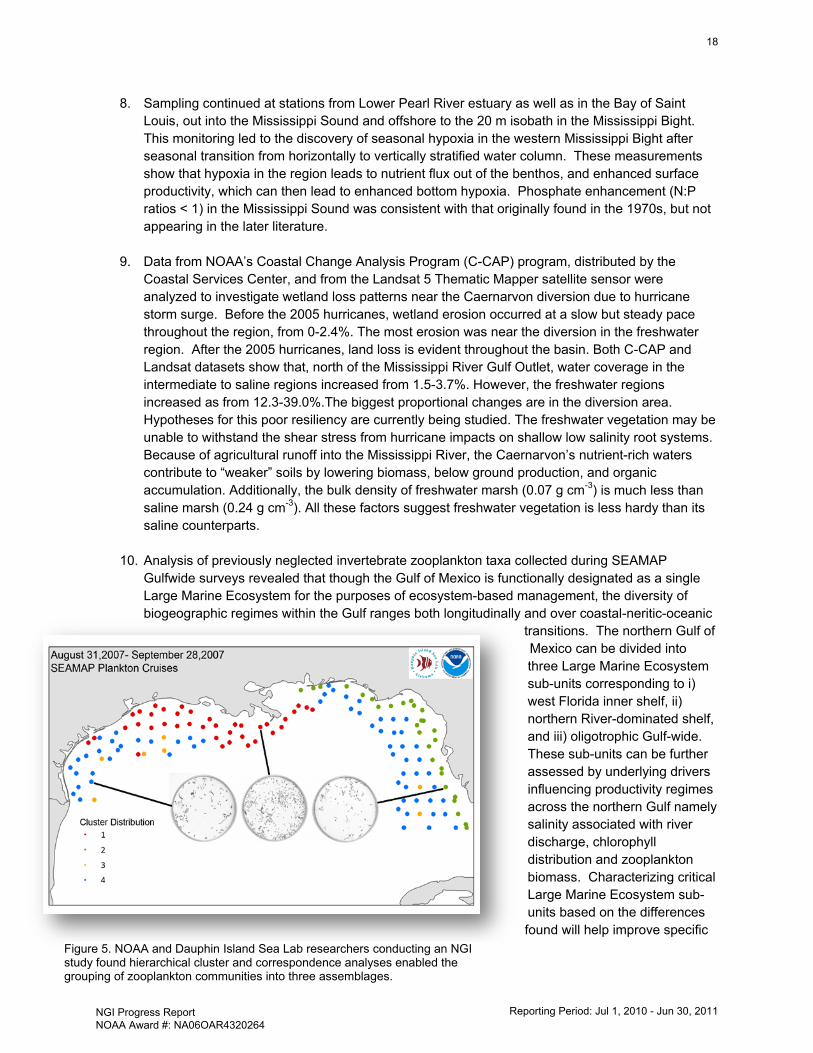
10. Analysis of previously neglected invertebrate zooplankton taxa collected during SEAMAP Gulfwide surveys revealed that though the Gulf of Mexico is functionally designated as a single Large Marine Ecosystem for the purposes of ecosystem-based management, the diversity of biogeographic regimes within the Gulf ranges both longitudinally and over coastal-neritic-oceanic
transitions. The northern Gulf of Mexico can be divided into three Large Marine Ecosystem sub-units corresponding to i) west Florida inner shelf, ii) northern River-dominated shelf, and iii) oligotrophic Gulf-wide. These sub-units can be further assessed by underlying drivers influencing productivity regimes across the northern Gulf namely salinity associated with river discharge, chlorophyll distribution and zooplankton biomass. Characterizing critical Large Marine Ecosystem sub-units based on the differences found will help improve specific
Figure 5. NOAA and Dauphin Island Sea Lab researchers conducting an NGI study found hierarchical cluster and correspondence analyses enabled the grouping of zooplankton communities into three assemblages.
18
NGI Progress Report NOAA Award #: NA06OAR4320264
Reporting Period: Jul 1, 2010 - Jun 30, 2011
ecosystem model parameterizations planned for managing Gulf resources.
11. A seasonal association was found between worldwide oceanic-atmospheric modes of variability, meteorological and hydrological conditions and displacement volumes of zooplankton in the northern Gulf of Mexico. The combination of Atlantic Multi-decadal Oscillation cold, North Atlantic Oscillation positive, and El Nino Southern Oscillation warm phases were associated with the stormy January to March winter weather (i.e., strong low pressure system, southern winds, and high moist air) of 1982, while the opposite phases of these modes of variability were related to the calm dry winter of 1999. The wet winter (high precipitation and surface runoff) of 1982 was further linked to high mean spring (April 24-May 26) displacement volumes of zooplankton, whereas the dry winter of 1999 was associated with low displacement volumes.
12. NOAA and NGI co-sponsored and NGI researchers participated in several multi-agency workshops targeting multiple NOAA and Gulf state environmental agency priorities. The 2nd Annual Workshop to Coordinate Gulf of Mexico Hypoxic Zone Research was held March 31-April 1, 2011 in order to develop research plans, improve university, federal and state agency coordination of monitoring and modeling for the 2011 Gulf Hypoxic Zone and beyond and facilitate management of the Hypoxic Zone by identifying research findings for incorporation into the Gulf Hypoxia Task Force Annual Progress Report and Annual Operating Plans. The Operational Storm Surge Inundation Mapping Workshop was held March15-16, 2011 to develop a research plan of action including the understanding of available mapping techniques, their advantages and disadvantages, the validity of mapping from coarse models to higher resolution models, and the relationship between mapping and surge prediction uncertainty. The ultimate goal of this research plan is to identify the issues associated with the creation of operational inundation depth maps using high resolution data necessary for operational storm surge prediction. NGI provided follow up support to the Ecosystem Services Valuation workshop held June 16-18, 2010. That workshop developed a common definition of ecosystem services and identified and prioritized the ecosystem services most relevant to coastal and marine ecosystems in the Gulf of Mexico necessary for ecosystem based management in the Gulf. An ecosystem modeling workshop was held January 25-26, 2011 to develop consensus on a model framework to be used to develop a quantitative ecological relevant to northern Gulf coastal ecosystems including Barataria Bay, western Mississippi Sound, Perdido Bay, and Apalachicola Bay.
Distribution of Funding Support to NGI from NOAA This section contains charts that illustrate the distribution of funding support levels by cooperative institute tasks, by distribution of activities within Task 1 with description of the activities, and by NGI Research theme area.
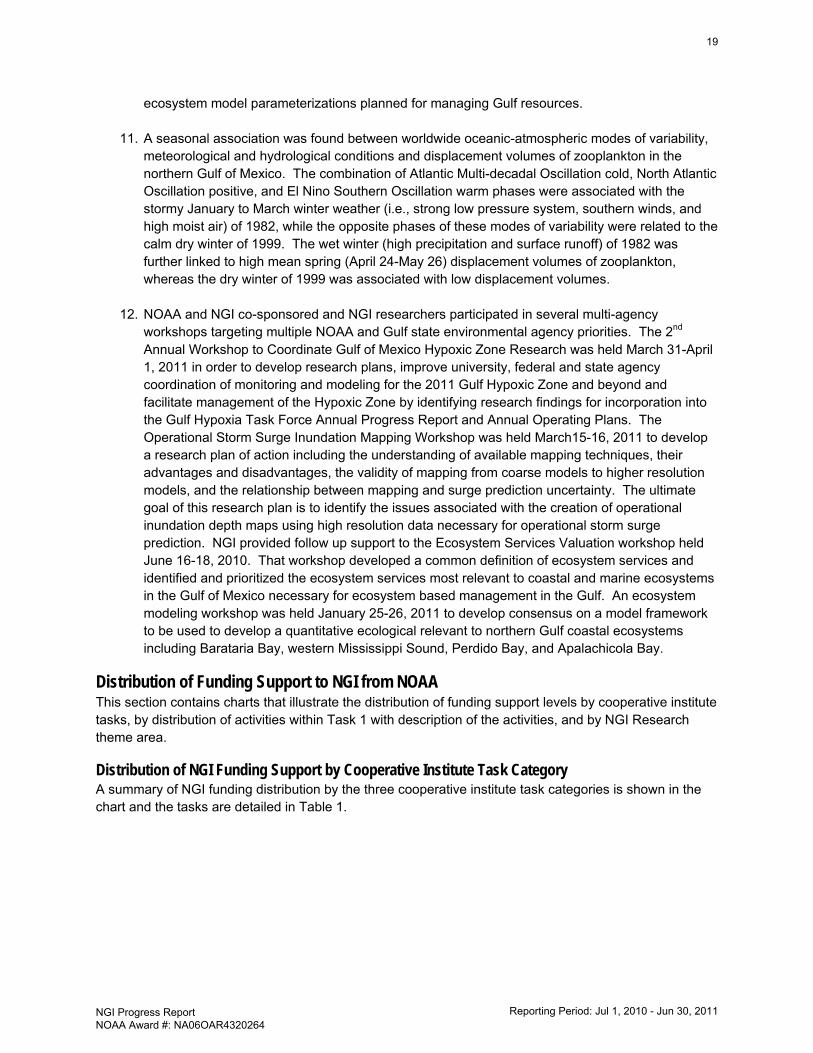
Distribution of NGI Funding Support by Cooperative Institute Task Category A summary of NGI funding distribution by the three cooperative institute task categories is shown in the chart and the tasks are detailed in Table 1.
19
NGI Progress Report NOAA Award #: NA06OAR4320264
Reporting Period: Jul 1, 2010 - Jun 30, 2011
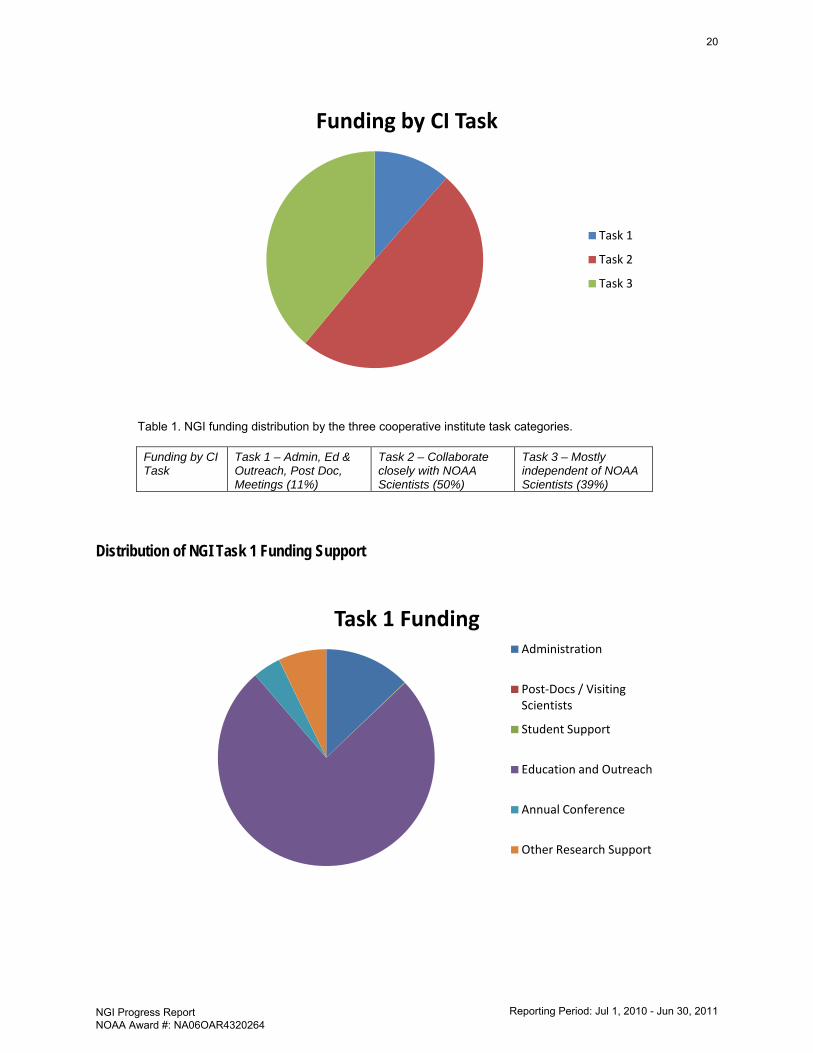
Table 1. NGI funding distribution by the three cooperative institute task categories.
Funding by CI Task
Task 1 – Admin, Ed & Outreach, Post Doc, Meetings (11%)
Task 2 – Collaborate closely with NOAA Scientists (50%)
Task 3 – Mostly independent of NOAA Scientists (39%)
Distribution of NGI Task 1 Funding Support
Funding by CI Task
Task 1
Task 2
Task 3
Task 1 FundingAdministration
Post-Docs / Visiting Scientists
Student Support
Education and Outreach
Annual Conference
Other Research Support
20
NGI Progress Report NOAA Award #: NA06OAR4320264
Reporting Period: Jul 1, 2010 - Jun 30, 2011
NGI TASK 1 Activity % of Total Administration 13% Post-Docs / Visiting Scientists 0% Student Support 0% Education and Outreach 76% Annual Conference 4% Other Research Support 7% Total 100%
Task 1 funding supports the central management and coordination of the five complementary universities working together with NOAA. This year Task 1 funding supported one summer student. It also supports education and outreach efforts, including internships and translating the research results for general dissemination and use in teacher workshops. Details of these efforts are reported in project reports of 06-USM-06, 09-NGI-17, 10-NGI_MOD-38, 10-NGI_MOD-45, 10-NGI_MOD-49, 10-NGI_MOD-50, and 10-NGI_MOD-51. NGI hosts an annual conference to bring together researchers, students, stakeholders, the NGI Advisory Council, and NOAA to highlight the research progress and help foster the collaborations that have led to NGI’s position as a leading regional research institution.
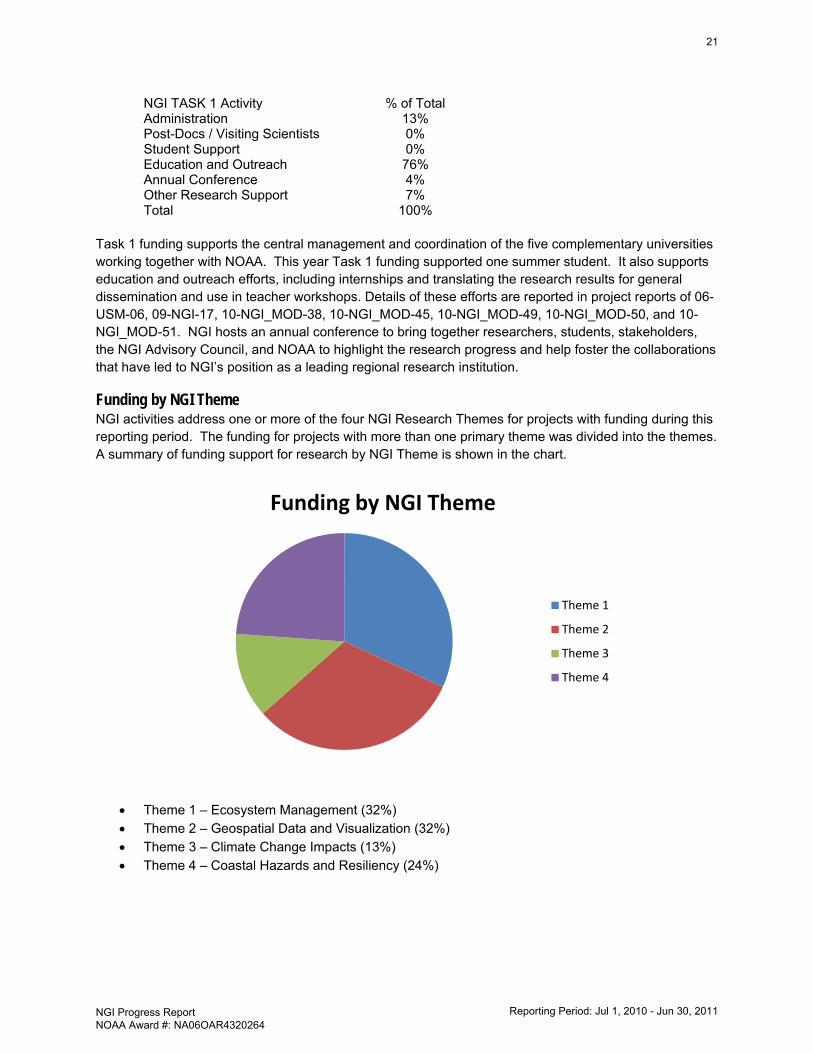
Funding by NGI Theme NGI activities address one or more of the four NGI Research Themes for projects with funding during this reporting period. The funding for projects with more than one primary theme was divided into the themes. A summary of funding support for research by NGI Theme is shown in the chart.
• Theme 1 – Ecosystem Management (32%) • Theme 2 – Geospatial Data and Visualization (32%) • Theme 3 – Climate Change Impacts (13%) • Theme 4 – Coastal Hazards and Resiliency (24%)
Funding by NGI Theme
Theme 1
Theme 2
Theme 3
Theme 4
21
NGI Progress Report NOAA Award #: NA06OAR4320264
Reporting Period: Jul 1, 2010 - Jun 30, 2011
PART 2 – PERFORMANCE OF PROJECTS
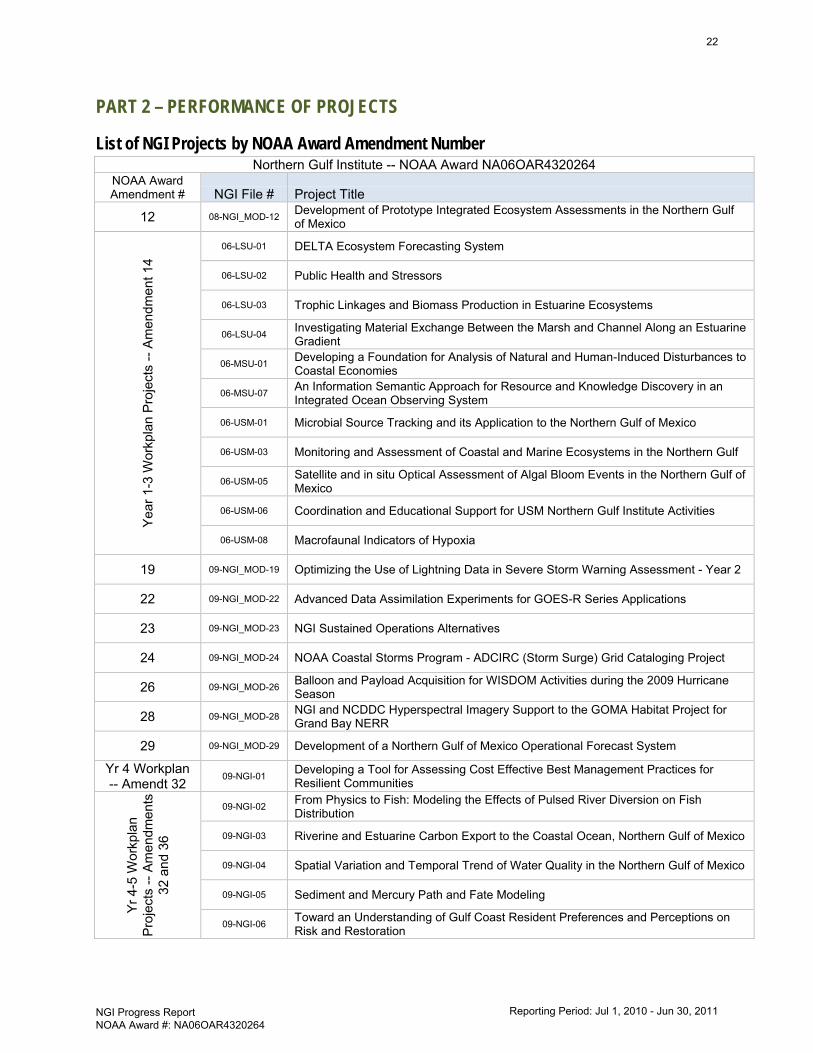
List of NGI Projects by NOAA Award Amendment Number Northern Gulf Institute -- NOAA Award NA06OAR4320264
NOAA Award Amendment # NGI File # Project Title
12 08-NGI_MOD-12 Development of Prototype Integrated Ecosystem Assessments in the Northern Gulf of Mexico
Year
1-3
Wor
kpla
n Pr
ojec
ts --
Am
endm
ent 1
4
06-LSU-01 DELTA Ecosystem Forecasting System
06-LSU-02 Public Health and Stressors
06-LSU-03 Trophic Linkages and Biomass Production in Estuarine Ecosystems
06-LSU-04 Investigating Material Exchange Between the Marsh and Channel Along an Estuarine Gradient
06-MSU-01 Developing a Foundation for Analysis of Natural and Human-Induced Disturbances to Coastal Economies
06-MSU-07 An Information Semantic Approach for Resource and Knowledge Discovery in an Integrated Ocean Observing System
06-USM-01 Microbial Source Tracking and its Application to the Northern Gulf of Mexico
06-USM-03 Monitoring and Assessment of Coastal and Marine Ecosystems in the Northern Gulf
06-USM-05 Satellite and in situ Optical Assessment of Algal Bloom Events in the Northern Gulf of Mexico
06-USM-06 Coordination and Educational Support for USM Northern Gulf Institute Activities
06-USM-08 Macrofaunal Indicators of Hypoxia
19 09-NGI_MOD-19 Optimizing the Use of Lightning Data in Severe Storm Warning Assessment - Year 2
22 09-NGI_MOD-22 Advanced Data Assimilation Experiments for GOES-R Series Applications
23 09-NGI_MOD-23 NGI Sustained Operations Alternatives
24 09-NGI_MOD-24 NOAA Coastal Storms Program - ADCIRC (Storm Surge) Grid Cataloging Project
26 09-NGI_MOD-26 Balloon and Payload Acquisition for WISDOM Activities during the 2009 Hurricane Season
28 09-NGI_MOD-28 NGI and NCDDC Hyperspectral Imagery Support to the GOMA Habitat Project for Grand Bay NERR
29 09-NGI_MOD-29 Development of a Northern Gulf of Mexico Operational Forecast System
Yr 4 Workplan -- Amendt 32
09-NGI-01 Developing a Tool for Assessing Cost Effective Best Management Practices for Resilient Communities
Yr 4
-5 W
orkp
lan
Proj
ects
-- A
men
dmen
ts
32 a
nd 3
6
09-NGI-02 From Physics to Fish: Modeling the Effects of Pulsed River Diversion on Fish Distribution
09-NGI-03 Riverine and Estuarine Carbon Export to the Coastal Ocean, Northern Gulf of Mexico
09-NGI-04 Spatial Variation and Temporal Trend of Water Quality in the Northern Gulf of Mexico
09-NGI-05 Sediment and Mercury Path and Fate Modeling
09-NGI-06 Toward an Understanding of Gulf Coast Resident Preferences and Perceptions on Risk and Restoration
22
NGI Progress Report NOAA Award #: NA06OAR4320264
Reporting Period: Jul 1, 2010 - Jun 30, 2011
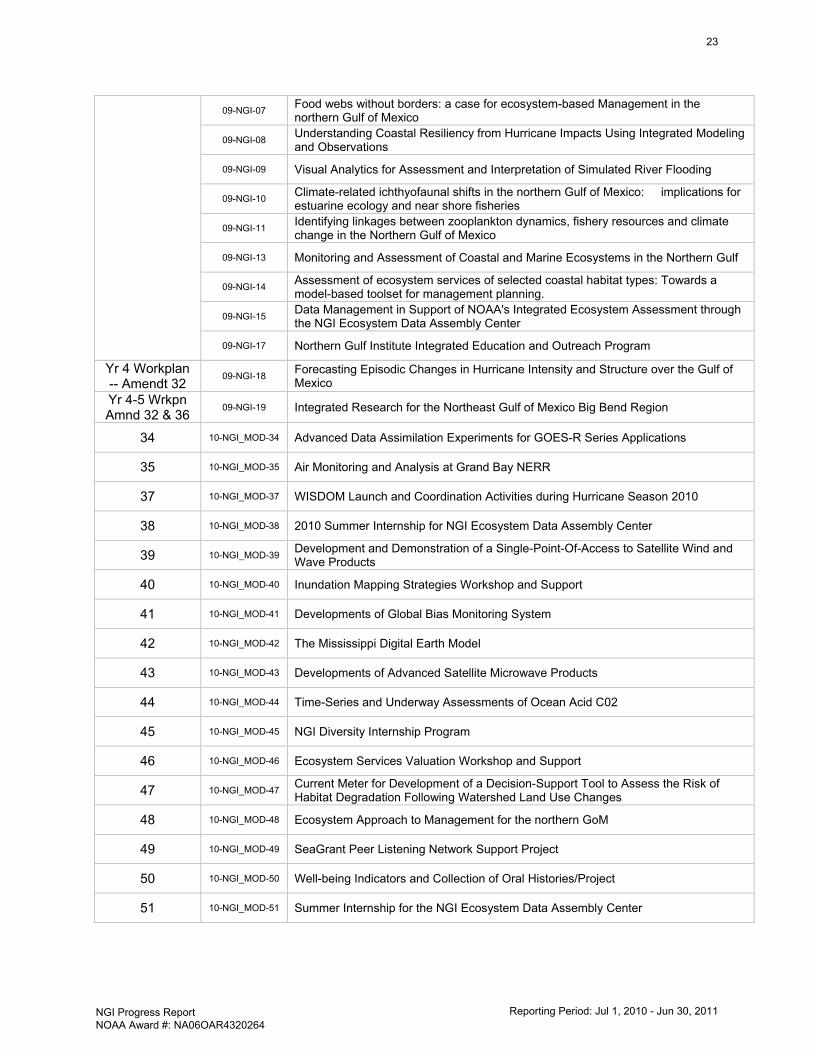
09-NGI-07 Food webs without borders: a case for ecosystem-based Management in the northern Gulf of Mexico
09-NGI-08 Understanding Coastal Resiliency from Hurricane Impacts Using Integrated Modeling and Observations
09-NGI-09 Visual Analytics for Assessment and Interpretation of Simulated River Flooding
09-NGI-10 Climate-related ichthyofaunal shifts in the northern Gulf of Mexico: implications for estuarine ecology and near shore fisheries
09-NGI-11 Identifying linkages between zooplankton dynamics, fishery resources and climate change in the Northern Gulf of Mexico
09-NGI-13 Monitoring and Assessment of Coastal and Marine Ecosystems in the Northern Gulf
09-NGI-14 Assessment of ecosystem services of selected coastal habitat types: Towards a model-based toolset for management planning.
09-NGI-15 Data Management in Support of NOAA's Integrated Ecosystem Assessment through the NGI Ecosystem Data Assembly Center
09-NGI-17 Northern Gulf Institute Integrated Education and Outreach Program
Yr 4 Workplan -- Amendt 32
09-NGI-18 Forecasting Episodic Changes in Hurricane Intensity and Structure over the Gulf of Mexico
Yr 4-5 Wrkpn Amnd 32 & 36
09-NGI-19 Integrated Research for the Northeast Gulf of Mexico Big Bend Region
34 10-NGI_MOD-34 Advanced Data Assimilation Experiments for GOES-R Series Applications
35 10-NGI_MOD-35 Air Monitoring and Analysis at Grand Bay NERR
37 10-NGI_MOD-37 WISDOM Launch and Coordination Activities during Hurricane Season 2010
38 10-NGI_MOD-38 2010 Summer Internship for NGI Ecosystem Data Assembly Center
39 10-NGI_MOD-39 Development and Demonstration of a Single-Point-Of-Access to Satellite Wind and Wave Products
40 10-NGI_MOD-40 Inundation Mapping Strategies Workshop and Support
41 10-NGI_MOD-41 Developments of Global Bias Monitoring System
42 10-NGI_MOD-42 The Mississippi Digital Earth Model
43 10-NGI_MOD-43 Developments of Advanced Satellite Microwave Products
44 10-NGI_MOD-44 Time-Series and Underway Assessments of Ocean Acid C02
45 10-NGI_MOD-45 NGI Diversity Internship Program
46 10-NGI_MOD-46 Ecosystem Services Valuation Workshop and Support
47 10-NGI_MOD-47 Current Meter for Development of a Decision-Support Tool to Assess the Risk of Habitat Degradation Following Watershed Land Use Changes
48 10-NGI_MOD-48 Ecosystem Approach to Management for the northern GoM
49 10-NGI_MOD-49 SeaGrant Peer Listening Network Support Project
50 10-NGI_MOD-50 Well-being Indicators and Collection of Oral Histories/Project
51 10-NGI_MOD-51 Summer Internship for the NGI Ecosystem Data Assembly Center
23
NGI Progress Report NOAA Award #: NA06OAR4320264
Reporting Period: Jul 1, 2010 - Jun 30, 2011
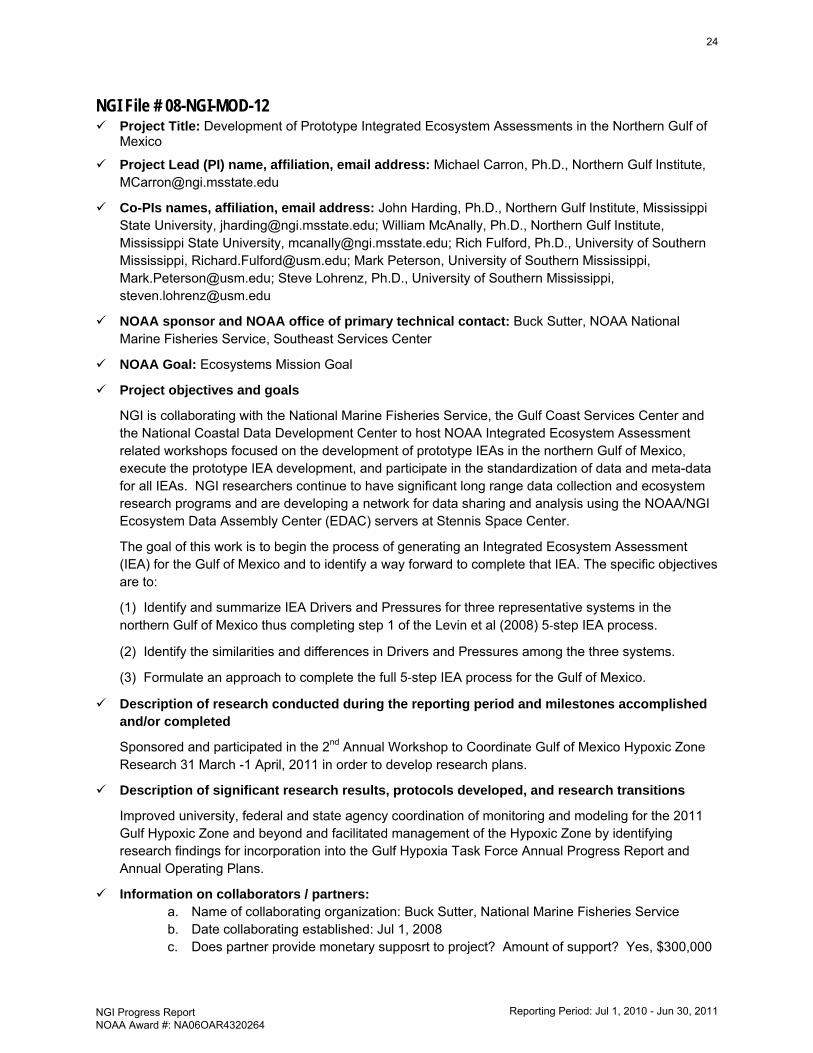
NGI File # 08-NGI-MOD-12 Project Title: Development of Prototype Integrated Ecosystem Assessments in the Northern Gulf of
Mexico
Project Lead (PI) name, affiliation, email address: Michael Carron, Ph.D., Northern Gulf Institute, [email protected]
Co-PIs names, affiliation, email address: John Harding, Ph.D., Northern Gulf Institute, Mississippi State University, [email protected]; William McAnally, Ph.D., Northern Gulf Institute, Mississippi State University, [email protected]; Rich Fulford, Ph.D., University of Southern Mississippi, [email protected]; Mark Peterson, University of Southern Mississippi, [email protected]; Steve Lohrenz, Ph.D., University of Southern Mississippi, [email protected]
NOAA sponsor and NOAA office of primary technical contact: Buck Sutter, NOAA National Marine Fisheries Service, Southeast Services Center
NOAA Goal: Ecosystems Mission Goal
Project objectives and goals
NGI is collaborating with the National Marine Fisheries Service, the Gulf Coast Services Center and the National Coastal Data Development Center to host NOAA Integrated Ecosystem Assessment related workshops focused on the development of prototype IEAs in the northern Gulf of Mexico, execute the prototype IEA development, and participate in the standardization of data and meta-data for all IEAs. NGI researchers continue to have significant long range data collection and ecosystem research programs and are developing a network for data sharing and analysis using the NOAA/NGI Ecosystem Data Assembly Center (EDAC) servers at Stennis Space Center.
The goal of this work is to begin the process of generating an Integrated Ecosystem Assessment (IEA) for the Gulf of Mexico and to identify a way forward to complete that IEA. The specific objectives are to:
(1) Identify and summarize IEA Drivers and Pressures for three representative systems in the northern Gulf of Mexico thus completing step 1 of the Levin et al (2008) 5-step IEA process.
(2) Identify the similarities and differences in Drivers and Pressures among the three systems.
(3) Formulate an approach to complete the full 5-step IEA process for the Gulf of Mexico.
Description of research conducted during the reporting period and milestones accomplished and/or completed
Sponsored and participated in the 2nd Annual Workshop to Coordinate Gulf of Mexico Hypoxic Zone Research 31 March -1 April, 2011 in order to develop research plans.
Description of significant research results, protocols developed, and research transitions
Improved university, federal and state agency coordination of monitoring and modeling for the 2011 Gulf Hypoxic Zone and beyond and facilitated management of the Hypoxic Zone by identifying research findings for incorporation into the Gulf Hypoxia Task Force Annual Progress Report and Annual Operating Plans.
Information on collaborators / partners: a. Name of collaborating organization: Buck Sutter, National Marine Fisheries Service b. Date collaborating established: Jul 1, 2008 c. Does partner provide monetary supposrt to project? Amount of support? Yes, $300,000
24
NGI Progress Report NOAA Award #: NA06OAR4320264
Reporting Period: Jul 1, 2010 - Jun 30, 2011
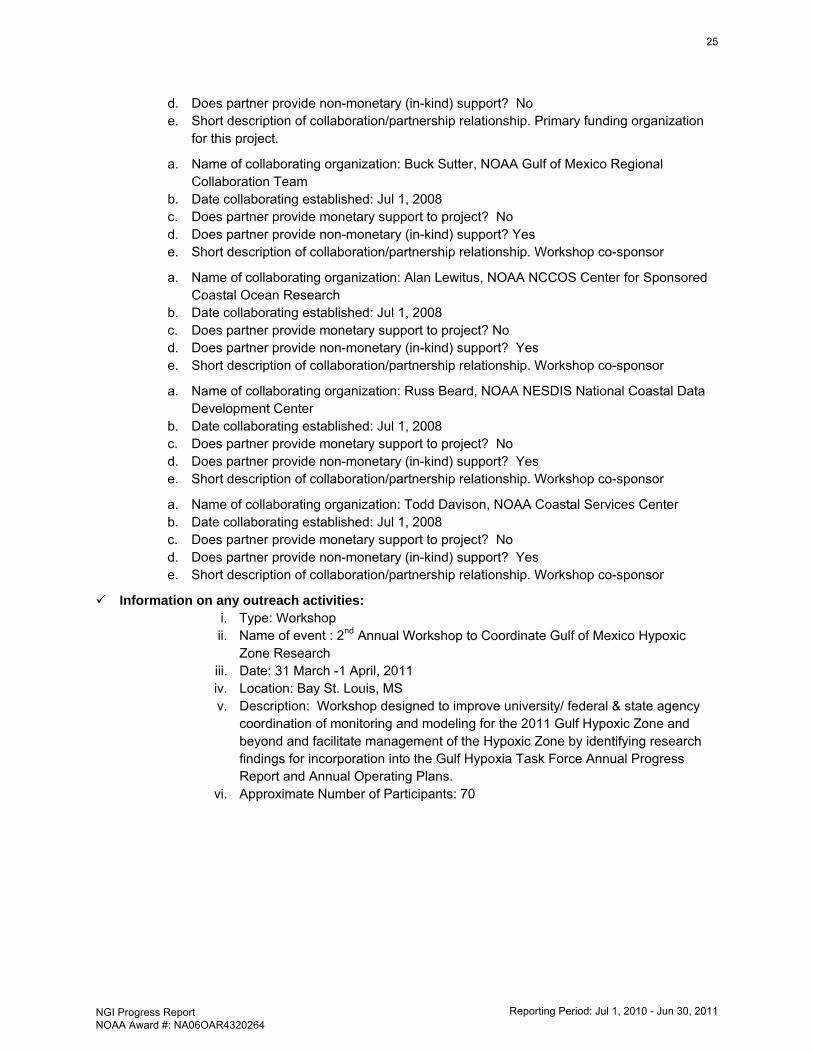
d. Does partner provide non-monetary (in-kind) support? No e. Short description of collaboration/partnership relationship. Primary funding organization
for this project.
a. Name of collaborating organization: Buck Sutter, NOAA Gulf of Mexico Regional Collaboration Team
b. Date collaborating established: Jul 1, 2008 c. Does partner provide monetary support to project? No d. Does partner provide non-monetary (in-kind) support? Yes e. Short description of collaboration/partnership relationship. Workshop co-sponsor
a. Name of collaborating organization: Alan Lewitus, NOAA NCCOS Center for Sponsored Coastal Ocean Research
b. Date collaborating established: Jul 1, 2008 c. Does partner provide monetary support to project? No d. Does partner provide non-monetary (in-kind) support? Yes e. Short description of collaboration/partnership relationship. Workshop co-sponsor
a. Name of collaborating organization: Russ Beard, NOAA NESDIS National Coastal Data Development Center
b. Date collaborating established: Jul 1, 2008 c. Does partner provide monetary support to project? No d. Does partner provide non-monetary (in-kind) support? Yes e. Short description of collaboration/partnership relationship. Workshop co-sponsor
a. Name of collaborating organization: Todd Davison, NOAA Coastal Services Center b. Date collaborating established: Jul 1, 2008 c. Does partner provide monetary support to project? No d. Does partner provide non-monetary (in-kind) support? Yes e. Short description of collaboration/partnership relationship. Workshop co-sponsor
Information on any outreach activities: i. Type: Workshop ii. Name of event : 2nd Annual Workshop to Coordinate Gulf of Mexico Hypoxic
Zone Research iii. Date: 31 March -1 April, 2011 iv. Location: Bay St. Louis, MS v. Description: Workshop designed to improve university/ federal & state agency
coordination of monitoring and modeling for the 2011 Gulf Hypoxic Zone and beyond and facilitate management of the Hypoxic Zone by identifying research findings for incorporation into the Gulf Hypoxia Task Force Annual Progress Report and Annual Operating Plans.
vi. Approximate Number of Participants: 70
25
NGI Progress Report NOAA Award #: NA06OAR4320264
Reporting Period: Jul 1, 2010 - Jun 30, 2011
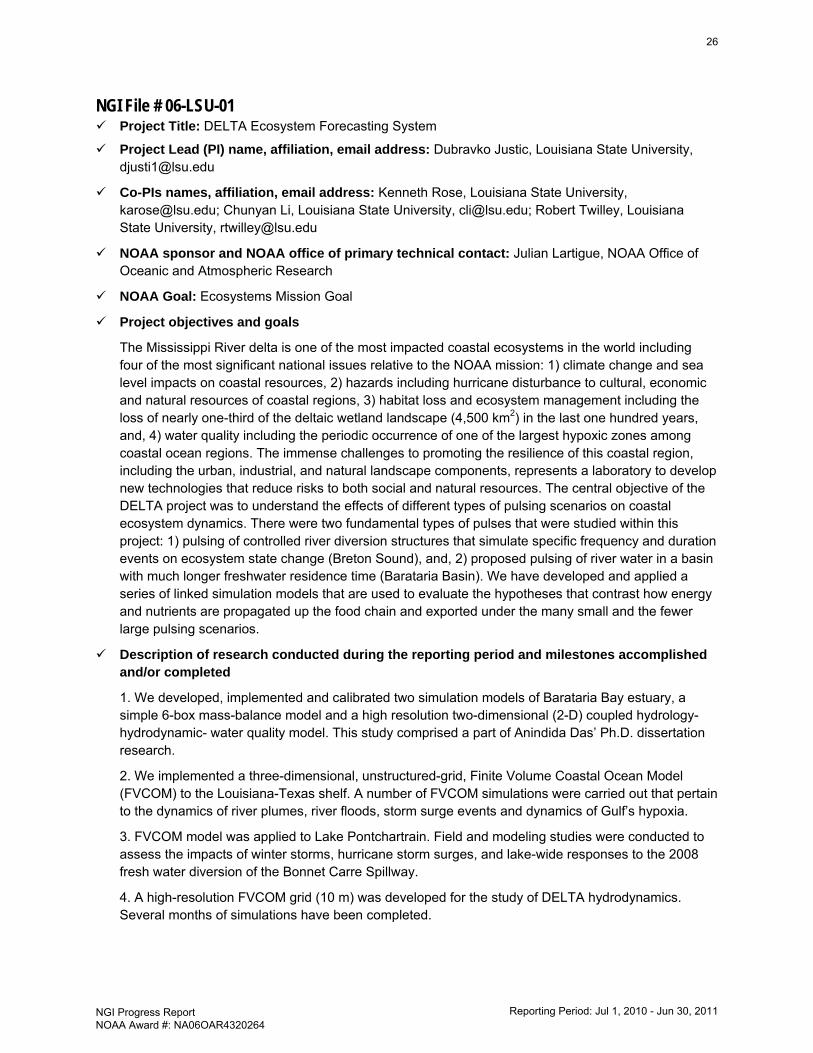
NGI File # 06-LSU-01 Project Title: DELTA Ecosystem Forecasting System
Project Lead (PI) name, affiliation, email address: Dubravko Justic, Louisiana State University, [email protected]
Co-PIs names, affiliation, email address: Kenneth Rose, Louisiana State University, [email protected]; Chunyan Li, Louisiana State University, [email protected]; Robert Twilley, Louisiana State University, [email protected]
NOAA sponsor and NOAA office of primary technical contact: Julian Lartigue, NOAA Office of Oceanic and Atmospheric Research
NOAA Goal: Ecosystems Mission Goal
Project objectives and goals
The Mississippi River delta is one of the most impacted coastal ecosystems in the world including four of the most significant national issues relative to the NOAA mission: 1) climate change and sea level impacts on coastal resources, 2) hazards including hurricane disturbance to cultural, economic and natural resources of coastal regions, 3) habitat loss and ecosystem management including the loss of nearly one-third of the deltaic wetland landscape (4,500 km2) in the last one hundred years, and, 4) water quality including the periodic occurrence of one of the largest hypoxic zones among coastal ocean regions. The immense challenges to promoting the resilience of this coastal region, including the urban, industrial, and natural landscape components, represents a laboratory to develop new technologies that reduce risks to both social and natural resources. The central objective of the DELTA project was to understand the effects of different types of pulsing scenarios on coastal ecosystem dynamics. There were two fundamental types of pulses that were studied within this project: 1) pulsing of controlled river diversion structures that simulate specific frequency and duration events on ecosystem state change (Breton Sound), and, 2) proposed pulsing of river water in a basin with much longer freshwater residence time (Barataria Basin). We have developed and applied a series of linked simulation models that are used to evaluate the hypotheses that contrast how energy and nutrients are propagated up the food chain and exported under the many small and the fewer large pulsing scenarios.
Description of research conducted during the reporting period and milestones accomplished and/or completed
1. We developed, implemented and calibrated two simulation models of Barataria Bay estuary, a simple 6-box mass-balance model and a high resolution two-dimensional (2-D) coupled hydrology-hydrodynamic- water quality model. This study comprised a part of Anindida Das’ Ph.D. dissertation research.
2. We implemented a three-dimensional, unstructured-grid, Finite Volume Coastal Ocean Model (FVCOM) to the Louisiana-Texas shelf. A number of FVCOM simulations were carried out that pertain to the dynamics of river plumes, river floods, storm surge events and dynamics of Gulf’s hypoxia.
3. FVCOM model was applied to Lake Pontchartrain. Field and modeling studies were conducted to assess the impacts of winter storms, hurricane storm surges, and lake-wide responses to the 2008 fresh water diversion of the Bonnet Carre Spillway.
4. A high-resolution FVCOM grid (10 m) was developed for the study of DELTA hydrodynamics. Several months of simulations have been completed.
26
NGI Progress Report NOAA Award #: NA06OAR4320264
Reporting Period: Jul 1, 2010 - Jun 30, 2011
5. Several FVCOM applications for storm surge simulations were developed by a graduate student J. Rego (see publication and conference presentation list). In addition, a new FVCOM model for storm surge simulations was developed and tested. We completed 45-day simulation of tidal forcing and 15-day simulation of storm surges caused by Hurricane Gustav.
6. We updated and expanded the marsh community individual-based model (IBM) to use time varying water levels, and added salinity as variable that affects the metabolism of individuals. We preformed preliminary testing of the model by using FVCOM output as input to the marsh IBM.
7. Kim DeMutsert, who was partially supported by this project, examined effects of the Caernarvon freshwater diversion on nekton in Breton Sound as a part of her Ph.D. dissertation.
Description of significant research results, protocols developed, and research transitions
1. Box and 2-D model results indicated that Barataria Bay estuary imports nitrogen and exports carbon to the coastal ocean. The mean calculated tidal water discharge of 6,930 m3 s-1 is equivalent to about 43 % of the lower Mississippi River discharge. The annual TOC export is 109 million kg, or 57 gC m2 yr-1 when prorated to the total water area of the estuary. This carbon export is equivalent to a loss of 0.5 m of wetland soil horizon over an area of 8.4 km2, and accounts for about 34 % of the observed annual wetland loss in the estuary between 1978 and 2000. Compared to the lower Mississippi River, the Barataria estuary appears to be a very small source of TOC for the northern Gulf of Mexico (2.7 % of riverine TOC), and is unlikely to have a significant influence on the development of the Gulf’s hypoxia. Tracer simulation experiments have shown that residence times differ markedly at different locations within the same water body due to differences in small scale hydrodynamics. Model simulations also pointed out the differences in spatial patterns in phytoplankton response to distributed freshwater and nutrient inflows, reflecting the near-field control of nutrients and far-field control of residence times on phytoplankton standing stock.
2. FVCOM model accurately described the offshore circulation mode generated over the Louisiana-Texas shelf by the westerly winds during summer months, as well as the prevalent westward flow along the coast caused by the easterly winds during the rest of the study period. The seasonal cycle of stratification was also well represented by the model. During 2002, stratification was initiated in early spring and subsequently enhanced by the intensity and phasing of riverine freshwater discharges. Strong stratification persisted throughout the summer and was finally broken down in September by tropical storms. The model simulations also revealed a quasi-permanent anticyclonic gyre in the Louisiana Bight region formed by the rotational transformation of the Mississippi River plume, whose existence during 2002 was supported by satellite imagery and ADCP current measurements. Model simulations support the conclusion that local wind forcing and buoyancy flux resulting from riverine freshwater discharges were the dominant mechanisms affecting the circulation and stratification over the inner Louisiana-Texas shelf. Good agreement between model results and observations suggests that the model accurately reproduces physical conditions in the region that are highly relevant for hypoxia development. Using trajectories of Lagrangian particles released from the Mississippi and Atchafalaya rivers we were able to delineate the regions of strong riverine influence under different wind forcing. We also showed that the frequency of cold fronts strongly influences the seasonal cycle of water column stratification.
3. Using a Before-After-Control-Impact study, DeMutsert demonstrated that nekton species biomass distributions (SBD) changed significantly after the opening of the Caernarvon freshwater diversion 1991. The biomass of selected economically or ecologically important species showed an increase relative to the control (Micropterus salmoides, Micropogonias undulatus, Brevoortia patronus, Farfantepenaeus aztecus and Litopenaeus setiferus), and one was not affected (Cynoscion
27
NGI Progress Report NOAA Award #: NA06OAR4320264
Reporting Period: Jul 1, 2010 - Jun 30, 2011
nebulosus). In addition, nekton species richness, abundance and the proportion of smaller individuals increased, indicating increased nursery function.
Information on collaborators / partners:
This Project was coordinated with the DELTA observation system developed with funding from a Shell grant to LSU. The observation system included physical, chemical and biological information from fixed platforms and surveys (monthly) along the axis of Breton and Barataria estuaries, as well as paired wetland sites. The information from this observation system complemented the existing regional monitoring programs (e.g., National Coastal Assessment, Gulf Coast Ocean Observing System; SURA Coastal Ocean Observing Program; Ocean.US), statewide monitoring programs (e.g., USGS, USACE, LDEQ, LDWF, WAVCIS) and program-specific monitoring programs (e.g., CWPPRA, NRDA).
Information on any outreach activities: Project PIs contributed to community outreach by participating in stakeholder meetings, such as the Caernarvon Interagency Advisory Committee (CIAC), whose members represent all major stakeholders of the region. CIAC members include fishery representatives (oyster, shrimp, and recreational fishers), representatives of local governments, local landowners who care about the environment, and natural resource agencies (LA Depts. of Wildlife and Fisheries, Natural Resources (DNR), Environmental Quality, and Health and Human Resources; and US Fish and Wildlife Service, National Marine Fisheries Service, EPA, and Army Corps of Engineers). The project also advanced the educational missions of Louisiana State University by enhancing its land-grant and sea-grant institution status. The Louisiana Sea Grant Program annually sponsors “Ocean Commotion”, which brings more than 3,400 area students and teachers to LSU to learn about our coast and sea. Project results contributed to this program by demonstrating how high-end computing is used in ecosystem management.
28
NGI Progress Report NOAA Award #: NA06OAR4320264
Reporting Period: Jul 1, 2010 - Jun 30, 2011
NGI File # 06-LSU-02 Project Title: Public Health and Stressors
Project Lead (PI) name, affiliation, email address: Sibel Bargu Ates, Louisiana Dept. of Oceanography and Coastal Science, [email protected]
Co-PIs names, affiliation, email address: Brian Fry, Louisiana Dept. of Oceanography and Coastal Science, [email protected]; R. Eugene Turner, Louisiana Dept. of Oceanography and Coastal Science, [email protected]; Aixin Hou, Louisiana Dept. of Environmental Science, [email protected]
NOAA sponsor and NOAA office of primary technical contact: Julian Lartigue, NOAA Office of Oceanic and Atmospheric Research
NOAA Goals: Ecosystems Mission Goal, Climate Mission Goal, Weather and Water Mission Goal
Project objectives and goals
Changing hydrologic regimes and nutrient loadings in coastal waters may impact ecosystem restoration and public health. Large rivers like the Mississippi can have a significant impact on biological processes in the coastal zone and shifts in nutrients within estuaries may promote growth of potentially toxic algal species. Our research focus was on planktonic community structure and function, measuring particulate organic matter (POM) composition, microbial respiration and algal growth rates, and harmful algal blooms (HABs) and increased waterborne pathogens such as Vibrio sp. bacteria along transects in two Louisiana estuaries, Barataria Bay and Breton Sound. These estuaries are targeted for restoration by increased inputs of Mississippi River water, and our research will help test effectiveness of the river restoration strategy.
Description of research conducted during the reporting period and milestones accomplished and/or completed
1. Fry Lab: POM dynamics for Barataria Bay were summarized for an 8 year period of record, and relatively constant biomass patterns between seasons and years was found. The annual averages vary 1-1.5x, a small range, and the seasonal averages varied a bit more, 1-2.5x, with summer having more phytoplankton than winter (October-November). C/N ratios were used to separate contributions of phytoplankton (C/N = 6.6, redfield) and sediments (C/N =15) (Figure 6). There was really no significant difference between years in phytoplankton carbon, and only any marginally significant difference between seasons. Light limitation of phytoplankton growth may account for these relatively constant POM patterns across years. Cyanobacteria were regularly enriched in 13C and depleted 15N, providing a good diagnostic for conditions when cyanobacteria dominate. These signals occurred regularly in Lac Des Allemands and in the 2-5psu lakes in Caernarvon.
New data were also analyzed to help budget what was happening to Mississippi River nitrate that was entering upper Breton Sound at Caernarvon. The data suggest that phytoplankton uptake is likely the major sink for nitrate at Caernarvon. The strongest biological uptake signals occurred in July at moderate residence times (and presumably moderate river flows) (Figure 7). Strong DO spikes and DIC sags at station 4 (eastern Lake Leary) (data is not shown) demonstrated that a large phytoplankton bloom developed, and using Redfield stoichiomety, the estimate for phytoplankton uptake is about 60% of the total nitrate lost. This is probably a minimum estimate because hydrology is dispersing some of the bloom signals. Macrophyte uptake probably is also very important in Lake Leary, accounting for the strong "estuarine filter" effect and about 100% nitrate removal unless diversion flows are very strong (as they were in April 2008).
29
NGI Progress Report NOAA Award #: NA06OAR4320264
Reporting Period: Jul 1, 2010 - Jun 30, 2011
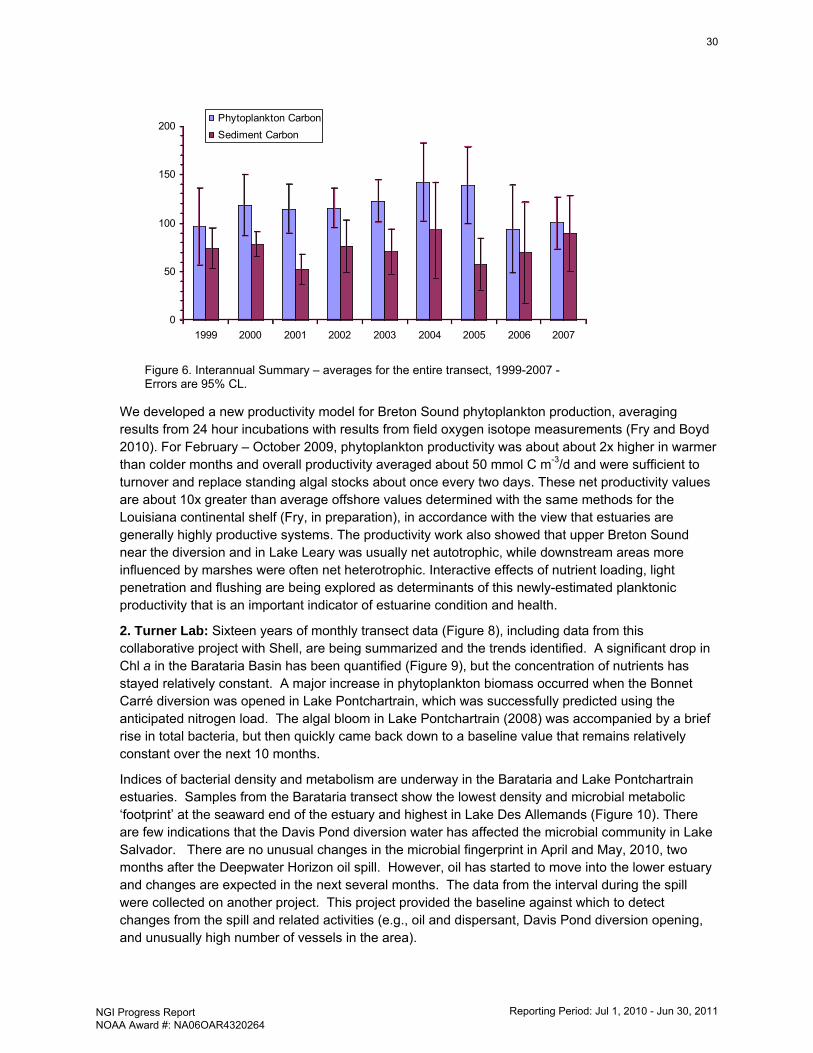
We developed a new productivity model for Breton Sound phytoplankton production, averaging results from 24 hour incubations with results from field oxygen isotope measurements (Fry and Boyd 2010). For February – October 2009, phytoplankton productivity was about about 2x higher in warmer than colder months and overall productivity averaged about 50 mmol C m-3/d and were sufficient to turnover and replace standing algal stocks about once every two days. These net productivity values are about 10x greater than average offshore values determined with the same methods for the Louisiana continental shelf (Fry, in preparation), in accordance with the view that estuaries are generally highly productive systems. The productivity work also showed that upper Breton Sound near the diversion and in Lake Leary was usually net autotrophic, while downstream areas more influenced by marshes were often net heterotrophic. Interactive effects of nutrient loading, light penetration and flushing are being explored as determinants of this newly-estimated planktonic productivity that is an important indicator of estuarine condition and health.
2. Turner Lab: Sixteen years of monthly transect data (Figure 8), including data from this collaborative project with Shell, are being summarized and the trends identified. A significant drop in Chl a in the Barataria Basin has been quantified (Figure 9), but the concentration of nutrients has stayed relatively constant. A major increase in phytoplankton biomass occurred when the Bonnet Carré diversion was opened in Lake Pontchartrain, which was successfully predicted using the anticipated nitrogen load. The algal bloom in Lake Pontchartrain (2008) was accompanied by a brief rise in total bacteria, but then quickly came back down to a baseline value that remains relatively constant over the next 10 months.
Indices of bacterial density and metabolism are underway in the Barataria and Lake Pontchartrain estuaries. Samples from the Barataria transect show the lowest density and microbial metabolic ‘footprint’ at the seaward end of the estuary and highest in Lake Des Allemands (Figure 10). There are few indications that the Davis Pond diversion water has affected the microbial community in Lake Salvador. There are no unusual changes in the microbial fingerprint in April and May, 2010, two months after the Deepwater Horizon oil spill. However, oil has started to move into the lower estuary and changes are expected in the next several months. The data from the interval during the spill were collected on another project. This project provided the baseline against which to detect changes from the spill and related activities (e.g., oil and dispersant, Davis Pond diversion opening, and unusually high number of vessels in the area).
0
50
100
150
200
1999 2000 2001 2002 2003 2004 2005 2006 2007
Phytoplankton CarbonSediment Carbon
Figure 6. Interannual Summary – averages for the entire transect, 1999-2007 - Errors are 95% CL.
30
NGI Progress Report NOAA Award #: NA06OAR4320264
Reporting Period: Jul 1, 2010 - Jun 30, 2011
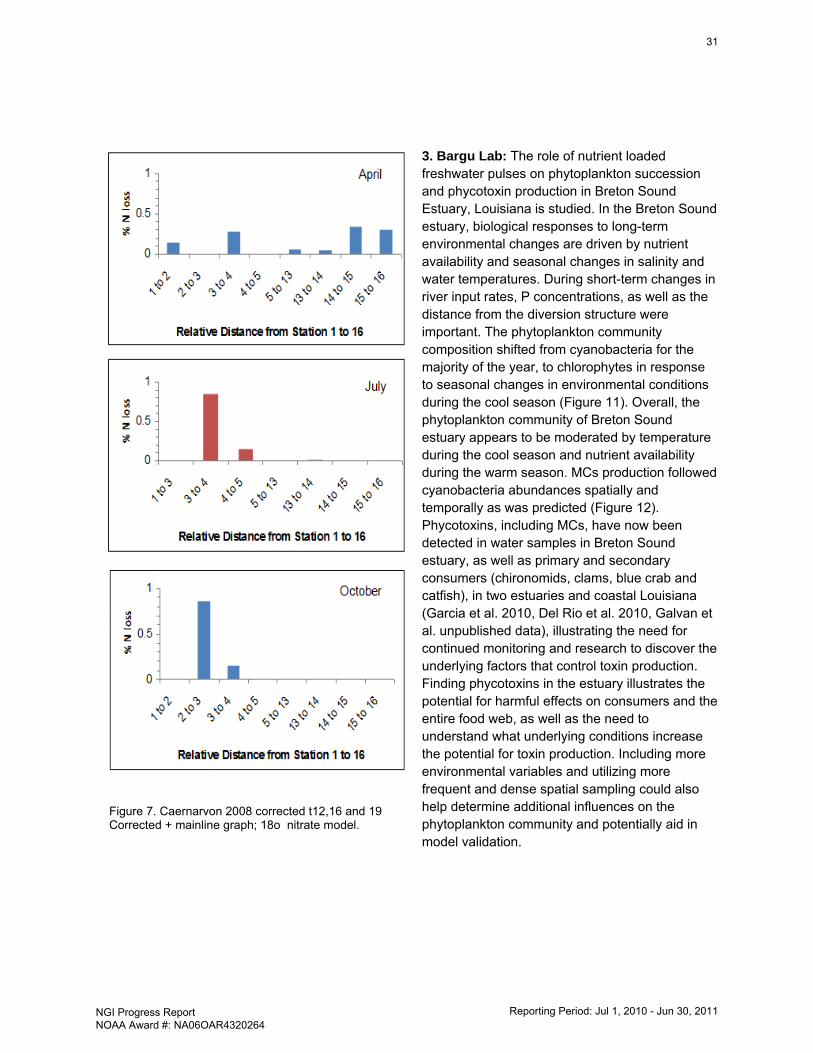
3. Bargu Lab: The role of nutrient loaded freshwater pulses on phytoplankton succession and phycotoxin production in Breton Sound Estuary, Louisiana is studied. In the Breton Sound estuary, biological responses to long-term environmental changes are driven by nutrient availability and seasonal changes in salinity and water temperatures. During short-term changes in river input rates, P concentrations, as well as the distance from the diversion structure were important. The phytoplankton community composition shifted from cyanobacteria for the majority of the year, to chlorophytes in response to seasonal changes in environmental conditions during the cool season (Figure 11). Overall, the phytoplankton community of Breton Sound estuary appears to be moderated by temperature during the cool season and nutrient availability during the warm season. MCs production followed cyanobacteria abundances spatially and temporally as was predicted (Figure 12). Phycotoxins, including MCs, have now been detected in water samples in Breton Sound estuary, as well as primary and secondary consumers (chironomids, clams, blue crab and catfish), in two estuaries and coastal Louisiana (Garcia et al. 2010, Del Rio et al. 2010, Galvan et al. unpublished data), illustrating the need for continued monitoring and research to discover the underlying factors that control toxin production. Finding phycotoxins in the estuary illustrates the potential for harmful effects on consumers and the entire food web, as well as the need to understand what underlying conditions increase the potential for toxin production. Including more environmental variables and utilizing more frequent and dense spatial sampling could also help determine additional influences on the phytoplankton community and potentially aid in model validation.
Figure 7. Caernarvon 2008 corrected t12,16 and 19 Corrected + mainline graph; 18o nitrate model.
31
NGI Progress Report NOAA Award #: NA06OAR4320264
Reporting Period: Jul 1, 2010 - Jun 30, 2011
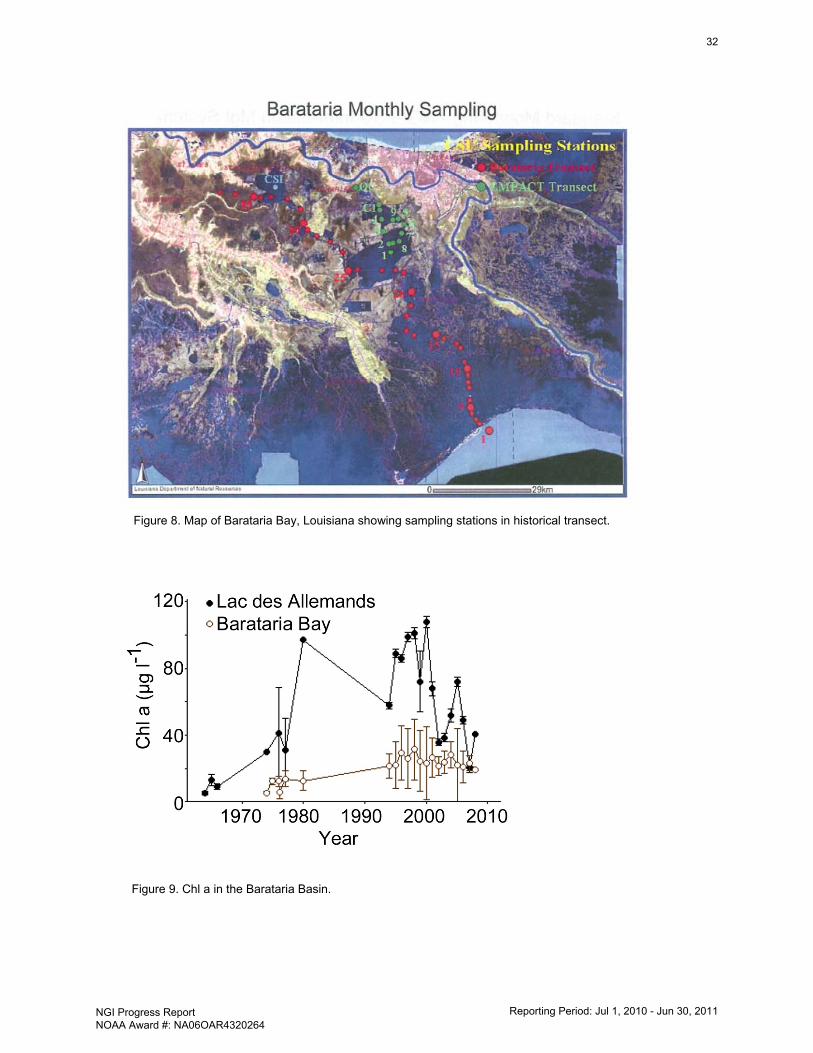
Figure 9. Chl a in the Barataria Basin.
Figure 8. Map of Barataria Bay, Louisiana showing sampling stations in historical transect.
32
NGI Progress Report NOAA Award #: NA06OAR4320264
Reporting Period: Jul 1, 2010 - Jun 30, 2011
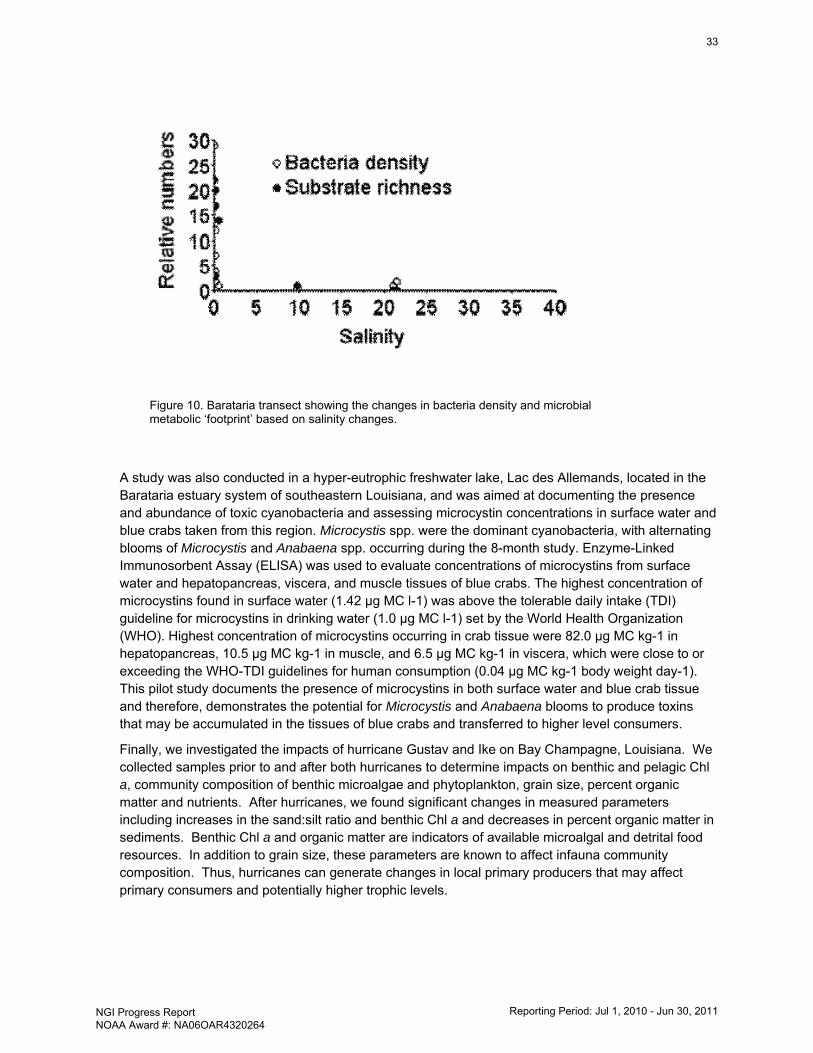
Figure 10. Barataria transect showing the changes in bacteria density and microbial metabolic ‘footprint’ based on salinity changes.
A study was also conducted in a hyper-eutrophic freshwater lake, Lac des Allemands, located in the Barataria estuary system of southeastern Louisiana, and was aimed at documenting the presence and abundance of toxic cyanobacteria and assessing microcystin concentrations in surface water and blue crabs taken from this region. Microcystis spp. were the dominant cyanobacteria, with alternating blooms of Microcystis and Anabaena spp. occurring during the 8-month study. Enzyme-Linked Immunosorbent Assay (ELISA) was used to evaluate concentrations of microcystins from surface water and hepatopancreas, viscera, and muscle tissues of blue crabs. The highest concentration of microcystins found in surface water (1.42 μg MC l-1) was above the tolerable daily intake (TDI) guideline for microcystins in drinking water (1.0 μg MC l-1) set by the World Health Organization (WHO). Highest concentration of microcystins occurring in crab tissue were 82.0 μg MC kg-1 in hepatopancreas, 10.5 μg MC kg-1 in muscle, and 6.5 μg MC kg-1 in viscera, which were close to or exceeding the WHO-TDI guidelines for human consumption (0.04 μg MC kg-1 body weight day-1). This pilot study documents the presence of microcystins in both surface water and blue crab tissue and therefore, demonstrates the potential for Microcystis and Anabaena blooms to produce toxins that may be accumulated in the tissues of blue crabs and transferred to higher level consumers.
Finally, we investigated the impacts of hurricane Gustav and Ike on Bay Champagne, Louisiana. We collected samples prior to and after both hurricanes to determine impacts on benthic and pelagic Chl a, community composition of benthic microalgae and phytoplankton, grain size, percent organic matter and nutrients. After hurricanes, we found significant changes in measured parameters including increases in the sand:silt ratio and benthic Chl a and decreases in percent organic matter in sediments. Benthic Chl a and organic matter are indicators of available microalgal and detrital food resources. In addition to grain size, these parameters are known to affect infauna community composition. Thus, hurricanes can generate changes in local primary producers that may affect primary consumers and potentially higher trophic levels.
33
NGI Progress Report NOAA Award #: NA06OAR4320264
Reporting Period: Jul 1, 2010 - Jun 30, 2011
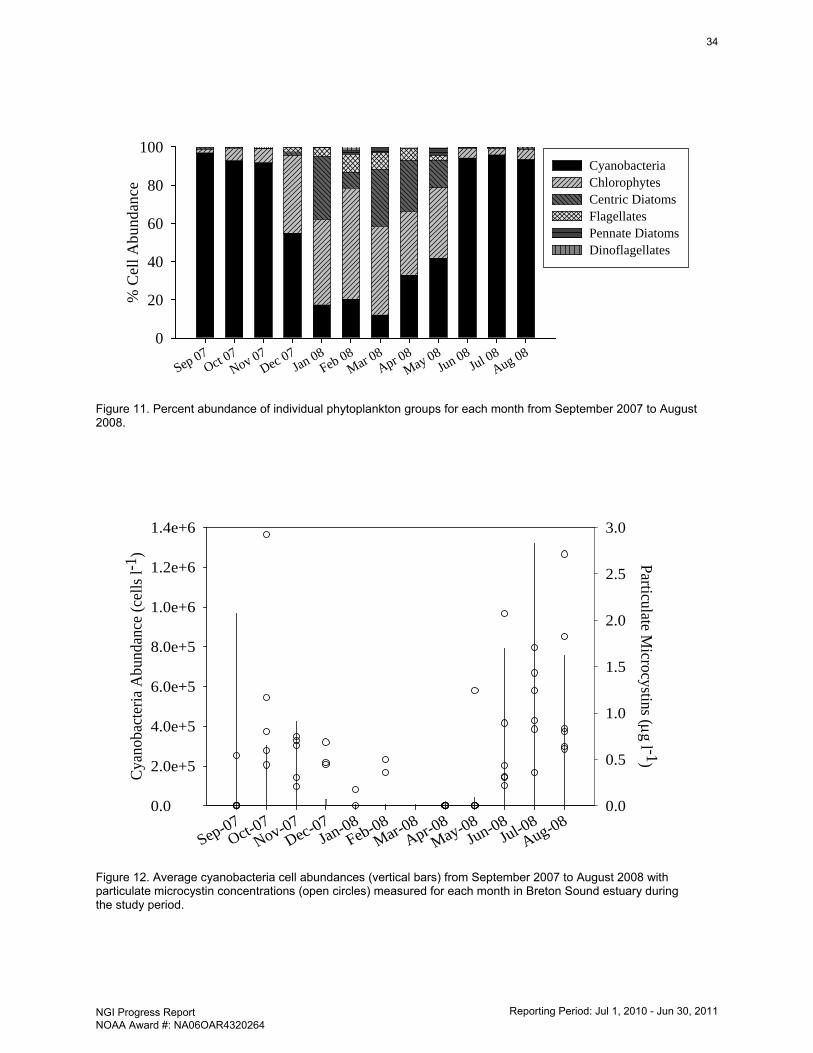
Sep 07Oct 07
Nov 07Dec 07
Jan 08Feb 08
Mar 08Apr 08
May 08Jun 08
Jul 08Aug 08
% C
ell A
bund
ance
0
20
40
60
80
100CyanobacteriaChlorophytesCentric DiatomsFlagellatesPennate DiatomsDinoflagellates
Figure 11. Percent abundance of individual phytoplankton groups for each month from September 2007 to August 2008.
Sep-07Oct-07
Nov-07Dec-07
Jan-08Feb-08
Mar-08Apr-08
May-08Jun-08
Jul-08Aug-08
Cyan
obac
teria
Abu
ndan
ce (c
ells
l-1)
0.0
2.0e+5
4.0e+5
6.0e+5
8.0e+5
1.0e+6
1.2e+6
1.4e+6
Particulate Microcystins (µ g l -1)
0.0
0.5
1.0
1.5
2.0
2.5
3.0
Figure 12. Average cyanobacteria cell abundances (vertical bars) from September 2007 to August 2008 with particulate microcystin concentrations (open circles) measured for each month in Breton Sound estuary during the study period.
34
NGI Progress Report NOAA Award #: NA06OAR4320264
Reporting Period: Jul 1, 2010 - Jun 30, 2011
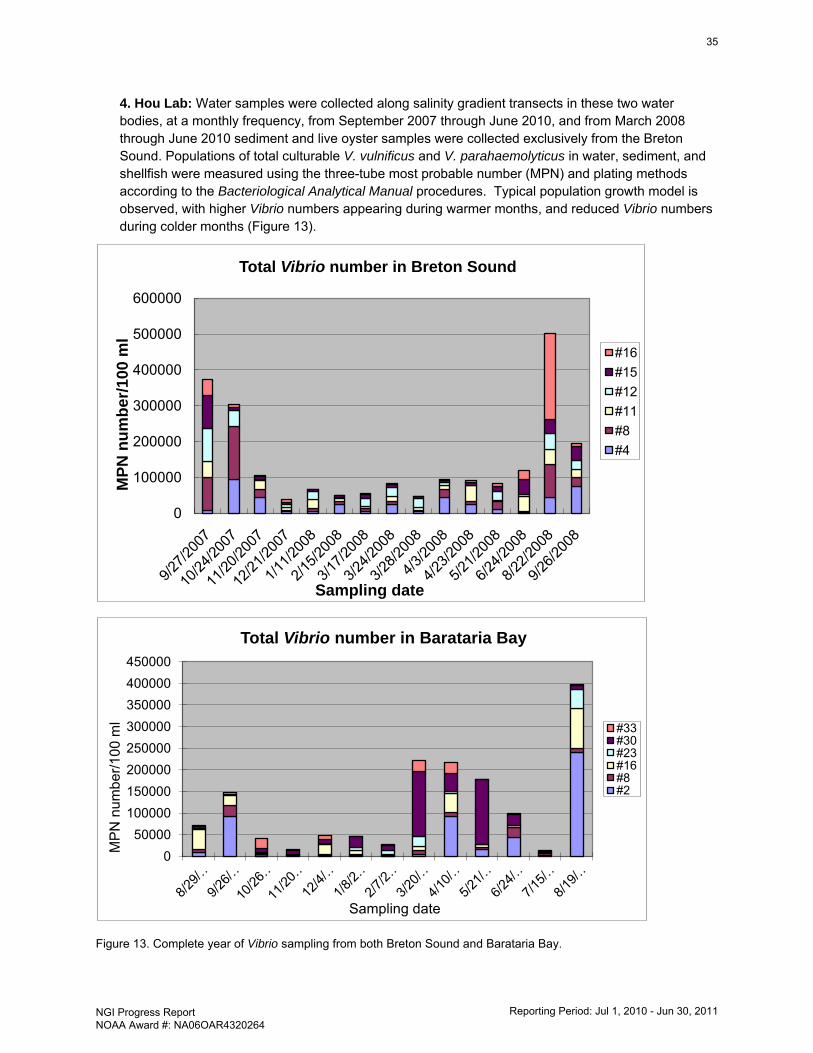
4. Hou Lab: Water samples were collected along salinity gradient transects in these two water bodies, at a monthly frequency, from September 2007 through June 2010, and from March 2008 through June 2010 sediment and live oyster samples were collected exclusively from the Breton Sound. Populations of total culturable V. vulnificus and V. parahaemolyticus in water, sediment, and shellfish were measured using the three-tube most probable number (MPN) and plating methods according to the Bacteriological Analytical Manual procedures. Typical population growth model is observed, with higher Vibrio numbers appearing during warmer months, and reduced Vibrio numbers during colder months (Figure 13).
Figure 13. Complete year of Vibrio sampling from both Breton Sound and Barataria Bay.
0
100000
200000
300000
400000
500000
600000
MPN
num
ber/1
00 m
l
Sampling date
Total Vibrio number in Breton Sound
#16#15#12#11#8#4
050000
100000150000200000250000300000350000400000450000
MPN
num
ber/1
00 m
l
Sampling date
Total Vibrio number in Barataria Bay
#33#30#23#16#8#2
35
NGI Progress Report NOAA Award #: NA06OAR4320264
Reporting Period: Jul 1, 2010 - Jun 30, 2011
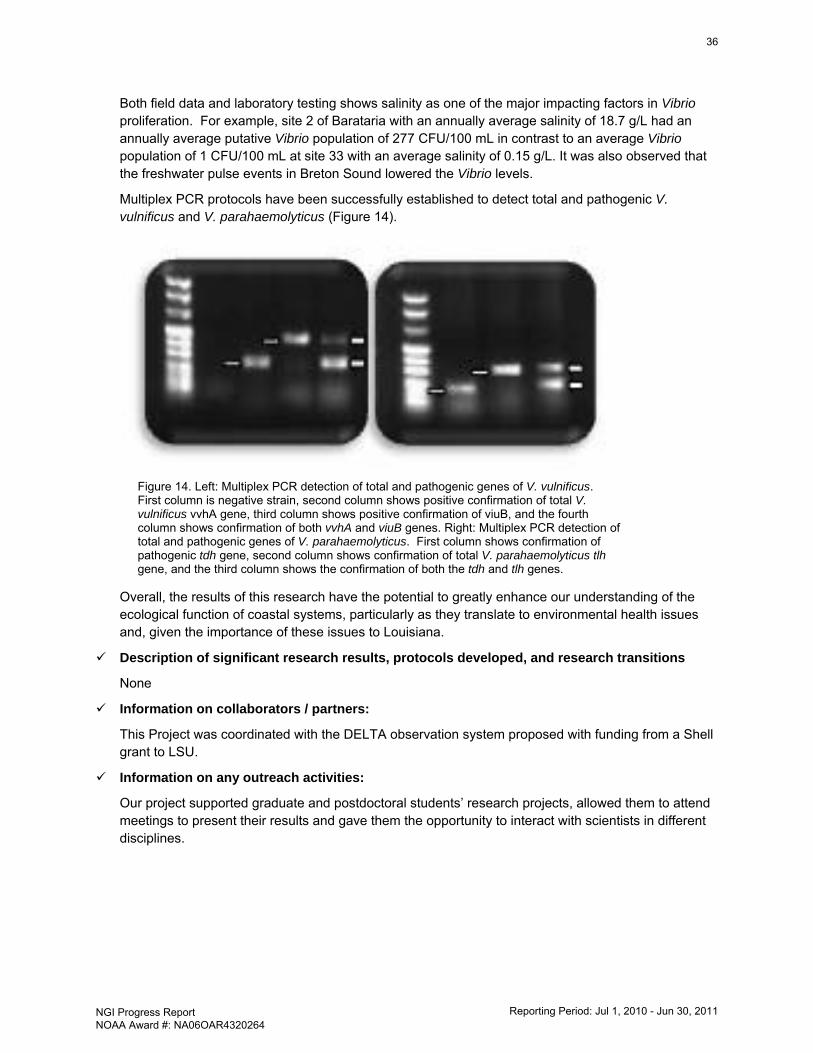
Both field data and laboratory testing shows salinity as one of the major impacting factors in Vibrio proliferation. For example, site 2 of Barataria with an annually average salinity of 18.7 g/L had an annually average putative Vibrio population of 277 CFU/100 mL in contrast to an average Vibrio population of 1 CFU/100 mL at site 33 with an average salinity of 0.15 g/L. It was also observed that the freshwater pulse events in Breton Sound lowered the Vibrio levels.
Multiplex PCR protocols have been successfully established to detect total and pathogenic V. vulnificus and V. parahaemolyticus (Figure 14).
Figure 14. Left: Multiplex PCR detection of total and pathogenic genes of V. vulnificus. First column is negative strain, second column shows positive confirmation of total V. vulnificus vvhA gene, third column shows positive confirmation of viuB, and the fourth column shows confirmation of both vvhA and viuB genes. Right: Multiplex PCR detection of total and pathogenic genes of V. parahaemolyticus. First column shows confirmation of pathogenic tdh gene, second column shows confirmation of total V. parahaemolyticus tlh gene, and the third column shows the confirmation of both the tdh and tlh genes.
Overall, the results of this research have the potential to greatly enhance our understanding of the ecological function of coastal systems, particularly as they translate to environmental health issues and, given the importance of these issues to Louisiana.
Description of significant research results, protocols developed, and research transitions
None
Information on collaborators / partners:
This Project was coordinated with the DELTA observation system proposed with funding from a Shell grant to LSU.
Information on any outreach activities:
Our project supported graduate and postdoctoral students’ research projects, allowed them to attend meetings to present their results and gave them the opportunity to interact with scientists in different disciplines.
36
NGI Progress Report NOAA Award #: NA06OAR4320264
Reporting Period: Jul 1, 2010 - Jun 30, 2011
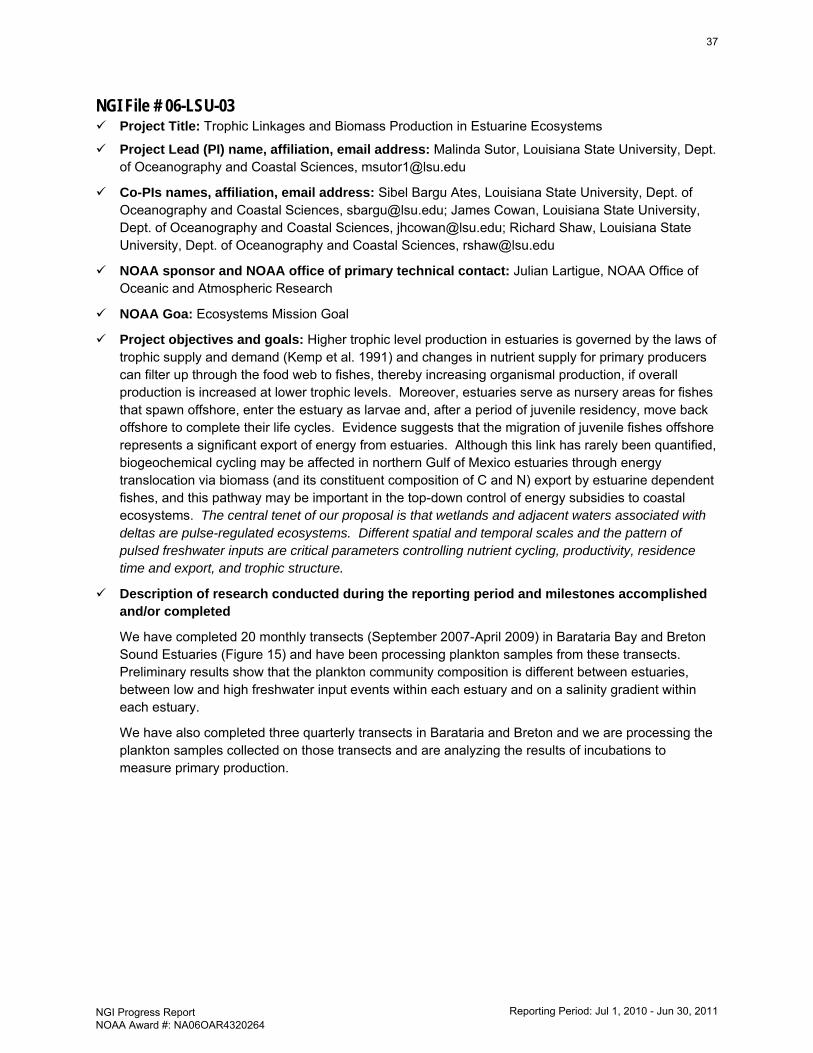
NGI File # 06-LSU-03 Project Title: Trophic Linkages and Biomass Production in Estuarine Ecosystems
Project Lead (PI) name, affiliation, email address: Malinda Sutor, Louisiana State University, Dept. of Oceanography and Coastal Sciences, [email protected]
Co-PIs names, affiliation, email address: Sibel Bargu Ates, Louisiana State University, Dept. of Oceanography and Coastal Sciences, [email protected]; James Cowan, Louisiana State University, Dept. of Oceanography and Coastal Sciences, [email protected]; Richard Shaw, Louisiana State University, Dept. of Oceanography and Coastal Sciences, [email protected]
NOAA sponsor and NOAA office of primary technical contact: Julian Lartigue, NOAA Office of Oceanic and Atmospheric Research
NOAA Goa: Ecosystems Mission Goal
Project objectives and goals: Higher trophic level production in estuaries is governed by the laws of trophic supply and demand (Kemp et al. 1991) and changes in nutrient supply for primary producers can filter up through the food web to fishes, thereby increasing organismal production, if overall production is increased at lower trophic levels. Moreover, estuaries serve as nursery areas for fishes that spawn offshore, enter the estuary as larvae and, after a period of juvenile residency, move back offshore to complete their life cycles. Evidence suggests that the migration of juvenile fishes offshore represents a significant export of energy from estuaries. Although this link has rarely been quantified, biogeochemical cycling may be affected in northern Gulf of Mexico estuaries through energy translocation via biomass (and its constituent composition of C and N) export by estuarine dependent fishes, and this pathway may be important in the top-down control of energy subsidies to coastal ecosystems. The central tenet of our proposal is that wetlands and adjacent waters associated with deltas are pulse-regulated ecosystems. Different spatial and temporal scales and the pattern of pulsed freshwater inputs are critical parameters controlling nutrient cycling, productivity, residence time and export, and trophic structure.
Description of research conducted during the reporting period and milestones accomplished and/or completed
We have completed 20 monthly transects (September 2007-April 2009) in Barataria Bay and Breton Sound Estuaries (Figure 15) and have been processing plankton samples from these transects. Preliminary results show that the plankton community composition is different between estuaries, between low and high freshwater input events within each estuary and on a salinity gradient within each estuary.
We have also completed three quarterly transects in Barataria and Breton and we are processing the plankton samples collected on those transects and are analyzing the results of incubations to measure primary production.
37
NGI Progress Report NOAA Award #: NA06OAR4320264
Reporting Period: Jul 1, 2010 - Jun 30, 2011
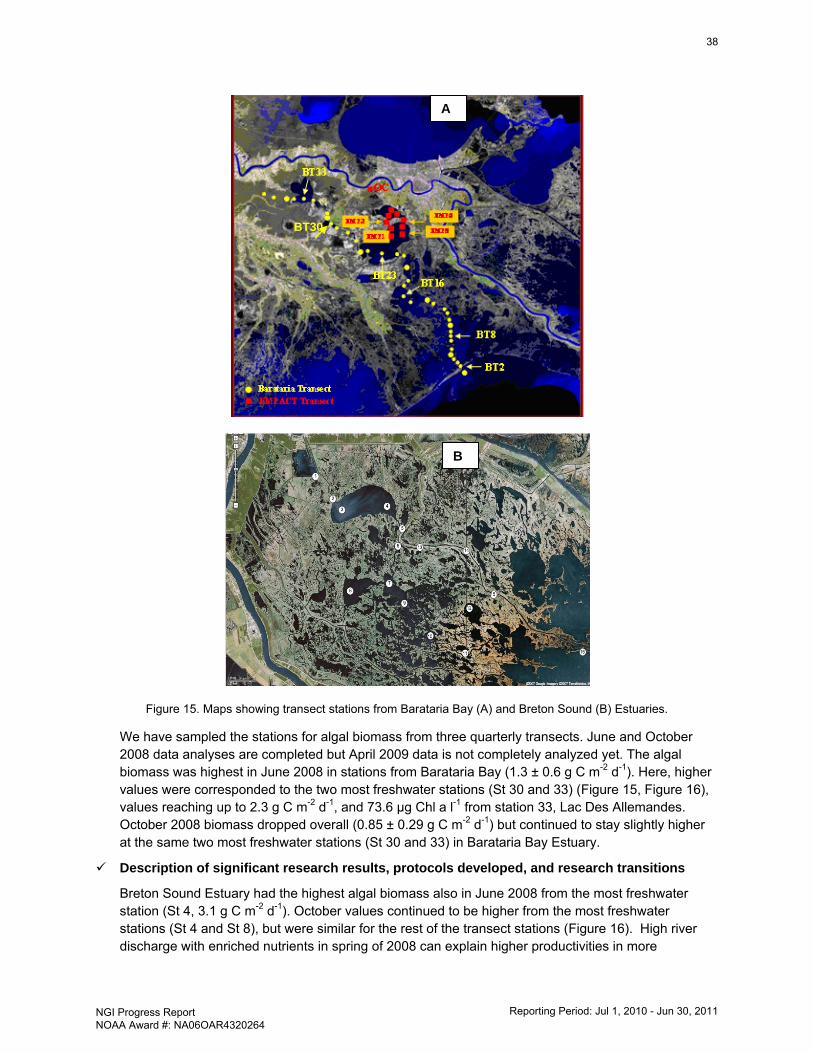
Figure 15. Maps showing transect stations from Barataria Bay (A) and Breton Sound (B) Estuaries.
We have sampled the stations for algal biomass from three quarterly transects. June and October 2008 data analyses are completed but April 2009 data is not completely analyzed yet. The algal biomass was highest in June 2008 in stations from Barataria Bay (1.3 ± 0.6 g C m-2 d-1). Here, higher values were corresponded to the two most freshwater stations (St 30 and 33) (Figure 15, Figure 16), values reaching up to 2.3 g C m-2 d-1, and 73.6 µg Chl a l-1 from station 33, Lac Des Allemandes. October 2008 biomass dropped overall (0.85 ± 0.29 g C m-2 d-1) but continued to stay slightly higher at the same two most freshwater stations (St 30 and 33) in Barataria Bay Estuary.
Description of significant research results, protocols developed, and research transitions
Breton Sound Estuary had the highest algal biomass also in June 2008 from the most freshwater station (St 4, 3.1 g C m-2 d-1). October values continued to be higher from the most freshwater stations (St 4 and St 8), but were similar for the rest of the transect stations (Figure 16). High river discharge with enriched nutrients in spring of 2008 can explain higher productivities in more
A
B
BT30
38
NGI Progress Report NOAA Award #: NA06OAR4320264
Reporting Period: Jul 1, 2010 - Jun 30, 2011
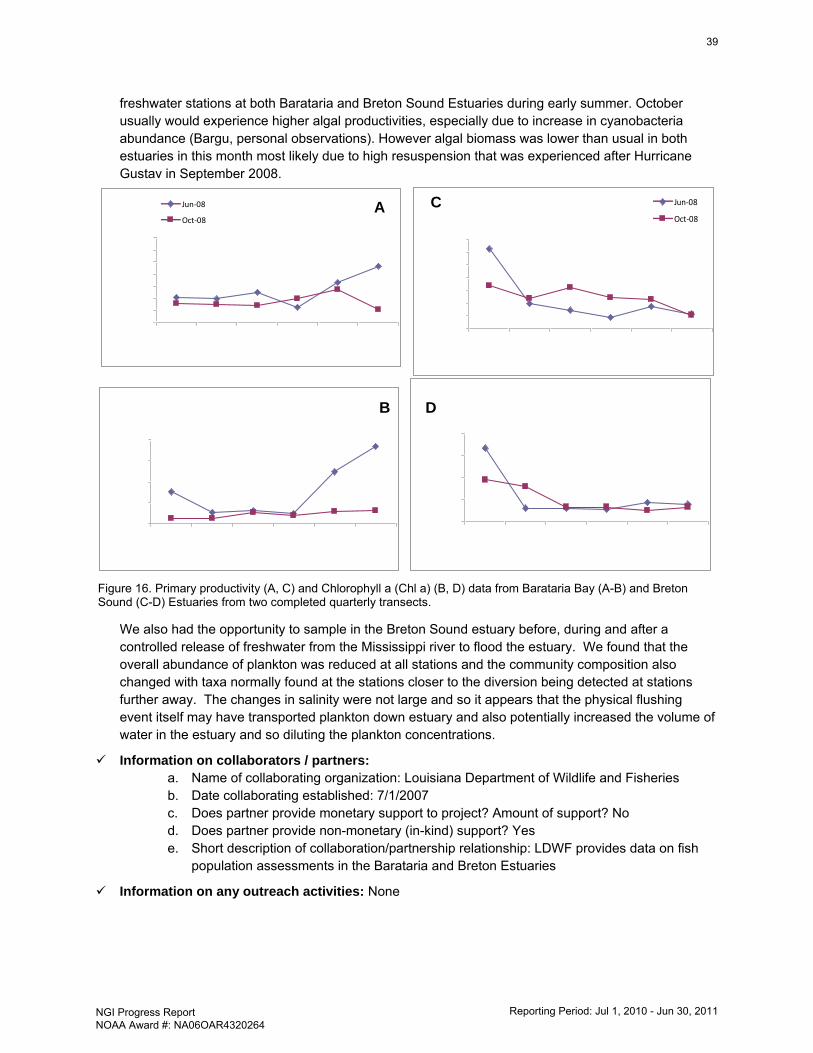
freshwater stations at both Barataria and Breton Sound Estuaries during early summer. October usually would experience higher algal productivities, especially due to increase in cyanobacteria abundance (Bargu, personal observations). However algal biomass was lower than usual in both estuaries in this month most likely due to high resuspension that was experienced after Hurricane Gustav in September 2008.
We also had the opportunity to sample in the Breton Sound estuary before, during and after a controlled release of freshwater from the Mississippi river to flood the estuary. We found that the overall abundance of plankton was reduced at all stations and the community composition also changed with taxa normally found at the stations closer to the diversion being detected at stations further away. The changes in salinity were not large and so it appears that the physical flushing event itself may have transported plankton down estuary and also potentially increased the volume of water in the estuary and so diluting the plankton concentrations.
Information on collaborators / partners: a. Name of collaborating organization: Louisiana Department of Wildlife and Fisheries b. Date collaborating established: 7/1/2007 c. Does partner provide monetary support to project? Amount of support? No d. Does partner provide non-monetary (in-kind) support? Yes e. Short description of collaboration/partnership relationship: LDWF provides data on fish
population assessments in the Barataria and Breton Estuaries
Information on any outreach activities: None
Jun-08
Oct-08
Jun-08
Oct-08A
B
C
D
Figure 16. Primary productivity (A, C) and Chlorophyll a (Chl a) (B, D) data from Barataria Bay (A-B) and Breton Sound (C-D) Estuaries from two completed quarterly transects.
39
NGI Progress Report NOAA Award #: NA06OAR4320264
Reporting Period: Jul 1, 2010 - Jun 30, 2011
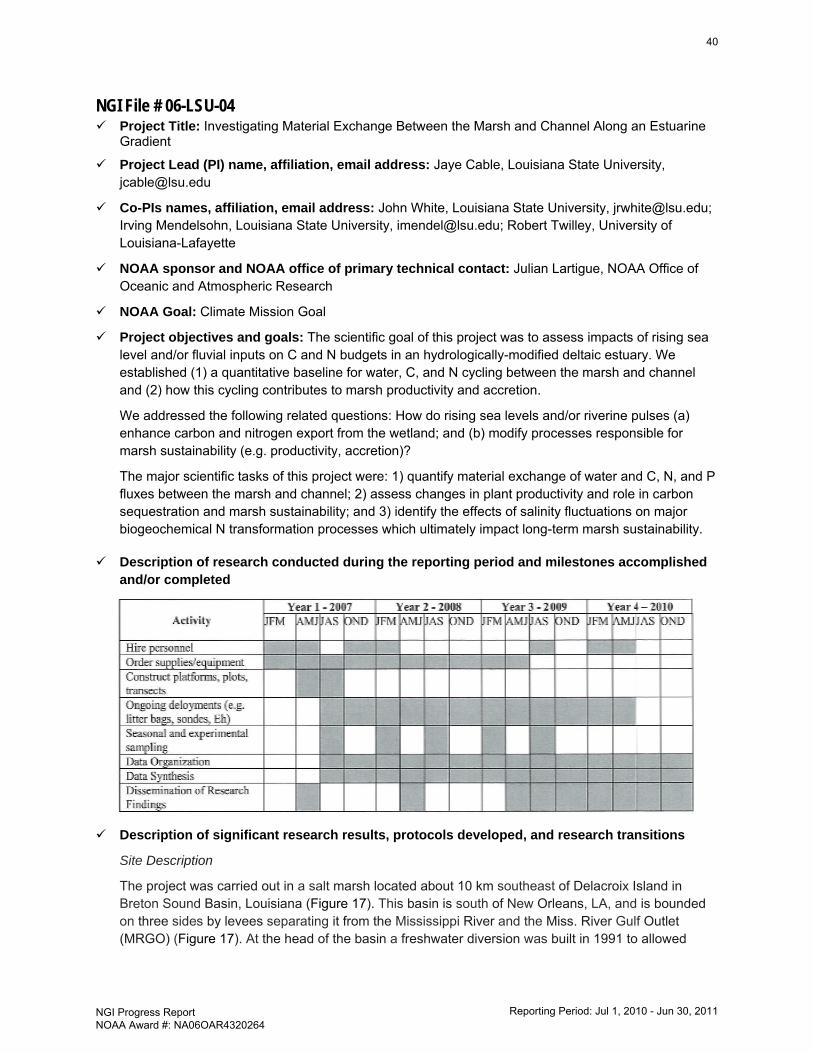
NGI File # 06-LSU-04 Project Title: Investigating Material Exchange Between the Marsh and Channel Along an Estuarine
Gradient
Project Lead (PI) name, affiliation, email address: Jaye Cable, Louisiana State University, [email protected]
Co-PIs names, affiliation, email address: John White, Louisiana State University, [email protected]; Irving Mendelsohn, Louisiana State University, [email protected]; Robert Twilley, University of Louisiana-Lafayette
NOAA sponsor and NOAA office of primary technical contact: Julian Lartigue, NOAA Office of Oceanic and Atmospheric Research
NOAA Goal: Climate Mission Goal
Project objectives and goals: The scientific goal of this project was to assess impacts of rising sea level and/or fluvial inputs on C and N budgets in an hydrologically-modified deltaic estuary. We established (1) a quantitative baseline for water, C, and N cycling between the marsh and channel and (2) how this cycling contributes to marsh productivity and accretion.
We addressed the following related questions: How do rising sea levels and/or riverine pulses (a) enhance carbon and nitrogen export from the wetland; and (b) modify processes responsible for marsh sustainability (e.g. productivity, accretion)?
The major scientific tasks of this project were: 1) quantify material exchange of water and C, N, and P fluxes between the marsh and channel; 2) assess changes in plant productivity and role in carbon sequestration and marsh sustainability; and 3) identify the effects of salinity fluctuations on major biogeochemical N transformation processes which ultimately impact long-term marsh sustainability.
Description of research conducted during the reporting period and milestones accomplished and/or completed
Description of significant research results, protocols developed, and research transitions
Site Description
The project was carried out in a salt marsh located about 10 km southeast of Delacroix Island in Breton Sound Basin, Louisiana (Figure 17). This basin is south of New Orleans, LA, and is bounded on three sides by levees separating it from the Mississippi River and the Miss. River Gulf Outlet (MRGO) (Figure 17). At the head of the basin a freshwater diversion was built in 1991 to allowed
40
NGI Progress Report NOAA Award #: NA06OAR4320264
Reporting Period: Jul 1, 2010 - Jun 30, 2011
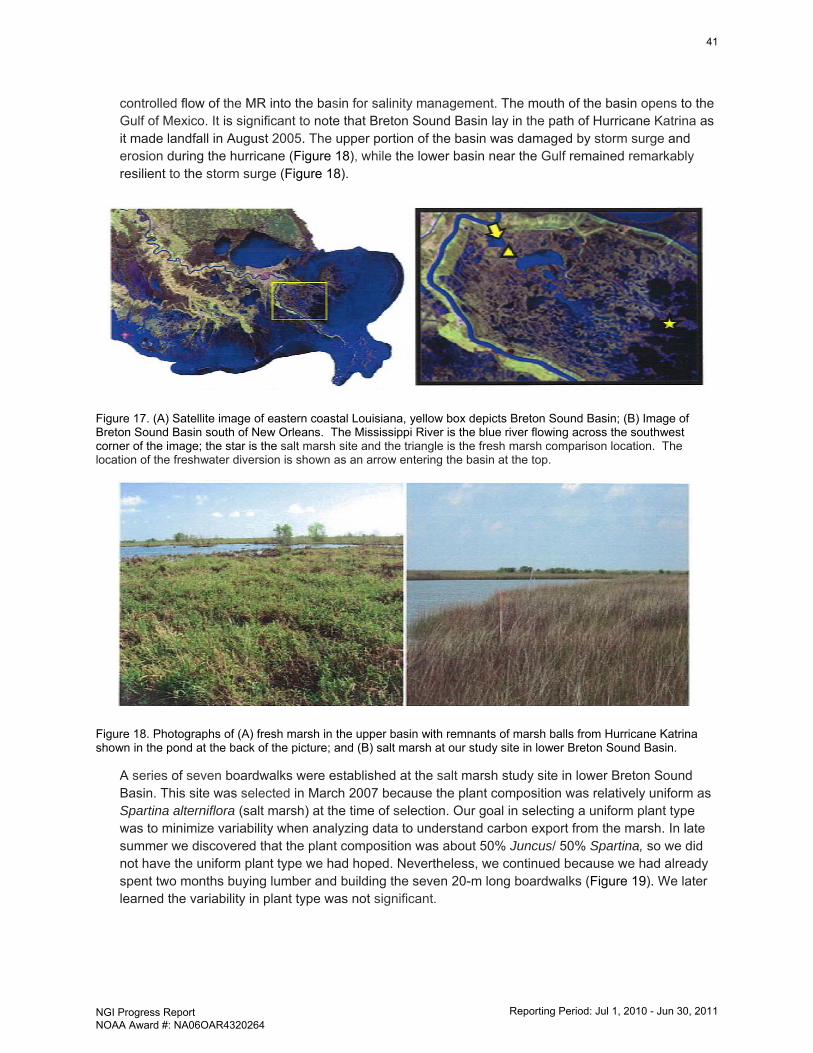
controlled flow of the MR into the basin for salinity management. The mouth of the basin opens to the Gulf of Mexico. It is significant to note that Breton Sound Basin lay in the path of Hurricane Katrina as it made landfall in August 2005. The upper portion of the basin was damaged by storm surge and erosion during the hurricane (Figure 18), while the lower basin near the Gulf remained remarkably resilient to the storm surge (Figure 18).
Figure 17. (A) Satellite image of eastern coastal Louisiana, yellow box depicts Breton Sound Basin; (B) Image of Breton Sound Basin south of New Orleans. The Mississippi River is the blue river flowing across the southwest corner of the image; the star is the salt marsh site and the triangle is the fresh marsh comparison location. The location of the freshwater diversion is shown as an arrow entering the basin at the top.
Figure 18. Photographs of (A) fresh marsh in the upper basin with remnants of marsh balls from Hurricane Katrina shown in the pond at the back of the picture; and (B) salt marsh at our study site in lower Breton Sound Basin.
A series of seven boardwalks were established at the salt marsh study site in lower Breton Sound Basin. This site was selected in March 2007 because the plant composition was relatively uniform as Spartina alterniflora (salt marsh) at the time of selection. Our goal in selecting a uniform plant type was to minimize variability when analyzing data to understand carbon export from the marsh. In late summer we discovered that the plant composition was about 50% Juncus/ 50% Spartina, so we did not have the uniform plant type we had hoped. Nevertheless, we continued because we had already spent two months buying lumber and building the seven 20-m long boardwalks (Figure 19). We later learned the variability in plant type was not significant.
41
NGI Progress Report NOAA Award #: NA06OAR4320264
Reporting Period: Jul 1, 2010 - Jun 30, 2011
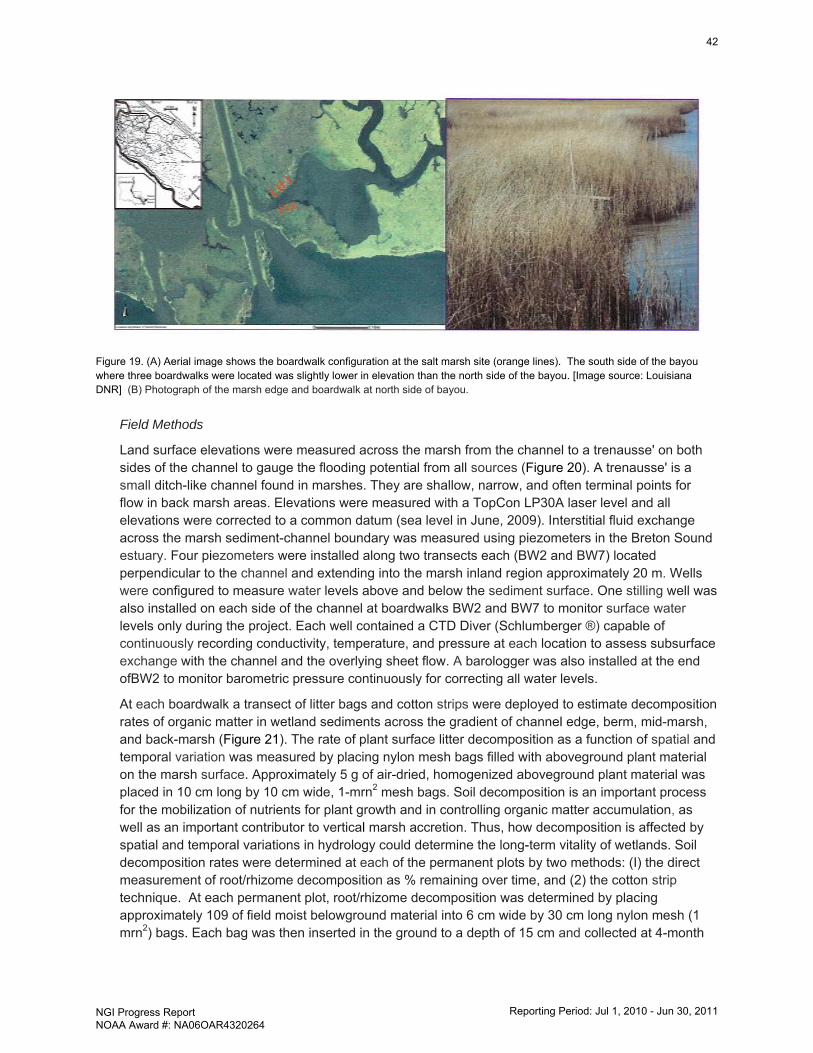
Figure 19. (A) Aerial image shows the boardwalk configuration at the salt marsh site (orange lines). The south side of the bayou where three boardwalks were located was slightly lower in elevation than the north side of the bayou. [Image source: Louisiana DNR] (B) Photograph of the marsh edge and boardwalk at north side of bayou.
Field Methods
Land surface elevations were measured across the marsh from the channel to a trenausse' on both sides of the channel to gauge the flooding potential from all sources (Figure 20). A trenausse' is a small ditch-like channel found in marshes. They are shallow, narrow, and often terminal points for flow in back marsh areas. Elevations were measured with a TopCon LP30A laser level and all elevations were corrected to a common datum (sea level in June, 2009). Interstitial fluid exchange across the marsh sediment-channel boundary was measured using piezometers in the Breton Sound estuary. Four piezometers were installed along two transects each (BW2 and BW7) located perpendicular to the channel and extending into the marsh inland region approximately 20 m. Wells were configured to measure water levels above and below the sediment surface. One stilling well was also installed on each side of the channel at boardwalks BW2 and BW7 to monitor surface water levels only during the project. Each well contained a CTD Diver (Schlumberger ®) capable of continuously recording conductivity, temperature, and pressure at each location to assess subsurface exchange with the channel and the overlying sheet flow. A barologger was also installed at the end ofBW2 to monitor barometric pressure continuously for correcting all water levels.
At each boardwalk a transect of litter bags and cotton strips were deployed to estimate decomposition rates of organic matter in wetland sediments across the gradient of channel edge, berm, mid-marsh, and back-marsh (Figure 21). The rate of plant surface litter decomposition as a function of spatial and temporal variation was measured by placing nylon mesh bags filled with aboveground plant material on the marsh surface. Approximately 5 g of air-dried, homogenized aboveground plant material was placed in 10 cm long by 10 cm wide, 1-mrn2 mesh bags. Soil decomposition is an important process for the mobilization of nutrients for plant growth and in controlling organic matter accumulation, as well as an important contributor to vertical marsh accretion. Thus, how decomposition is affected by spatial and temporal variations in hydrology could determine the long-term vitality of wetlands. Soil decomposition rates were determined at each of the permanent plots by two methods: (I) the direct measurement of root/rhizome decomposition as % remaining over time, and (2) the cotton strip technique. At each permanent plot, root/rhizome decomposition was determined by placing approximately 109 of field moist belowground material into 6 cm wide by 30 cm long nylon mesh (1 mrn2) bags. Each bag was then inserted in the ground to a depth of 15 cm and collected at 4-month
42
NGI Progress Report NOAA Award #: NA06OAR4320264
Reporting Period: Jul 1, 2010 - Jun 30, 2011
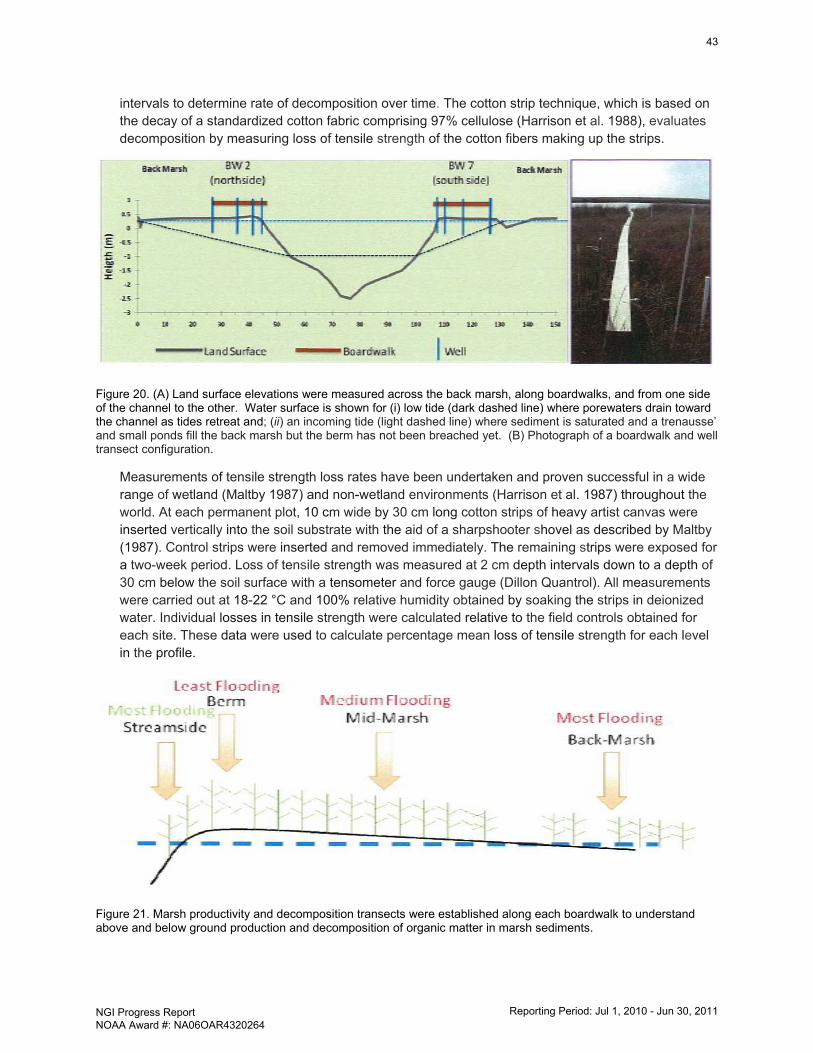
intervals to determine rate of decomposition over time. The cotton strip technique, which is based on the decay of a standardized cotton fabric comprising 97% cellulose (Harrison et al. 1988), evaluates decomposition by measuring loss of tensile strength of the cotton fibers making up the strips.
Figure 20. (A) Land surface elevations were measured across the back marsh, along boardwalks, and from one side of the channel to the other. Water surface is shown for (i) low tide (dark dashed line) where porewaters drain toward the channel as tides retreat and; (ii) an incoming tide (light dashed line) where sediment is saturated and a trenausse’ and small ponds fill the back marsh but the berm has not been breached yet. (B) Photograph of a boardwalk and well transect configuration.
Measurements of tensile strength loss rates have been undertaken and proven successful in a wide range of wetland (Maltby 1987) and non-wetland environments (Harrison et al. 1987) throughout the world. At each permanent plot, 10 cm wide by 30 cm long cotton strips of heavy artist canvas were inserted vertically into the soil substrate with the aid of a sharpshooter shovel as described by Maltby (1987). Control strips were inserted and removed immediately. The remaining strips were exposed for a two-week period. Loss of tensile strength was measured at 2 cm depth intervals down to a depth of 30 cm below the soil surface with a tensometer and force gauge (Dillon Quantrol). All measurements were carried out at 18-22 °C and 100% relative humidity obtained by soaking the strips in deionized water. Individual losses in tensile strength were calculated relative to the field controls obtained for each site. These data were used to calculate percentage mean loss of tensile strength for each level in the profile.
Figure 21. Marsh productivity and decomposition transects were established along each boardwalk to understand above and below ground production and decomposition of organic matter in marsh sediments.
43
NGI Progress Report NOAA Award #: NA06OAR4320264
Reporting Period: Jul 1, 2010 - Jun 30, 2011
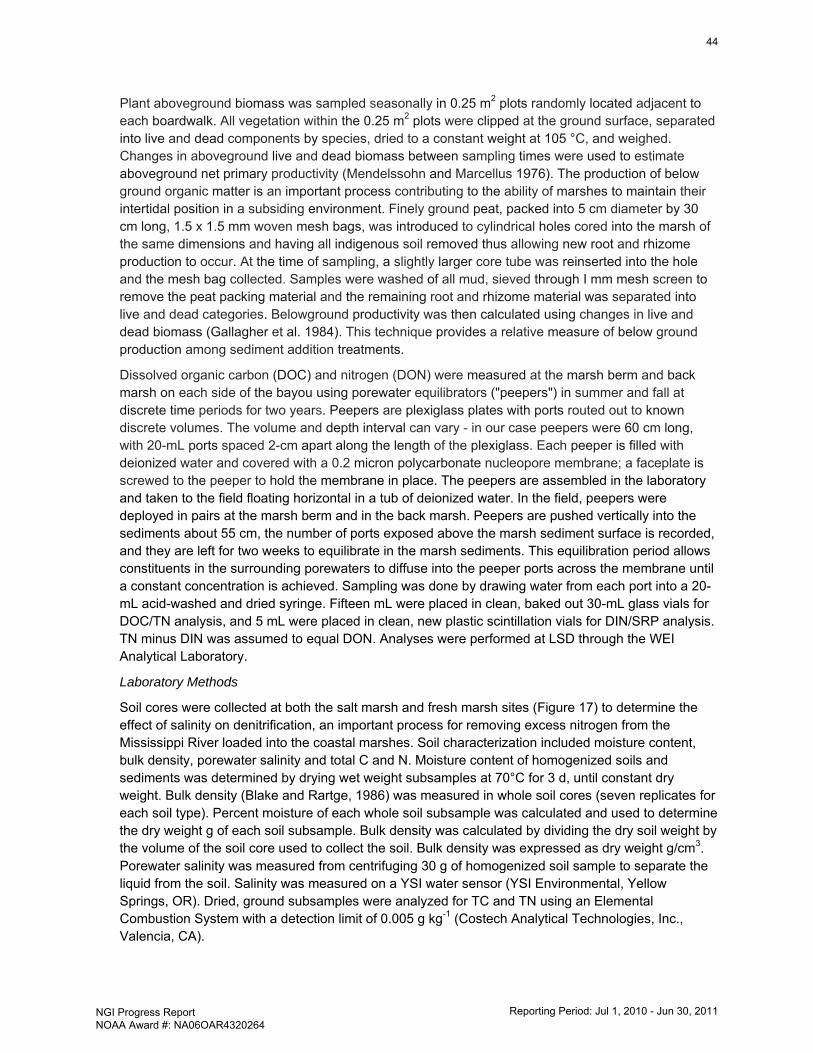
Plant aboveground biomass was sampled seasonally in 0.25 m2 plots randomly located adjacent to each boardwalk. All vegetation within the 0.25 m2 plots were clipped at the ground surface, separated into live and dead components by species, dried to a constant weight at 105 °C, and weighed. Changes in aboveground live and dead biomass between sampling times were used to estimate aboveground net primary productivity (Mendelssohn and Marcellus 1976). The production of below ground organic matter is an important process contributing to the ability of marshes to maintain their intertidal position in a subsiding environment. Finely ground peat, packed into 5 cm diameter by 30 cm long, 1.5 x 1.5 mm woven mesh bags, was introduced to cylindrical holes cored into the marsh of the same dimensions and having all indigenous soil removed thus allowing new root and rhizome production to occur. At the time of sampling, a slightly larger core tube was reinserted into the hole and the mesh bag collected. Samples were washed of all mud, sieved through I mm mesh screen to remove the peat packing material and the remaining root and rhizome material was separated into live and dead categories. Belowground productivity was then calculated using changes in live and dead biomass (Gallagher et al. 1984). This technique provides a relative measure of below ground production among sediment addition treatments.
Dissolved organic carbon (DOC) and nitrogen (DON) were measured at the marsh berm and back marsh on each side of the bayou using porewater equilibrators ("peepers") in summer and fall at discrete time periods for two years. Peepers are plexiglass plates with ports routed out to known discrete volumes. The volume and depth interval can vary - in our case peepers were 60 cm long, with 20-mL ports spaced 2-cm apart along the length of the plexiglass. Each peeper is filled with deionized water and covered with a 0.2 micron polycarbonate nucleopore membrane; a faceplate is screwed to the peeper to hold the membrane in place. The peepers are assembled in the laboratory and taken to the field floating horizontal in a tub of deionized water. In the field, peepers were deployed in pairs at the marsh berm and in the back marsh. Peepers are pushed vertically into the sediments about 55 cm, the number of ports exposed above the marsh sediment surface is recorded, and they are left for two weeks to equilibrate in the marsh sediments. This equilibration period allows constituents in the surrounding porewaters to diffuse into the peeper ports across the membrane until a constant concentration is achieved. Sampling was done by drawing water from each port into a 20-mL acid-washed and dried syringe. Fifteen mL were placed in clean, baked out 30-mL glass vials for DOC/TN analysis, and 5 mL were placed in clean, new plastic scintillation vials for DIN/SRP analysis. TN minus DIN was assumed to equal DON. Analyses were performed at LSD through the WEI Analytical Laboratory.
Laboratory Methods
Soil cores were collected at both the salt marsh and fresh marsh sites (Figure 17) to determine the effect of salinity on denitrification, an important process for removing excess nitrogen from the Mississippi River loaded into the coastal marshes. Soil characterization included moisture content, bulk density, porewater salinity and total C and N. Moisture content of homogenized soils and sediments was determined by drying wet weight subsamples at 70°C for 3 d, until constant dry weight. Bulk density (Blake and Rartge, 1986) was measured in whole soil cores (seven replicates for each soil type). Percent moisture of each whole soil subsample was calculated and used to determine the dry weight g of each soil subsample. Bulk density was calculated by dividing the dry soil weight by the volume of the soil core used to collect the soil. Bulk density was expressed as dry weight g/cm3. Porewater salinity was measured from centrifuging 30 g of homogenized soil sample to separate the liquid from the soil. Salinity was measured on a YSI water sensor (YSI Environmental, Yellow Springs, OR). Dried, ground subsamples were analyzed for TC and TN using an Elemental Combustion System with a detection limit of 0.005 g kg-1 (Costech Analytical Technologies, Inc., Valencia, CA).
44
NGI Progress Report NOAA Award #: NA06OAR4320264
Reporting Period: Jul 1, 2010 - Jun 30, 2011
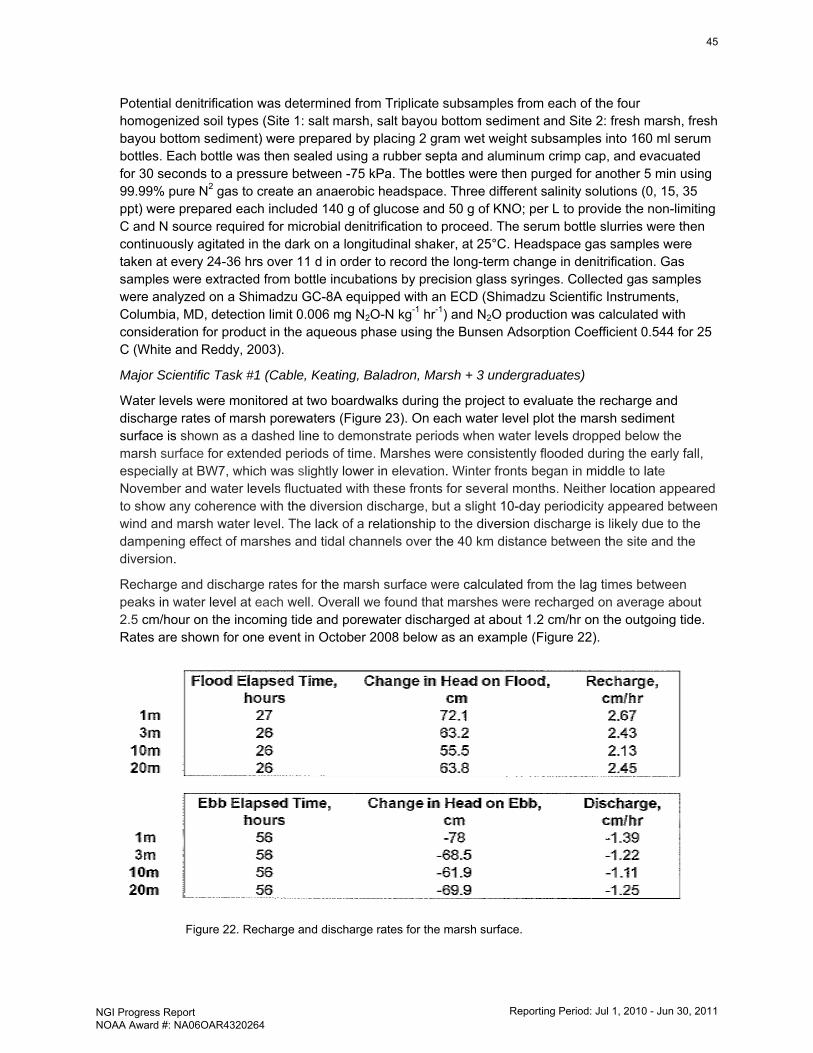
Potential denitrification was determined from Triplicate subsamples from each of the four homogenized soil types (Site 1: salt marsh, salt bayou bottom sediment and Site 2: fresh marsh, fresh bayou bottom sediment) were prepared by placing 2 gram wet weight subsamples into 160 ml serum bottles. Each bottle was then sealed using a rubber septa and aluminum crimp cap, and evacuated for 30 seconds to a pressure between -75 kPa. The bottles were then purged for another 5 min using 99.99% pure N2 gas to create an anaerobic headspace. Three different salinity solutions (0, 15, 35 ppt) were prepared each included 140 g of glucose and 50 g of KNO; per L to provide the non-limiting C and N source required for microbial denitrification to proceed. The serum bottle slurries were then continuously agitated in the dark on a longitudinal shaker, at 25°C. Headspace gas samples were taken at every 24-36 hrs over 11 d in order to record the long-term change in denitrification. Gas samples were extracted from bottle incubations by precision glass syringes. Collected gas samples were analyzed on a Shimadzu GC-8A equipped with an ECD (Shimadzu Scientific Instruments, Columbia, MD, detection limit 0.006 mg N2O-N kg-1 hr-1) and N2O production was calculated with consideration for product in the aqueous phase using the Bunsen Adsorption Coefficient 0.544 for 25 C (White and Reddy, 2003).
Major Scientific Task #1 (Cable, Keating, Baladron, Marsh + 3 undergraduates)
Water levels were monitored at two boardwalks during the project to evaluate the recharge and discharge rates of marsh porewaters (Figure 23). On each water level plot the marsh sediment surface is shown as a dashed line to demonstrate periods when water levels dropped below the marsh surface for extended periods of time. Marshes were consistently flooded during the early fall, especially at BW7, which was slightly lower in elevation. Winter fronts began in middle to late November and water levels fluctuated with these fronts for several months. Neither location appeared to show any coherence with the diversion discharge, but a slight 10-day periodicity appeared between wind and marsh water level. The lack of a relationship to the diversion discharge is likely due to the dampening effect of marshes and tidal channels over the 40 km distance between the site and the diversion.
Recharge and discharge rates for the marsh surface were calculated from the lag times between peaks in water level at each well. Overall we found that marshes were recharged on average about 2.5 cm/hour on the incoming tide and porewater discharged at about 1.2 cm/hr on the outgoing tide. Rates are shown for one event in October 2008 below as an example (Figure 22).
Figure 22. Recharge and discharge rates for the marsh surface.
45
NGI Progress Report NOAA Award #: NA06OAR4320264
Reporting Period: Jul 1, 2010 - Jun 30, 2011
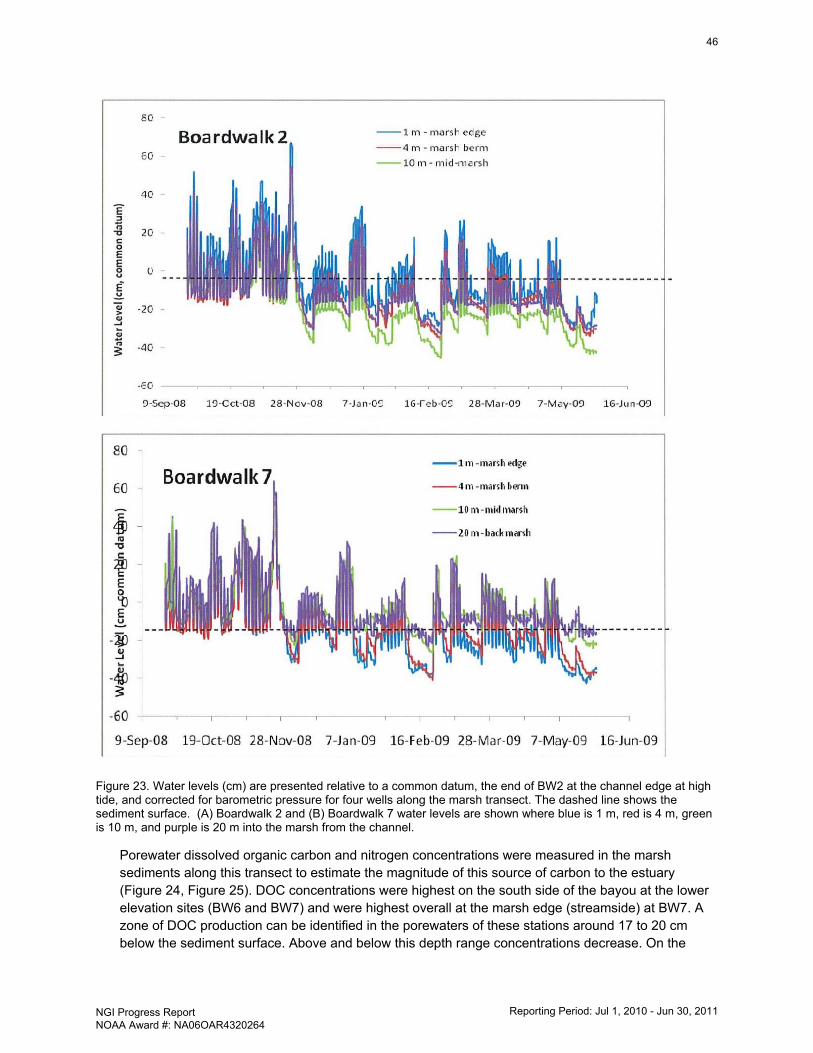
Figure 23. Water levels (cm) are presented relative to a common datum, the end of BW2 at the channel edge at high tide, and corrected for barometric pressure for four wells along the marsh transect. The dashed line shows the sediment surface. (A) Boardwalk 2 and (B) Boardwalk 7 water levels are shown where blue is 1 m, red is 4 m, green is 10 m, and purple is 20 m into the marsh from the channel.
Porewater dissolved organic carbon and nitrogen concentrations were measured in the marsh sediments along this transect to estimate the magnitude of this source of carbon to the estuary (Figure 24, Figure 25). DOC concentrations were highest on the south side of the bayou at the lower elevation sites (BW6 and BW7) and were highest overall at the marsh edge (streamside) at BW7. A zone of DOC production can be identified in the porewaters of these stations around 17 to 20 cm below the sediment surface. Above and below this depth range concentrations decrease. On the
46
NGI Progress Report NOAA Award #: NA06OAR4320264
Reporting Period: Jul 1, 2010 - Jun 30, 2011
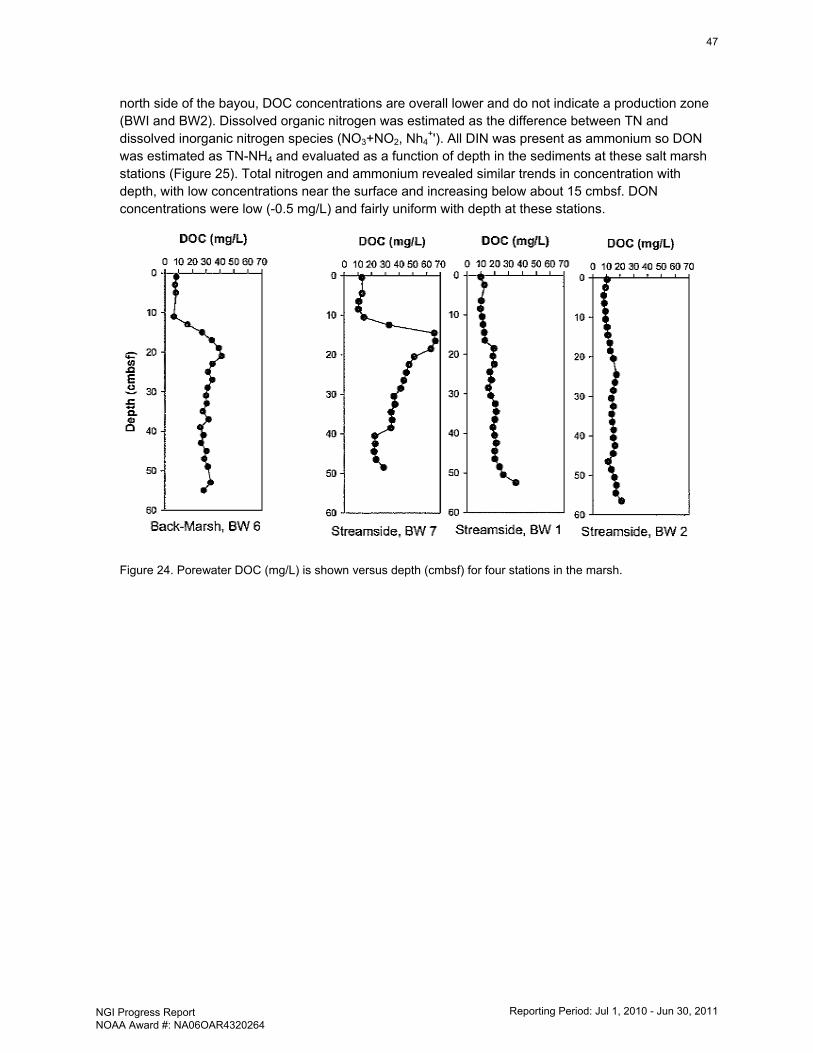
north side of the bayou, DOC concentrations are overall lower and do not indicate a production zone (BWI and BW2). Dissolved organic nitrogen was estimated as the difference between TN and dissolved inorganic nitrogen species (NO3+NO2, Nh4
+'). All DIN was present as ammonium so DON was estimated as TN-NH4 and evaluated as a function of depth in the sediments at these salt marsh stations (Figure 25). Total nitrogen and ammonium revealed similar trends in concentration with depth, with low concentrations near the surface and increasing below about 15 cmbsf. DON concentrations were low (-0.5 mg/L) and fairly uniform with depth at these stations.
Figure 24. Porewater DOC (mg/L) is shown versus depth (cmbsf) for four stations in the marsh.
47
NGI Progress Report NOAA Award #: NA06OAR4320264
Reporting Period: Jul 1, 2010 - Jun 30, 2011
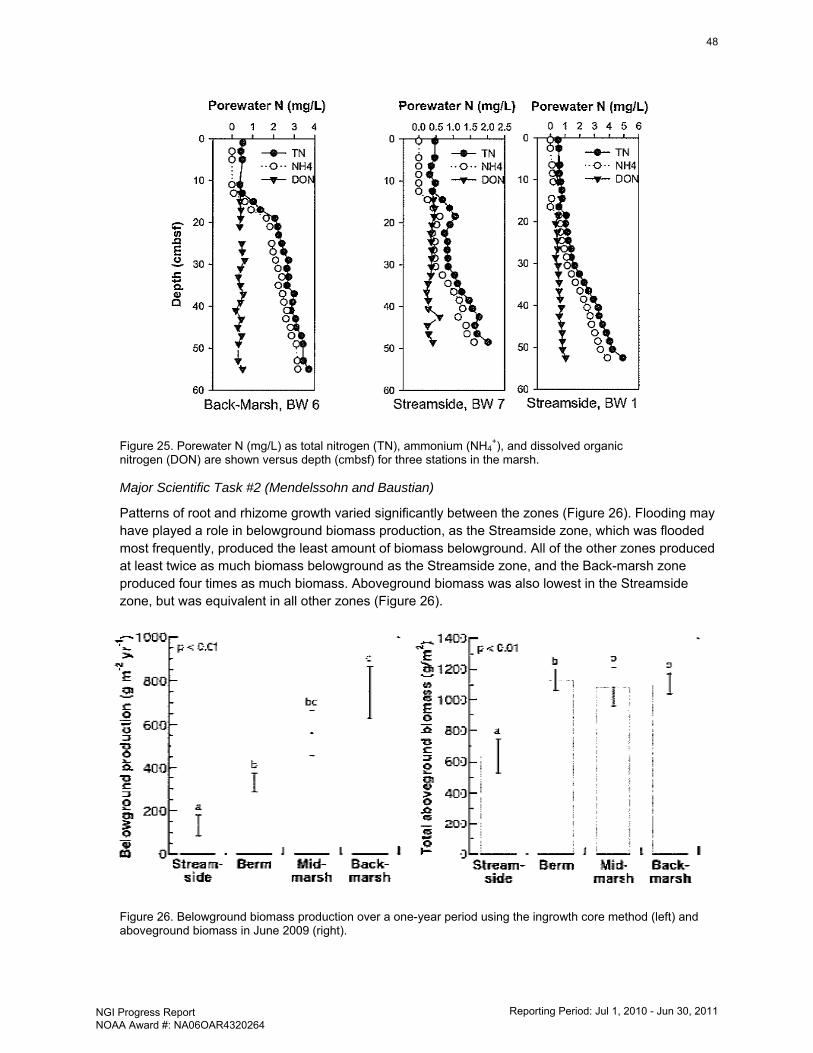
Figure 25. Porewater N (mg/L) as total nitrogen (TN), ammonium (NH4+), and dissolved organic
nitrogen (DON) are shown versus depth (cmbsf) for three stations in the marsh.
Major Scientific Task #2 (Mendelssohn and Baustian)
Patterns of root and rhizome growth varied significantly between the zones (Figure 26). Flooding may have played a role in belowground biomass production, as the Streamside zone, which was flooded most frequently, produced the least amount of biomass belowground. All of the other zones produced at least twice as much biomass belowground as the Streamside zone, and the Back-marsh zone produced four times as much biomass. Aboveground biomass was also lowest in the Streamside zone, but was equivalent in all other zones (Figure 26).
Figure 26. Belowground biomass production over a one-year period using the ingrowth core method (left) and aboveground biomass in June 2009 (right).
48
NGI Progress Report NOAA Award #: NA06OAR4320264
Reporting Period: Jul 1, 2010 - Jun 30, 2011
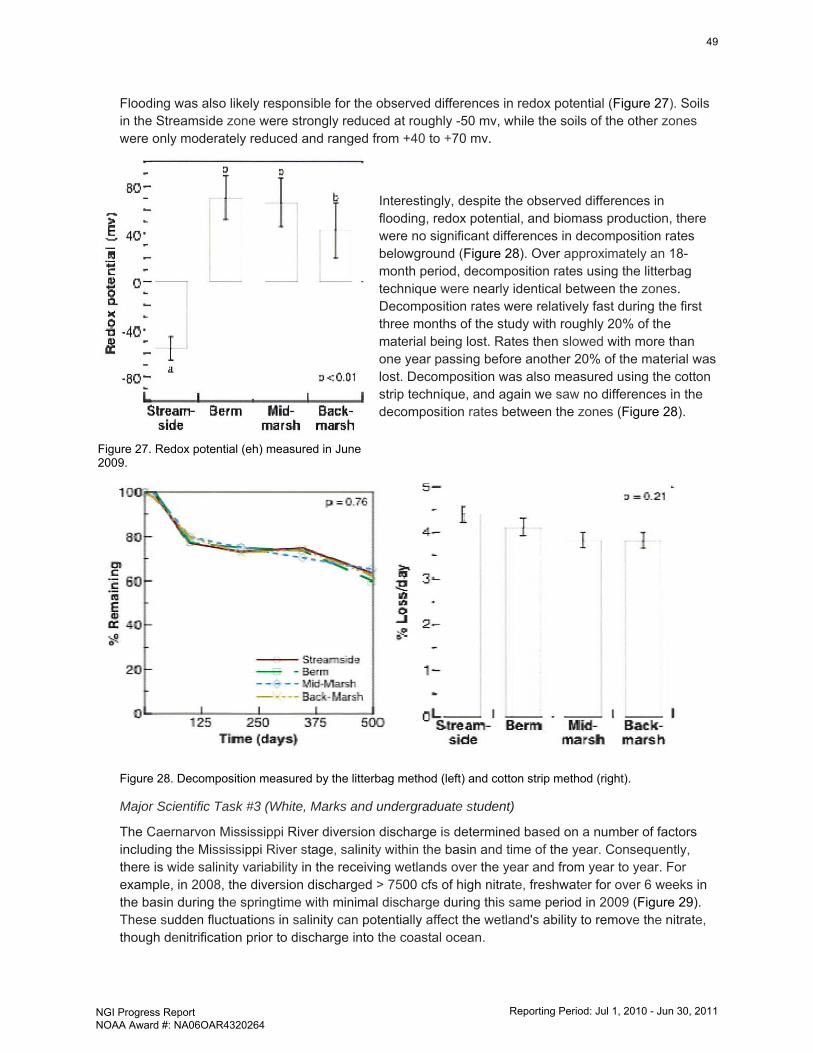
Flooding was also likely responsible for the observed differences in redox potential (Figure 27). Soils in the Streamside zone were strongly reduced at roughly -50 mv, while the soils of the other zones were only moderately reduced and ranged from +40 to +70 mv.
Interestingly, despite the observed differences in flooding, redox potential, and biomass production, there were no significant differences in decomposition rates belowground (Figure 28). Over approximately an 18-month period, decomposition rates using the litterbag technique were nearly identical between the zones. Decomposition rates were relatively fast during the first three months of the study with roughly 20% of the material being lost. Rates then slowed with more than one year passing before another 20% of the material was lost. Decomposition was also measured using the cotton strip technique, and again we saw no differences in the decomposition rates between the zones (Figure 28).
Figure 28. Decomposition measured by the litterbag method (left) and cotton strip method (right).
Major Scientific Task #3 (White, Marks and undergraduate student)
The Caernarvon Mississippi River diversion discharge is determined based on a number of factors including the Mississippi River stage, salinity within the basin and time of the year. Consequently, there is wide salinity variability in the receiving wetlands over the year and from year to year. For example, in 2008, the diversion discharged > 7500 cfs of high nitrate, freshwater for over 6 weeks in the basin during the springtime with minimal discharge during this same period in 2009 (Figure 29). These sudden fluctuations in salinity can potentially affect the wetland's ability to remove the nitrate, though denitrification prior to discharge into the coastal ocean.
Figure 27. Redox potential (eh) measured in June 2009.
49
NGI Progress Report NOAA Award #: NA06OAR4320264
Reporting Period: Jul 1, 2010 - Jun 30, 2011
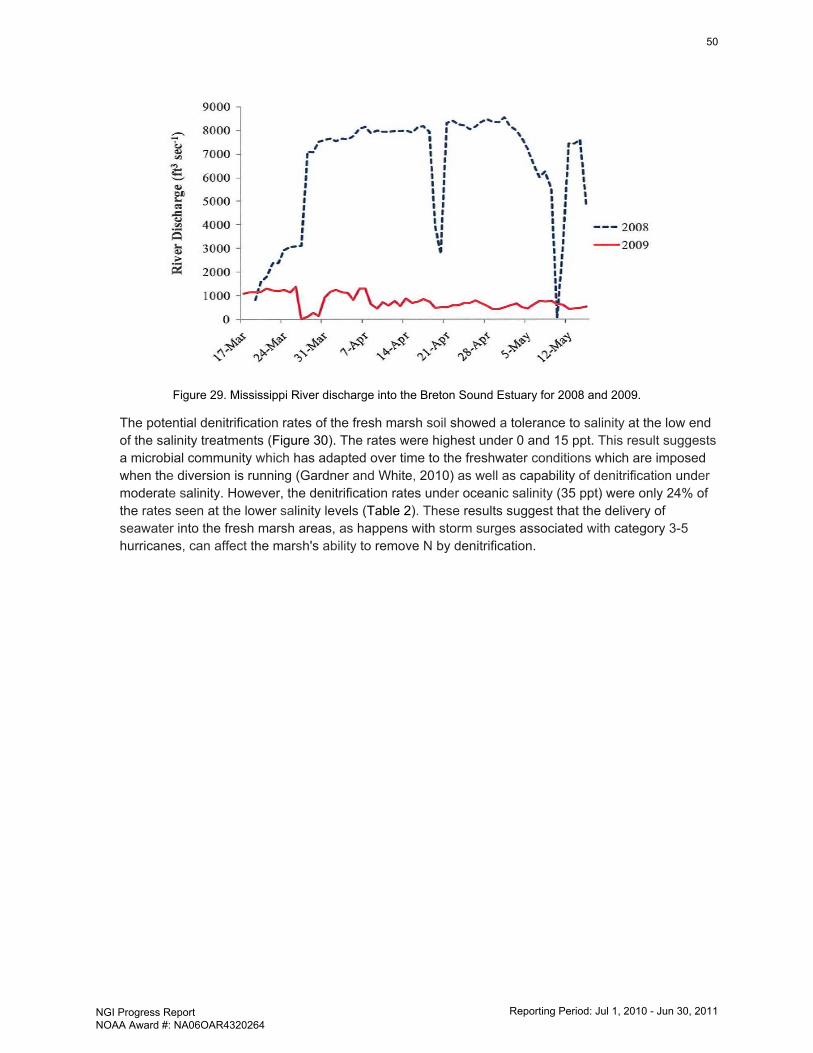
Figure 29. Mississippi River discharge into the Breton Sound Estuary for 2008 and 2009.
The potential denitrification rates of the fresh marsh soil showed a tolerance to salinity at the low end of the salinity treatments (Figure 30). The rates were highest under 0 and 15 ppt. This result suggests a microbial community which has adapted over time to the freshwater conditions which are imposed when the diversion is running (Gardner and White, 2010) as well as capability of denitrification under moderate salinity. However, the denitrification rates under oceanic salinity (35 ppt) were only 24% of the rates seen at the lower salinity levels (Table 2). These results suggest that the delivery of seawater into the fresh marsh areas, as happens with storm surges associated with category 3-5 hurricanes, can affect the marsh's ability to remove N by denitrification.
50
NGI Progress Report NOAA Award #: NA06OAR4320264
Reporting Period: Jul 1, 2010 - Jun 30, 2011
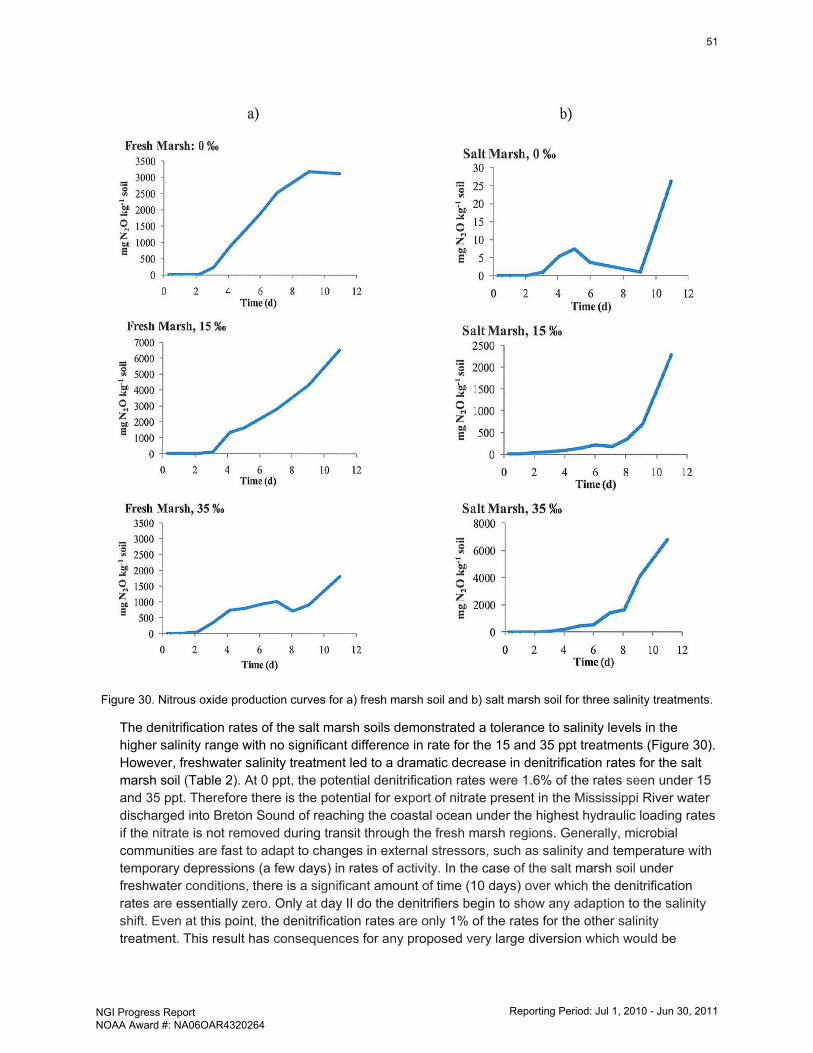
Figure 30. Nitrous oxide production curves for a) fresh marsh soil and b) salt marsh soil for three salinity treatments.
The denitrification rates of the salt marsh soils demonstrated a tolerance to salinity levels in the higher salinity range with no significant difference in rate for the 15 and 35 ppt treatments (Figure 30). However, freshwater salinity treatment led to a dramatic decrease in denitrification rates for the salt marsh soil (Table 2). At 0 ppt, the potential denitrification rates were 1.6% of the rates seen under 15 and 35 ppt. Therefore there is the potential for export of nitrate present in the Mississippi River water discharged into Breton Sound of reaching the coastal ocean under the highest hydraulic loading rates if the nitrate is not removed during transit through the fresh marsh regions. Generally, microbial communities are fast to adapt to changes in external stressors, such as salinity and temperature with temporary depressions (a few days) in rates of activity. In the case of the salt marsh soil under freshwater conditions, there is a significant amount of time (10 days) over which the denitrification rates are essentially zero. Only at day II do the denitrifiers begin to show any adaption to the salinity shift. Even at this point, the denitrification rates are only 1% of the rates for the other salinity treatment. This result has consequences for any proposed very large diversion which would be
51
NGI Progress Report NOAA Award #: NA06OAR4320264
Reporting Period: Jul 1, 2010 - Jun 30, 2011
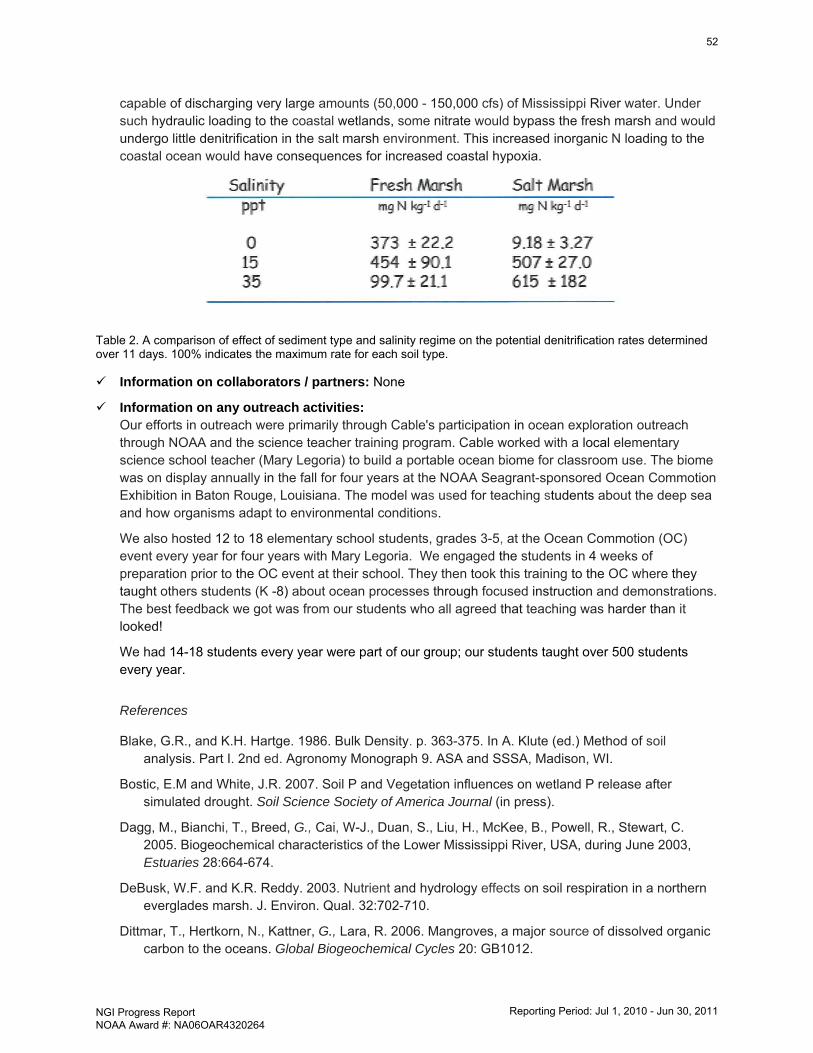
capable of discharging very large amounts (50,000 - 150,000 cfs) of Mississippi River water. Under such hydraulic loading to the coastal wetlands, some nitrate would bypass the fresh marsh and would undergo little denitrification in the salt marsh environment. This increased inorganic N loading to the coastal ocean would have consequences for increased coastal hypoxia.
Table 2. A comparison of effect of sediment type and salinity regime on the potential denitrification rates determined over 11 days. 100% indicates the maximum rate for each soil type.
Information on collaborators / partners: None
Information on any outreach activities: Our efforts in outreach were primarily through Cable's participation in ocean exploration outreach through NOAA and the science teacher training program. Cable worked with a local elementary science school teacher (Mary Legoria) to build a portable ocean biome for classroom use. The biome was on display annually in the fall for four years at the NOAA Seagrant-sponsored Ocean Commotion Exhibition in Baton Rouge, Louisiana. The model was used for teaching students about the deep sea and how organisms adapt to environmental conditions.
We also hosted 12 to 18 elementary school students, grades 3-5, at the Ocean Commotion (OC) event every year for four years with Mary Legoria. We engaged the students in 4 weeks of preparation prior to the OC event at their school. They then took this training to the OC where they taught others students (K -8) about ocean processes through focused instruction and demonstrations. The best feedback we got was from our students who all agreed that teaching was harder than it looked!
We had 14-18 students every year were part of our group; our students taught over 500 students every year.
References Blake, G.R., and K.H. Hartge. 1986. Bulk Density. p. 363-375. In A. Klute (ed.) Method of soil
analysis. Part I. 2nd ed. Agronomy Monograph 9. ASA and SSSA, Madison, WI.
Bostic, E.M and White, J.R. 2007. Soil P and Vegetation influences on wetland P release after simulated drought. Soil Science Society of America Journal (in press).
Dagg, M., Bianchi, T., Breed, G., Cai, W-J., Duan, S., Liu, H., McKee, B., Powell, R., Stewart, C. 2005. Biogeochemical characteristics of the Lower Mississippi River, USA, during June 2003, Estuaries 28:664-674.
DeBusk, W.F. and K.R. Reddy. 2003. Nutrient and hydrology effects on soil respiration in a northern everglades marsh. J. Environ. Qual. 32:702-710.
Dittmar, T., Hertkorn, N., Kattner, G., Lara, R. 2006. Mangroves, a major source of dissolved organic carbon to the oceans. Global Biogeochemical Cycles 20: GB1012.
52
NGI Progress Report NOAA Award #: NA06OAR4320264
Reporting Period: Jul 1, 2010 - Jun 30, 2011
Gallagher, J., Wolf, P., Pfeiffer, W. 1984. Rhizome and root growth rates and cycles in protein and carbohydrate concentrations in a Georgia Spartina alterniflora Loisel. marsh. American Journal of Botany 71:165-169.
Gardner, L.M. and J.R. White. 2010. Denitrification enzyme activity as an indicator of nitrate movement through a diversion wetland. Soil Science Society of America Journal. 74: 1037-1047.
Harrison, A.F., Latter, P., Walton, D., eds. 1987. Cotton strip assay: an index of decomposition in soils. (ITE Symposium no. 24). Grange-over-Sands: Institute of Terrestrial Ecology.
Maltby, E. 1987. Use of cotton strip assay in wetland and upland environments - an international
perspective. In: Harrison, A.F., P.M. Latter, D.W. H. Walton (eds.) Cotton strip assay: an index of decomposition in soils. (ITE Symposium no. 24). Grange-over-Sands: Institute of Terrestrial Ecology.
Mendelssohn, I. and Marcellus, K. 1976. Angiosperm production of three Virginia marshes in various salinity and soil nutrient regimes. Chesapeake Science 17: 15-23.
Milliman, J.D. and Meade, R.H., 1983, World-wide delivery of river sediment to the oceans, J. ofGeology, 91, 1-21.
White, J.R., Reddy, K.R. and Mustafa, M.Z. 2004. Influence of hydrology and vegetation on Pretention in Everglades stormwater treatment wetlands. Hydrological Processes 18:343-355.
White, J.R., Reddy, K.R. Newman, J.M. 2006. Hydrologic and vegetation effects on water quality in wetland mesocosms under low P concentrations, Soil Science Society of America Journal 70: 1242-1251.
White, J.R. and Reddy, K.R. 2003. Potential nitrification and denitrification rates in a phosphorusimpacted subtropical peatland. Journal of Environmental Quality 32:2436-2443.
53
NGI Progress Report NOAA Award #: NA06OAR4320264
Reporting Period: Jul 1, 2010 - Jun 30, 2011
NGI File # 06-MSU-01 Project Title: Developing a Foundation for Analysis of Natural and Human-Induced Disturbances to
Coastal Economies
Project Lead (PI) name, affiliation, email address: Daniel Petrolia, Dept. of Agricultural Economics, Mississippi State University, [email protected]
NOAA sponsor and NOAA office of primary technical contact: Julian Lartigue, NOAA Office of Oceanic and Atmospheric Research
NOAA Goals: Ecosystems Mission Goal, Commerce and Transportation Mission Goal
Project objectives and goals This project involved a series of individual research tasks, which, although independent of one another, are unified around a common theme of coastal economics. The following Task descriptions provide abstracts for each.
Non-market valuation of MS Barrier-island restoration; non-market valuation of Louisiana wetland restoration; hurricane evacuation behavior; MS River basin land-use analysis; Northern Gulf Coast migration patterns analysis; Assessment of economic recovery of seafood processors and dealers, marinas, commercial harvesters, and bait dealers in coastal Mississippi; Port of New Orleans economic impact analysis; Northern Gulf coast business resiliency analysis; Post-Katrina retail sector shifts analysis; economic impact analysis of public agencies within coastal communities as a result of coastal hazards; analysis of impact of information released by independent media sources concerning coastal hazards on attendance levels at publicly-funded federal, state and local recreational facilities.
Description of research conducted during the reporting period and milestones accomplished and/or completed See below
Description of significant research results, protocols developed, and research transitions
Task 1. (completed) Non-market valuation of MS barrier-islands restoration. Lead: Petrolia. A dichotomous-choice contingent-valuation survey was conducted in the State of Mississippi (USA) to estimate willingness to pay (WTP) for three restoration options being considered for the state’s barrier islands. Random-effects probit models were estimated, and parametric and non-parametric WTP estimates and confidence intervals were calculated. Turnbull lower-bound mean WTP was $22 per respondent to maintain the existing footprint over a 30-year period, $152 to restore 2,338 acres (Pre-1969 footprint), and $277 to restore 5,969 acres (Pre-1900 footprint). Econometric results indicate that for the Pre-Camille and Pre-1900 options, coastal residents and those citing storm protection, recreation impact, and environmental impact as primary decision factors, were more likely to support restoration, with marginal effects of these greater for the Pre-Camille option. For the Status-Quo option, seventy-five percent of respondents voted in favor of restoration, and the offered bid was not significant; only the hurricane-protection and environmental-impact variables were significant for this option.
Task 2. (completed) Non-market valuation of Louisiana coastal restoration. Lead: Petrolia. A dichotomous-choice contingent-valuation survey was conducted in the State of Louisiana (USA) to estimate compensating surplus (CS) and equivalent surplus (ES) welfare measures for the prevention of future coastal wetland losses in Louisiana. Valuations were elicited using both willingness to pay (WTP) and willingness to accept compensation (WTA) payment vehicles. Mean CS (WTP) estimates based on a probit model using a Box-Cox specification on income was $825 per household annually, and mean ES (WTA) was estimated at $4,444 per household annually. Regression results indicate that the major factors influencing support for land-loss prevention were income (positive, WTP model
54
NGI Progress Report NOAA Award #: NA06OAR4320264
Reporting Period: Jul 1, 2010 - Jun 30, 2011
only), perceived hurricane protection benefits (positive), environmental and recreation protection (positive), distrust of government (negative), age (positive, WTA model only), and race (positive for whites). Additionally, a second analysis focused on preferences for timing of wetland-loss prevention in coastal Louisiana. Results indicate a strong preference for a short-run program over a long-run program or no action. Respondents that had higher incomes, were white, had prior knowledge of ongoing restoration efforts, and had confidence in government were more likely to vote yes relative to no action, as were those citing hurricane, environmental, or climate-change protection as their primary concern. Turnbull Lower-Bound median willingness to pay (willingness to accept compensation) was estimated at $3,547 ($5,313) per household for the short-run program and $2,765 ($5,101) per household for the long-run program.
Task 3. (completed). MS Basin land-use model and hypoxia analysis. Lead: Westra (LSU). This tasks evaluated the impacts of increased production of biofuels and alternative land-uses on environmentally-sensitive lands within the MS River Basin by integrating results from predictive models of multifunctional impacts from different agricultural management systems with estimates of economic value derived from scenarios to create a tool that estimates impacts and values of different management systems. Impacts include changes in nutrient loads (nitrogen and phosphorus) directly related to Gulf hypoxia and landowner profitability/income.
Task 4. (completed). Assessing research needs of coastal natural disaster risk and insurance. Leads: Petrolia & Coble. Collaborator: Barnett, Landry. The objective of this task was to identify research needs related to risk and insurance. This work was conducted in collaboration with several MSU Agricultural Economics faculty (Keith Coble, Dan Petrolia, Barry Barnett), postdoctoral researchers (Guyslain Ngeleza), with Craig Landry at East Carolina University, and with former NOAA Chief Economist Rodney Weiher. Through discussions and research reviews conducted among this group, the primary research need identified was an in-depth analysis of factors that explain demand for flood insurance in the Gulf Coast, specifically with regard to how perceptions of risk (subjective vs. objective) and risk preferences (how people behave in the face of risk). The result of this research was the development of a consumer survey on flood insurance demand that was implemented during Summer 2010. Survey work was covered under this task, but analysis was conducted and funded as part of a separate NGI project (“Toward an Understanding of Gulf Coast Resident Preferences and Perceptions on Risk and Restoration”). Note also that personnel funding and subcontractor funding was not part of this task but rather as part of the other NGI project.
Task 5. (completed) Hurricane evacuation behavior analysis. Leads:Petrolia & Hanson (Auburn). A multinomial choice framework was used to analyze data from hypothetical storm forecast scenarios administered via mail survey to a random sample of U.S. Gulf Coast residents. Results indicate that the issuance of a mandatory evacuation notice and the presence of higher wind speeds had the largest influence on increasing the likelihood of evacuation. Age, race, disability, distance, and education were significant in explaining one’s decision to wait relative to choosing to evacuate. Blacks and disabled individuals were strictly less-likely to wait and more likely to make an immediate evacuation decision. Hurricane Katrina evacuees and those with an evacuation destination identified were also more likely to decide to evacuate, but were also more likely to wait before deciding. Results indicate that residents of mobile homes were more likely to either evacuate or wait before making a decision, but strictly less-likely not to evacuate. Respondents very confident in being rescued were strictly more-likely not to evacuate. Results indicate that not having an evacuation destination identified was the most influential factor regarding the likelihood of not knowing what choice to make.
Task 6A. (completed) Northern Gulf Coast Migration Patterns. Lead:Evans. The principal goal of this task was to investigate the relationship between county-level migration flows and Hurricane
55
NGI Progress Report NOAA Award #: NA06OAR4320264
Reporting Period: Jul 1, 2010 - Jun 30, 2011
Katrina. Population migration patterns have numerous community-level implications, including: changes in income levels, tax bases, political structures, local supply-demand chains, and infrastructural needs. Thus, regional economic and labor markets may change in tandem with these population dynamics. Natural disasters, such as hurricanes, have been identified as major contributors to population migration. While some studies have looked at labor market effects of Hurricane Katrina, they generally focus on specific metropolitan areas. This work, in contrast, explored changes in industry- and county-level establishment counts, employment, and wages from before and after Hurricane Katrina for Mississippi. The analysis shed light on several important patterns emerging in the Mississippi labor market in the short-term following Hurricane Katrina. Mississippi counties with the greatest amount of in-migration from the evacuated coastal counties generally witnessed positive labor market changes, including increases in both establishment counts and wages. Furthermore, counties with high post-storm in-migration levels in metropolitan areas, where incomes were relatively high, and unemployment and minority presence were low, appeared more likely to experience significant increases in employment.
Task 6B. (completed). Spatial Shift-Share Analysis of Coastal Employment Following Hurricane Katrina. Lead: Evans. This task examined employment shifts in the Leisure and Hospitality sector along the Gulf coast following Hurricane Katrina using spatial shift-share analysis. Using a spatial weights matrix that incorporated relative employment, and distance measures relative to the track of Hurricane Katrina it was possible to calculate classical and spatial shift-share components. Regression analysis provided evidence that spatial interaction between employment centers as well as with the storm track, was a relevant aspect of the employment shifts that occurred following Hurricane Katrina.
Task 6C. (completed). Hurricane Katrina and Spatial Patterns of Regional Specialization. Lead: Evans. This task explored the spatial dimensions of employment change in Louisiana, Mississippi, Alabama and Florida by looking at how spatial dispersion of export base sectors changed in the wake of Hurricane Katrina. It was found that: (1) regional specialization is clustered for certain sectors of the economy in areas that were also affected by Hurricane Katrina; and (2) that changes in regional specialization associated with Hurricane Katrina can be identified with local indicators of spatial association.
Task 7. (completed). Assess economic recovery of seafood processors and dealers, marinas, commercial harvesters, and bait dealers in coastal Mississippi. Lead: Posadas. This task assessed the economic recovery after Hurricane Katrina of the commercial and recreational fishing industries, including seafood processors and dealers, piers and marinas, commercial harvesters, and bait dealers. Economic surveys were conducted to document the progress and status of economic recovery of the selected marine industries. Economic participation of key sectors were determined, the level of economic activities and the economic impact of these sectors on the regional economy were determined, the socio-economic factors enhancing or limiting the levels of economic participation and new investments were assessed.
Task 8. (completed). Market Integration for Shrimp and the Effect of Catastrophic Events. Leads: Harri and Muhammad. (Originally titled “Port of New Orleans impact analysis”, this task was modified to its current form due to data limitations). This study employed the Prestemon and Holmes assumption that cointegration between the different shrimp markets occurs because of intertemporal arbitrage. Similarly, we assumed that different shrimp markets can be defined over the “information space” as those submarkets that respond statistically in a similar way to the same information about the factors affecting shrimp demand and supply. This task also investigated the effects of hurricane Katrina on shrimp prices in the Gulf Coast region and whether these effects are reflected in shrimp prices on the Atlantic and Pacific Coast. Preliminary results indicate that several price series from
56
NGI Progress Report NOAA Award #: NA06OAR4320264
Reporting Period: Jul 1, 2010 - Jun 30, 2011
different regions/markets are cointegrated. Cointegrating relationships are found to exist between the price series of brown, pink and white shrimp from the Gulf Coast and spot shrimp from the Pacific, rock shrimp from the Gulf Coast and white shrimp from the Atlantic and brine and spot shrimp from the Pacific. An important result is the fact that price of imported shrimp is cointegrated with each of the domestic shrimp price series. This finding may have important implications regarding the relationships between the different domestic price series and the effect of catastrophic events on one series and their spillover effects.
Task 9. (completed) After the Storm – Spatial and Temporal Aspects of Business Resiliency. Lead: Evans. This task assessed the influence of Hurricane Katrina on business resiliency both spatially and temporally using panel data analysis. Preliminary results indicated that business resiliency varied across the impacted region and across economic sectors, suggesting that some sectors were negatively impacted in the short-term but experienced employment growth over the long-term.
Task 10 (cancelled, budget re-allocated to other tasks). Structural Shifts in Retail Economies of Selected Coastal Counties and Adjoining Counties in Mississippi: Pre and Post Katrina.
Task 11 (completed). Media Coverage of Coastal Weather Events: Impacts on Attendance Levels at Northern Gulf State Parks. Lead: Morgan. Study Regions: Pensacola, FL: Tarkiln Bayou, Perdido Key, Big Lagoon; Greater New Orleans, LA: Bayou Signette, St. Bernard, Grand Isle (re-opened 5-1-09 after Hurricane Gustav). Task Approach: Monthly visitor data were collected July 2001 through September 2008 from state recreational parks located within the regions of Pensacola, FL and Greater New Orleans, LA. Park attendance was measured as number of For the Greater New Orleans, LA area, 82% of the variation in monthly attendance levels recorded by park managers was explained by model variables. Only a weak negative relationship existed between weather events and park visitation, although the relationship was not statistically significant. When keywords appeared in newspapers at least once monthly, a negative and statistically significant decline in average monthly attendance was revealed, resulting in an average decrease of 5,761 visitors that represented approximately $103,698 in lost annual revenues. For the Pensacola, FL region, 75% of the variation in monthly attendance levels recorded by park managers was explained by model variables. A negative and statistically significant relationship between adverse weather events and park visitation resulted in an average 4,659 fewer visitors per month where extreme weather occurred, which represented approximately $83,862 in lost annual revenues. Only a weak negative and statistically insignificant decline in average monthly attendance when keywords appeared in newspapers was estimated. Study Relevance: The difference in relative impacts of news sources and weather events on park visitors may be a result of the distances traveled by visitors. For example, Florida parks attract large numbers of out-of-state visitors who may not alter park visitation plans based solely on local news, while Louisiana residents who delay a park visit until weather conditions improve may still visit within the same month. These findings are expected to improve decision-maker awareness of those factors that significantly impact recreational attendance levels linked to adverse weather events; in particular, the impacts on public park revenues by unanticipated and unintended public response to news media. Suggested future work includes stratification of media coverage by capital (natural, built, human, social) type and estimation of indirect revenue losses to study regions resulting from both media coverage and weather events.
Task 12. (completed). Coastal Hazards: Localized Economic Impacts Incurred by Public Agencies. Lead: Morgan. To date, county managers representing Terrebonne, Plaquemines and St. Tammany parishes in Louisiana; Escambia, Bay and Okaloosa counties in Florida; Baldwin and Mobile counties in Alabama; Harrison and Jackson counties, MS; and Galveston County, TX provided completed interviews. On average, respondents had served nearly eight years as county managers and had more than 14 years experience in county governance positions. Total operating budgets for the most
57
NGI Progress Report NOAA Award #: NA06OAR4320264
Reporting Period: Jul 1, 2010 - Jun 30, 2011
recent fiscal year averaged over $222M and ranged from $120-$360M across counties. For those county managers that provided estimates of internal staff time and budget allocations during and after Hurricane Gustav, planning activities required one to 100 percent of available personnel and finances. Between three and ten counties interacted with at least one outside agency during and after Gustav, with the majority of outside support arriving in the form of either personnel and/or equipment. The majority of external financial support was received from the Governor’s office and the Federal Emergency Management Agency. In an effort to provide linkages between coastal county needs and university research and outreach programs, respondents were asked to describe specific needs related to coastal hazard public management issues. Responses included requests for faster mitigation of post-recovery issues, economic valuation of wetlands as storm surge protection, provision of public announcements and brochures, and the need for “continuity of operations planning for medium/small sized businesses,” such as churches, restaurants and stores.
Information on collaborators / partners: a. Name of collaborating organization: Terrill Hanson, Auburn University Fisheries and
Allied Aquaculture b. Date collaborating established: Aug 08 c. Does partner provide monetary support to project? Amount of support? No d. Does partner provide non-monetary (in-kind) support? Yes a. Name of collaborating organization: John Westra and Rex Caffey, Louisiana State
University, Center for Natural Resource Economics and Policy b. Date collaborating established: Feb 07 c. Does partner provide monetary support to project? Amount of support? No d. Does partner provide non-monetary (in-kind) support? Yes
a. Name of collaborating organization: Greg Carter, University of Southern Mississippi, Gulf
Coast Geospatial Center b. Date collaborating established: Feb 07 c. Does partner provide monetary support to project? Amount of support? No d. Does partner provide non-monetary (in-kind) support? Yes
a. Name of collaborating organization: Andrew Muhammad, USDA Economic Research
Service b. Date collaborating established: Jan 10 c. Does partner provide monetary support to project? Amount of support? No d. Does partner provide non-monetary (in-kind) support? Yes
Information on any outreach activities:
A seminar was hosted in the Department of Agricultural Economics for two experts on hurricane evacuation behavior on August 13, 2007, entitled “A Web-based Socio-Economic Analysis of Human Response to Hurricanes: The Case of Several 2005 Hurricanes in Florida.” The two presenters were Dr. Michael Thompson (Associate Professor, Economics Department, Florida A& M University) and Dr. David Letson (Associate Professor of Marine Affairs, University of Miami). There were approximately 20 attendees.
A seminar was hosted in the Department of Agricultural Economics for an expert on coastal economics and non-market valuation on November 2, 2007. The presenter was Dr. Craig Landry (Assistant Professor, Department of Economics and Assistant Director, Center for Natural Hazards Research, East Carolina University). There were approximately 25 attendees.
58
NGI Progress Report NOAA Award #: NA06OAR4320264
Reporting Period: Jul 1, 2010 - Jun 30, 2011
A presentation was made at to the Chief Economist of NOAA, Dr. Rodney Weiher, in his office in Silver Spring, MD, on June 4, 2008, by 5 project members and Dr. David Shaw, NGI Director, to outline NGI economics research goals and accomplishments, and to coordinate NGI economics research with NOAA priorities and those of the Office of the Chief Economist.
59
NGI Progress Report NOAA Award #: NA06OAR4320264
Reporting Period: Jul 1, 2010 - Jun 30, 2011
NGI File # 06-MSU-07 Project Title: An Information Semantic Approach for Resource and Knowledge Discovery in an
Integrated Ocean Observing System
Project Lead (PI) name, affiliation, email address: Roger King, Mississippi State University, [email protected]
Co-PI name, affiliation, email address: Surya Durbha, Mississippi State University, [email protected]
NOAA sponsor and NOAA office of primary technical contact: Julian Lartigue, NOAA Office of Oceanic and Atmospheric Research
NOAA Goals: Ecosystems Mission Goal, Technology and Mission Support Goal
Project objectives and goals
The goal of this project is to develop an IOOS compliant pilot that uses semantic web technologies and web services to enable resource and knowledge discovery among private and public data sets within the Northern Gulf of Mexico. This project uses a scientific approach that utilizes an open source and standards-based approach for developing the middleware necessary for facilitating data sharing from the disparate and heterogeneous data providers of the region. It is conducted by a multi-disciplinary team and research methods that encompass computer science and engineering expertise at Mississippi State University and domain expertise resident at our federal, state, and private collaborators. The project also features an education and outreach element that reflects the multi-disciplinary modes of inquiry and increases the diversity of the workforce and a strong, but flexible management plan that supports collaborative research and delivers an ontology driven, and OGC standards-based Sensor web system for northern Gulf of Mexico data sets. The project is expected to provide IOOS with the functionality to begin to address three of its seven societal goals within the three year scope of the project. These goals are to provide more timely predictions of natural hazards and their impacts; to sustain, protect, and restore healthy marine and estuarine ecosystems; and to sustain, protect, and restore marine resources.
Description of research conducted during the reporting period and milestones accomplished and/or completed
Implemented the Sensor Alert Service (SAS).
Completed the development of the CosemWare Portal.
Description of significant research results, protocols developed, and research transitions
Worked on collaboration with NOAA Coastal Data Development Center (NCDDC) to transition research operations. Attempted to interface with the integrated Ocean Observation System (IOOS) to implement OGC sensor web standards.
Participated in the OGC initiative on Oceans Interoperability Experiment. Provided Sensor Observation Service (SOS) from sensors in the Gulf of Mexico and other sensor web tools to the OGC initiative.
Information on collaborators / partners: None
Information on any outreach activities: None
60
NGI Progress Report NOAA Award #: NA06OAR4320264
Reporting Period: Jul 1, 2010 - Jun 30, 2011
NGI File # 06-USM-01 Project Title: Microbial Source Tracking and its Application to the Northern Gulf of Mexico
Project Lead (PI) name, affiliation, email address: R.D. Ellender, University of Southern Mississippi, [email protected]
Co-PI name, affiliation, email address: Shiao Wang, University of Southern Mississippi, [email protected]
NOAA sponsor and NOAA office of primary technical contact: Julian Lartigue, NOAA Office of Oceanic and Atmospheric Research
NOAA Goal: Ecosystems Mission Goal
Project objectives and goals
1. Coastal water quality is routinely tested by the enumeration of enterococci. Enterococci (EN) are associated with a wide variety of fecal inputs from humans, feral and domestic animals and storm waters, but the counts offer no information regarding the source(s) of pollution that can degrade beach water quality. This failure impedes the ability of regulatory agencies and managers to protect public health and remediate sources of pollution. This issue requires the replacement of the EN method of quantifying pollution or, at minimum, a suitable supplement to the bacterial count. MST methods may fulfill this need.
2. Of the MST methods available, those that focus on the detection of a single gene or group of host specific genes have appeared to emerge as creditable measures for reasons of specificity, sensitivity economy, speed and transferability. Bacteroides was the first bacterial human marker to be used in source tracking applications. Later, additional microbial human markers were developed including Bacteroides thetaiotaomicron, Methanobrevibacter smithii, human polyomavirus and Faecalibacterium. This issue was examined in detail in this investigation by testing the presence/absence of the markers in real world situations along the Mississippi coastline. EN and FC counts and the presence or absence (P/A) of the bacterial (Bacteroides, Btim, and Fecali) and archaeal (M. smithii) markers were analyzed in identical samples from Mississippi coastal waters. Statistical analyses were conducted to determine the correlation between EN and FC levels and the P/A of each human marker at each sampling site and to examine whether nearshore beach sampling sites with tidal creek influx were significantly different from those sites with no associated creek.
3. Recent investigations by other researchers and in our laboratories have indicated that the current microbial markers (enterococci, fecal coliforms) do not reflect the true levels of pollution in Mississippi coastal waters. Dilution, the presence of predators, the levels of sediment in the water column and the evaluated temperatures pose questions concerning the validity of the enterococcal method. As a measure of the true level of pathogens in the water column, we examined the level of Salmonella in both water and sediment and were able to show that this pathogen did not appear to present a problem in these coastal waters. Additional studies including the analysis of Norovirus, Campylobacter, Hepatitis A and other pathogens should be investigated.
Description of research conducted during the reporting period and milestones accomplished and/or completed
1. The principal beach recreational sites of the Mississippi Department of Environmental Quality (MDEQ) coastal beach sites were chosen for analysis based on the frequency of beach closure events. They included one site with a moderate number of beach closures (1-2 /yr) (7A: 30°20'485"N 89°09.621'W), and five with high numbers of beach closures (3-5 /yr) (9: 30°22.201'N 89°04.783'W), 10: 30°22.559'N 89°03.161'W), 10A: 30⁰22'455"N 89⁰02'763"W, 11: 30°22.938'N 89°01.578'W), and
61
NGI Progress Report NOAA Award #: NA06OAR4320264
Reporting Period: Jul 1, 2010 - Jun 30, 2011
12A: 30°23.586'N 88°56.291'W). Six tidal creek sites that flow into the Mississippi Sound affecting MDEQ sites 7A, 10 and 11, were also tested (7ACC: 30⁰20'518"N 89⁰9'256"W; 7ACT: 30⁰20'337"N 89⁰09'377"W; CC1: 30⁰22'46.89"N 89⁰03'22.00"W, CC2: 30⁰22'40.88"N 89⁰03'18.47"W; AOC: 30⁰23'14.42"N 89⁰01'08.25"W, and Condo: 30°23'1.55"N89° 1'30.44"W, respectively). The coastal stations represented here are the dominant beach recreational sites along the Mississippi coast; the tidal creek sites affect coastal water quality
2. Enterococci were cultured and enumerated following the United States Environmental Protection Agency (USEPA) Standard Method 1600 (Messer and Dufour, 1998; USEPA, 2006). During the course of this investigation, 831 samples were analyzed.
3. We developed the following method for DNA analysis of coastal samples: Sample volumes (500ml) were filtered through 3.0 µm and 0.45 µm cellulose acetate membranes (Pall Corporation, Ann Arbor, MI) and the 0.45 µm filter extracted using the PowerSoil™ DNA kit (MoBio Laboratories, Inc., Carlsbad, CA). DNA concentrations were measured in ng/µl using a Nanodrop™ ND-1000 spectrophotometer (Nanodrop Technologies, Wilmington, DE) and frozen (-20⁰C) pending analysis. The Methanobrevibacter smithii (Mnif142f and 363r), the Bacteroides (HF183F and Bac708R), the B. thetaiotamicrobium (B.thetaF and B,thetaR) and the Fecalibacteriium (HFB-F3 and HFB-R5) primers were purchased from Integrated DNA Technologies, San Jose, CA. The number of samples analyzed by DNA analysis was identical to the number identified for EN analysis.
4. We leveraged the funds of this project with other grant funding to analyze PCR products using the microchip electrophoretic system (MCE-202 MultiNA™, Shimadzu Corporation Kyoto, Japan). This form of analysis had not been used to study the levels of human markers in coastal waters.
5. Logistic regressions and multivariate analysis were performed using JMP 8 software. See Appendix A for details of the 2009 multivariate analysis.
6. This project was an incentive for funding through the Gulf of Mexico Alliance resulting in a three year investigation entitled "Validation and field testing of MST methodologies in the Gulf of Mexico. USEPA-GOMP, (USM portion of $203,783). Ellender, Wang subcontract from J. Harwood, University of South Florida, Tampa. In year 1 of this NGI project, subcontracts were issued to Drs. Joe Lepo of the University of West Florida and to Jody Harwood of the University of South Florida to initiate their research.
Description of significant research results, protocols developed, and research transitions
1. Initial results showed that forty percent (310 of 768) of the samples tested positive for the presence of at least one of the human markers. Fresh (creek) and salt (coastal) water sampling sites represented 66% and 34%, respectively, of those samples that showed the presence of a marker. Markers observed at coastal sites impacted by a creek had a 3.2 to 1 chance of being positive when compared to coastal sites not impacted by a creek. Of the 310 positive reactions, 45 (15%) occurred at creek site CC2 followed by 12% at site CC1. The creek sites impacting coastal site 7A were next highest at 9%. All other sites had % (+) values of <9%. The Btim marker was positive 100 times (32%) followed by Bacteroides at 25%, Faecalifacterium at 22% and M. smithii (21%). Because the data was collected in a nominal and continous manner, we first chose logistic regressions to analyze both the parametric and nonparametric data collectively. Logistic regression models were constructed for each of the four organisms in question using the JMP 8 software package. For each regression the sites of interest were given the attribute of a random variable to avoid pseudo-replication and the enterococci and fecal coliform counts were designated as covariates. Both affect Wald tests and effect likelihood ratio tests were run but the P-values reported are from the more robust effect likelihood ratio tests. For all regressions the parameters were set as α = 0.05, N = 14, and DF = 13
62
NGI Progress Report NOAA Award #: NA06OAR4320264
Reporting Period: Jul 1, 2010 - Jun 30, 2011
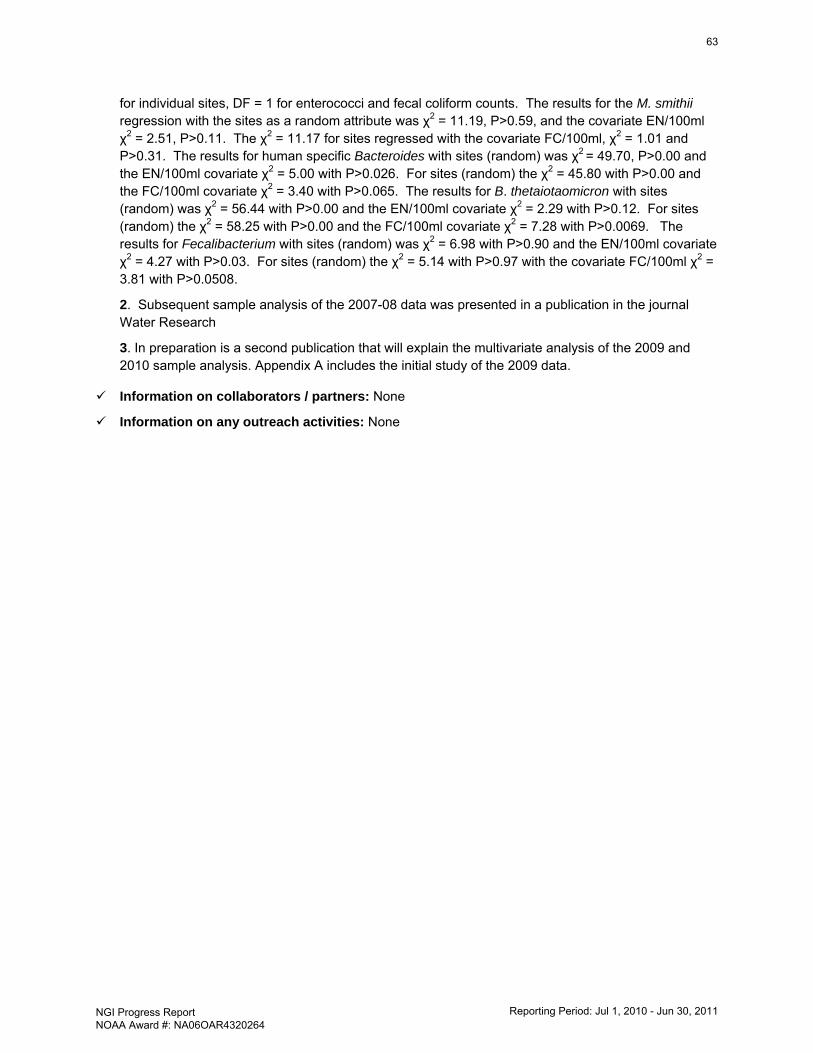
for individual sites, DF = 1 for enterococci and fecal coliform counts. The results for the M. smithii regression with the sites as a random attribute was χ2 = 11.19, P>0.59, and the covariate EN/100ml χ2 = 2.51, P>0.11. The χ2 = 11.17 for sites regressed with the covariate FC/100ml, χ2 = 1.01 and P>0.31. The results for human specific Bacteroides with sites (random) was χ2 = 49.70, P>0.00 and the EN/100ml covariate χ2 = 5.00 with P>0.026. For sites (random) the χ2 = 45.80 with P>0.00 and the FC/100ml covariate χ2 = 3.40 with P>0.065. The results for B. thetaiotaomicron with sites (random) was χ2 = 56.44 with P>0.00 and the EN/100ml covariate χ2 = 2.29 with P>0.12. For sites (random) the χ2 = 58.25 with P>0.00 and the FC/100ml covariate χ2 = 7.28 with P>0.0069. The results for Fecalibacterium with sites (random) was χ2 = 6.98 with P>0.90 and the EN/100ml covariate χ2 = 4.27 with P>0.03. For sites (random) the χ2 = 5.14 with P>0.97 with the covariate FC/100ml χ2 = 3.81 with P>0.0508.
2. Subsequent sample analysis of the 2007-08 data was presented in a publication in the journal Water Research
3. In preparation is a second publication that will explain the multivariate analysis of the 2009 and 2010 sample analysis. Appendix A includes the initial study of the 2009 data.
Information on collaborators / partners: None
Information on any outreach activities: None
63
NGI Progress Report NOAA Award #: NA06OAR4320264
Reporting Period: Jul 1, 2010 - Jun 30, 2011
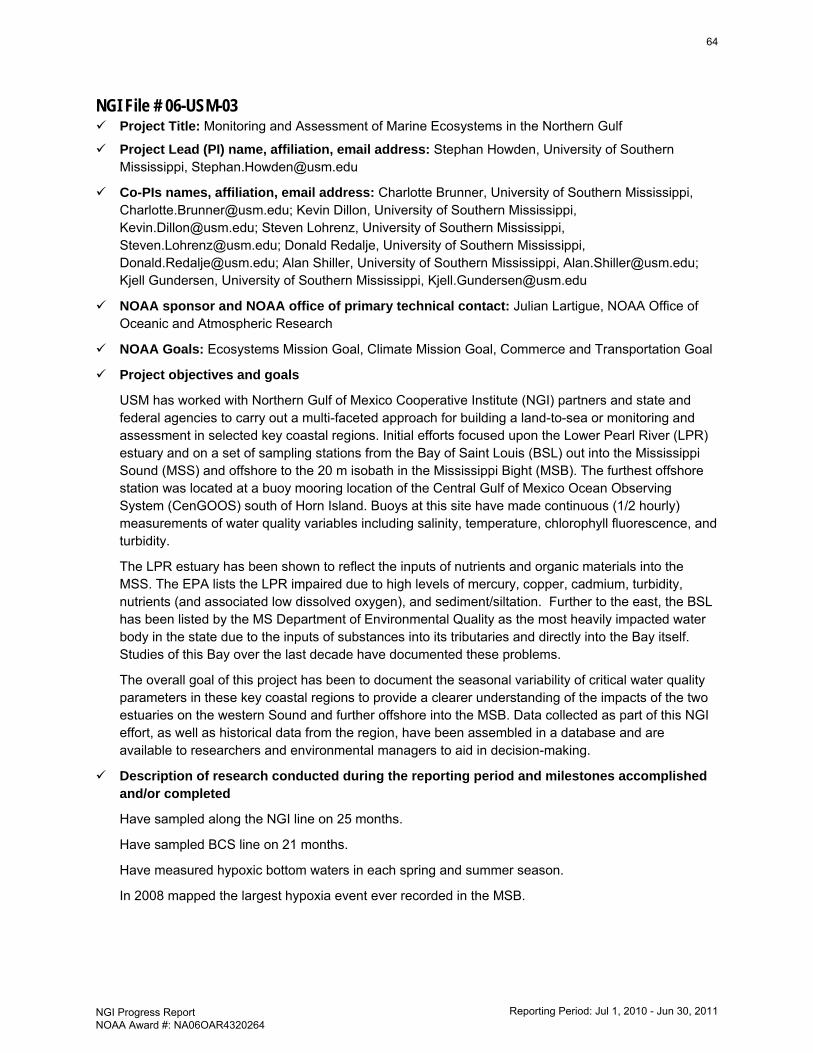
NGI File # 06-USM-03 Project Title: Monitoring and Assessment of Marine Ecosystems in the Northern Gulf
Project Lead (PI) name, affiliation, email address: Stephan Howden, University of Southern Mississippi, [email protected]
Co-PIs names, affiliation, email address: Charlotte Brunner, University of Southern Mississippi, [email protected]; Kevin Dillon, University of Southern Mississippi, [email protected]; Steven Lohrenz, University of Southern Mississippi, [email protected]; Donald Redalje, University of Southern Mississippi, [email protected]; Alan Shiller, University of Southern Mississippi, [email protected]; Kjell Gundersen, University of Southern Mississippi, [email protected]
NOAA sponsor and NOAA office of primary technical contact: Julian Lartigue, NOAA Office of Oceanic and Atmospheric Research
NOAA Goals: Ecosystems Mission Goal, Climate Mission Goal, Commerce and Transportation Goal
Project objectives and goals
USM has worked with Northern Gulf of Mexico Cooperative Institute (NGI) partners and state and federal agencies to carry out a multi-faceted approach for building a land-to-sea or monitoring and assessment in selected key coastal regions. Initial efforts focused upon the Lower Pearl River (LPR) estuary and on a set of sampling stations from the Bay of Saint Louis (BSL) out into the Mississippi Sound (MSS) and offshore to the 20 m isobath in the Mississippi Bight (MSB). The furthest offshore station was located at a buoy mooring location of the Central Gulf of Mexico Ocean Observing System (CenGOOS) south of Horn Island. Buoys at this site have made continuous (1/2 hourly) measurements of water quality variables including salinity, temperature, chlorophyll fluorescence, and turbidity.
The LPR estuary has been shown to reflect the inputs of nutrients and organic materials into the MSS. The EPA lists the LPR impaired due to high levels of mercury, copper, cadmium, turbidity, nutrients (and associated low dissolved oxygen), and sediment/siltation. Further to the east, the BSL has been listed by the MS Department of Environmental Quality as the most heavily impacted water body in the state due to the inputs of substances into its tributaries and directly into the Bay itself. Studies of this Bay over the last decade have documented these problems.
The overall goal of this project has been to document the seasonal variability of critical water quality parameters in these key coastal regions to provide a clearer understanding of the impacts of the two estuaries on the western Sound and further offshore into the MSB. Data collected as part of this NGI effort, as well as historical data from the region, have been assembled in a database and are available to researchers and environmental managers to aid in decision-making.
Description of research conducted during the reporting period and milestones accomplished and/or completed
Have sampled along the NGI line on 25 months.
Have sampled BCS line on 21 months.
Have measured hypoxic bottom waters in each spring and summer season.
In 2008 mapped the largest hypoxia event ever recorded in the MSB.
64
NGI Progress Report NOAA Award #: NA06OAR4320264
Reporting Period: Jul 1, 2010 - Jun 30, 2011
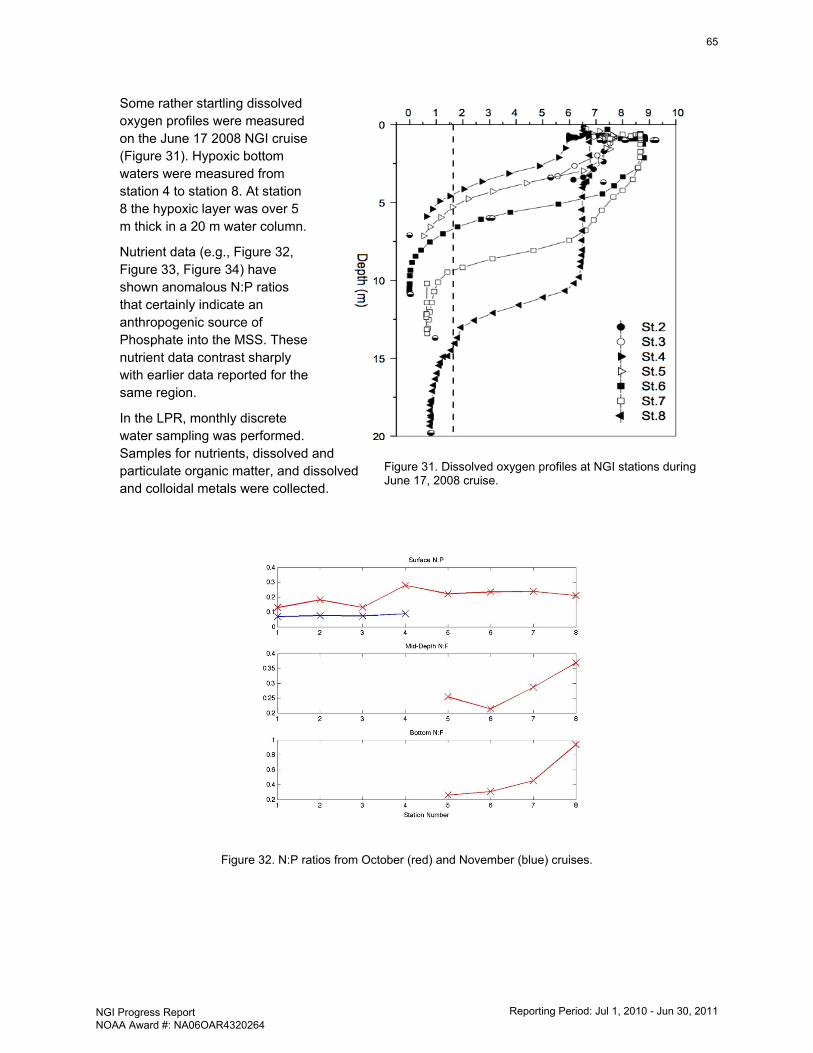
Some rather startling dissolved oxygen profiles were measured on the June 17 2008 NGI cruise (Figure 31). Hypoxic bottom waters were measured from station 4 to station 8. At station 8 the hypoxic layer was over 5 m thick in a 20 m water column.
Nutrient data (e.g., Figure 32, Figure 33, Figure 34) have shown anomalous N:P ratios that certainly indicate an anthropogenic source of Phosphate into the MSS. These nutrient data contrast sharply with earlier data reported for the same region.
In the LPR, monthly discrete water sampling was performed. Samples for nutrients, dissolved and particulate organic matter, and dissolved and colloidal metals were collected.
Figure 32. N:P ratios from October (red) and November (blue) cruises.
Figure 31. Dissolved oxygen profiles at NGI stations during June 17, 2008 cruise.
65
NGI Progress Report NOAA Award #: NA06OAR4320264
Reporting Period: Jul 1, 2010 - Jun 30, 2011
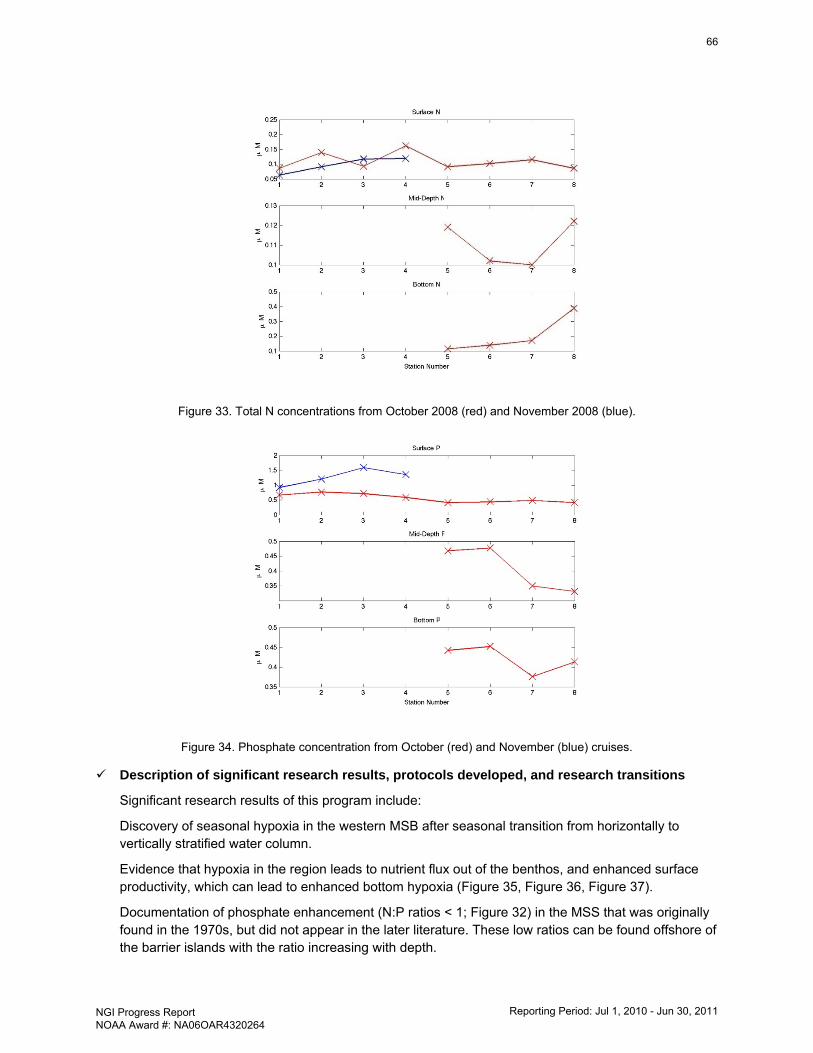
Figure 33. Total N concentrations from October 2008 (red) and November 2008 (blue).
Figure 34. Phosphate concentration from October (red) and November (blue) cruises.
Description of significant research results, protocols developed, and research transitions
Significant research results of this program include:
Discovery of seasonal hypoxia in the western MSB after seasonal transition from horizontally to vertically stratified water column.
Evidence that hypoxia in the region leads to nutrient flux out of the benthos, and enhanced surface productivity, which can lead to enhanced bottom hypoxia (Figure 35, Figure 36, Figure 37).
Documentation of phosphate enhancement (N:P ratios < 1; Figure 32) in the MSS that was originally found in the 1970s, but did not appear in the later literature. These low ratios can be found offshore of the barrier islands with the ratio increasing with depth.
66
NGI Progress Report NOAA Award #: NA06OAR4320264
Reporting Period: Jul 1, 2010 - Jun 30, 2011
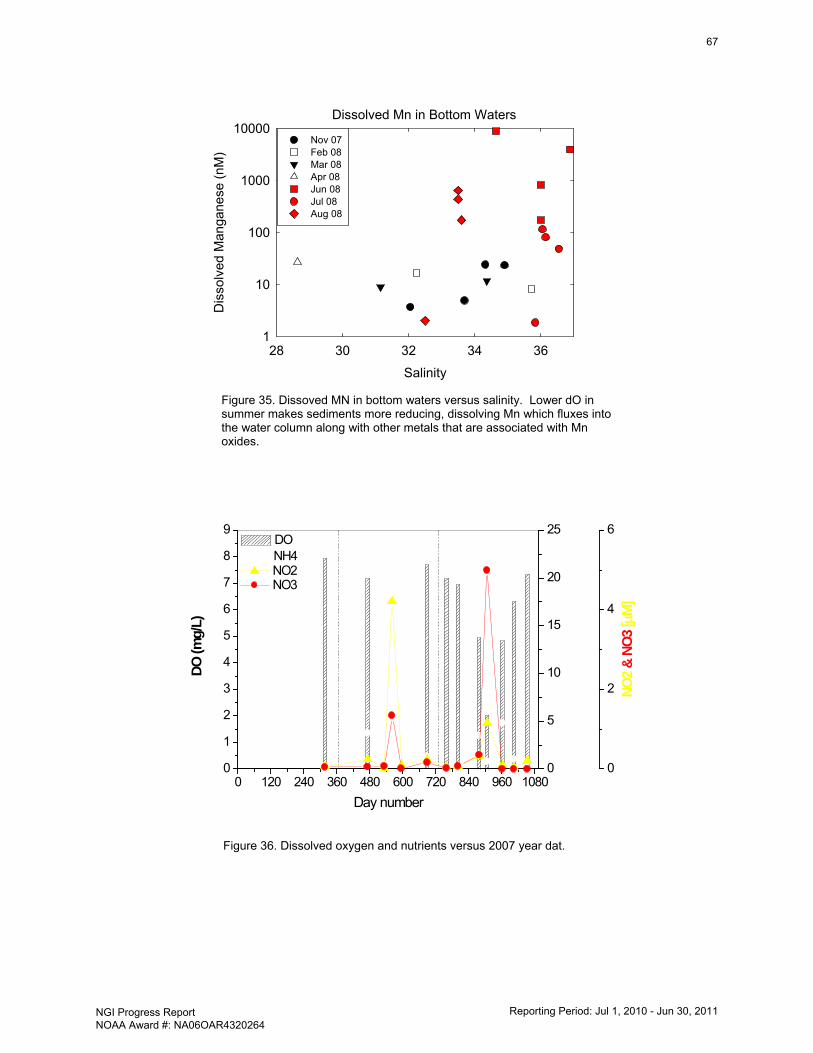
Figure 35. Dissoved MN in bottom waters versus salinity. Lower dO in summer makes sediments more reducing, dissolving Mn which fluxes into the water column along with other metals that are associated with Mn oxides.
Dissolved Mn in Bottom Waters
Salinity
28 30 32 34 36
Dis
solv
ed M
anga
nese
(nM
)
1
10
100
1000
10000Nov 07Feb 08Mar 08Apr 08Jun 08Jul 08Aug 08
0 120 240 360 480 600 720 840 960 10800
1
2
3
4
5
6
7
8
9
NO2
& NO
3 [µ
M]
NH4
[ µM
]
DO (m
g/L)
Day number
DO
0
5
10
15
20
25
NH4
0
2
4
6
NO2 NO3
Figure 36. Dissolved oxygen and nutrients versus 2007 year dat.
67
NGI Progress Report NOAA Award #: NA06OAR4320264
Reporting Period: Jul 1, 2010 - Jun 30, 2011
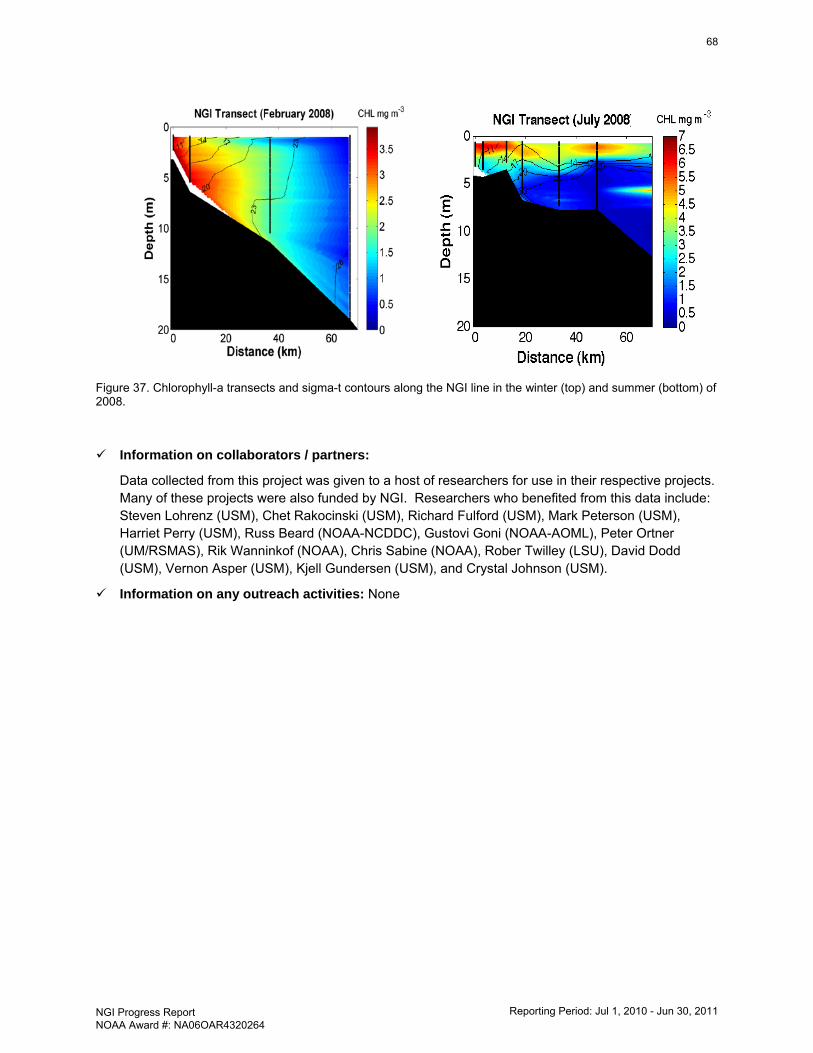
Figure 37. Chlorophyll-a transects and sigma-t contours along the NGI line in the winter (top) and summer (bottom) of 2008.
Information on collaborators / partners:
Data collected from this project was given to a host of researchers for use in their respective projects. Many of these projects were also funded by NGI. Researchers who benefited from this data include: Steven Lohrenz (USM), Chet Rakocinski (USM), Richard Fulford (USM), Mark Peterson (USM), Harriet Perry (USM), Russ Beard (NOAA-NCDDC), Gustovi Goni (NOAA-AOML), Peter Ortner (UM/RSMAS), Rik Wanninkof (NOAA), Chris Sabine (NOAA), Rober Twilley (LSU), David Dodd (USM), Vernon Asper (USM), Kjell Gundersen (USM), and Crystal Johnson (USM).
Information on any outreach activities: None
68
NGI Progress Report NOAA Award #: NA06OAR4320264
Reporting Period: Jul 1, 2010 - Jun 30, 2011
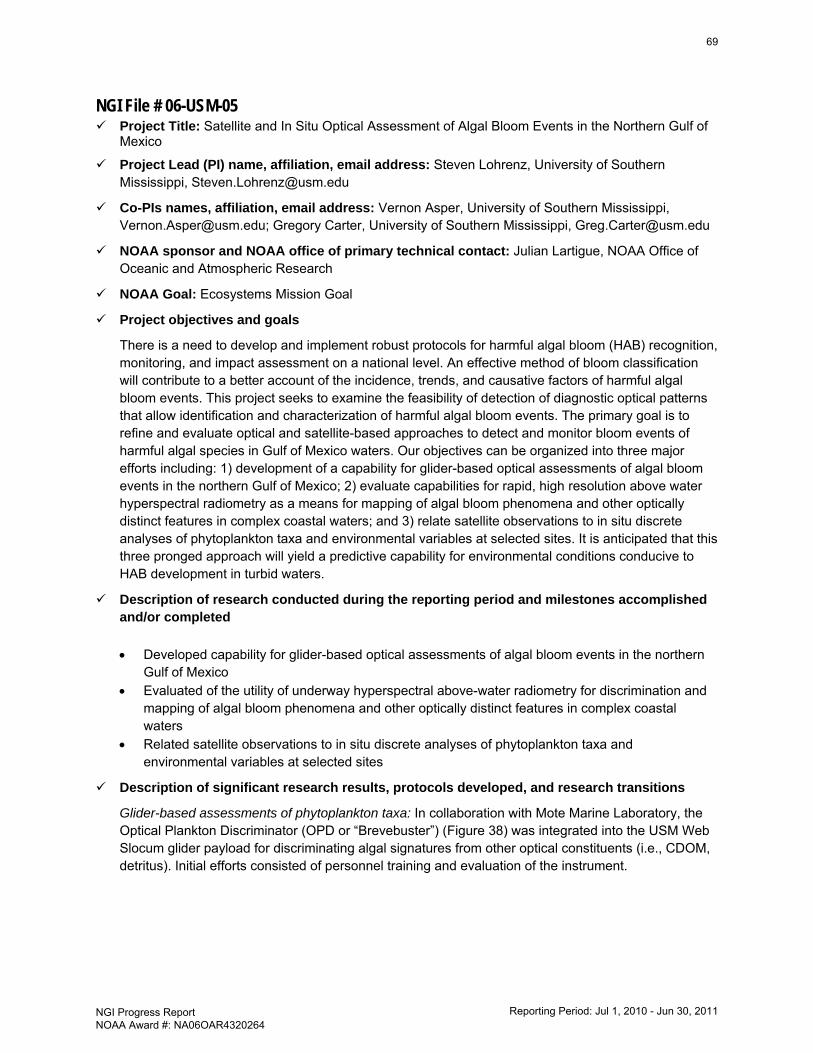
NGI File # 06-USM-05 Project Title: Satellite and In Situ Optical Assessment of Algal Bloom Events in the Northern Gulf of
Mexico
Project Lead (PI) name, affiliation, email address: Steven Lohrenz, University of Southern Mississippi, [email protected]
Co-PIs names, affiliation, email address: Vernon Asper, University of Southern Mississippi, [email protected]; Gregory Carter, University of Southern Mississippi, [email protected]
NOAA sponsor and NOAA office of primary technical contact: Julian Lartigue, NOAA Office of Oceanic and Atmospheric Research
NOAA Goal: Ecosystems Mission Goal
Project objectives and goals
There is a need to develop and implement robust protocols for harmful algal bloom (HAB) recognition, monitoring, and impact assessment on a national level. An effective method of bloom classification will contribute to a better account of the incidence, trends, and causative factors of harmful algal bloom events. This project seeks to examine the feasibility of detection of diagnostic optical patterns that allow identification and characterization of harmful algal bloom events. The primary goal is to refine and evaluate optical and satellite-based approaches to detect and monitor bloom events of harmful algal species in Gulf of Mexico waters. Our objectives can be organized into three major efforts including: 1) development of a capability for glider-based optical assessments of algal bloom events in the northern Gulf of Mexico; 2) evaluate capabilities for rapid, high resolution above water hyperspectral radiometry as a means for mapping of algal bloom phenomena and other optically distinct features in complex coastal waters; and 3) relate satellite observations to in situ discrete analyses of phytoplankton taxa and environmental variables at selected sites. It is anticipated that this three pronged approach will yield a predictive capability for environmental conditions conducive to HAB development in turbid waters.
Description of research conducted during the reporting period and milestones accomplished and/or completed
• Developed capability for glider-based optical assessments of algal bloom events in the northern Gulf of Mexico
• Evaluated of the utility of underway hyperspectral above-water radiometry for discrimination and mapping of algal bloom phenomena and other optically distinct features in complex coastal waters
• Related satellite observations to in situ discrete analyses of phytoplankton taxa and environmental variables at selected sites
Description of significant research results, protocols developed, and research transitions
Glider-based assessments of phytoplankton taxa: In collaboration with Mote Marine Laboratory, the Optical Plankton Discriminator (OPD or “Brevebuster”) (Figure 38) was integrated into the USM Web Slocum glider payload for discriminating algal signatures from other optical constituents (i.e., CDOM, detritus). Initial efforts consisted of personnel training and evaluation of the instrument.
69
NGI Progress Report NOAA Award #: NA06OAR4320264
Reporting Period: Jul 1, 2010 - Jun 30, 2011
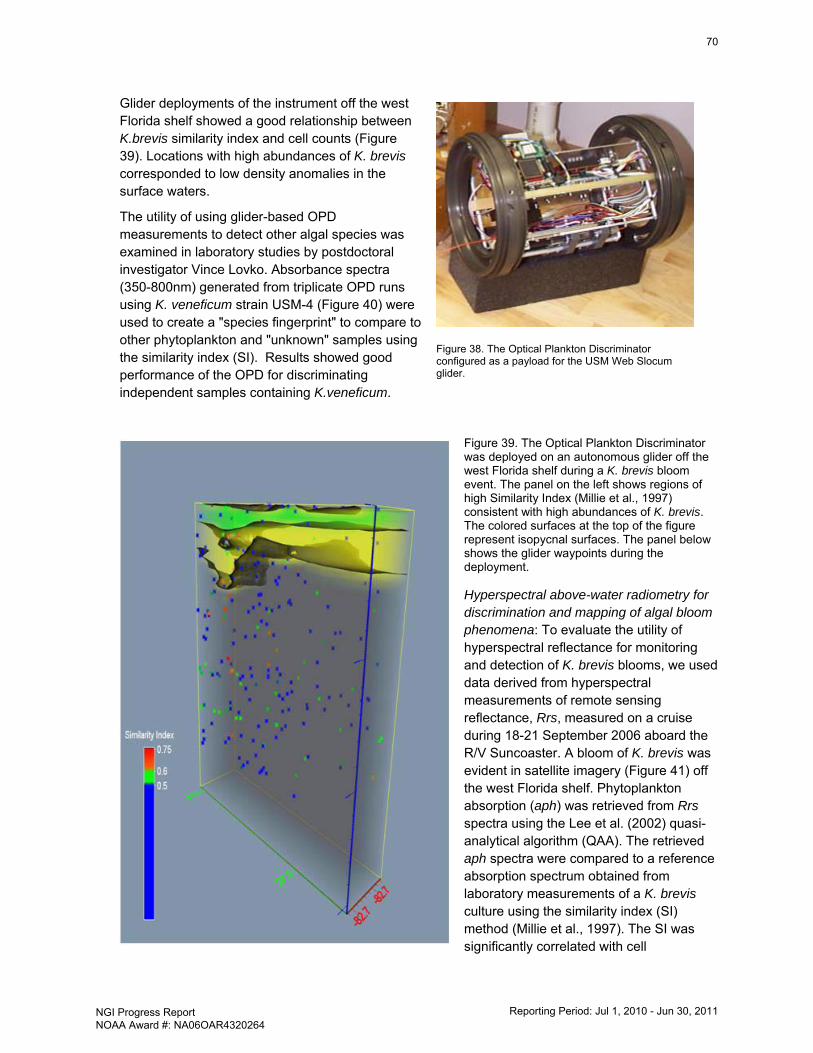
Glider deployments of the instrument off the west Florida shelf showed a good relationship between K.brevis similarity index and cell counts (Figure 39). Locations with high abundances of K. brevis corresponded to low density anomalies in the surface waters.
The utility of using glider-based OPD measurements to detect other algal species was examined in laboratory studies by postdoctoral investigator Vince Lovko. Absorbance spectra (350-800nm) generated from triplicate OPD runs using K. veneficum strain USM-4 (Figure 40) were used to create a "species fingerprint" to compare to other phytoplankton and "unknown" samples using the similarity index (SI). Results showed good performance of the OPD for discriminating independent samples containing K.veneficum.
Figure 39. The Optical Plankton Discriminator was deployed on an autonomous glider off the west Florida shelf during a K. brevis bloom event. The panel on the left shows regions of high Similarity Index (Millie et al., 1997) consistent with high abundances of K. brevis. The colored surfaces at the top of the figure represent isopycnal surfaces. The panel below shows the glider waypoints during the deployment.
Hyperspectral above-water radiometry for discrimination and mapping of algal bloom phenomena: To evaluate the utility of hyperspectral reflectance for monitoring and detection of K. brevis blooms, we used data derived from hyperspectral measurements of remote sensing reflectance, Rrs, measured on a cruise during 18-21 September 2006 aboard the R/V Suncoaster. A bloom of K. brevis was evident in satellite imagery (Figure 41) off the west Florida shelf. Phytoplankton absorption (aph) was retrieved from Rrs spectra using the Lee et al. (2002) quasi-analytical algorithm (QAA). The retrieved aph spectra were compared to a reference absorption spectrum obtained from laboratory measurements of a K. brevis culture using the similarity index (SI) method (Millie et al., 1997). The SI was significantly correlated with cell
Figure 38. The Optical Plankton Discriminator configured as a payload for the USM Web Slocum glider.
70
NGI Progress Report NOAA Award #: NA06OAR4320264
Reporting Period: Jul 1, 2010 - Jun 30, 2011
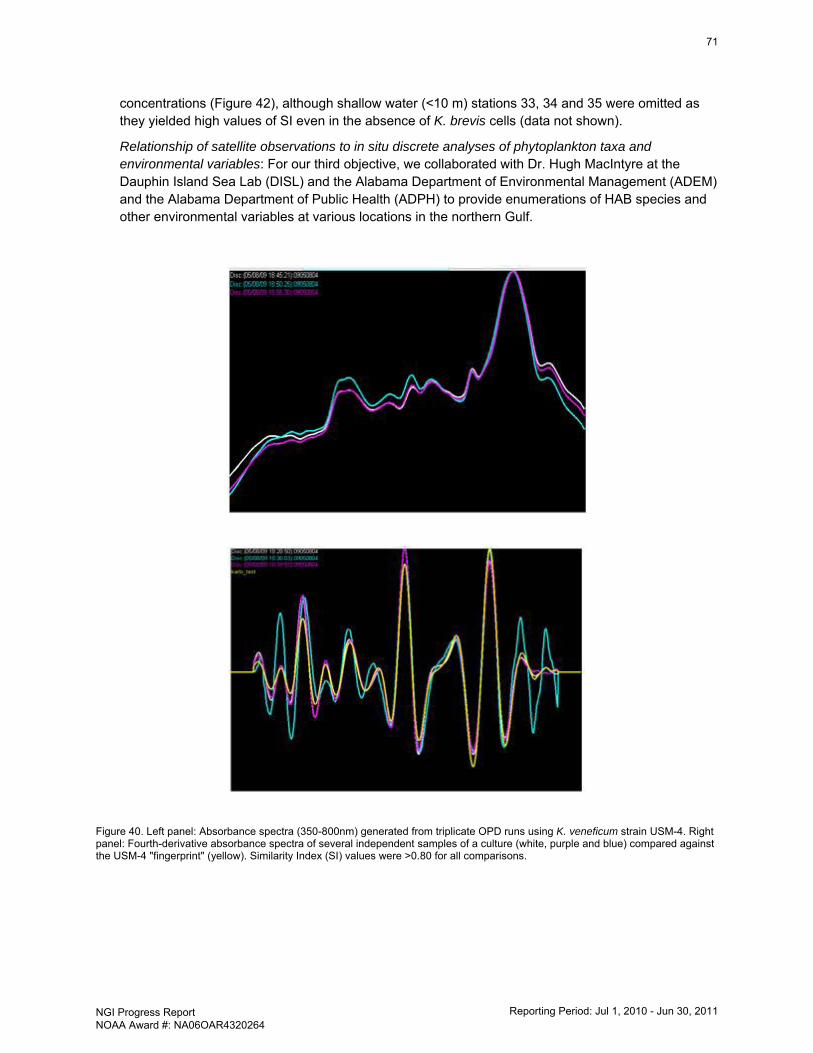
concentrations (Figure 42), although shallow water (<10 m) stations 33, 34 and 35 were omitted as they yielded high values of SI even in the absence of K. brevis cells (data not shown).
Relationship of satellite observations to in situ discrete analyses of phytoplankton taxa and environmental variables: For our third objective, we collaborated with Dr. Hugh MacIntyre at the Dauphin Island Sea Lab (DISL) and the Alabama Department of Environmental Management (ADEM) and the Alabama Department of Public Health (ADPH) to provide enumerations of HAB species and other environmental variables at various locations in the northern Gulf.
Figure 40. Left panel: Absorbance spectra (350-800nm) generated from triplicate OPD runs using K. veneficum strain USM-4. Right panel: Fourth-derivative absorbance spectra of several independent samples of a culture (white, purple and blue) compared against the USM-4 "fingerprint" (yellow). Similarity Index (SI) values were >0.80 for all comparisons.
71
NGI Progress Report NOAA Award #: NA06OAR4320264
Reporting Period: Jul 1, 2010 - Jun 30, 2011
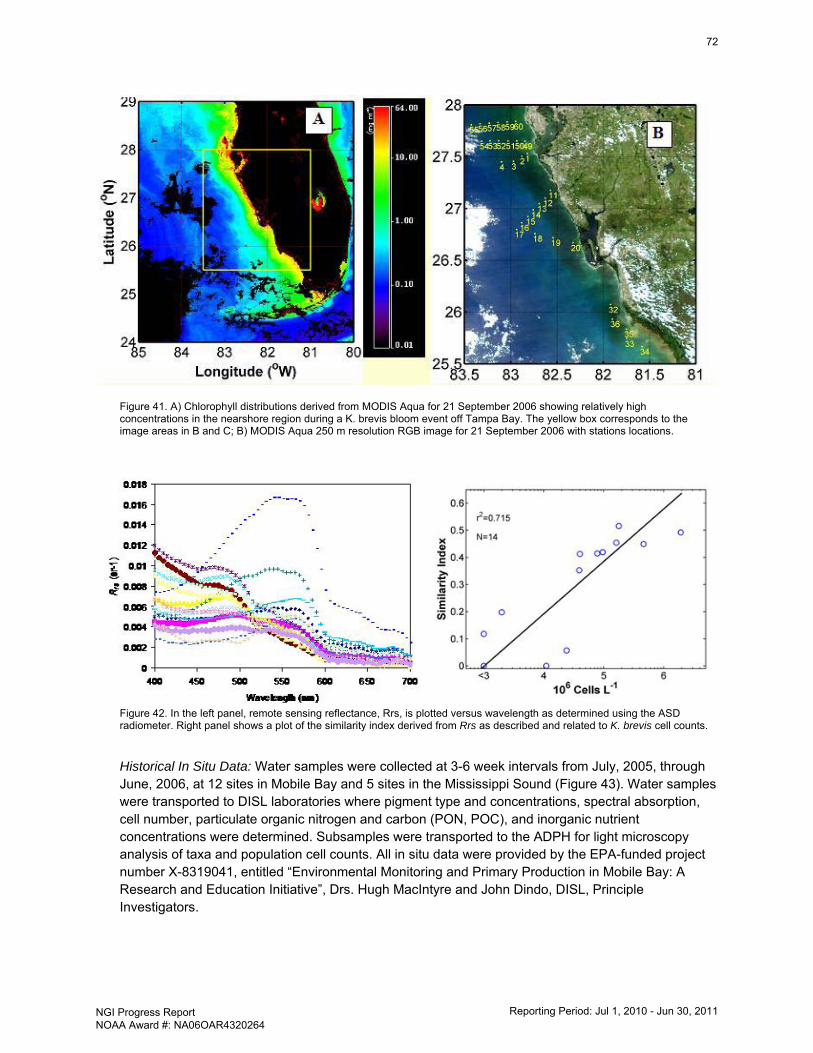
Figure 41. A) Chlorophyll distributions derived from MODIS Aqua for 21 September 2006 showing relatively high concentrations in the nearshore region during a K. brevis bloom event off Tampa Bay. The yellow box corresponds to the image areas in B and C; B) MODIS Aqua 250 m resolution RGB image for 21 September 2006 with stations locations.
Figure 42. In the left panel, remote sensing reflectance, Rrs, is plotted versus wavelength as determined using the ASD radiometer. Right panel shows a plot of the similarity index derived from Rrs as described and related to K. brevis cell counts.
Historical In Situ Data: Water samples were collected at 3-6 week intervals from July, 2005, through June, 2006, at 12 sites in Mobile Bay and 5 sites in the Mississippi Sound (Figure 43). Water samples were transported to DISL laboratories where pigment type and concentrations, spectral absorption, cell number, particulate organic nitrogen and carbon (PON, POC), and inorganic nutrient concentrations were determined. Subsamples were transported to the ADPH for light microscopy analysis of taxa and population cell counts. All in situ data were provided by the EPA-funded project number X-8319041, entitled “Environmental Monitoring and Primary Production in Mobile Bay: A Research and Education Initiative”, Drs. Hugh MacIntyre and John Dindo, DISL, Principle Investigators.
72
NGI Progress Report NOAA Award #: NA06OAR4320264
Reporting Period: Jul 1, 2010 - Jun 30, 2011
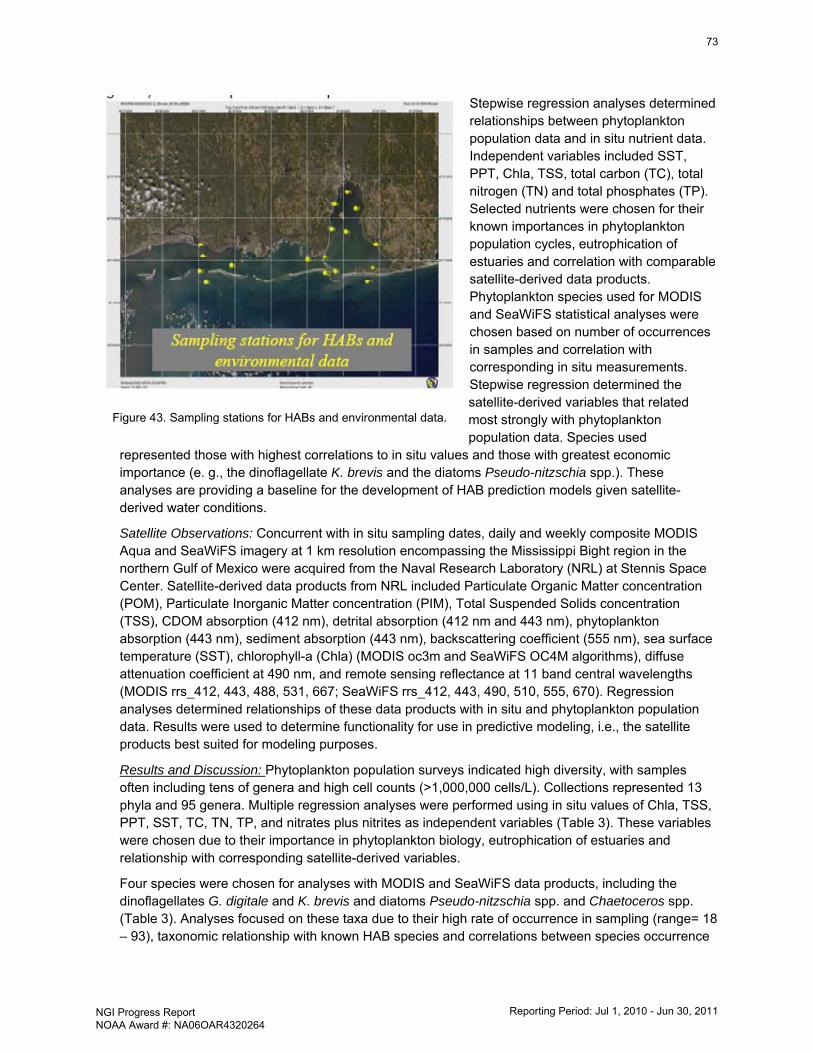
Stepwise regression analyses determined relationships between phytoplankton population data and in situ nutrient data. Independent variables included SST, PPT, Chla, TSS, total carbon (TC), total nitrogen (TN) and total phosphates (TP). Selected nutrients were chosen for their known importances in phytoplankton population cycles, eutrophication of estuaries and correlation with comparable satellite-derived data products. Phytoplankton species used for MODIS and SeaWiFS statistical analyses were chosen based on number of occurrences in samples and correlation with corresponding in situ measurements. Stepwise regression determined the satellite-derived variables that related most strongly with phytoplankton population data. Species used
represented those with highest correlations to in situ values and those with greatest economic importance (e. g., the dinoflagellate K. brevis and the diatoms Pseudo-nitzschia spp.). These analyses are providing a baseline for the development of HAB prediction models given satellite-derived water conditions.
Satellite Observations: Concurrent with in situ sampling dates, daily and weekly composite MODIS Aqua and SeaWiFS imagery at 1 km resolution encompassing the Mississippi Bight region in the northern Gulf of Mexico were acquired from the Naval Research Laboratory (NRL) at Stennis Space Center. Satellite-derived data products from NRL included Particulate Organic Matter concentration (POM), Particulate Inorganic Matter concentration (PIM), Total Suspended Solids concentration (TSS), CDOM absorption (412 nm), detrital absorption (412 nm and 443 nm), phytoplankton absorption (443 nm), sediment absorption (443 nm), backscattering coefficient (555 nm), sea surface temperature (SST), chlorophyll-a (Chla) (MODIS oc3m and SeaWiFS OC4M algorithms), diffuse attenuation coefficient at 490 nm, and remote sensing reflectance at 11 band central wavelengths (MODIS rrs_412, 443, 488, 531, 667; SeaWiFS rrs_412, 443, 490, 510, 555, 670). Regression analyses determined relationships of these data products with in situ and phytoplankton population data. Results were used to determine functionality for use in predictive modeling, i.e., the satellite products best suited for modeling purposes.
Results and Discussion: Phytoplankton population surveys indicated high diversity, with samples often including tens of genera and high cell counts (>1,000,000 cells/L). Collections represented 13 phyla and 95 genera. Multiple regression analyses were performed using in situ values of Chla, TSS, PPT, SST, TC, TN, TP, and nitrates plus nitrites as independent variables (Table 3). These variables were chosen due to their importance in phytoplankton biology, eutrophication of estuaries and relationship with corresponding satellite-derived variables.
Four species were chosen for analyses with MODIS and SeaWiFS data products, including the dinoflagellates G. digitale and K. brevis and diatoms Pseudo-nitzschia spp. and Chaetoceros spp. (Table 3). Analyses focused on these taxa due to their high rate of occurrence in sampling (range= 18 – 93), taxonomic relationship with known HAB species and correlations between species occurrence
Figure 43. Sampling stations for HABs and environmental data.
73
NGI Progress Report NOAA Award #: NA06OAR4320264
Reporting Period: Jul 1, 2010 - Jun 30, 2011
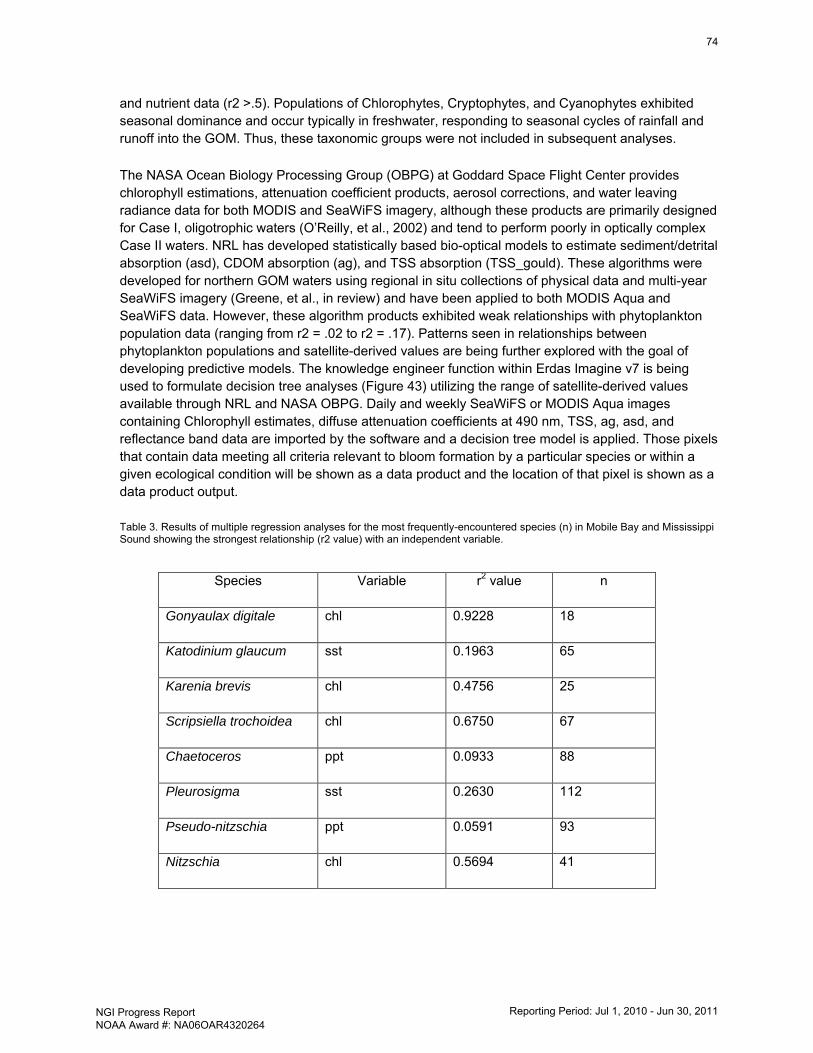
and nutrient data (r2 >.5). Populations of Chlorophytes, Cryptophytes, and Cyanophytes exhibited seasonal dominance and occur typically in freshwater, responding to seasonal cycles of rainfall and runoff into the GOM. Thus, these taxonomic groups were not included in subsequent analyses.
The NASA Ocean Biology Processing Group (OBPG) at Goddard Space Flight Center provides chlorophyll estimations, attenuation coefficient products, aerosol corrections, and water leaving radiance data for both MODIS and SeaWiFS imagery, although these products are primarily designed for Case I, oligotrophic waters (O’Reilly, et al., 2002) and tend to perform poorly in optically complex Case II waters. NRL has developed statistically based bio-optical models to estimate sediment/detrital absorption (asd), CDOM absorption (ag), and TSS absorption (TSS_gould). These algorithms were developed for northern GOM waters using regional in situ collections of physical data and multi-year SeaWiFS imagery (Greene, et al., in review) and have been applied to both MODIS Aqua and SeaWiFS data. However, these algorithm products exhibited weak relationships with phytoplankton population data (ranging from r2 = .02 to r2 = .17). Patterns seen in relationships between phytoplankton populations and satellite-derived values are being further explored with the goal of developing predictive models. The knowledge engineer function within Erdas Imagine v7 is being used to formulate decision tree analyses (Figure 43) utilizing the range of satellite-derived values available through NRL and NASA OBPG. Daily and weekly SeaWiFS or MODIS Aqua images containing Chlorophyll estimates, diffuse attenuation coefficients at 490 nm, TSS, ag, asd, and reflectance band data are imported by the software and a decision tree model is applied. Those pixels that contain data meeting all criteria relevant to bloom formation by a particular species or within a given ecological condition will be shown as a data product and the location of that pixel is shown as a data product output.
Table 3. Results of multiple regression analyses for the most frequently-encountered species (n) in Mobile Bay and Mississippi Sound showing the strongest relationship (r2 value) with an independent variable.
Species Variable r2 value n
Gonyaulax digitale chl 0.9228 18
Katodinium glaucum sst 0.1963 65
Karenia brevis chl 0.4756 25
Scripsiella trochoidea chl 0.6750 67
Chaetoceros ppt 0.0933 88
Pleurosigma sst 0.2630 112
Pseudo-nitzschia ppt 0.0591 93
Nitzschia chl 0.5694 41
74
NGI Progress Report NOAA Award #: NA06OAR4320264
Reporting Period: Jul 1, 2010 - Jun 30, 2011
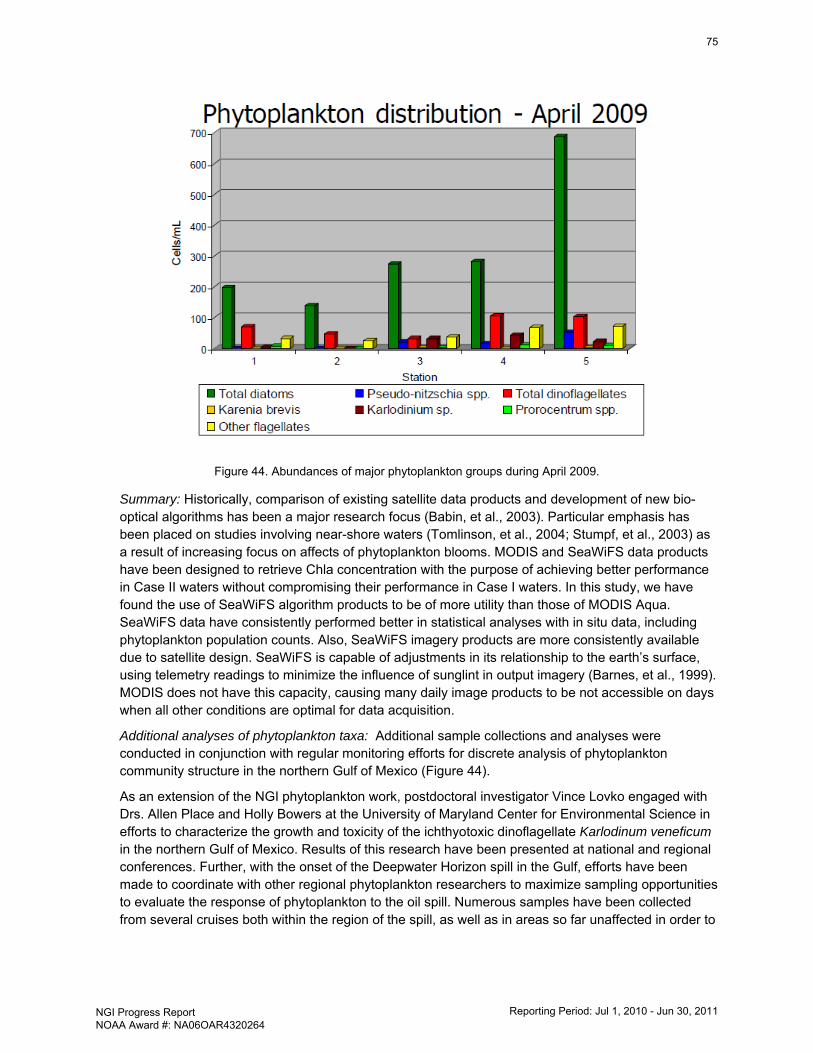
Figure 44. Abundances of major phytoplankton groups during April 2009.
Summary: Historically, comparison of existing satellite data products and development of new bio-optical algorithms has been a major research focus (Babin, et al., 2003). Particular emphasis has been placed on studies involving near-shore waters (Tomlinson, et al., 2004; Stumpf, et al., 2003) as a result of increasing focus on affects of phytoplankton blooms. MODIS and SeaWiFS data products have been designed to retrieve Chla concentration with the purpose of achieving better performance in Case II waters without compromising their performance in Case I waters. In this study, we have found the use of SeaWiFS algorithm products to be of more utility than those of MODIS Aqua. SeaWiFS data have consistently performed better in statistical analyses with in situ data, including phytoplankton population counts. Also, SeaWiFS imagery products are more consistently available due to satellite design. SeaWiFS is capable of adjustments in its relationship to the earth’s surface, using telemetry readings to minimize the influence of sunglint in output imagery (Barnes, et al., 1999). MODIS does not have this capacity, causing many daily image products to be not accessible on days when all other conditions are optimal for data acquisition.
Additional analyses of phytoplankton taxa: Additional sample collections and analyses were conducted in conjunction with regular monitoring efforts for discrete analysis of phytoplankton community structure in the northern Gulf of Mexico (Figure 44).
As an extension of the NGI phytoplankton work, postdoctoral investigator Vince Lovko engaged with Drs. Allen Place and Holly Bowers at the University of Maryland Center for Environmental Science in efforts to characterize the growth and toxicity of the ichthyotoxic dinoflagellate Karlodinum veneficum in the northern Gulf of Mexico. Results of this research have been presented at national and regional conferences. Further, with the onset of the Deepwater Horizon spill in the Gulf, efforts have been made to coordinate with other regional phytoplankton researchers to maximize sampling opportunities to evaluate the response of phytoplankton to the oil spill. Numerous samples have been collected from several cruises both within the region of the spill, as well as in areas so far unaffected in order to
75
NGI Progress Report NOAA Award #: NA06OAR4320264
Reporting Period: Jul 1, 2010 - Jun 30, 2011
gain a clear "before and after" picture of the effect of the oil spill on the phytoplankton community. Proposals are being developed to secure funding to further examine this issue.
Research transitions involving standardized methods for toxin detection are being explored in conjunction with Gulf of Mexico Alliance activities.
Information on collaborators / partners: a. Name of collaborating organization: Mote Marine Laboratory b. Date collaborating established: Jul 2007 c. Does partner provide monetary support to project? Amount of support? No d. Does partner provide non-monetary (in-kind) support? Yes e. Short description of collaboration/partnership relationship. Partner has provided
assistance in the operation of the Optical Plankton Discriminator, a glider-based sensor that discriminates algal taxa on the basis of spectral absorption signatures.
Information on any outreach activities: None
References
Babin, M., D. Stramski, G. M. Ferrari, H. Claustre, A. Bricaud, G. Obolensky, and N. Hoepffner, 2003. Variations in the light absorption coefficients of phytoplankton, nonalgal particles, and dissolved organic matter in coastal waters around Europe. Journal of Geophysical Research, 108(C7); 3211-3231.
Lee, Z.P., Carder, K.L. and Arnone, R.A., 2002. Deriving inherent optical properties from water color: a multiband quasi-analytical algorithm for optically deep waters. Applied Optics, 41(27): 5755-5772.
Millie, D.F. et al., 1997. Detection of harmful algal blooms using photopigments and absorption signatures: a case study of the Florida red-tide dinoflagellate, Gymnodinium breve. Limnology and Oceanography, 42: 1240-1251.
Babin, M., D. Stramski, G. M. Ferrari, H. Claustre, A. Bricaud, G. Obolensky, and N. Hoepffner, 2003. Variations in the light absorption coefficients of phytoplankton, nonalgal particles, and dissolved organic matter in coastal waters around Europe. Journal of Geophysical Research, 108(C7); 3211-3231.
Stumpf, R. P., M. E. Culver, P. A. Tester, M. Tomlinson, G. J. Kirkpatrick, B. A. Pederson, E. Truby, V. Ransibrahmanakul, and M. Soracco, 2003. Monitoring Karenia brevis blooms in the Gulf of Mexico using satellite ocean color imagery and other data. Harmful Algae 2:147-160.
Tomlinson, M. C., R. P. Stumpf, V. Ransibrahmanakul, E. W. Truby, G. J. Kirkpatrick, B. A. Pederson, G. A. Vargo, & C. A. Heil, 2004. Evaluation of the use of SeaWiFS imagery for detecting Karenia brevis harmful algal blooms in the eastern Gulf of Mexico. Remote Sensing of Environment 91: 293-303.
76
NGI Progress Report NOAA Award #: NA06OAR4320264
Reporting Period: Jul 1, 2010 - Jun 30, 2011
NGI File # 06-USM-06 Project Title: Coordination and Educational Support for USM Northern Gulf Institute Activities
Project Lead (PI) name, affiliation, email address: Steven Lohrenz, Dept. of Marine Science, University of Southern Mississippi, [email protected]
NOAA sponsor and NOAA office of primary technical contact: Julian Lartigue, NOAA Office of Oceanic and Atmospheric Research
NOAA Goal: Workforce development/Education
Project objectives and goals: The purpose of this project is to coordinate USM activities involved with the Northern Gulf Institute and provide outreach and education support for individual projects including graduate student participation in NGI projects. The objective is to provide coordination and integration among USM-led activities associated with the Northern Gulf Institute (NGI), and among activities of other academic and federal participants. An additional objective is to provide graduate student support for student participation in NGI projects. Finally, the proposed effort will work to publicize USM activities related to the NGI in various venues. Success of the NGI depends on meaningful communication among partners and within each participating organization. In addition, a principle goal of the NGI is to advance educational activities in fields associated with NOAA’s strategic goals. This project will support the overall goals of the NGI and specifically provide support for graduate student participation in NGI projects. Key findings and results will be publicized through websites, press releases, and other media outlets. Where feasible and appropriate, efforts will be made to transition research findings to operational elements within NOAA or other agencies.
Description of research conducted during the reporting period and milestones accomplished and/or completed
A workshop of the USM NGI PIs was held at the Gulf Coast Research Laboratory on September 19, 2008 to coordinate proposal preparation for the Year 4 and 5 NGI Request for Proposals. Details are given below. The PI has participated in regular Council of Fellows meetings, telecons, and the NGI Annual Conference.
Description of significant research results, protocols developed, and research transitions
N/A
Information on collaborators / partners: a. Name of collaborating organization: Dauphin Island Sea Lab b. Date collaborating established: Jul 2007 c. Does partner provide monetary support to project? Amount of support? No d. Does partner provide non-monetary (in-kind) support? No e. Short description of collaboration/partnership relationship: Coordination of regional
outreach and education activities on behalf of NGI
a. Name of collaborating organization: Gulf of Mexico Coastal Ocean Observing System Regional Association
b. Date collaborating established: Jul 2007 c. Does partner provide monetary support to project? Amount of support? No d. Does partner provide non-monetary (in-kind) support? No e. Short description of collaboration/partnership relationship: Coordination of regional
outreach and education activities on northern Gulf of Mexico related issues
a. Name of collaborating organization: Mississippi Dept. of Marine Resources
77
NGI Progress Report NOAA Award #: NA06OAR4320264
Reporting Period: Jul 1, 2010 - Jun 30, 2011
b. Date collaborating established: Jul 2007 c. Does partner provide monetary support to project? Amount of support? No d. Does partner provide non-monetary (in-kind) support? No e. Short description of collaboration/partnership relationship: Participation in seminar series
a. Name of collaborating organization: Mississippi Dept. of Environmental Quality b. Date collaborating established: Feb 2009 c. Does partner provide monetary support to project? Amount of support? No d. Does partner provide non-monetary (in-kind) support? No e. Short description of collaboration/partnership relationship: Participation in GOMA effort to
develop nutrient criteria for Gulf of Mexico
Information on any outreach activities: i. Type: Speaker ii. Name of event: DMS Weekly Seminar iii. Date: May 6, 2009 iv. Location: USM Dept. of Marine Science, Stennis Space Center, MS v. Description: Dr. Nicholas V.C. Ralston, University of North Dakota & Energy &
Environmental Research Center, Title: Understanding Mercury Risks and Selenium Benefits from Seafood Consumption
vi. Approximate Number of Participants:40
Various USM research projects were highlighted in the NGI Research Spotlight. These spotlight articles have been distributed to all potential students as well as upper administration and are included in all display materials used during conferences and workshops attended. The Research Spotlight flyers present an explanation of the research in everyday terminology; with difficult to understand terms being defined. These allow the public to become familiar with our research and aware of the ongoing issues and opportunities in the Gulf of Mexico.
Additionally, USM NGI PIs and students have participated in a variety of conferences and workshops including the Bays and Bayous Convention in Biloxi, MS (covered on the front page of the Spring 2009 departmental newsletter) that is sent to alums, faculty, students, staff, as well as other oceanographic research institutions. Other conference activities include the NGI Annual Conference, the Bonne Carre Coordination Workshop, the GOMA Monitoring Forum, the GOMA Nutrient Criteria Research Framework Workshop, and the Gulf Hypoxia Implementation Plan Workshop.
Our research is also represented to the public through our Marine Science web page with a direct link to NGI materials at http://www.usm.edu/marine/resources.php. There was planned involvement to present research to the general public in an open-house forum at NASA, but the event was canceled at the last minute due to inclement weather.
The PI as well as students and other faculty also participated in a series of presentations, symposia and workshops related to the Deepwater Horizon oil spill.
78
NGI Progress Report NOAA Award #: NA06OAR4320264
Reporting Period: Jul 1, 2010 - Jun 30, 2011
NGI File # 09-NGI-MOD-19 Project Title: Optimizing the use of lightning data in severe storm warning assessment, Year 2
Project Lead (PI) name, affiliation, email address: Henry E. Fuelberg, Dept. of Meterology, Florida State University
NOAA sponsor and NOAA office of primary technical contact: NOAA NESDIS
NOAA Goals: Weather and Water Mission Goal, Commerce and Transportation Mission Goal, Technology and Mission Support Goal
Project objectives and goals
Cloud-to-ground lightning data from the National Lightning Detection Network (NLDN) have been available to NWS offices for approximately a decade. However, only a handful of NWS offices currently can utilize total lightning source data from Lightning Mapping Arrays (LMAs). Fortunately, all NWS offices will have access to total lightning data when the GOES-R Geostationary Lightning Mapper (GLM) becomes operational during ~2015.
We utilized total lightning data (i.e., LMA, GLM-proxy, and NLDN), Rapid update cycle hourly model analyses, and WSR-88D data to develop algorithms and/or guidelines as to whether a particular storm is likely to require a warning. Our severe storm assessment product was developed using the Warning Decision Support – Integrated Information (WDSS-II) software and lightning data from the LMA in Sterling, VA and additional locations.
WDSS-II allowed us to combine multiple data sources to examine lightning and radar parameters within many severe and non-severe storms, allowing us to complement the more typical case study mode. Based on our investigation of many storms on numerous days, our overriding goal was to develop guidance products that will best utilize data from the upcoming GLM in assessing storm severity. These products ultimately could be beta tested on WDSS-II at selected NWS offices, and if proven useful, transitioned to the AWIPS environment, where they could be used by the NWS to issue improved warnings, thereby leading to fewer injuries, fatalities, and loss of property.
Description of research conducted during the reporting period and milestones accomplished and/or completed
• Procedures were developed and automated to retrieve data and compute higher order radar, model-derived, and lightning parameters. This allowed us to thoroughly describe the nature of individual storm systems that occur on any chosen day.
• The merger of radar and model-derived data was automated to provide near-storm environment information to the WSR-88D algorithms and to compute additional parameters that we will relate to storm severity.
• We automated the WDSS-II data mining algorithm (w2segmotionll) to track individual cells and to output the various parameters to a table that was recorded at 2-min intervals.
• A technique was developed to combine the 2-min storm data tables into a database of all storms occurring on a given day. These tools allowed us to view time series of radar and lightning parameters for individual storm cells throughout their lifecycles.
• Individual lightning “sources” from the Sterling LMA were used to create GLM proxy parameters. We created LMA products on an 8×8 km grid to simulate the resolution of the upcoming GLM sensor.
79
NGI Progress Report NOAA Award #: NA06OAR4320264
Reporting Period: Jul 1, 2010 - Jun 30, 2011
• We combined algorithms to compute rotation tracks and hail swaths over varying time periods for inclusion in our storm database.
• We automated w2segmotion to track individual storms and output their lightning and radar characteristics to a database at 2-min intervals. The algorithm allowed us to select the field to be tracked (a lightning or radar parameter), define the minimum size of features, and set thresholds to facilitate consistent tracking of coherent features.
• We manually inspected each storm to determine if WDSS-II had assigned different identifiers to what appeared to be the same feature at different parts of its lifetime. If so, we designated a new identifier to consolidate the data points into a single storm.
• During our manual inspection, we also designated each storm as being isolated or line/multicell depending on the number of updrafts (number of relative Ref20C maxima) contained by each. Although no specific distance threshold was required for storms to be defined as isolated, clear air must have separated isolated storms from neighboring storms.
• The resulting storm database then was inspected using GIS. We first displayed all storm centroids and selected storms of interest based on their duration, path, and distance from the radar and LMA sensors. Storm reports then were overlaid with all storm centroids to make comparisons and determine each storm’s severity (severe versus non-severe).
• We examined 61 case study days in the Mid-Atlantic region during 2007–09. Each case included many individual storms and at least one severe storm. These cases were used to develop a lightning and radar climatology of storms in the Mid-Atlantic.
• We compared mean values of radar and lightning parameters in severe versus non-severe and isolated versus line/multicell storms, and used a Student’s t-test to determine the significance of differences that were observed in the mean lightning and radar parameters.
Description of significant research results, protocols developed, and research transitions
The research examined more than 1500 severe and non-severe storms in the Mid-Atlantic region of the United States during 2007–09. We used the Warning Decision Support System – Integrated Information (WDSS-II) and Geographic Information System (GIS) software packages to examine lightning and radar parameters in many individual storms. Subsets of severe versus non-severe and isolated versus line/multicell storms were used to document relationships between lightning parameters, radar-derived storm structure, and storm severity.
The research demonstrated our ability to examine lightning and radar parameters in a large number of storms using WDSS-II and GIS software. It also demonstrated the influence of storm structure on lightning production, and indicated the importance of grouping storms based on their structure (i.e., isolated versus line/multicell). Our large dataset confirmed several relationships between lightning and radar parameters that previously had only been documented in relatively few storms. For example, severe storms in the Mid-Atlantic region exhibited stronger radar-derived parameters and greater intra-cloud (IC) and cloud-to-ground (CG) flash densities than non-severe storms. In addition, maximum IC flash densities differed more between severe and non-severe storms than did negative CG (–CG) densities. Flash-based IC products were better correlated with CG and radar parameters than were source-based IC products, implying that accurate IC flash counts will be required to relate lightning production to storm structure, evolution, and severity.
80
NGI Progress Report NOAA Award #: NA06OAR4320264
Reporting Period: Jul 1, 2010 - Jun 30, 2011
Spatial averages of 2-min storm centroid points illustrated the influence of synoptic and mesoscale systems on the location, structure, and severity of storms in the Mid-Atlantic region. These spatial plots illustrated recurring features that were initially observed during our manual inspection of 1697 storms using WDSS-II. The plots also identified locations where synoptic and mesoscale lifting mechanisms often combine to support severe storm initiation. We located common severe storm tracks, revealed that line/multicell storms become more common as storms approach the coastal regions, and showed that –CG characteristics are greatest in the southeastern half of our domain.
Results indicated that the line/multicell storms in our dataset were more intense than the isolated storms, exhibiting stronger values of radar parameters and greater intra-cloud (IC) and –CG flash densities. We demonstrated that storm structure (isolated versus line/multicell storms) has a strong influence on the relative IC and –CG distributions (both amounts and characteristics). For example, strong line/multicell storms, as defined by radar parameters, produce strong –CG flashes (large –CG multiplicity and estimated peak current Ip) which help explain the greater –CG multiplicity and Ip over inland coastal regions.
The results demonstrated that storm-scale relationships exist between CG and IC characteristics, and also between lightning and radar parameters. Histograms and cumulative percentages illustrated differences between the lightning and radar characteristics of severe versus non-severe storms. They also revealed that individual lightning and radar-derived parameters can help determine the likelihood that a given storm is severe or non-severe. However, since these statistics only provide a first guess as to a storm’s potential severity, we also examined relationships between pairs of IC, CG, and radar-derived parameters.
Correlation analysis helped identify and compare relationships between lightning and radar parameters. Scatter diagrams revealed that the relationships between IC, CG, and radar-derived parameters are similar in both severe and non-severe storms. As anticipated, IC characteristics correlated well with many radar parameters as well as –CG flash density. –CG flash density also was strongly correlated with several radar-derived parameters. This finding suggests that –CG characteristics are indicative of storm intensity. Specifically, –CG flash density, multiplicity, and |Ip| are intercorrelated and directly related to the height of the 30 dBZ echo top above the -10°C isotherm (H30above263K). We also showed that –CG multiplicity and Ip are inversely related on the storm scale, exhibiting their greatest values in line/multicell storms and also when storms are most intense.
Positive CG (+CG) distributions revealed two unusual features. First, +CG Ip was found to be inversely related to various IC and radar-derived measures of storm intensity. We also found that the non-severe storms in our database exhibited a slightly greater +CG percentage than the severe storms. These unusual +CG findings further illustrate the influence of NLDN measurement capabilities on +CG distributions, and suggest that additional quality control procedures beyond the customary weak +CG Ip threshold will be required to remove misclassified weak +CG reports (i.e., IC versus CG).
Since the upcoming GOES-R Geostationary Lightning Mapper (GLM) will provide total lightning observations at ~8 km horizontal resolution, IC products were examined on both 2×2 km and 8×8 km grids. IC products at both resolutions were similarly correlated with CG and radar-derived parameters. This suggests that the GLM will provide valuable IC information that is comparable to the 2–D information currently provided by local 3-D Lightning Mapping Array (LMA) networks.
81
NGI Progress Report NOAA Award #: NA06OAR4320264
Reporting Period: Jul 1, 2010 - Jun 30, 2011
Various correlations revealed that the IC, CG, and radar datasets complement one another, suggesting that their combination can be used to improve the discernment of storm structure, evolution, and severity. However, our analyses also illustrate the complex nature of the apparent relationships. They show that different storm types (e.g., isolated versus line/multicell) exhibit different lightning characteristics, thereby revealing the importance of storm structure on relationships between lightning and radar parameters in individual storms.
Information on collaborators / partners: a. Name of collaborating organization: Tallahassee Weather Forecast Office b. Date collaborating established: Jul 1, 2008 c. Does partner provide monetary support to project? Amount of support? No d. Does partner provide non-monetary (in-kind) support? Yes e. Short description of collaboration/partnership relationship. Cloud-to-ground data and
severe weather expertise.
a. Name of collaborating organization: National Severe Storms Lab b. Date collaborating established: Jul 1, 2008 c. Does partner provide monetary support to project? Amount of support? No d. Does partner provide non-monetary (in-kind) support? Yes e. Short description of collaboration/partnership relationship. Advice, support, trouble
shooting for WDSS-II
a. Name of collaborating organization: National Hazardous Weather Testbed b. Date collaborating established: May 2009 c. Does partner provide monetary support to project? Amount of support? Yes d. Does partner provide non-monetary (in-kind) support? No e. Short description of collaboration/partnership relationship. Funded student participation in
the HWT spring experiment 2009, which allowed first hand observation of the transition of technology and/or products from research to operations.
a. Name of collaborating organization: NOAA/NESDIS/GOES-R Program Office b. Date collaborating established: Jul 1, 2008 c. Does partner provide monetary support to project? Amount of support? Yes d. Does partner provide non-monetary (in-kind) support? Yes e. Short description of collaboration/partnership relationship. Provide full support for the
modification grant that funded our research. They also provided data from, and background information on, the Washington D.C. Lightning Mapping Array.
Information on any outreach activities: Our project required feedback from the operational meteorology community, and also benefited by associations with the total lightning and severe weather communities. Our work has been presented and discussed at many forums, allowing extensive feedback.
i. Type: Invited presentation ii. Name of event: Ohio State University’s 13th Annual Severe Weather Symposium iii. Date: Apr 17, 2009 iv. Location: Columbus, OH v. Description: Student described “Total Lightning Research and Operational
Applications” vi. Approximate Number of Participants: ~150
i. Type: Invited presentation ii. Name of event: KSC Local AMS Meeting iii. Date: Jun 18, 2009
82
NGI Progress Report NOAA Award #: NA06OAR4320264
Reporting Period: Jul 1, 2010 - Jun 30, 2011
iv. Location: Patrick AFB, FL v. Description: Student described “Total Lightning Research and Operational
Applications” vi. Approximate Number of Participants: 15
i. Type: Invited presentation ii. Name of event: North Florida Local AMS Meeting iii. Date: Mar 23, 2010 iv. Location: Tallahassee, FL v. Description: Student described “Operational Applications of Lightning
Information” vi. Approximate Number of Participants: 25
Type: Workshop Name of event: Southern Thunder Workshop 2009 Date: Apr 2008 & Aug 2009 Location: Tallahassee, FL & Cocoa Beach, FL Description: Student served on the planning committee and the program
subcommittee Approximate Number of Participants: 65
83
NGI Progress Report NOAA Award #: NA06OAR4320264
Reporting Period: Jul 1, 2010 - Jun 30, 2011
NGI File # 09-NGI-MOD-22/10-NGI-MOD-34 Project Title: Advanced Data Assimilation Experiments for GOES-R Series Application
Project Lead (PI) name, affiliation, email address: Xiaolei Zou, Florida State University, [email protected]
NOAA sponsor and NOAA office of primary technical contact: Fuzhong Weng, NOAA NESDIS
NOAA goal(s): Weather and Water Mission Goal, Technology and Mission Support Goal
Project objectives and goals
This project deals with the assimilation process of GOES-11/12/13 imager radiance assimilation in National Centers for Environmental Prediction (NCEP) global forecast systems. The objectives of the research are:
To understand the physical and dynamic processes responsible for coastal precipitation near Gulf of Mexico;
To understand the key information needed for NWP in GOES imager radiances at different channels; and.
To study the added values of GOES imager data to conventional and other satellite data already assimilated in the operational GSI system.
The goals are to incorporate these data into NCEP operational forecast systems and to use them as preparation for the GOES-R data. In our previous studies, infrared (IR) observations from the GOES imager were assimilated into Gridpoint Statistical Interpolation (GSI) analysis system that is used for global and regional analyses at NCEP, GSFC and is under development for use at AFWA. The Community Radiative Transfer Model (CRTM) was enhanced with several critical components for IR radiance assimilation, such as availability of a dynamically-updated land surface emissivity dataset, as well as improvements made to the fast and accurate gaseous absorption modules. The WMO GSICS GEO-LEO calibration algorithms were applied to reduce biases in IR radiances. Preliminary results indicate that inclusion of SEVIRI and GOES Imager radiances improved water vapor analysis fields and also resulted in some positive impacts on global medium range forecasts.
In order to improve IR radiance simulation, especially over land and cloudy regions, we plan to enhance the CRTM IR land surface emissivity database over areas where the SEVIRI and GOES observations are available. We will further investigate the assimilation of IR surface sensitive channels by using land surface temperature diagnosed from the NOAH land surface model and including the land surface temperature at the observation location as part of the analysis problem. The preliminary quality control (QC) and bias correction procedures will be examined for both clear-sky and cloud-affected radiance assimilation and modified when necessary in a manner consistent with those techniques used for other radiance data. In the assimilation of cloud-affected radiances, the forward calculations in cloudy areas for water vapor and temperature sounding channels will include the use of those cloud parameters diagnosed from the window channel radiances and/or predicted from NWP models.
The data are presented to the analysis system in two forms, the original raw data and area-averaged data. Much of the work done to this point has been with the area-averaged data. Since some quality control (usually insufficient) has been applied to this data prior to the averaging, information has been lost before it is used. For the GOES-R data, to use the information more completely, the original raw data should be used. Initial studies have been performed using sample full-resolution SEVIRI datasets. These can be used both to evaluate the quality control used in producing the low-resolution
84
NGI Progress Report NOAA Award #: NA06OAR4320264
Reporting Period: Jul 1, 2010 - Jun 30, 2011
datasets that are commonly available and to design optimal thinning and assimilation strategies once high-resolution data are available. Unfortunately for the current operational data (GOES-11-13), the raw data is not available in real time due to communication and hardware limitations.
Description of research conducted during the reporting period and milestones accomplished and/or completed
● Incorporated GOES imager radiance data into GSI system;
● Assessed added values of GOES 11/12 imager data to assimilation of conventional data;
● Improvement on quantitative precipitation (PWF) skill using GOES imager data demonstrated;
● High-resolution GOES imager data processed and examined;
● Continuation of GOES imager data assimilation in the presence of other satellite data.
Description of significant research results, protocols developed, and research transitions
1) Improved coastal precipitation forecasts with direct assimilation of GOES 11/12 imager radiances added to assimilation of conventional data
The GOES imager on board Geostationary Operational Environmental Satellite (GOES) provides observations that are of high spatial and temporal resolution and can be applied for effectively monitoring and nowcasting severe weather events. In this study, improved quantitative precipitation forecasts (QPFs) for three coastal storms over the northern Gulf of Mexico and the east coast is demonstrated by assimilating GOES-11 and GOES-12 imager radiances into the Weather Research and Forecast (WRF) model. Both the National Centers for Environmental Prediction (NCEP) Gridpoint Statistical Interpolation (GSI) analysis system and the Community Radiative Transfer Model (CRTM) are utilized to ingest GOES IR clear-sky data. Assimilation of GOES imager radiances during a 12-hour time window prior to convective initiation made a significant difference in the forecast of an upstream trough that modulated the eastward movement of an convective precipitation event near the coast in the northern Gulf of Mexico. A detailed diagnosis of analysis fields and model forecast fields reveals that the assimilation of GOES data in regions of no or little clouds improved the model description of an upstream middle latitude trough and a subtropical high located in the south of the convection. The GOES observations located in the west part of land region covered by GOES within the latitude zone of 18oN - 37oN nearby the longitude of 100oW contributed to a better forecast of the position of the eastward propagating trough, while GOES observations over the Gulf of Mexico increased the amount of water vapor advection from the south into the convective region by the wind associated with the subtropical high. In the past, GOES imager radiances were not directly used in the GSI system. This study highlights the importance of satellite imagery information observed in the pre-convective environment for improved cloud and precipitation forecasts. The developed data assimilation technique will prepare the NWP user community for accelerated use of advanced satellite data from the GOES-R series.
2) Impacts of GOES Imager Radiance Data Assimilation on Precipitation Forecasts in the Presence of Other Satellite Observations assimilated in GSI Operational System
Our previous study showed the importance of satellite imagery information observed in the pre-convective environment for improved coastal precipitation forecasts near Gulf of Mexico. As the follow-on step, impacts of GOES-11/12 Imager radiances on coastal precipitation forecasts in the presence of other satellite observations assimilated in GSI operational system are examined. Numerical results show that direct assimilation of GOES imager radiances in clear-sky conditions can still improve quantitative precipitation forecast (QPF) forecast in most conditions. Improvements on precipitation skill are more significant when the reference forecasts are poorer.
85
NGI Progress Report NOAA Award #: NA06OAR4320264
Reporting Period: Jul 1, 2010 - Jun 30, 2011
Information on collaborators / partners: None
Information on any outreach activities: None
86
NGI Progress Report NOAA Award #: NA06OAR4320264
Reporting Period: Jul 1, 2010 - Jun 30, 2011
NGI File # 09-NGI-MOD-23 Project Title: NGI Sustained Operations Alternatives
Project Lead (PI) name, affiliation, email address: Robert Moorhead, Mississippi State University, [email protected]
Co-PI(s) name(s), affiliation, email address: Jeffrey Roberts, Alaska Aerospace Development Corporation, [email protected]
NOAA sponsor and NOAA office of primary technical contact: Robbie Hood, Office of Oceanic and Atmospheric Administration
NOAA Goal(s): Weather and Water Mission Goal, Technology and Mission Support Goal
Project objectives and goals
Collect, collate, and document pertinent information requested by the NOAA UAS Program Director to assist in the development of an internal NOAA acquisition strategy for UAS operations.
Description of research conducted during the reporting period and milestones accomplished and/or completed
Customs and Border Protection Predator B Operations at Grand Forks AFB
• Organization • Facilities • Mission Execution • Maintenance Support • Lessons Learned • Conclusion and Recommendation
Analysis of locating UAS operations at NASA Wallops Flight Facility, Wallops Island, VA:
• Description of WFF • Beneficial Aspects of WFF: Location, Restricted Airspace, Weather, Utilization,
Environmental, Security and Services, Encroachment, NOAA/NASA Relationship, Hanger Space, and UAS Support
• Detrimental Aspects of WFF: Competition for Resources and Cost Sharing • Recommendations
Description of significant research results, protocols developed, and research transitions N/A
Information on collaborators / partners: None
Information on any outreach activities: None
87
NGI Progress Report NOAA Award #: NA06OAR4320264
Reporting Period: Jul 1, 2010 - Jun 30, 2011
NGI File # 09-NGI-MOD-24 Project Title: NOAA Coastal Storms Program – ADCIRC (Storm Surge) Grid Cataloging Project
Project Lead (PI) name, affiliation, email address: John Harding, Ph.D., Northern Gulf Institute, Mississippi State University, [email protected]
NOAA sponsor and NOAA office of primary technical contact: Doug Marcy, Coastal Services Center
NOAA Goal(s): Weather and Water Mission Goal, Technology and Mission Support Goal
Project objectives and goals
Through NOAA’s Coastal Storms Program an online catalog of unstructured grids used in hydrodynamic modeling projects has been proposed to document existing and future models in the Gulf of Mexico. This unstructured grid catalog is intended to provide modelers, coastal managers, and funding agencies with a mechanism of sharing grids and information about projects to help identify modeling gaps and redundancies. Year 1 of this project hosted workshops and produced an assessment of the feasibility of developing a prototype catalog of unstructured grids used in storm surge models. Year 2 of this project supported NOAA’s continued development of the prototype catalog through joint sponsorship of and participation in the implementation workshop and on the project team reviewing status and recommendations, establishing roles and responsibilities and developing the long-term maintenance plan. Goal of year 2 effort is to develop a list of features and functionalities to enhance the Unstructured Grid Catalog for the Gulf of Mexico that the National Geophysical Data Center (NGDC) can then implement in the final grid catalog.
Description of research conducted during the reporting period and milestones accomplished and/or completed
Arranged travel for university participants as well as participated in the planning and execution of the Unstructured Grid Implementation Workshop
Description of significant research results, protocols developed, and research transitions
Provided input to NGDC list of features and functionalities to enhance the NGDC Unstructured Grid Catalog for the Gulf of Mexico
Information on collaborators / partners: a. Name of collaborating organization: Barry Eakins, NOAA National Geophysical Data
Center b. Date collaborating established: Jul 1, 2009 c. Does partner provide monetary support to project? Amount of support? No d. Does partner provide non-monetary (in-kind) support? Yes e. Short description of collaboration/partnership relationship. Workshop co-
sponsor/host/implementer of NGDC unstructured grid catalog
f. Name of collaborating organization: Doug Marcy, NOAA Coastal Services Center g. Date collaborating established: Jul 1, 2009 h. Does partner provide monetary support to project? Amount of support? Yes, $15K i. Does partner provide non-monetary (in-kind) support? Yes j. Short description of collaboration/partnership relationship. Primary funding
sponsor/workshop co-sponsor/participant
88
NGI Progress Report NOAA Award #: NA06OAR4320264
Reporting Period: Jul 1, 2010 - Jun 30, 2011
Information on any outreach activities: i. Type: Workshop ii. Name of event: Unstructured Grid Catalog Evaluation Workshop iii. Date: Sep 1-2, 2011 iv. Location: NGDC, Boulder, CO v. Description: Workshop designed to develop a list of features and functionalities
to enhance the NGDC Unstructured Grid Catalog for the Gulf of Mexico vi. Approximate Number of Participants: 10
89
NGI Progress Report NOAA Award #: NA06OAR4320264
Reporting Period: Jul 1, 2010 - Jun 30, 2011
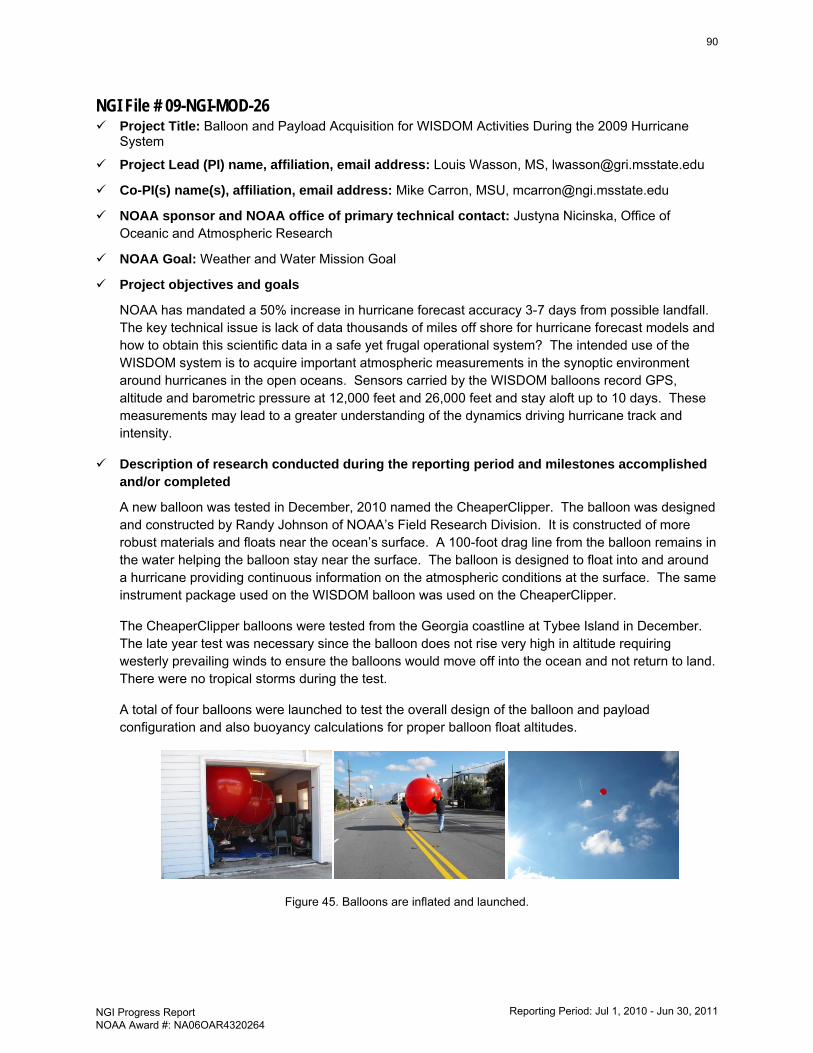
NGI File # 09-NGI-MOD-26 Project Title: Balloon and Payload Acquisition for WISDOM Activities During the 2009 Hurricane
System
Project Lead (PI) name, affiliation, email address: Louis Wasson, MS, [email protected]
Co-PI(s) name(s), affiliation, email address: Mike Carron, MSU, [email protected]
NOAA sponsor and NOAA office of primary technical contact: Justyna Nicinska, Office of Oceanic and Atmospheric Research
NOAA Goal: Weather and Water Mission Goal
Project objectives and goals
NOAA has mandated a 50% increase in hurricane forecast accuracy 3-7 days from possible landfall. The key technical issue is lack of data thousands of miles off shore for hurricane forecast models and how to obtain this scientific data in a safe yet frugal operational system? The intended use of the WISDOM system is to acquire important atmospheric measurements in the synoptic environment around hurricanes in the open oceans. Sensors carried by the WISDOM balloons record GPS, altitude and barometric pressure at 12,000 feet and 26,000 feet and stay aloft up to 10 days. These measurements may lead to a greater understanding of the dynamics driving hurricane track and intensity.
Description of research conducted during the reporting period and milestones accomplished and/or completed
A new balloon was tested in December, 2010 named the CheaperClipper. The balloon was designed and constructed by Randy Johnson of NOAA’s Field Research Division. It is constructed of more robust materials and floats near the ocean’s surface. A 100-foot drag line from the balloon remains in the water helping the balloon stay near the surface. The balloon is designed to float into and around a hurricane providing continuous information on the atmospheric conditions at the surface. The same instrument package used on the WISDOM balloon was used on the CheaperClipper.
The CheaperClipper balloons were tested from the Georgia coastline at Tybee Island in December. The late year test was necessary since the balloon does not rise very high in altitude requiring westerly prevailing winds to ensure the balloons would move off into the ocean and not return to land. There were no tropical storms during the test.
A total of four balloons were launched to test the overall design of the balloon and payload configuration and also buoyancy calculations for proper balloon float altitudes.
Figure 45. Balloons are inflated and launched.
90
NGI Progress Report NOAA Award #: NA06OAR4320264
Reporting Period: Jul 1, 2010 - Jun 30, 2011
Description of significant research results, protocols developed, and research transitions
Balloons were launched to test the overall design of the balloon and payload configuration and also buoyancy calculations for proper balloon float altitudes. These tests will hopefully lead to a greater understanding of the dynamics driving hurricane track and intensity.
Information on collaborators / partners: None
Information on any outreach activities:
This project was featured in numerous publications promoting NGI and the Geosystems Research Institute at MSU.
91
NGI Progress Report NOAA Award #: NA06OAR4320264
Reporting Period: Jul 1, 2010 - Jun 30, 2011
NGI File # 09-NGI-MOD-28 Project Title: NGI & NCDDC Hyperspectral Imagery Support to the GOMA Habitat Project for Grand
Bay
Project Lead (PI) name, affiliation, email address: John Harding, Ph.D., Northern Gulf Institute, Mississippi State University, [email protected]
Co-PI name, affiliation, email address: Mark Woodrey, Ph.D., MSU-CREC, [email protected]
NOAA sponsor and NOAA office of primary technical contact: Rost Parsons, National Coastal Data Development Center
NOAA Goals: Ecosystem Mission Goal, Climate Mission Goal
Project objectives and goals
In July, 2009, the Northern Gulf Institute, the Environmental Cooperative Science Center and Grand Bay National Estuarine Research Reserve (NERR) partnered to conduct a flyover and collect hyperspectral data for the entire Grand Bay NERR. The Grand Bay Reserve encompasses 18,400 acres in southeastern Mississippi between Pascagoula and the Alabama state line. Key habitats include: pine savanna, freshwater marshes, Juncus roemarianus (black needlerush) dominated salt marsh, salt pannes, oyster reefs, and seagrasses. This imagery will be one of the largest continuous coverage hyperspectral datasets along the Gulf of Mexico and the only dataset that completely covers a National Estuarine Research Reserve. The goal of this effort is to collect a large-scale, complete hyperspectral dataset for the entire Grand Bay NERR, This imagery will provide data for multiple projects that will expand and further develop a better understanding of the Grand Bay NERR system.
Description of research conducted during the reporting period and milestones accomplished and/or completed
Due to processing errors in original 2009 flight data, imagery was flown again in May 2010, processed and delivered to Grand Bay NERR in July 2010. Grand Bay NERR reviewed and approved the data in summer 2010.
Description of significant research results, protocols developed, and research transitions
Hyperspectral data for Grand Bay NERR processed, delivered to Grand Bay NERR personnel and subsequently delivered in fall 2010 to NOAA National Coastal Data Development Center for archiving.
Information on collaborators / partners: a. Name of collaborating organization: Rost Parsons, NOAA NESDIS National Coastal Data
Development Center b. Date collaborating established: Jul 1, 2009 c. Does partner provide monetary support to project? Amount of support? Yes, $15K d. Does partner provide non-monetary (in-kind) support? Yes e. Short description of collaboration/partnership relationship. Funding sponsor and final
recipient of hyperspectral data for archival on NODC databases
Information on any outreach activities: None
92
NGI Progress Report NOAA Award #: NA06OAR4320264
Reporting Period: Jul 1, 2010 - Jun 30, 2011
NGI File # 09-NGI-MOD-29 Project Title: Development of a Northern Gulf of Mexico Operational Forecast System
Project Lead (PI) name, affiliation, email address: Joby Prince, Northern Gulf Institute, [email protected]
Co-PI name, affiliation, email address: Changsheng Chen, University of Massachusetts – Dartmouth, [email protected]
NOAA sponsor and NOAA office of primary technical contact: Frank Aikman, NOS Coast Survey Development Laboratory
NOAA Goals: Weather and Water Mission Goal, Commerce and Transportation Mission Goal
Project objectives and goals
The NOAA National Ocean Service’s Physical Oceanographic Real-Time Systems (PORTS) along the northern coast of the Gulf of Mexico will provide real-time oceanographic data to promote safe and efficient navigation. NGI, through MSU, will manage and coordinate this Operational Forecast System UMASS-Dartmouth project activity in the development of a model to support the PORTS. A global or basin-scale model will provide boundary conditions to a proposed northern Gulf of Mexico Shelf domain model. This will cover the continental shelf from the shoreline seaward to approximately the 200 m isobath and from the southern tip of Texas to between Pensacola and Choctawhatchee Bays, Florida. The nGOM Shelf model will provide boundary conditions to three nested OFSs for the Northeastern Gulf of Mexico, the Northwestern Gulf of Mexico, and the Lower Mississippi River. The Northeastern Gulf regional Operational Forecast System will include the three PORTS locations for Mobile Bay, Pascagoula, and Gulfport. The Northwestern Gulf regional Operational Forecast System will include the three PORTS locations for Lake Charles, Sabine Neches, and Houston/Galveston. The Lower Mississippi River regional Operational Forecast System will cover the New Orleans PORTS.
The major role of UMASSD team is to help the NOAA National Ocean Service to define the methodology for the development of the nGOM OFS; to describe the technical approach and timeline; and to provide technical assistance in using FVCOM.
Description of research conducted during the reporting period and milestones accomplished and/or completed
A major effort has been made to 1) make the updated version of FVCOM run at the NOAA IBM supercomputer and 2) develop an auto-nesting module to couple FVCOM with the global-scale HYCOM.
The updated new version of FVCOM includes many advanced data exchange functions that are used to facilitate the computational efficiency under multi-processor environments. All these functions are standard for all Fortran compilers except for the IBM system. The forecast operation at NOAA requires to run FVCOM on the IBM system. FVCOM was successfully compiled on the IBM computer but experienced the errors when it starts run. To solve this problem, the NOAA created a user account to us, and we have spent significant times on debugging the code line by line. With a team effort, we found out the problems and solved them by modifying the structures of those functions.
The NGI FVCOM was developed originally with no nesting to the global ocean models. This regional model system is suitable for the environments with major forcing of tides, local winds and river discharges, but missed the interaction with the Loop current. We have developed an auto nesting module to make FVCOM capable to nest with any structured grid model. The design was originally
93
NGI Progress Report NOAA Award #: NA06OAR4320264
Reporting Period: Jul 1, 2010 - Jun 30, 2011
made to nest FVCOM with global HYCOM (which is in the forecast operation by NOAA and Office of Naval Research) through a so-called “relaxation zone”. This module is capable of remaining all tidal and wind forcing at the boundary when the non-tidal component of HYCOM is added.
Description of significant research results, protocols developed, and research transitions
This project is aimed at providing the technical support to the NOAA National Ocean Service in developing NGI FVCOM forecast system. The research results are the model products. We have delivered to NOAA 1) an operational FVCOM code and 2) a Fortran multi-model nesting module.
Information on collaborators / partners: a. Name of collaborating organization: Dr. Song Hu, Shanghai Ocean University b. Date collaborating established: 2010 c. Does partner provide monetary support to project? Amount of support? Partial travel
support for Dr. Chen’s research associates to Shanghai d. Does partner provide non-monetary (in-kind) support? Yes, use of the supercomputer at
SHOU to test code e. Short description of collaboration/partnership relationship. We have collaborated with
Shanghai Ocean University (SHOU) in developing the multi-model nesting module. Dr. Song Hu, Associate Professor at SHOU visited our lab in January 2011 and worked together with Dr. Chen in the module development. Dr. Chen visited SHOU in June-July 2011 to finalize the test of the module together with Dr. Hu. Dr. Chen has established a joint modeling laboratory at SHOU. He has served as Director of that laboratory. Dr. Hu is Associate Professor at SHOU, who is in charge of routine operation of that lab. This joint laboratory was funded by SHOU President fund.
Information on any outreach activities: We have provided FVCOM as a community free software to the public. Up to present, FVCOM has more than thousand users from academic institutions/universities, government agencies, private companies and even US military.
i. Type (speaker, workshop, training): Workshop ii. Name of event: The 2010 AOMIP Workshop iii. Location: Woods Hole Oceanographic Institution iv. Approximate Number of Participants: 100
i. Type (speaker, workshop, training): Workshop ii. Name of event: The 2010 IMUM Conference iii. Location: Massachusetts Institute of Technology iv. Approximate Number of Participants: 60
94
NGI Progress Report NOAA Award #: NA06OAR4320264
Reporting Period: Jul 1, 2010 - Jun 30, 2011
NGI File # 09-NGI-01 Project Title: Developing a Tool for Assessing Cost Effective Best Management Practices for
Resilient Communities
Project Lead (PI) name, affiliation, email address: G. Wayne Wilkerson, Mississippi State University, [email protected]
Co-PIs names, affiliation, email address: Dr. Timothy Schauwecker, Mississippi State University, [email protected]; Dr. James Martin, Mississippi State University, [email protected]; Dr. William McAnally III, Mississippi State University, [email protected]; Warren Gallo, Mississippi State University, [email protected]
NOAA sponsor and NOAA office of primary technical contact: Julian Lartigue, NOAA Office of Oceanic and Atmospheric Research
NOAA Goals: Ecosystem Mission Goal, Weather and Water Mission Goal
Project objectives and goals
This research project attempted to accomplish the following objectives: 1. Complete the integration of a hydrologic model and a BMP spreadsheet. 2. Review and recommend a spatial/graphical analysis package for linkage. 3. Link the spreadsheet model and graphical package. 4. Test the model using a selected research site.
Description of research conducted during the reporting period and milestones accomplished and/or completed
Below are the milestones accomplished during the twelve month work period associated with this research effort.
Period Database Development Spatial Linkage 1st
B2. Select graphic model. Quarter A1.Work on remaining sheets. B1. Develop selection matrix.
B3. Collect required code. 2nd
A3. Ensure application compatibility B5. Test linkage. Quarter A2. Complete first draft of database. B4. Attempt first plug-in.
3rd
Quarter A4. Finalize database. B6. Finalize linkage
4th
A6. Summarize findings B8. Summarize findings Quarter A5. Make modifications B7. Make modifications
A7. Disseminate (on-going) B9. Disseminate (on-going)
95
NGI Progress Report NOAA Award #: NA06OAR4320264
Reporting Period: Jul 1, 2010 - Jun 30, 2011
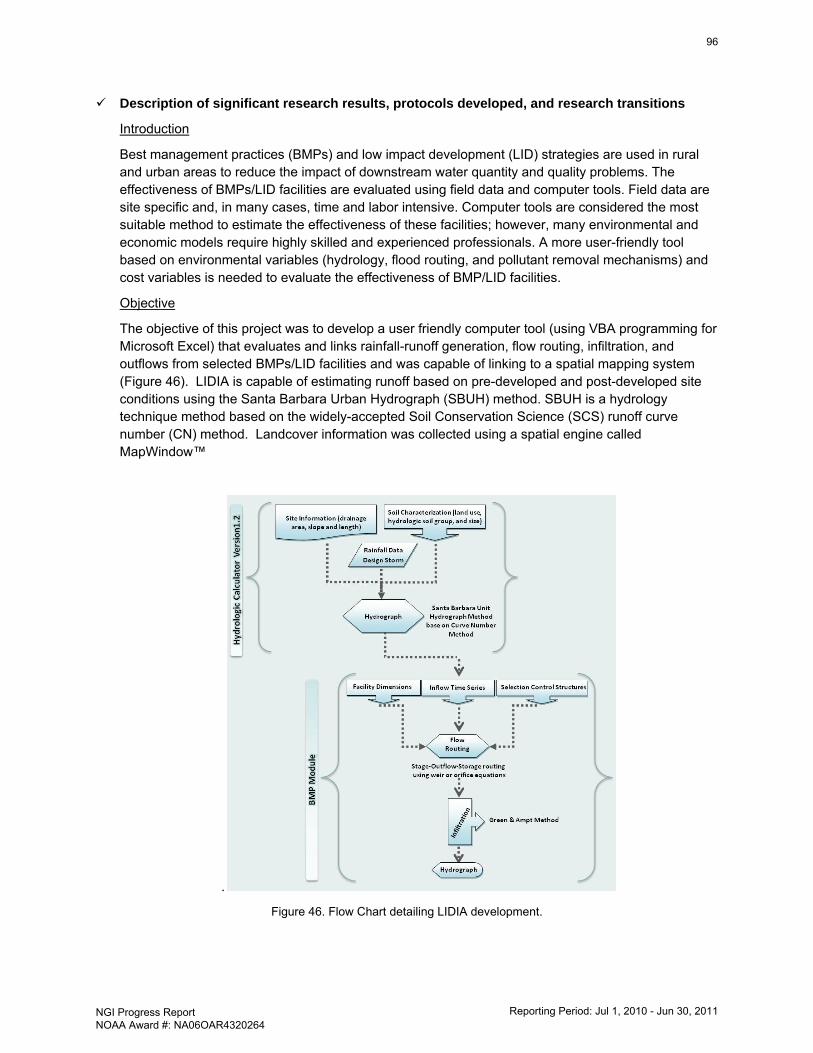
Description of significant research results, protocols developed, and research transitions
Introduction
Best management practices (BMPs) and low impact development (LID) strategies are used in rural and urban areas to reduce the impact of downstream water quantity and quality problems. The effectiveness of BMPs/LID facilities are evaluated using field data and computer tools. Field data are site specific and, in many cases, time and labor intensive. Computer tools are considered the most suitable method to estimate the effectiveness of these facilities; however, many environmental and economic models require highly skilled and experienced professionals. A more user-friendly tool based on environmental variables (hydrology, flood routing, and pollutant removal mechanisms) and cost variables is needed to evaluate the effectiveness of BMP/LID facilities.
Objective
The objective of this project was to develop a user friendly computer tool (using VBA programming for Microsoft Excel) that evaluates and links rainfall-runoff generation, flow routing, infiltration, and outflows from selected BMPs/LID facilities and was capable of linking to a spatial mapping system (Figure 46). LIDIA is capable of estimating runoff based on pre-developed and post-developed site conditions using the Santa Barbara Urban Hydrograph (SBUH) method. SBUH is a hydrology technique method based on the widely-accepted Soil Conservation Science (SCS) runoff curve number (CN) method. Landcover information was collected using a spatial engine called MapWindow™
.
Figure 46. Flow Chart detailing LIDIA development.
96
NGI Progress Report NOAA Award #: NA06OAR4320264
Reporting Period: Jul 1, 2010 - Jun 30, 2011
Background
The hydrologic components of LIDIA can be divided in two main parts: upland catchment and receiving BMP facility. The upland catchment module computes the runoff at different time steps and the receiving BMP facility component estimates the flow routing, water infiltration losses, and output hydrograph. The user of the LIDIA spreadsheet is able to select different design storms fixed to a 10-minute interval. The hydrologic calculations are done utilizing the Santa Barbara Urban Hydrograph (SBUH). This method is based on the Soil Conservation Service (SCS) method and it is based on the curve number (CN) approach. The SBUH method predicts a peak runoff rate and rainfall-runoff distribution based on the catchment characteristics including catchment area, CN of the ground surface, and time of concentration (Tc). SBUH compute the runoff hydrograph in two steps by computing the instant hydrograph and then computing the runoff hydrograph.
Flow Routing Model
To evaluate the effect of a BMP on peak attenuation, it is necessary to estimate the variation of flows in time and space. Reservoir routing is a method for routing a modeled storm hydrograph through a modeled reservoir in order to determine the peak flow attenuation and flow storage that occurs. The routing process uses mathematical expressions to calculate flow from a reservoir or a storage facility once inflow, initial conditions, facility characteristics and operational rules are known. To start the flow routing process in the BMP/LID facility, the user must provide the stage-storage relationship or the geometry of the new facility and the design of its respective outlet structures.
The runoff hydrograph is obtained from the post-developed sheet; stage-storage and discharge-stage relationships are generated by the model using the information provided by the user. The stage-storage relation is obtained by consecutive calculations of storage vs. associated stages in the storage facility. Basically, storage is the volume of water held by the facility as a function of the water surface elevation or depth. LIDIA, at the present, allows a trapezoidal channel shape. The volume of storage is calculated by using simple geometric formulas expressed as a function of depth.
The stage-outflow relationship is supported on the relationship of the reservoir stage (head) and the resulting outflow from the storage structure. The outflow from a facility is determined by devices that control it. A typical storage facility has two devices, (outlets or spillways) a principal outlet and a secondary (or emergency) outlet. Several hydraulic outlet structures like orifices and weirs are used in detention facilities. Three kinds of weirs are typically used: sharp-crested, broad-crested and v-notch.
Water Infiltration Modeling
Several approaches to estimate water infiltration rates have been developed from empirical based to more physic based equations. The Green & Ampt infiltration method was selected to compute BMP infiltration losses in the LIDIA model. The Green & Ampt method is one of the most realistic models of infiltration available today. Parameters like hydraulic conductivity, average suction head, and effective porosity are inputted into the sheet just by selecting the soil type through the pull down selection menu located in the right upper part of the BMP design sheet.
The infiltration calculation is done using the flow coming into the BMP facility. The method evaluates the incoming flow in each time step and compares it with the potential infiltration rate according to the channel type soil.
97
NGI Progress Report NOAA Award #: NA06OAR4320264
Reporting Period: Jul 1, 2010 - Jun 30, 2011
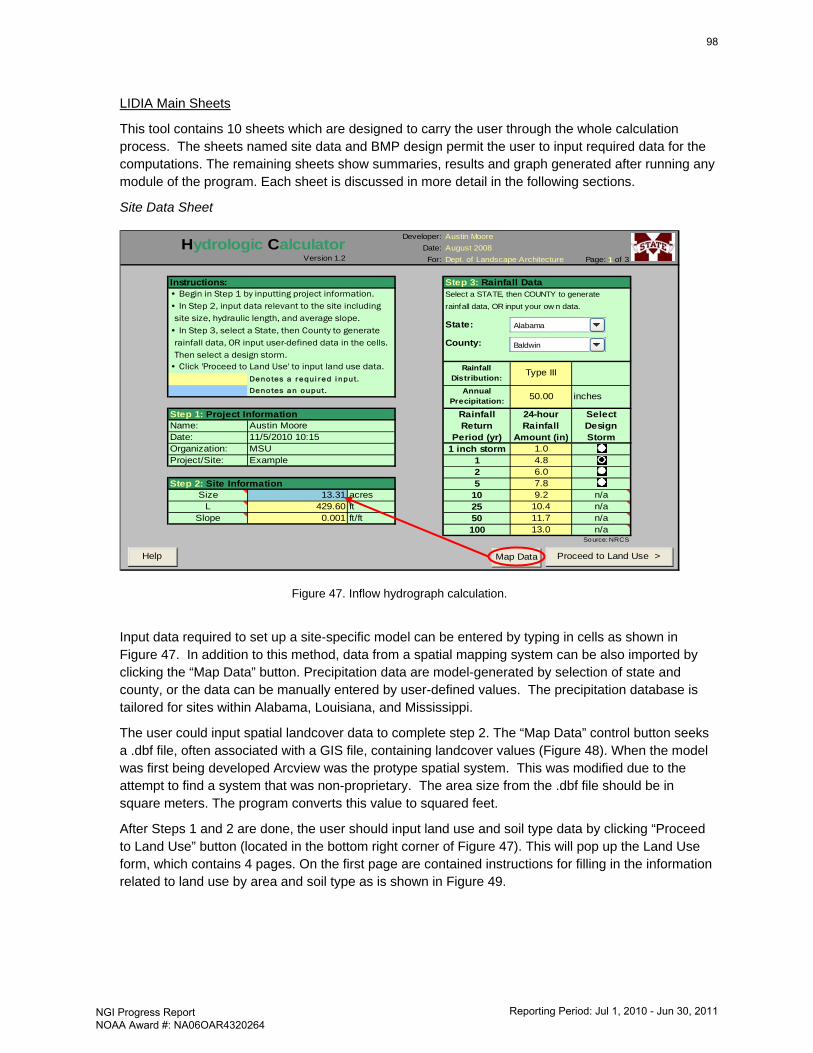
LIDIA Main Sheets
This tool contains 10 sheets which are designed to carry the user through the whole calculation process. The sheets named site data and BMP design permit the user to input required data for the computations. The remaining sheets show summaries, results and graph generated after running any module of the program. Each sheet is discussed in more detail in the following sections.
Site Data Sheet
Input data required to set up a site-specific model can be entered by typing in cells as shown in Figure 47. In addition to this method, data from a spatial mapping system can be also imported by clicking the “Map Data” button. Precipitation data are model-generated by selection of state and county, or the data can be manually entered by user-defined values. The precipitation database is tailored for sites within Alabama, Louisiana, and Mississippi.
The user could input spatial landcover data to complete step 2. The “Map Data” control button seeks a .dbf file, often associated with a GIS file, containing landcover values (Figure 48). When the model was first being developed Arcview was the protype spatial system. This was modified due to the attempt to find a system that was non-proprietary. The area size from the .dbf file should be in square meters. The program converts this value to squared feet.
After Steps 1 and 2 are done, the user should input land use and soil type data by clicking “Proceed to Land Use” button (located in the bottom right corner of Figure 47). This will pop up the Land Use form, which contains 4 pages. On the first page are contained instructions for filling in the information related to land use by area and soil type as is shown in Figure 49.
Figure 47. Inflow hydrograph calculation.
Developer: Austin Moore
Date: August 2008Version 1.2 For: Dept. of Landscape Architecture Page: 1 of 3
Step 3: Rainfall Data• Begin in Step 1 by inputting project information. Select a STATE, then COUNTY to generate
• In Step 2, input data relevant to the site including rainfall data, OR input your ow n data.
site size, hydraulic length, and average slope.• In Step 3, select a State, then County to generate rainfall data, OR input user-defined data in the cells. County: Then select a design storm.• Click 'Proceed to Land Use' to input land use data.
Denotes a requi red i nput.
Denotes an ouput.
Name:Date:Organization: 1 inch storm 1.0Project/Site: 1 4.8
2 6.0Step 2: Site Information 5 7.8
Size 13.31 acres 10 9.2 n/aL 429.60 ft 25 10.4 n/a
Slope 0.001 ft/ft 50 11.7 n/a100 13.0 n/a
Source: NRCS
Example
Step 1: Project Information Rainfall Return
Period (yr)
inches
24-hour Rainfall
Amount (in)
Select Design Storm
Austin Moore11/5/2010 10:15MSU
Annual Precipitation:
50.00
Hydrologic Calculator
Instructions:
State:
Rainfall Distribution:
Type III
Proceed to Land Use >
Alabama
Help
Select a CountyPerryAssumption
Map Data
Baldwin
98
NGI Progress Report NOAA Award #: NA06OAR4320264
Reporting Period: Jul 1, 2010 - Jun 30, 2011
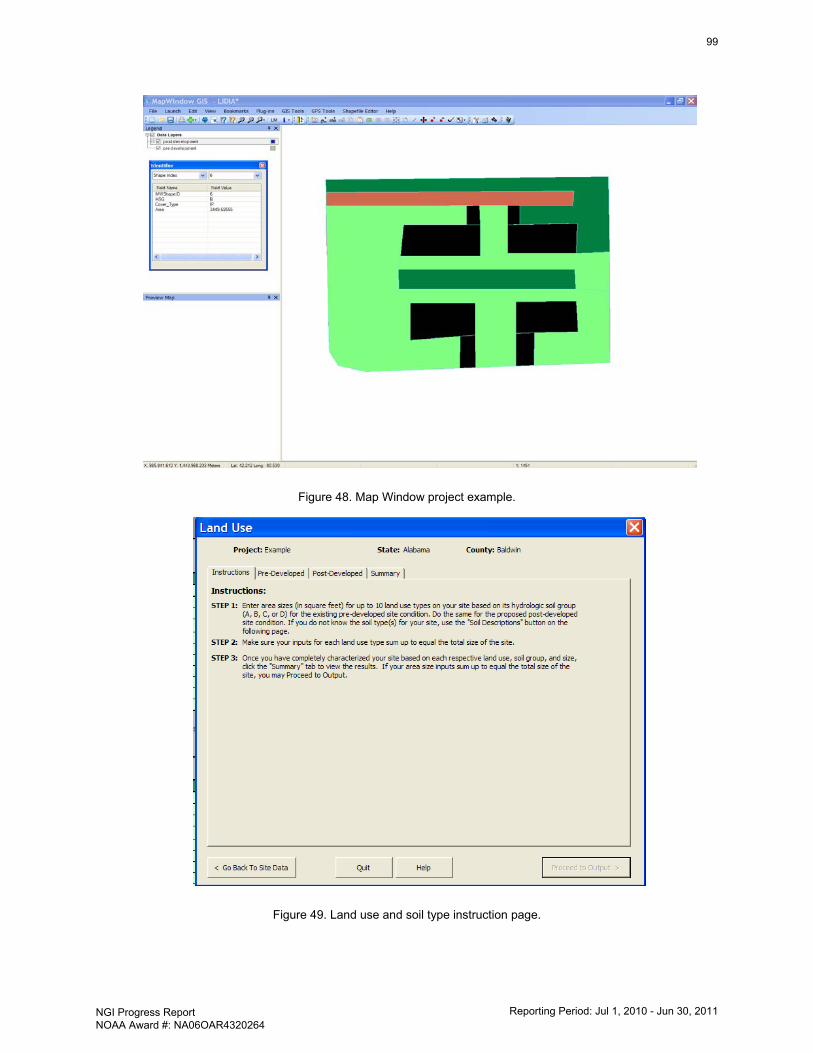
Figure 48. Map Window project example.
Figure 49. Land use and soil type instruction page.
99
NGI Progress Report NOAA Award #: NA06OAR4320264
Reporting Period: Jul 1, 2010 - Jun 30, 2011
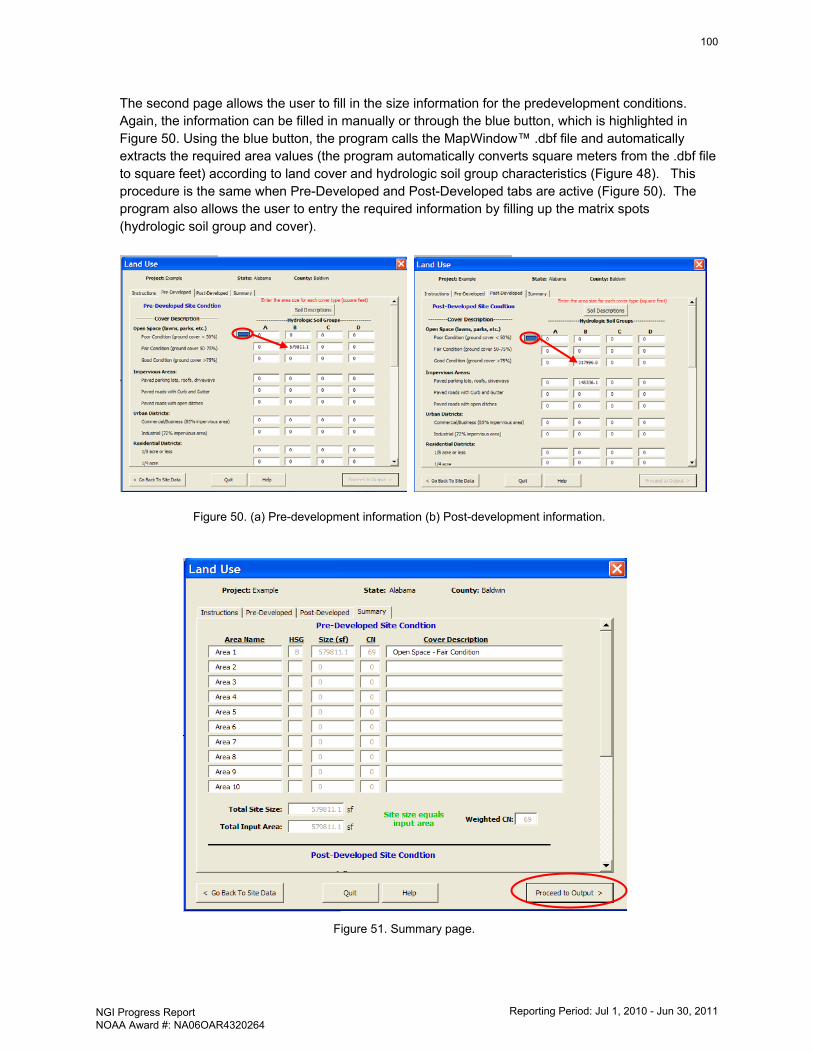
The second page allows the user to fill in the size information for the predevelopment conditions. Again, the information can be filled in manually or through the blue button, which is highlighted in Figure 50. Using the blue button, the program calls the MapWindow™ .dbf file and automatically extracts the required area values (the program automatically converts square meters from the .dbf file to square feet) according to land cover and hydrologic soil group characteristics (Figure 48). This procedure is the same when Pre-Developed and Post-Developed tabs are active (Figure 50). The program also allows the user to entry the required information by filling up the matrix spots (hydrologic soil group and cover).
Figure 50. (a) Pre-development information (b) Post-development information.
Figure 51. Summary page.
100
NGI Progress Report NOAA Award #: NA06OAR4320264
Reporting Period: Jul 1, 2010 - Jun 30, 2011
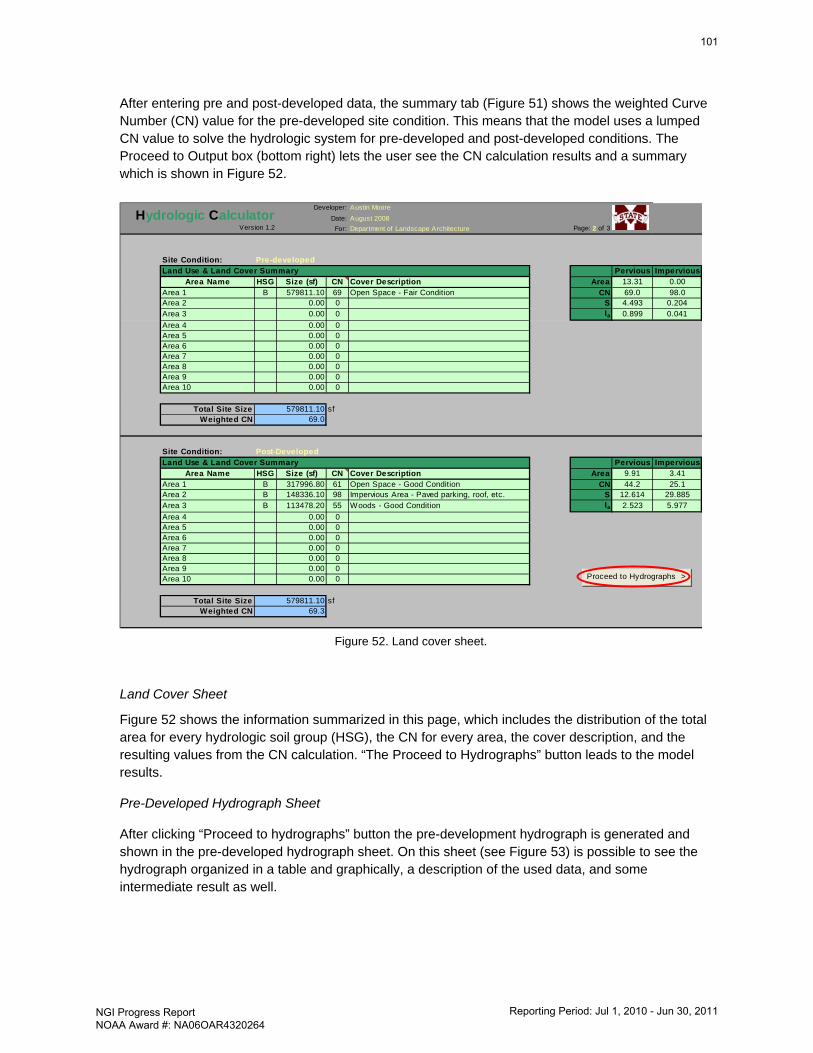
After entering pre and post-developed data, the summary tab (Figure 51) shows the weighted Curve Number (CN) value for the pre-developed site condition. This means that the model uses a lumped CN value to solve the hydrologic system for pre-developed and post-developed conditions. The Proceed to Output box (bottom right) lets the user see the CN calculation results and a summary which is shown in Figure 52.
Land Cover Sheet
Figure 52 shows the information summarized in this page, which includes the distribution of the total area for every hydrologic soil group (HSG), the CN for every area, the cover description, and the resulting values from the CN calculation. “The Proceed to Hydrographs” button leads to the model results.
Pre-Developed Hydrograph Sheet
After clicking “Proceed to hydrographs” button the pre-development hydrograph is generated and shown in the pre-developed hydrograph sheet. On this sheet (see Figure 53) is possible to see the hydrograph organized in a table and graphically, a description of the used data, and some intermediate result as well.
Developer: Austin Moore
Date: August 2008Version 1.2 For: Department of Landscape Architecture Page: 2 of 3
Site Condition: Pre-developedLand Use & Land Cover Summary Pervious Impervious
Area Name HSG Size (sf) CN Cover Description Area 13.31 0.00Area 1 B 579811.10 69 Open Space - Fair Condition CN 69.0 98.0Area 2 0.00 0 S 4.493 0.204Area 3 0.00 0 Ia 0.899 0.041
Area 4 0.00 0Area 5 0.00 0Area 6 0.00 0Area 7 0.00 0Area 8 0.00 0Area 9 0.00 0Area 10 0.00 0
Total Site Size sfWeighted CN
Site Condition: Post-DevelopedLand Use & Land Cover Summary Pervious Impervious
Area Name HSG Size (sf) CN Cover Description Area 9.91 3.41Area 1 B 317996.80 61 Open Space - Good Condition CN 44.2 25.1Area 2 B 148336.10 98 Impervious Area - Paved parking, roof, etc. S 12.614 29.885Area 3 B 113478.20 55 Woods - Good Condition Ia 2.523 5.977
Area 4 0.00 0Area 5 0.00 0Area 6 0.00 0Area 7 0.00 0Area 8 0.00 0Area 9 0.00 0Area 10 0.00 0
Total Site Size sfWeighted CN 69.3
Hydrologic Calculator
579811.1069.0
579811.10
Proceed to Hydrographs >
Figure 52. Land cover sheet.
101
NGI Progress Report NOAA Award #: NA06OAR4320264
Reporting Period: Jul 1, 2010 - Jun 30, 2011
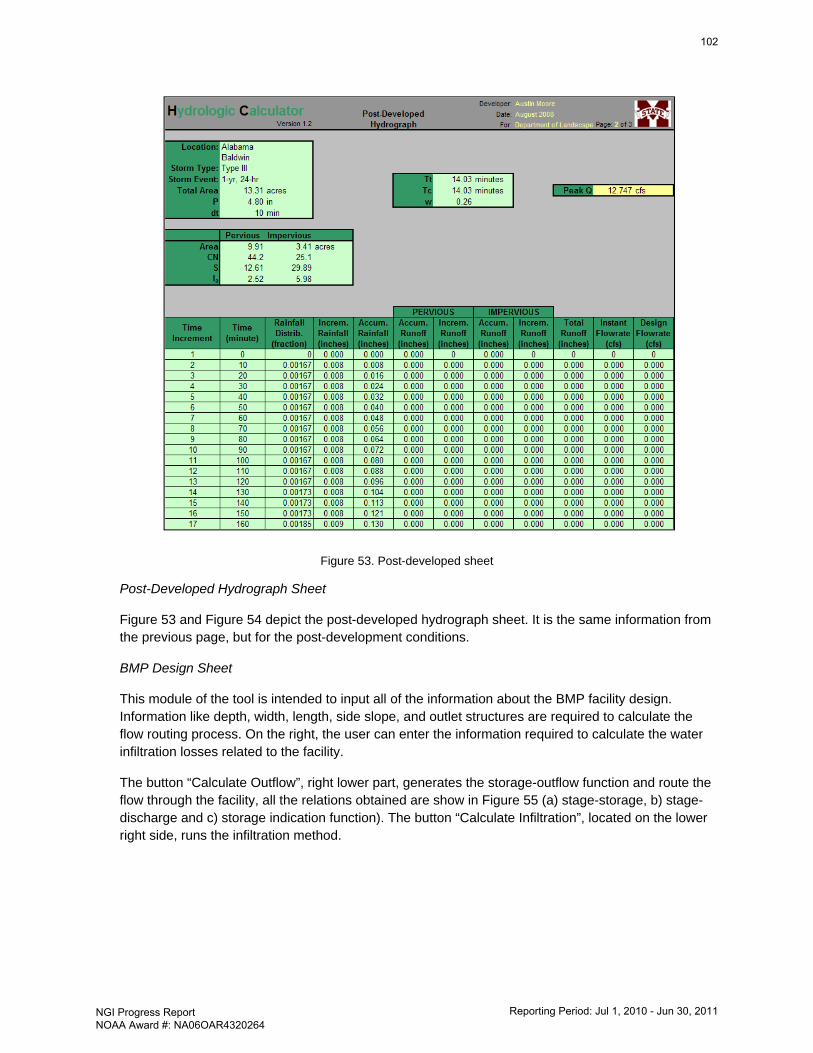
Figure 53. Post-developed sheet
Post-Developed Hydrograph Sheet
Figure 53 and Figure 54 depict the post-developed hydrograph sheet. It is the same information from the previous page, but for the post-development conditions.
BMP Design Sheet
This module of the tool is intended to input all of the information about the BMP facility design. Information like depth, width, length, side slope, and outlet structures are required to calculate the flow routing process. On the right, the user can enter the information required to calculate the water infiltration losses related to the facility.
The button “Calculate Outflow”, right lower part, generates the storage-outflow function and route the flow through the facility, all the relations obtained are show in Figure 55 (a) stage-storage, b) stage-discharge and c) storage indication function). The button “Calculate Infiltration”, located on the lower right side, runs the infiltration method.
102
NGI Progress Report NOAA Award #: NA06OAR4320264
Reporting Period: Jul 1, 2010 - Jun 30, 2011
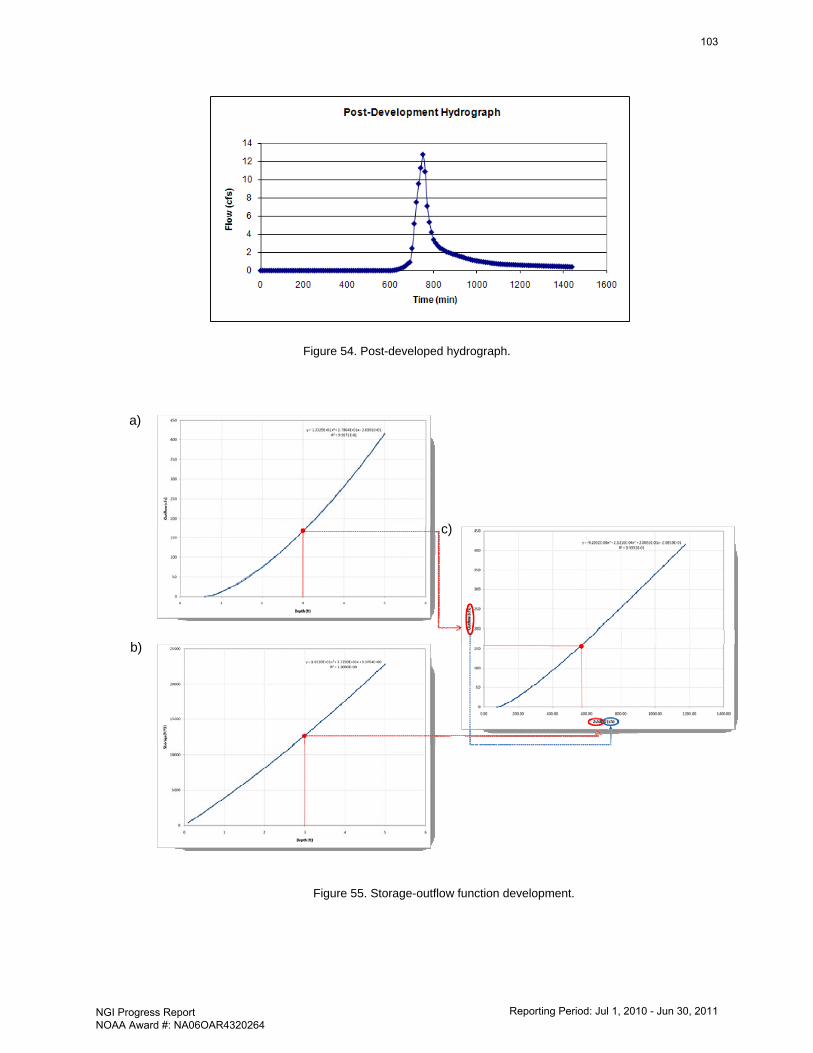
Figure 54. Post-developed hydrograph.
a)
c)
b)
Figure 55. Storage-outflow function development.
103
NGI Progress Report NOAA Award #: NA06OAR4320264
Reporting Period: Jul 1, 2010 - Jun 30, 2011
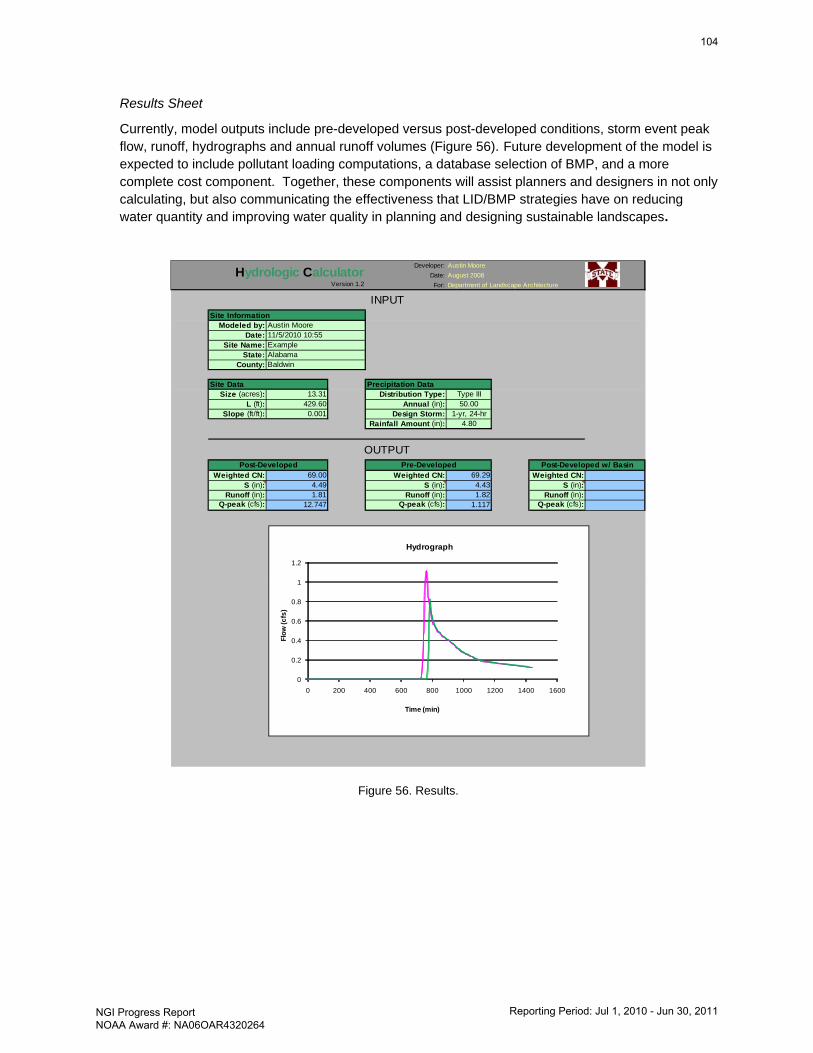
Results Sheet
Currently, model outputs include pre-developed versus post-developed conditions, storm event peak flow, runoff, hydrographs and annual runoff volumes (Figure 56). Future development of the model is expected to include pollutant loading computations, a database selection of BMP, and a more complete cost component. Together, these components will assist planners and designers in not only calculating, but also communicating the effectiveness that LID/BMP strategies have on reducing water quantity and improving water quality in planning and designing sustainable landscapes.
Developer: Austin Moore
Date: August 2008Version 1.2 For: Department of Landscape Architecture
Modeled by:Date:
Site Name:State:
County:
Site Data Precipitation DataSize (acres): 13.31 Distribution Type: Type III
L (ft): 429.60 Annual (in): 50.00Slope (ft/ft): 0.001 Design Storm: 1-yr, 24-hr
Rainfall Amount (in): 4.80
Weighted CN: 69.00 Weighted CN: 69.29 Weighted CN:S (in): 4.49 S (in): 4.43 S (in):
Runoff (in): 1.81 Runoff (in): 1.82 Runoff (in):Q-peak (cfs): 12.747 Q-peak (cfs): 1.117 Q-peak (cfs):
AlabamaBaldwin
Post-Developed Pre-Developed Post-Developed w/ Basin
OUTPUT
Example
Hydrologic Calculator
INPUTSite Information
Austin Moore11/5/2010 10:55
0
0.2
0.4
0.6
0.8
1
1.2
0 200 400 600 800 1000 1200 1400 1600
Flo
w (c
fs)
Time (min)
Hydrograph
Figure 56. Results.
104
NGI Progress Report NOAA Award #: NA06OAR4320264
Reporting Period: Jul 1, 2010 - Jun 30, 2011
Conclusions
This report summarizes the efforts and techniques put forth to integrate spatial mapping capabilities, flow routing calculations, and water infiltration losses predictions into the LIDIA program. In its current phase, this hydrology and BMP model is capable of:
• Entering site size, land cover and soil type descriptions either manually or through spatial mapping,
• estimating runoff based on pre- and post-developed site conditions using the widely-accepted Soil Conservation Science (SCS) runoff curve number (CN) method,
• setting up open channel/pond facilities
• calculating flow routing throughout a channel and/or pond facility,
• estimating channel/pond infiltration losses using the Green-Ampt method,
• generating tables and figures of selected model results at the inlet and outlet of the BMP facility
Future Work
Further work includes algorithm verification, field evaluation, removal effectiveness, and computing cost components associated with BMP/LID installation and maintenance. Linkage to a spatial mapping system should also be reviewed. Data can be collected from MapWindow™, but this effort was unable to add a menu button directly to the mapping application. Spatial results were collected from MapWindow™ and exported in the form of a Dbase database file. This information was then imported into LIDIA. This method is quite functional, but adoption of the program by the general public might be easier with a simplified interface.
Information on collaborators / partners: None
Information on any outreach activities: Discussions have been held with Jackson County, MS staff concerning installation of a BMP demonstration site where the model can be tested.
105
NGI Progress Report NOAA Award #: NA06OAR4320264
Reporting Period: Jul 1, 2010 - Jun 30, 2011
NGI File # 09-NGI-02 Project Title: From Physics to Fish: Modeling the Effects of Pulsed River Diversion on Fish
Distribution
Project Lead (PI) name, affiliation, email address: Dubravko Justic, Louisiana State University, [email protected]
Co-PIs names, affiliation, email address: Kenneth Rose, Louisiana State University, [email protected]; Chunyan Li, Louisiana State University, [email protected]; Haosheng Huang, Louisiana State University, [email protected]
NOAA sponsor and NOAA office of primary technical contact: Julian Lartigue, NOAA Office of Oceanic and Atmospheric Research
NOAA Goal: Ecosystem Mission Goal
Project objectives and goals
Pulsed freshwater diversions on the Lower Mississippi River are increasingly being used to combat coastal land loss. An issue that arises with diversions is their effects on aquatic biota in the area. How do pulsed releases of freshwater affect the spatial distribution and health of ecologically and economically important fish and invertebrate species downstream? This is a critical question to address if these diversions are to be used for wide-scale coastal restoration. Our project combines hydrodynamics (physics), water quality, and individual-based fish models into a single integrated “physics to fish” model, and examine how changes in salinity, temperature, and water quality resulting from diversions affect several key fish species. We are formulating a “physics to fish” model based on the Caernarvon River Diversion (CRD) and Breton Sound Estuary. The CRD provides a good test case – it has been operating since 1992 and has been the subject of several large-scale studies (i.e., PULSES, NUMAN, and most recently NGI) designed to monitor how pulsed releases affect water quality and key aquatic biota. There are also existing datasets and models for this system that have been developed from previous projects that will make it easier to develop our models. With prior support of NGI, we have implemented the Finite Volume Coastal Ocean Model (FVCOM) to the coastal northern Gulf of Mexico. As a part of this effort, we have extended the model grid to the upper Breton Sound all the way to the CRD. FVCOM is being coupled with a simple nutrient-phytoplankton-zooplankton (N-P-Z) model of the Breton Sound that was previously developed within the PULSES project. Finally, the individual-based fish model is being developed to simulate the movements of thousands of individuals in the same 3-dimensional spatial grid as used by the hydrodynamics model. Each individual’s position in the grid is tracked in continuous space on an hourly time step, and each fish will experience the water velocity, salinity, temperature, and water quality in the cell within which it is located. Our individual approach is similar to the classical particle tracking approach, except that our particles can exhibit complicated movement behavior. The effects of pulsed releases will be simulated for individuals that represent freshwater versus euryhaline species types (e.g., largemouth bass versus spotted seatrout) and highly versus less mobile species types (e.g., fish versus shrimp). We will examine both the short-term (days) and longer-term (weeks to months) influences of different diversion release scenarios on fish distributions and environmental conditions experienced by exposed fish. Our project will provide a quantitative tool to be added to the toolbox for assessing the effect and utility of river diversions for coastal restoration. Our model addresses the issue of diversions causing significant shifts in the spatial distributions of key fish species, and whether the rapidity of changes in environmental conditions can cause stress in individual animals. These research endpoints are highly relevant to the Gulf of Mexico ecosystem research and the missions of NOAA, NGI, GOMA and Sea Grant.
106
NGI Progress Report NOAA Award #: NA06OAR4320264
Reporting Period: Jul 1, 2010 - Jun 30, 2011
Description of research conducted during the reporting period and milestones accomplished and/or completed
We have implemented a high-resolution three-dimensional unstructured-grid Finite Volume Coastal Ocean Model (FVCOM) for the Breton Sound Estuary, including the Caernarvon Freshwater Diversion site and part of the Louisiana continental shelf. The model horizontal grid consists of 77,628 nodes and 145,713 triangular elements, with a variable spatial resolution of 1-10 km over the shelf regions and 20–500 m in the Breton Sound Estuary. The model includes 19 vertical sigma layers. The model grid in the estuary extends to the surrounding wetland areas to allow for wetting and drying of estuarine marshes. Model prognostic variables included sea surface elevation, three-dimensional velocity, salinity and turbulent variables. Currently, FVCOM is being coupled to a simple nutrient-phytoplankton-zooplankton (N-P-Z) model and an individual-based fish model in which particles exhibit complicated “smart particle” movement behavior. The codes for simulating behavioral movement using kinesis, fitness, and game theory algorithms have been largely completed and are currently being tested on an idealized test grid with steady state salinity distribution and zero physical transport.
Description of significant research results, protocols developed, and research transitions
Several numerical simulation experiments have been conducted for the period from April 1 to July 1, 2010, during which the Caernarvon Diversion discharge rate was set to its maximum values, to the long-term averaged value, and to zero (diversion completely turned off). For the maximum diversion scenario, the predicted sea surface elevations showed good correspondence with observations on all available coastal sea level monitoring stations (correlation coefficients and Index of Agreement > 0.90 for all stations). The predicted horizontal ocean currents also compared favorably with available ADCP data. However, the salinity comparison showed relatively large error which was probably due to inaccuracies in the HYCOM –derived initial salinity distribution. We have also examined if pulsed freshwater diversions can be used to prevent oil slicks from entering into Louisiana coastal bays and estuaries. Oil slick simulations indicated that large diversion discharge flushed out most of the particles initially located at the entrance of the estuary out of the estuary, and moved them along the coastline to the Mississippi Sound. In contrast, turning off the diversion discharge allowed most particles to travel upstream into the estuary. This difference between the two scenarios can be explained by the relatively large contribution to the residual currents from the maximum diversion freshwater release.
Information on collaborators / partners:
LSU scientists are collaborating with Dr. Lawrence Rozas, NOAA Fisheries Service, who participates in this project as unfunded collaborator. Over the past decade or more, Dr. Rozas has been investigating how aquatic fauna community structure responds to river pulsing and other perturbations in a variety of locations in coastal Louisiana, including Breton Sound. Our group is also collaborating informally with Dr. Shaye Sable of the Louisiana Department of Wildlife and Fisheries, and with Dr. Brian Piazza, the Atchafalaya Program Manager at The Nature Conservancy. Dr. Sable is involved with developing and using other modeling approaches than the particle tracking proposed here for examining how river pulsing affects fish community composition on marshes, and Dr. Piazza is involved with collecting and analyzing field data on diversion affects on aquatic fauna composition and spatial distributions in the upper portion of Breton Sound.
Information on any outreach activities: The project advances the educational mission of Louisiana State University by enhancing its land-grant and sea-grant institution status. The Louisiana Sea Grant Program annually sponsors “Ocean
107
NGI Progress Report NOAA Award #: NA06OAR4320264
Reporting Period: Jul 1, 2010 - Jun 30, 2011
Commotion”, which brings more than 3,400 area students and teachers to LSU to learn about our coast and sea (http://www.lsu.edu/university_relations/oceancommotion/). Project results from LSU NGI contribute to this program by demonstrating how high-end computing and information from different disciplines is combined for use in ecosystem management. Participants in our project contribute to community outreach by participating in stakeholder meetings, such as the Caernarvon Interagency Advisory Committee (CIAC), whose members represent all major stakeholders of the region. CIAC members include fishery representatives (oyster, shrimp, and recreational fishers), representatives of local governments, local landowners who care about the environment, and natural resource agencies (LA Depts. of Wildlife and Fisheries, Natural Resources (DNR), Environmental Quality, and Health and Human Resources; and US Fish and Wildlife Service, National Marine Fisheries Service, EPA, and Army Corps of Engineers).
108
NGI Progress Report NOAA Award #: NA06OAR4320264
Reporting Period: Jul 1, 2010 - Jun 30, 2011
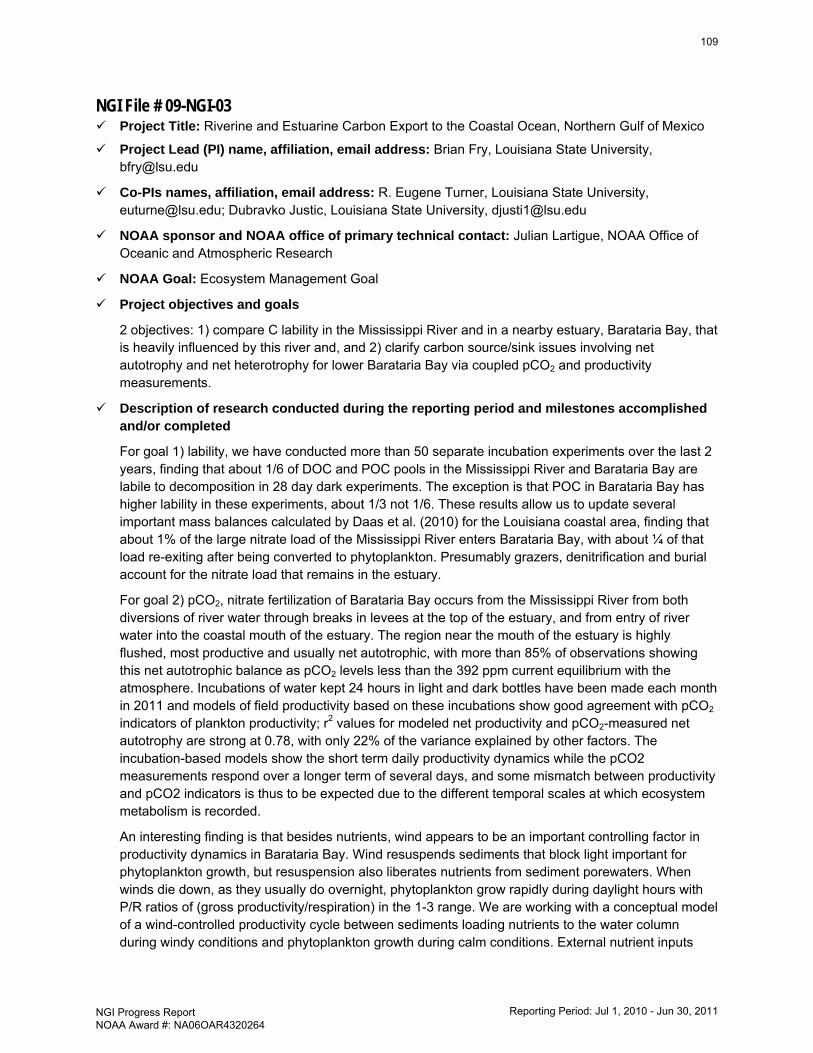
NGI File # 09-NGI-03 Project Title: Riverine and Estuarine Carbon Export to the Coastal Ocean, Northern Gulf of Mexico
Project Lead (PI) name, affiliation, email address: Brian Fry, Louisiana State University, [email protected]
Co-PIs names, affiliation, email address: R. Eugene Turner, Louisiana State University, [email protected]; Dubravko Justic, Louisiana State University, [email protected]
NOAA sponsor and NOAA office of primary technical contact: Julian Lartigue, NOAA Office of Oceanic and Atmospheric Research
NOAA Goal: Ecosystem Management Goal
Project objectives and goals
2 objectives: 1) compare C lability in the Mississippi River and in a nearby estuary, Barataria Bay, that is heavily influenced by this river and, and 2) clarify carbon source/sink issues involving net autotrophy and net heterotrophy for lower Barataria Bay via coupled pCO2 and productivity measurements.
Description of research conducted during the reporting period and milestones accomplished and/or completed
For goal 1) lability, we have conducted more than 50 separate incubation experiments over the last 2 years, finding that about 1/6 of DOC and POC pools in the Mississippi River and Barataria Bay are labile to decomposition in 28 day dark experiments. The exception is that POC in Barataria Bay has higher lability in these experiments, about 1/3 not 1/6. These results allow us to update several important mass balances calculated by Daas et al. (2010) for the Louisiana coastal area, finding that about 1% of the large nitrate load of the Mississippi River enters Barataria Bay, with about ¼ of that load re-exiting after being converted to phytoplankton. Presumably grazers, denitrification and burial account for the nitrate load that remains in the estuary.
For goal 2) pCO2, nitrate fertilization of Barataria Bay occurs from the Mississippi River from both diversions of river water through breaks in levees at the top of the estuary, and from entry of river water into the coastal mouth of the estuary. The region near the mouth of the estuary is highly flushed, most productive and usually net autotrophic, with more than 85% of observations showing this net autotrophic balance as pCO2 levels less than the 392 ppm current equilibrium with the atmosphere. Incubations of water kept 24 hours in light and dark bottles have been made each month in 2011 and models of field productivity based on these incubations show good agreement with pCO2 indicators of plankton productivity; r2 values for modeled net productivity and pCO2-measured net autotrophy are strong at 0.78, with only 22% of the variance explained by other factors. The incubation-based models show the short term daily productivity dynamics while the pCO2 measurements respond over a longer term of several days, and some mismatch between productivity and pCO2 indicators is thus to be expected due to the different temporal scales at which ecosystem metabolism is recorded.
An interesting finding is that besides nutrients, wind appears to be an important controlling factor in productivity dynamics in Barataria Bay. Wind resuspends sediments that block light important for phytoplankton growth, but resuspension also liberates nutrients from sediment porewaters. When winds die down, as they usually do overnight, phytoplankton grow rapidly during daylight hours with P/R ratios of (gross productivity/respiration) in the 1-3 range. We are working with a conceptual model of a wind-controlled productivity cycle between sediments loading nutrients to the water column during windy conditions and phytoplankton growth during calm conditions. External nutrient inputs
109
NGI Progress Report NOAA Award #: NA06OAR4320264
Reporting Period: Jul 1, 2010 - Jun 30, 2011
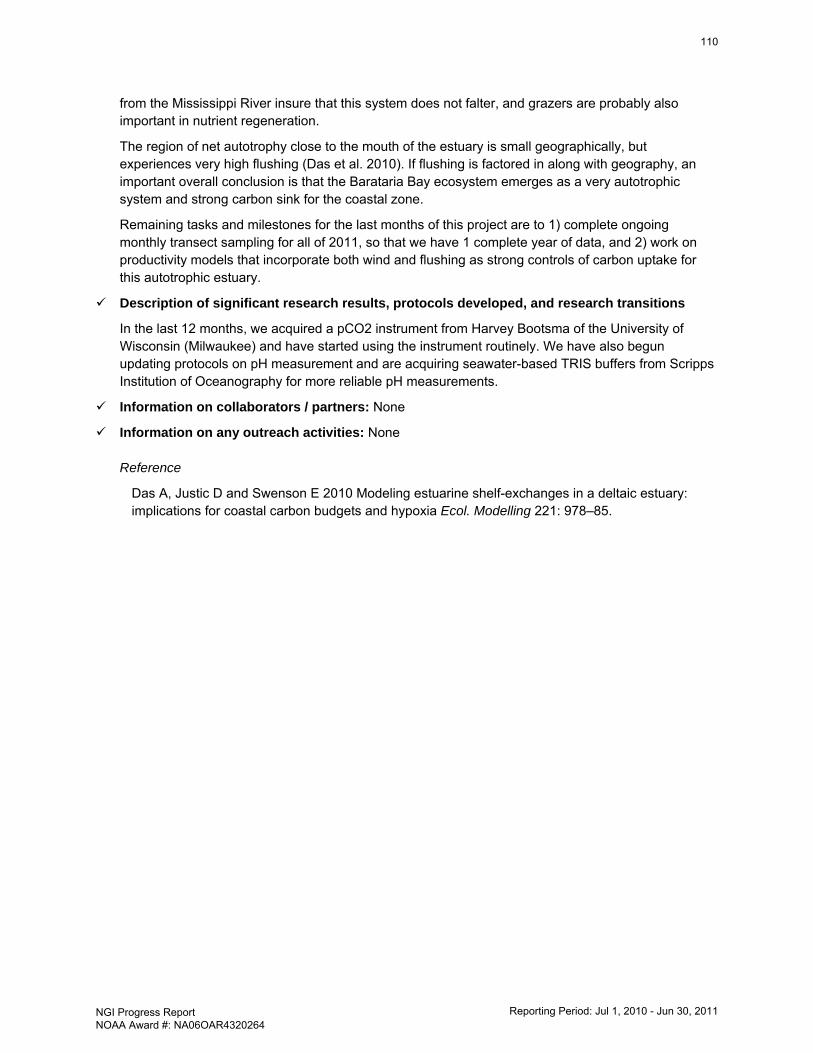
from the Mississippi River insure that this system does not falter, and grazers are probably also important in nutrient regeneration.
The region of net autotrophy close to the mouth of the estuary is small geographically, but experiences very high flushing (Das et al. 2010). If flushing is factored in along with geography, an important overall conclusion is that the Barataria Bay ecosystem emerges as a very autotrophic system and strong carbon sink for the coastal zone.
Remaining tasks and milestones for the last months of this project are to 1) complete ongoing monthly transect sampling for all of 2011, so that we have 1 complete year of data, and 2) work on productivity models that incorporate both wind and flushing as strong controls of carbon uptake for this autotrophic estuary.
Description of significant research results, protocols developed, and research transitions
In the last 12 months, we acquired a pCO2 instrument from Harvey Bootsma of the University of Wisconsin (Milwaukee) and have started using the instrument routinely. We have also begun updating protocols on pH measurement and are acquiring seawater-based TRIS buffers from Scripps Institution of Oceanography for more reliable pH measurements.
Information on collaborators / partners: None
Information on any outreach activities: None
Reference
Das A, Justic D and Swenson E 2010 Modeling estuarine shelf-exchanges in a deltaic estuary: implications for coastal carbon budgets and hypoxia Ecol. Modelling 221: 978–85.
110
NGI Progress Report NOAA Award #: NA06OAR4320264
Reporting Period: Jul 1, 2010 - Jun 30, 2011
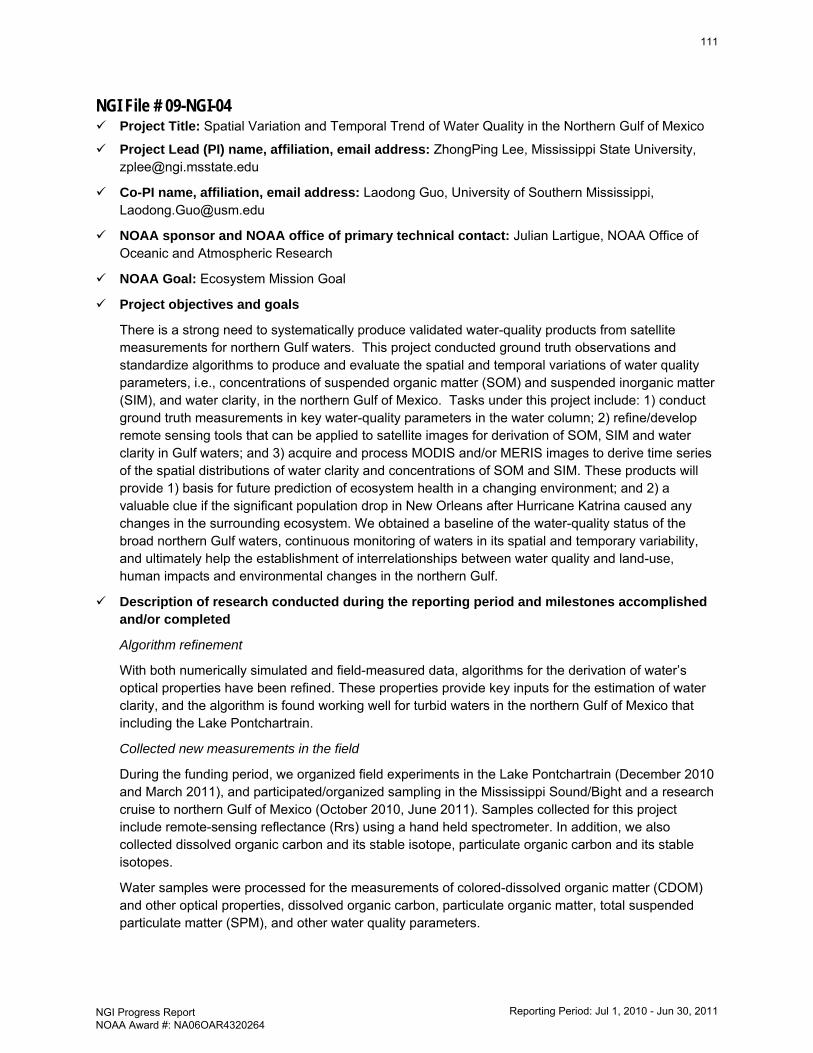
NGI File # 09-NGI-04 Project Title: Spatial Variation and Temporal Trend of Water Quality in the Northern Gulf of Mexico
Project Lead (PI) name, affiliation, email address: ZhongPing Lee, Mississippi State University, [email protected]
Co-PI name, affiliation, email address: Laodong Guo, University of Southern Mississippi, [email protected]
NOAA sponsor and NOAA office of primary technical contact: Julian Lartigue, NOAA Office of Oceanic and Atmospheric Research
NOAA Goal: Ecosystem Mission Goal
Project objectives and goals
There is a strong need to systematically produce validated water-quality products from satellite measurements for northern Gulf waters. This project conducted ground truth observations and standardize algorithms to produce and evaluate the spatial and temporal variations of water quality parameters, i.e., concentrations of suspended organic matter (SOM) and suspended inorganic matter (SIM), and water clarity, in the northern Gulf of Mexico. Tasks under this project include: 1) conduct ground truth measurements in key water-quality parameters in the water column; 2) refine/develop remote sensing tools that can be applied to satellite images for derivation of SOM, SIM and water clarity in Gulf waters; and 3) acquire and process MODIS and/or MERIS images to derive time series of the spatial distributions of water clarity and concentrations of SOM and SIM. These products will provide 1) basis for future prediction of ecosystem health in a changing environment; and 2) a valuable clue if the significant population drop in New Orleans after Hurricane Katrina caused any changes in the surrounding ecosystem. We obtained a baseline of the water-quality status of the broad northern Gulf waters, continuous monitoring of waters in its spatial and temporary variability, and ultimately help the establishment of interrelationships between water quality and land-use, human impacts and environmental changes in the northern Gulf.
Description of research conducted during the reporting period and milestones accomplished and/or completed
Algorithm refinement
With both numerically simulated and field-measured data, algorithms for the derivation of water’s optical properties have been refined. These properties provide key inputs for the estimation of water clarity, and the algorithm is found working well for turbid waters in the northern Gulf of Mexico that including the Lake Pontchartrain.
Collected new measurements in the field
During the funding period, we organized field experiments in the Lake Pontchartrain (December 2010 and March 2011), and participated/organized sampling in the Mississippi Sound/Bight and a research cruise to northern Gulf of Mexico (October 2010, June 2011). Samples collected for this project include remote-sensing reflectance (Rrs) using a hand held spectrometer. In addition, we also collected dissolved organic carbon and its stable isotope, particulate organic carbon and its stable isotopes.
Water samples were processed for the measurements of colored-dissolved organic matter (CDOM) and other optical properties, dissolved organic carbon, particulate organic matter, total suspended particulate matter (SPM), and other water quality parameters.
111
NGI Progress Report NOAA Award #: NA06OAR4320264
Reporting Period: Jul 1, 2010 - Jun 30, 2011
In addition, an optical-sensor equipped Argofloat was deployed (April 8 – May 8, 2011) in the northern Gulf of Mexico, with physical and optical properties in the surface layer collected following the currents. Also, optical sensors were installed/integrated with NDBC Buoy (#42040) on June 17, 2011. More data will be available for the evaluation of the temporal change of these waters.
Processed MODIS and MERIS satellite images to derive water-quality properties
Water clarity product of the Northern Gulf of Mexico is now derived from MODIS and MERIS measurements with pre-developed standard algorithm. Evaluation of spatial and temporal variations is under way.
Description of significant research results, protocols developed, and research transitions
The phytoplankton abundance in the Northern Gulf of Mexico is found well correlated with the input of total phosphorus (Figure 57, top panel); while the relative amount of suspended inorganic particulates in NGOM waters is found correlated with the input of dissolved SiO2 (Figure 57, bottom panel). As both phosphorus and SiO2 are routinely measured (and provided) by USGS and EPA over various fixed stations around New Orleans, these results provide a path way to predict the phytoplankton and particle characteristics in NGOM waters.
Figure 57. Relationship between observed phytoplankton (measured by phytoplankton absorption coefficient) and phosphorus (top panel) and between relative amount of inorganic particles and SiO2 for waters in the Northern Gulf of Mexico. Optical properties (aph(443) and bb_ratio) were derived from MODIS, while data of TP and SiO2 were obtained from EPA (web).
Information on collaborators / partners: a. Name of collaborating organization: Naval Research Laboratory b. Date collaborating established: Jul 1, 2008 c. Does partner provide monetary support to project? Amount of support? No d. Does partner provide non-monetary (in-kind) support? Yes e. Short description of collaboration/partnership relationship. Help on data acquisition and
processing
Information on any outreach activities: None
b b_ra
tio
Year
2003 2004 2005 2006 2007 2008 2009 2010 0
4
8
12
SiO
2 (M
etric
Ton
s)0
3e+5
6e+5
9e+5bb_ratio
SiO2
a ph(4
43) (
m-1
)
Year
2003 2004 2005 2006 2007 2008 2009 2010 0.1
0.2
0.3
TP (M
etric
Ton
s)
0
20x103
40x103
aph(443)TP
112
NGI Progress Report NOAA Award #: NA06OAR4320264
Reporting Period: Jul 1, 2010 - Jun 30, 2011
NGI File # 09-NGI-05 Project Title: Sediment and Mercury Pathway and Fate Modeling
Project Lead (PI) name, affiliation, email address: William H. McAnally, Northern Gulf Institute, Mississippi State University, [email protected]
Co-PIs names, affiliation, email address: James L. Martin, Department of Civil & Environmental Engineering, Mississippi State University, [email protected]; Karen S. McNeal, Department of Geosciences, Mississippi State University, [email protected]; Vladimir Alarcon, Geosystems Research Institute, Mississippi State University, [email protected]
NOAA sponsor and NOAA office of primary technical contact: Julian Lartigue, NOAA Office of Oceanic and Atmospheric Research
NOAA Goals: Ecosystems Mission Goal, Weather and Water Mission Goal, Commerce and Transportation Mission Goal
Project objectives and goals
Sediments are the main repository of mercury in the coastal Gulf of Mexico as well as the site of transformation of inorganic mercury to methylmercury, the more toxic form that is bioaccumulated through food webs. Resuspended sediments are a major transport vector for total mercury and methylmercury. The redistribution of mercury-containing sediments is a critical determinant of where in the coastal environment mercury will become a problem. Sediment characteristics such as texture and organic matter content help determine the extent to which inorganic mercury is transformed to methylmercury. The goal of this project is to provide a suite of methods to predict the path and fate of sediment and mercury in the Gulf coastal region from entry point to fish stocks.
The specific objectives of this project are to:
(1) Improve sediment and mercury modeling capabilities
(2) Determine potential sulfide accumulation effects on methylmercury production
(3) Establish a method to predict mercury bioaccumulation in fish
(4) Extend the new technologies to other areas of the Gulf of Mexico
(5) Determine the potential of Weeks Bay sediments to promote methylmercury production through measurements of mercury, acid volatile sulfides, total reduced sulfides, reactive iron, and organic carbon.
Description of research conducted during the reporting period and milestones accomplished and/or completed
a. Completed first year field sampling in collaboration with MSU partners. Completed mercury and sediment analyses. Developed new sampling and analytical methods.
b. Samples were collected from 20 locations in Weeks Bay and the Fish and Magnolia Rivers in June of 2010 and 2011. Each location was sampled at least once where in 2010 observations were largely in the Bay itself and 2011 samples were collected in the Fish and Magnolia rivers, Weeks Bay, and in Mobile Bay at the mouth of Weeks Bay.
c. Sediment cores were collected using a hand-corer from a boat. Sediment core liners (10am diameter, 20cm long) were secured to the hand corer, where approximately 10-15cm of sediment was collected. Care was taken not to re-core in the exact same location (e.g., shift deployment a couple of feet), however replication was maintained within 3m.
113
NGI Progress Report NOAA Award #: NA06OAR4320264
Reporting Period: Jul 1, 2010 - Jun 30, 2011
d. Collected cores were immediately capped, taped, and secured upright in a cooler on the collection vessel and returned to the field laboratory for electrode analysis and porewater separation. Care was taken not to jostle or shake the cores after collection to maintain vertical integrity.
e. A Unisense Microelectrode profiling system (Unisense Inc., Denmark) and ion specific solid state microelectrodes were utilized to determine concentrations of dissolved O2 and H2S and Eh and pH in sediment porewaters on intact cores every 1mm from 10mm above the sediment water interface down to at least 5cm. Afterwards, cores were placed in a sealed glove bag, where a N2 environment prevented oxidation of redox reactive species.
f. Cores were sliced in 2cm sections down to 10cm, placed in squeezer cups with a 7.0cm diameter GL filter paper, removed from the glove bag and immediately placed on the squeezer rack under a N2 environment. Pressure and gravity worked to separate porewaters from the solid phase and were captured in a 10mL plastic syringe. Once collection was completed, porewaters (for Fe and Mn analysis) were filtered (0.45um) and placed in N2 evacuated 4mL vials for immediate analysis. Dissolved iron was determined by using a small amount of porewater for measurement of Fe2+and following the Ferrozine method (Stookey, 1970). Dissolved manganese was determined following Armstrong (1979). Remaining porewaters were frozen and analyzed within a month for sulfate:chloride ratios in order to get another estimate of the degree of sulfate reduction. Solid phase samples were removed from sediment cups, placed in pre-labeled whirl bags, and immediately frozen (-20°C) for laboratory analysis of total reactive iron (Canfield, 1986), acid volatile sulfides and total reduced sulfides (Canfield, 1986 and Cornwell, 1987), carbon and nitrogen, and grain size analysis.
g. Water column measures of pH, DO, Temperature and Salinity, Chl a, turbidity, and TDS were made using a YSI Sonde at each sampling location at surface and bottom water depths. Surface water samples for Chl a, total phosphorous, total nitrogen, dissolved organic carbon, and dissolved inorganic carbon analyses were taken at ten of the sample locations as well and analyzed by the Civil Engineering and Environmental Laboratory.
h. The impact of three rainfall datasets on hydrologic process simulations in the Weeks Bay watershed was evaluated using rain gauge time series (from NOAA and USGS) and the Hydrological Simulation Program – FORTRAN (HSPF). Automatic parameter calibration was performed using daily streamflow data recorded at USGS Fish and Magnolia River gauge stations from 01/01/2002 to 12/31/2008.
i. Parameter sensitivity of 10 HSPF parameters was evaluated using the PEST software.
Description of significant research results, protocols developed, and research transitions
Sediment and water sampling in Weeks bay
A portion of the solid phase samples collected from the 2010 sampling trip are still being processed in the laboratory and the June 2011 sampling trip is on-going. The results presented below are preliminary, however are promising in providing a better understanding of the sediment dynamics and influences on mercury. All of the collected data will be provided to the mercury modeling group in order to calibrate the developed mercury models.
Water column conditions and sediment grain size were collected (Table 4). In 2010, Weeks Bay was very fresh (salinity = 1-2), Dissolved oxygen (DO) was high (8-9 mg/L), and there was little stratification of the water column. However, in the recent 2011 field trip salinity was observed to be ~11-12, DO was lower (5-6 mg/L) and increased stratification was noted; however no hypoxic conditions were detected.
114
NGI Progress Report NOAA Award #: NA06OAR4320264
Reporting Period: Jul 1, 2010 - Jun 30, 2011
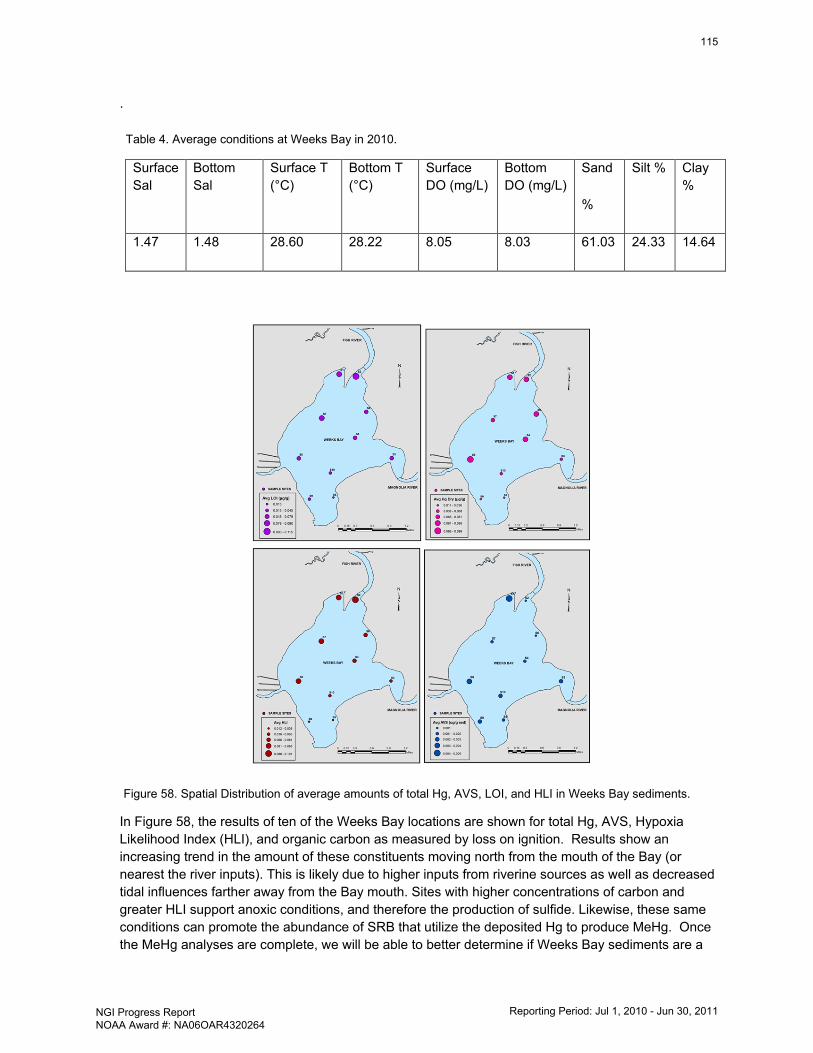
.
Table 4. Average conditions at Weeks Bay in 2010.
Surface Sal
Bottom Sal
Surface T (°C)
Bottom T (°C)
Surface DO (mg/L)
Bottom DO (mg/L)
Sand
%
Silt % Clay %
1.47 1.48 28.60 28.22 8.05 8.03 61.03 24.33 14.64
Figure 58. Spatial Distribution of average amounts of total Hg, AVS, LOI, and HLI in Weeks Bay sediments.
In Figure 58, the results of ten of the Weeks Bay locations are shown for total Hg, AVS, Hypoxia Likelihood Index (HLI), and organic carbon as measured by loss on ignition. Results show an increasing trend in the amount of these constituents moving north from the mouth of the Bay (or nearest the river inputs). This is likely due to higher inputs from riverine sources as well as decreased tidal influences farther away from the Bay mouth. Sites with higher concentrations of carbon and greater HLI support anoxic conditions, and therefore the production of sulfide. Likewise, these same conditions can promote the abundance of SRB that utilize the deposited Hg to produce MeHg. Once the MeHg analyses are complete, we will be able to better determine if Weeks Bay sediments are a
115
NGI Progress Report NOAA Award #: NA06OAR4320264
Reporting Period: Jul 1, 2010 - Jun 30, 2011
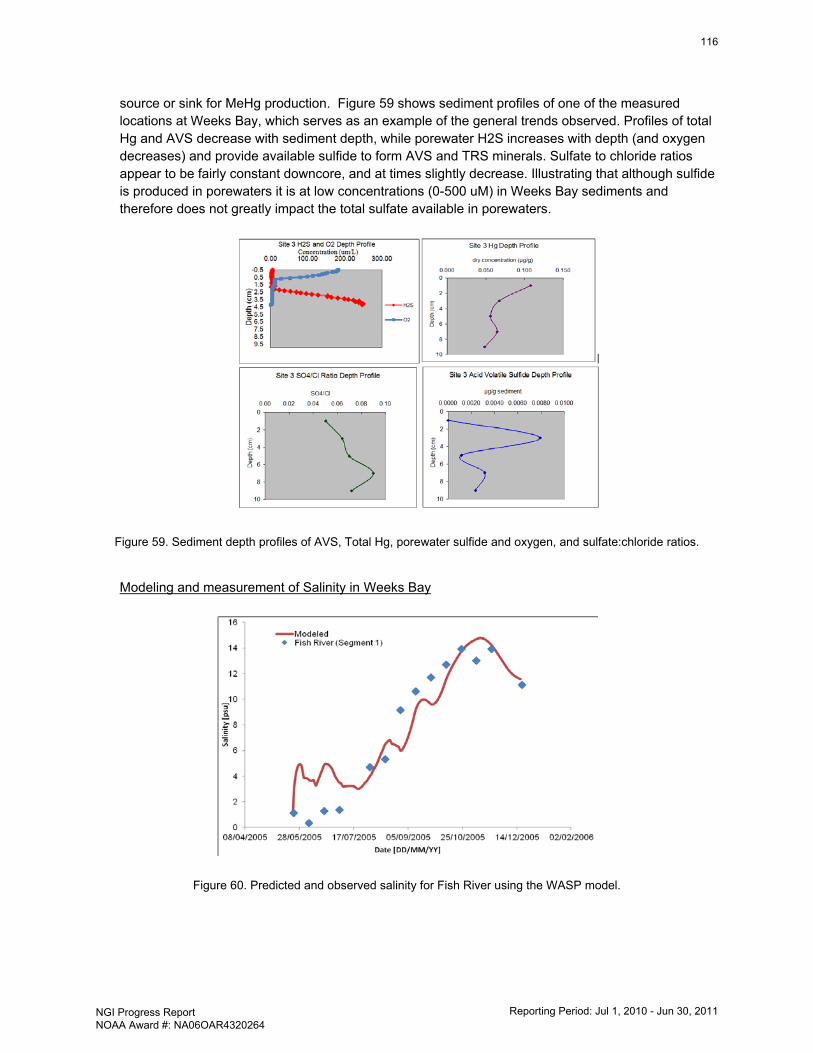
source or sink for MeHg production. Figure 59 shows sediment profiles of one of the measured locations at Weeks Bay, which serves as an example of the general trends observed. Profiles of total Hg and AVS decrease with sediment depth, while porewater H2S increases with depth (and oxygen decreases) and provide available sulfide to form AVS and TRS minerals. Sulfate to chloride ratios appear to be fairly constant downcore, and at times slightly decrease. Illustrating that although sulfide is produced in porewaters it is at low concentrations (0-500 uM) in Weeks Bay sediments and therefore does not greatly impact the total sulfate available in porewaters.
Figure 59. Sediment depth profiles of AVS, Total Hg, porewater sulfide and oxygen, and sulfate:chloride ratios.
Modeling and measurement of Salinity in Weeks Bay
Figure 60. Predicted and observed salinity for Fish River using the WASP model.
116
NGI Progress Report NOAA Award #: NA06OAR4320264
Reporting Period: Jul 1, 2010 - Jun 30, 2011
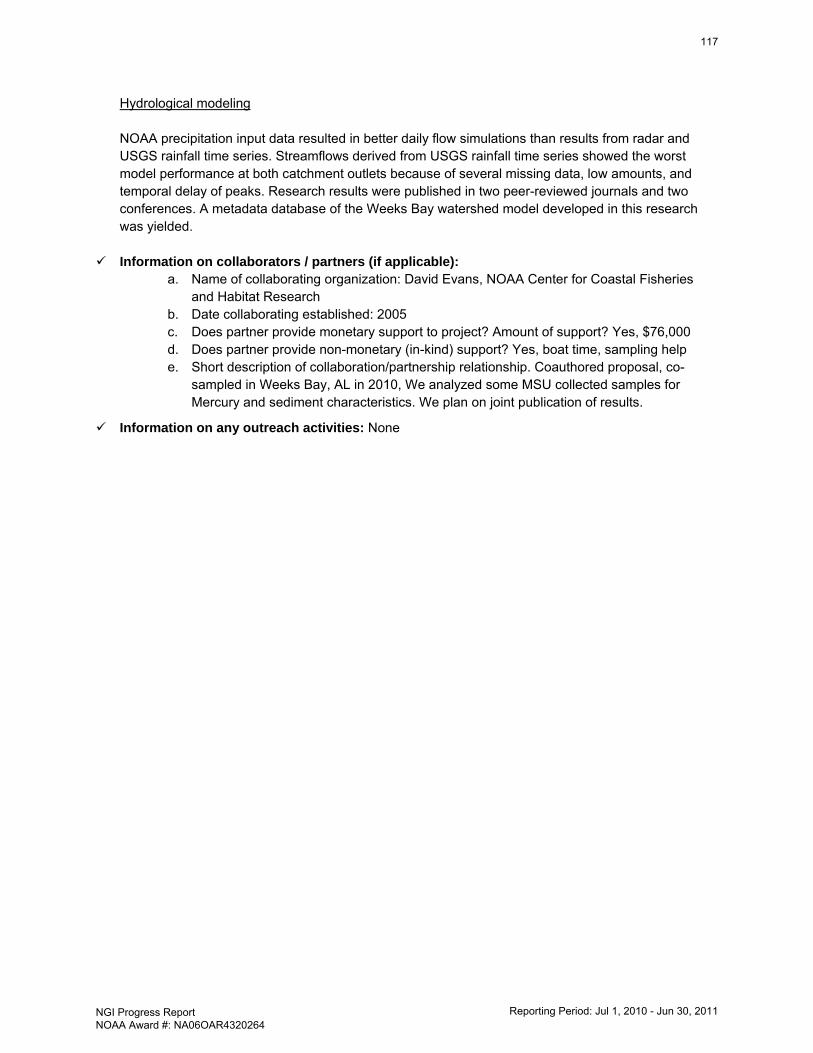
Hydrological modeling NOAA precipitation input data resulted in better daily flow simulations than results from radar and USGS rainfall time series. Streamflows derived from USGS rainfall time series showed the worst model performance at both catchment outlets because of several missing data, low amounts, and temporal delay of peaks. Research results were published in two peer-reviewed journals and two conferences. A metadata database of the Weeks Bay watershed model developed in this research was yielded.
Information on collaborators / partners (if applicable): a. Name of collaborating organization: David Evans, NOAA Center for Coastal Fisheries
and Habitat Research b. Date collaborating established: 2005 c. Does partner provide monetary support to project? Amount of support? Yes, $76,000 d. Does partner provide non-monetary (in-kind) support? Yes, boat time, sampling help e. Short description of collaboration/partnership relationship. Coauthored proposal, co-
sampled in Weeks Bay, AL in 2010, We analyzed some MSU collected samples for Mercury and sediment characteristics. We plan on joint publication of results.
Information on any outreach activities: None
117
NGI Progress Report NOAA Award #: NA06OAR4320264
Reporting Period: Jul 1, 2010 - Jun 30, 2011
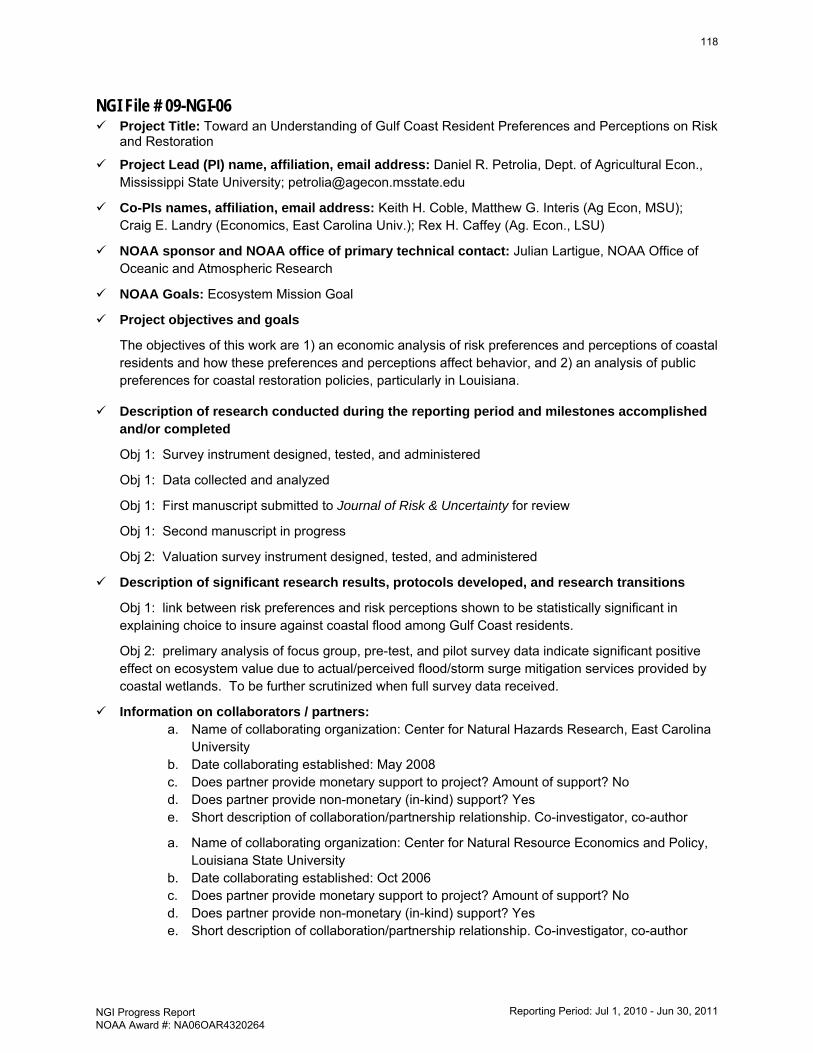
NGI File # 09-NGI-06 Project Title: Toward an Understanding of Gulf Coast Resident Preferences and Perceptions on Risk
and Restoration
Project Lead (PI) name, affiliation, email address: Daniel R. Petrolia, Dept. of Agricultural Econ., Mississippi State University; [email protected]
Co-PIs names, affiliation, email address: Keith H. Coble, Matthew G. Interis (Ag Econ, MSU); Craig E. Landry (Economics, East Carolina Univ.); Rex H. Caffey (Ag. Econ., LSU)
NOAA sponsor and NOAA office of primary technical contact: Julian Lartigue, NOAA Office of Oceanic and Atmospheric Research
NOAA Goals: Ecosystem Mission Goal
Project objectives and goals
The objectives of this work are 1) an economic analysis of risk preferences and perceptions of coastal residents and how these preferences and perceptions affect behavior, and 2) an analysis of public preferences for coastal restoration policies, particularly in Louisiana.
Description of research conducted during the reporting period and milestones accomplished and/or completed
Obj 1: Survey instrument designed, tested, and administered
Obj 1: Data collected and analyzed
Obj 1: First manuscript submitted to Journal of Risk & Uncertainty for review
Obj 1: Second manuscript in progress
Obj 2: Valuation survey instrument designed, tested, and administered
Description of significant research results, protocols developed, and research transitions
Obj 1: link between risk preferences and risk perceptions shown to be statistically significant in explaining choice to insure against coastal flood among Gulf Coast residents.
Obj 2: prelimary analysis of focus group, pre-test, and pilot survey data indicate significant positive effect on ecosystem value due to actual/perceived flood/storm surge mitigation services provided by coastal wetlands. To be further scrutinized when full survey data received.
Information on collaborators / partners: a. Name of collaborating organization: Center for Natural Hazards Research, East Carolina
University b. Date collaborating established: May 2008 c. Does partner provide monetary support to project? Amount of support? No d. Does partner provide non-monetary (in-kind) support? Yes e. Short description of collaboration/partnership relationship. Co-investigator, co-author
a. Name of collaborating organization: Center for Natural Resource Economics and Policy, Louisiana State University
b. Date collaborating established: Oct 2006 c. Does partner provide monetary support to project? Amount of support? No d. Does partner provide non-monetary (in-kind) support? Yes e. Short description of collaboration/partnership relationship. Co-investigator, co-author
118
NGI Progress Report NOAA Award #: NA06OAR4320264
Reporting Period: Jul 1, 2010 - Jun 30, 2011
a. Name of collaborating organization: Barataria-Terrebonne National Estuary Program b. Date collaborating established: Jan 2011 c. Does partner provide monetary support to project? Amount of support? No d. Does partner provide non-monetary (in-kind) support? Yes e. Short description of collaboration/partnership relationship. Advisory
Information on any outreach activities: None
119
NGI Progress Report NOAA Award #: NA06OAR4320264
Reporting Period: Jul 1, 2010 - Jun 30, 2011
NGI File # 09-NGI-07 Project Title: Food webs without borders: a case for ecosystem-based management in the northern
Gulf of Mexico
Project Lead (PI) name, affiliation, email address: Dr. John Valentine, Dauphin Island Sea Lab, [email protected]
Co-PIs names, affiliation, email address: Dr. Behzad Mortazavi, Dauphin Island Sea Lab, [email protected]; Dr. Tina Miller-Way, Dauphin Island Sea Lab, [email protected]
NOAA sponsor and NOAA office of primary technical contact: Julian Lartigue, NOAA Office of Oceanic and Atmospheric Research
NOAA Goal: Ecosystem Mission Goal
Project objectives and goals
In this project we outline a two-year course of study designed to assess the importance of 1) energetic and nutrient subsidies from vegetated habitats in the Mobile Bay Delta and surrounding terrestrial habitats to the productivity of the base of the Mobile Bay food web, and 2) the importance of migratory fishes and crustaceans in supporting the growth of higher order consumers living in the oligohaline reaches of this system. We propose to use diverse methodologies including stable isotopic analyses, experimental evaluations, and classical population and community ecology to attack these applied and theoretically interesting questions. Through this study, we believe that we will be able to provide evidence that cross-habitat linkages are important and must be considered if we are to restore the productivity of human-dominated ecosystems along the northern Gulf of Mexico.
Description of research conducted during the reporting period and milestones accomplished and/or completed
Field Sampling
340 plant and animal samples representing over 100 species were collected for isotopic analysis in the Mobile-Tensaw Delta, Mobile Bay, and the nearshore Gulf of Mexico from September 17, 2010 through October 6, 2010. Sediment and plankton samples were also collected from each location. All plants and animals were identified to species. The plant tissue was freeze dried and ground in preparation for isotopic analysis. Gut contents of several fish were identified and recorded, and macroinvertebrate and fish tissues were prepared for isotopic analysis. These samples, along with samples collected during spring and summer 2010, were weighed, packed, and shipped to Washington State University for 13C, 15N, and 34S analysis. Kruskal-Wallace tests were run to compare isotope values of organisms with similar diets, as well as individual species, among habitats in spring and fall. Dual-isotope plots were also constructed to illustrate seasonal differences.
296 plant and animal samples representing 90 species, as well as sediment and plankton samples, were collected from the Mobile-Tensaw Delta, Mobile Bay, and the nearshore Gulf of Mexico from April 19, 2011 through June 2, 2011. Tissues were freeze-dried and prepared for isotopic analysis.
Diet Switch Experiment
Blue crabs captured from Chocolatta Bay were used for a diet switch experiment to estimate tissue turnover rates. Crabs were weighed, measured, and placed in individual enclosures. A swimming leg was clipped from each crab for the determination of the initial muscle isotopic values. Crabs were fed offshore caught Atlantic bumper of a known isotopic content (δ 13C -16.9 ‰) daily for a period of 83 days. 4-10 specimens were sampled after 0, 2, 5, 10, 20, 40 and 83 days from the start of the experiment, with their muscle and hepatopancreas and processed as previously mentioned.
120
NGI Progress Report NOAA Award #: NA06OAR4320264
Reporting Period: Jul 1, 2010 - Jun 30, 2011
Resident vs. Migratory Blue Crabs
Blue crabs were collected by trawls, crab pots, box traps, and dip nets from Mobile-Tensaw Delta, Fowl River, the dock at Dauphin Island Sea Lab, Sand Island, and Fort Morgan from August 2010 to November 2010. Muscle (cheliped) and hepatopancreas were sampled from each individual, rinsed with deionized water, freeze dried and prepared for isotopic analysis. Hepatopancreas samples underwent a lipid removal to account for variable lipid concentrations. These two tissues were chosen due to differences in turnover rates, which provide insight into their past and more recent diets and habitats, allowing us to determine if the crabs reside in one area or move among different areas to feed.
Description of significant research results, protocols developed, and research transitions
Seasonal Differences in Isotope Signatures
Kruskal-Wallace tests showed significant differences in δ 34S of plants (H = 57.53, p < 0.001), invertebrates (H = 13.22, p < 0.001, Figures), and fishes (H = 25.31, p < 0.001) collected from Mobile-Tensaw Delta (MTD) in spring and fall. Organisms collected from MTD during fall were more enriched in 34S than those collected in spring in all cases. This was true when grouped by phylum and diet, as well as when species were analyzed individually. Kruskal-Wallace tests showed no significant differences in δ 13C, or δ 15N between seasons in plants, invertebrates, or fishes from any location, although there were differences among locations. Likewise, there were no significant differences in δ 34S between seasons in fishes or invertebrates collected from the Gulf. Samples were collected from Mobile Bay only in spring, so no seasonal comparisons of isotope signatures of organisms collected from Mobile Bay were made. Gulf samples were the most enriched in the heavy C, N, and S isotopes, Mobile Bay samples were intermediate, and MTD samples were the least enriched in the heavy isotopes.
Diet Switch Experiment
The δ 13C of muscle and hepatopancreas tissues showed enrichment in δ 13C during the diet switch, reflective of the offshore food source. Hepatopancreas values changed more rapidly during the diet switch experiment and showed less variation between individuals. Site comparisons of multiple tissues demonstrated greater variation in δ 13C values for migratory crabs compared to residents. Crabs during the diet switch became more enriched over time. Crabs experiencing new growth during the experiment had more enriched δ 13C values compared to crabs with only metabolic turnover of muscle. Therefore, muscle values were corrected to account for only metabolic turnover. Hepatopancreas tissue reflected the new diet more rapidly than muscle tissue, demonstrating the usefulness of the two tissues to indicate recent (hepatopancreas) and long term (muscle) diets.
Resident vs. Migratory Blue Crabs
Blue crabs captured in the delta were most depleted in δ 13C (-24.7‰ average value). Crabs at the Fowl River site showed an intermediate average δ 13C value (-23.7‰), while crabs at the coastal sites were more enriched (average site values -21 to -19 ‰). δ 15N values showed smaller variation than δ 13C.
Crabs at the delta site showed little deviation between δ 13C values of muscle and hepatopancreas tissues, and were therefore assumed to be residents. The Sand Island site and Fort Morgan sites demonstrated migrant individuals moving among coastal sites based on the larger deviation between tissues. Resident crabs in coastal regions were crabs that had likely remained following previous year(s) migration. Crabs at the DISL dock (Dauphin Island) site had deviations suggesting residency. We suspect this is due to the large amount of offshore caught fish (red snapper) that is disposed of at this site. The Fowl River site did not show much deviation between tissues, which would have
121
NGI Progress Report NOAA Award #: NA06OAR4320264
Reporting Period: Jul 1, 2010 - Jun 30, 2011
demonstrated movement. This likely rose from the Fowl River site being fueled by a terrestrial basal food source similar to the delta site. As a result, crabs moving through this region were still feeding on food of comparable isotopic values.
Information on collaborators / partners: a. Name of collaborating organization: Lawrence Rozas, NOAA Fisheries Service b. Date collaborating established: Oct 2009 c. Does partner provide monetary support to project? Amount of support? Yes d. Does partner provide non-monetary (in-kind) support? No e. Short description of collaboration/partnership relationship. John Valentine of DISL is
responsible for the overall conduct and successful completion of this grant proposal. His responsibilities include budget and personnel management, scheduling and participation in sampling and monitoring events, oversight of the data and lab analysis, and publication and report development. Drs. Rozas (NOAA) and Valentine (DISL) work in concert to conduct sampling, stomach analyses and manipulative field experiments while Mortazavi (DISL) and Valentine collaborate on the isotopic analyses. Dr. Miller-Way, the head of Discovery Hall at DISL, is leading the effort on outreach.
Information on any outreach activities: i. Type: Workshop ii. Name of event: The Delta Workshop 2011 iii. Date: Jun 5-9, 2011 iv. Location: Dauphin Island Sea Lab v. Description: Alabama K-12 teachers attended lectures and participated in field
and laboratory activities relating to the Mobile-Tensaw Delta. Researchers presented results of habitat connectivity studies to demonstrate the linkages among Mobile-Tensaw Delta, Mobile Bay, and the Gulf of Mexico, highlighting the need for ecosystem-based management of area fisheries.
122
NGI Progress Report NOAA Award #: NA06OAR4320264
Reporting Period: Jul 1, 2010 - Jun 30, 2011
NGI File # 09-NGI-08 Project Title: Understanding coastal resiliency from hurricane impacts using integrated modeling and
observations
Project Lead (PI) name, affiliation, email address: Q. Jim Chen, Louisiana State University, [email protected]
Co-PIs names, affiliation, email address: Robert Twilley, Louisiana State University, [email protected]; Jaye E. Cable, Louisiana State University, [email protected]; Pat Fitzpatrick, Mississippi State University, [email protected]
NOAA sponsor and NOAA office of primary technical contact: Julian Lartigue, NOAA Office of Oceanic and Atmospheric Research
NOAA Goal: Climate Mission Goal
Project objectives and goals
A number of river diversion projects designed to restore coastal wetlands have been built in south Louisiana. Among them are the Caernarvon Fresh Water Diversion Project in upper Breton Sound east of the Mississippi River and the Wax Lake Outlet of the Atchafalaya Basin in St. Mary Parish, LA. These diversions represent two scales and types of land building restoration models: One is the nourishment model that puts fresh water and accompanying sediment in existing older marsh landscapes and the second is a land creation model that builds new land with vegetation in new deltaic lobes using river sediments. Both systems may have different resiliencies from hurricane impacts, and consequently, they provide an important comparison and contrast for storm surge and wave reduction models. The long term goal of this study is to improve our understanding of coastal resiliency from hurricane impacts using integrated numerical modeling, in-situ observations and remote sensing techniques. The specific objectives of this two-year project are to 1) Develop a comprehensive dataset of vegetation, soil and salinity characteristics before and after high energy disturbances in Breton Sound and Wax Lake Delta based on in-situ monitoring; 2) Compile geospatial data and analyze wetland changes in Breton Sound and Wax Lake Delta based on satellite imagery and modeling; 3) Improve the wind forcing input for storm surge and wave models; 4) Extend the NOAA ocean wave prediction model to coastal regions with wetlands; 5) Develop and test a coupled wave, surge and sediment transport modeling system for coastal regions using the Breton Sound and Wax Lake Delta as a natural “laboratory”; 6) Conduct numerical simulations to test hypotheses of coastal resiliency. In order to understand, quantify and predict coastal resiliency from hurricane impacts, we have identified a number of key scientific equations: 1) What are the controlling factors dictating wetland erosion or sedimentation during a hurricane? 2) Can our predictive ability for assessing storm surge damage be improved through the development of coupled wave, surge, and sediment transport models? 3) How does the wetland loss contribute to the increase of storm surge and waves in coastal basins? 4) What is the rate of recovery of a damaged wetland after a storm? 5) Which land building restoration model is more effective and resilient from hurricane impacts?
Description of research conducted during the reporting period and milestones accomplished and/or completed
Milestone A: Numerical modeling and wind analysis schemes
Milestone B: Wetland loss patterns near the Caernarvon diversion due to hurricane storm surge
Milestone C: Surge-dependent vegetation effects on hurricane-generated waves
Milestone D: Directional Spectra of Hurricane Waves in the Gulf of Mexico
123
NGI Progress Report NOAA Award #: NA06OAR4320264
Reporting Period: Jul 1, 2010 - Jun 30, 2011
Milestone E: Field Measurements of Vegetation Biomechanical Characteristics
Milestone F: Facilitating the development of a quasi-stationary version of WAVEWATCH III
Description of significant research results, protocols developed, and research transitions
Milestone A: Numerical modeling and wind analysis schemes
This project advances weather forecast software and utilizes cutting-edge satellite and aircraft data to improve hurricane wind observations, intensity prediction, and wind structure forecasts. Errors in storm intensity and wind structure contribute to incorrect decision-making in DHS risk prognostics; flood insurance costs; and hurricane landfalls. However, wind observations are difficult to obtain, since instruments are often damaged during hurricanes. Moreover, the main analysis scheme, H*WIND, is a subjective algorithm not based on data assimilation science, handles outer-core winds inconsistently, only produces data every three hours, and often provides no data at landfall. We are developing a new hurricane analysis scheme based on advances in data assimilation science that will produce consistent wind fields at all temporal and spatial scales. Our current research is based on data assimilation experiments with Three-Dimensional VARiational analysis (3DVAR), Four-Dimensional VARiational analysis (4DVAR), and Gridpoint Statistical Interpolation (GSI). The modeling work uses the Weather Research and Forecast model (WRF) and two recently released hurricane versions of WRF: the NCAR version (Advanced Research HWRF, or AHW), and the NOAA/NCEP version (Hurricane WRF, or HWRF). Current efforts focus on Hurricane Gustav.
Milestone B: Wetland loss patterns near the Caernarvon diversion due to hurricane storm surge
The altered brackish landscape from the diversion may not be resilient to hurricane storm surge and associated wave action. Hurricanes Gustav (2008), Ike (2008), Rita (2005), and Katrina (2005) caused erosion near the diversion which exceeded other erosion rates. The goal of this research is to geographically quantify the land loss in the Hopedale and Delacroix marsh due to the 2005 and 2008 hurricanes. Specifically, the following regions are contrasted: 1) north of the Mississippi River Gulf Outlet (MRGO) in an area known as the Biloxi marsh (consisting of intermediate and saltwater marsh); 2) the saline outer marsh of Delacroix near Black Bay; and 3) the interior Caernarvon brackish and freshwater marsh in Delacroix. This analysis is performed for pre-Katrina/Rita, post-Katrina/Rita, and post-Gustav/Ike using data from NOAA’s Coastal Change Analysis Program (C-CAP) program [distributed by the Coastal Services Center], and from the Landsat 5 Thematic Mapper (TM) satellite sensor.
The following results were found, and have been submitted in a journal paper:
• Before the 2005 hurricanes, wetland erosion occurred at a slow but steady pace throughout the region, from 0-2.4%. The most erosion was near the diversion in the freshwater region.
• After the 2005 hurricanes, land loss is evident throughout the basin. Both C-CAP and Landsat datasets show that, north of the MRGO, water coverage in the intermediate to saline regions increased from 1.5-3.7%. However, the freshwater regions increased as from 12.3-39.0%.The biggest proportional changes are in the diversion area.
• Wilcoxon rank-sum tests show these differences are statistically significant at convincing levels, with the smallest p-values near the diversion.
• The Landsat data for post-Gustav/Ike showed minimal land loss throughout the basin except near the diversion.
124
NGI Progress Report NOAA Award #: NA06OAR4320264
Reporting Period: Jul 1, 2010 - Jun 30, 2011
• Hypotheses for this poor resiliency are currently being studied. The freshwater vegetation may be unable to withstand the shear stress from hurricane impacts on shallow low salinity root systems. Because of agricultural runoff into the Mississippi River, the Caernarvon’s nutrient-rich waters contribute to “weaker” soils by lowering biomass, below ground production, and organic accumulation. Additionally, the bulk density of freshwater marsh (0.07 g cm-3) is much less than saline marsh (0.24 g cm-3). All these factors suggest freshwater vegetation is less hardy than its saline counterparts.
Milestone C: Surge-dependent vegetation effects on hurricane-generated waves
It has long been recognized that vegetation on low-lying wetlands can effectively reduce the flow speed, modify turbulence structure, attenuate surge and wave energy, and affect sediment dynamics. Most of the existing storm surge and wave models utilize the conventional quadratic law for bed shear stresses. An empirical, constant bottom friction coefficient has been used to represent the increase in the flow resistance due to vegetation, which may not be applicable to storm surges and hurricane waves over salt marsh grass. During a hurricane event, salt mash grass remains emergent at the beginning and ending of the water surge while becomes completely submerged at the peak of the surge. For flows over flooded wetlands, the bottom drag coefficient strongly depends on the vegetation properties as well as the flow depth and speed associated with the storm surge. A large drag force that is able to bend or damage marsh grass may be generated and result in a reduction of the flow resistance. The plant rigidity is a crucial parameter in determining the vegetal friction, which has important implications for surge and waves. The velocities common to surge events are sufficient to bend flexible vegetation, such as Spartina alterniflora, the dominant salt marsh vegetation on the Gulf Coast. For the emergent salt marshes, the vegetation drag is explicitly related to the flow depth as the projected area of vegetation increases with the surge height. Field measurements have been conducted to measure the salt marsh properties on the Louisiana coast. We have obtained new results of modeling wave attenuation by salt marshes using the coupled surge-wave-vegetation models and observed vegetation properties. A sub-model for the surge-dependent vegetation drag described above has been developed and implemented into a three-dimensional (3D) storm surge model coupled with a spectral wave prediction model. The flow resistance and its equivalent Manning’s roughness coefficient due to the vegetation were computed every time step as a part of the output from the 3D model, and used as a part of the input to the wave model together with the water level and depth-averaged velocity. The wave attenuation rate as a function of the surge stage and vegetation properties was quantified. It has been found that the time-dependent Manning’s roughness coefficient peaks when the water depth is 1~2 times the plant height and gradually decreases as the surge height increases. Because the salt marsh grass bends as the current velocity increases, the Manning’s coefficient decreases and so does the wave energy attenuation rate under strong currents. The methodology that we have developed can be implemented into other wave and surge models. The results have been documented in one journal paper and another manuscript. Milestone D: Directional Spectra of Hurricane Waves in the Gulf of Mexico
The Gulf of Mexico is extremely susceptible to the impact of frequent tropical cyclones. These extreme meteorological events can generate waves larger than 10 m. Many ocean and coastal engineering applications require the information about the directional and frequency distributions of wave energy beyond significant wave heights and peak wave periods. In this paper, hurricane-induced directional wave spectra in the Gulf of Mexico are investigated based on field measurements from the NOAA National Data Buoy Center. The directional wave data were collected at 12 buoys during eight hurricane events in recent years. Focusing on hurricane-generated wave spectra, we only consider the wave measurements at the buoys within eight times the radius of the hurricane
125
NGI Progress Report NOAA Award #: NA06OAR4320264
Reporting Period: Jul 1, 2010 - Jun 30, 2011
maximum wind speed from the hurricane center. A series of numerical experiments using a third-generation spectral wave prediction model were carried out to gain insight into the mechanics controlling the directional and frequency distributions of hurricane wave energy. A hurricane wave spectrum can be divided into low-frequency swell and high-frequency seas. It is found that hurricane wave spectra are almost swell-dominated except for the right-rear quadrant of a hurricane with respect to the forward direction, where the local strong winds control the spectra. Despite the complexity of a hurricane wind field, most of the spectra are mono-modal, similar to those under fetch-limited, unidirectional winds. However, bi-modal spectra were also found in both measurements and model results. There are two cases of bi-modal spectra. One is bi-modal in frequency with almost the same wave direction. It occurs when the energy of locally-generated wind sea is only partially transferred to the swell energy by non-linear wave-wave interactions. Another one is bi-modal in both frequency and direction. It happens mainly in the left-forward and left-rear quadrants when the direction of hurricane winds deviates considerably from the swell direction. The new findings have been documented in a journal manuscript under review. Milestone E: Field Measurements of Vegetation Biomechanical Characteristics
Louisiana coastal wetlands are critical for storm surge mitigation during hurricanes and tropical storms. It is known that emergent wetland vegetation exerts some degree of resistance against the flow of overland surface water, but the amount of physical resistance they represent is largely uncertain and challenging to measure in the field. To attempt characterizing this physical resistance by plants, a series of field measurements were conducted in upper Breton Sound Basin just south of New Orleans, LA. Saline, brackish and freshwater vegetation communities were examined for differences in their frictional influence on water flow. Dominant plant species within each site were measured for plant and stem height, stem diameter, and elasticity (e.g. the amount of force required to bend the plant 45° relative to the earth’s surface). Additional site conditions were collected, including water depth, overland flow velocity, temperature, salinity, conductivity, and sediment properties. We have obtained an important dataset relevant to the modeling of surge and wave attenuation by wetland vegetation. Furthermore, the field data from different sites, different species, and different seasons allow us to develop empirical relationships between plant elasticity and the ratio of stem height and diameter. Although they are in general agreement with the relationship found in the literature, seasonal and species dependent variations are found for wetland vegetation in southeast Louisiana. The results are being used by the modelers.
Milestone F: Facilitating the development of a quasi-stationary version of WAVEWATCH III
The research team has worked with the research staff led by the Co-PI in NOAA-NCEP-EMC by providing the bathymetric and wind data, computational grids and ADCIRC simulation results for Hurricane Gustav (2008) to facilitate the extension of NOAA’s wave model to coastal areas. WAVEWATCH III has been successfully applied to oceanic and shelf scale wave modeling domains. With the increased frequency and severity of hurricane and inundation events, it has become important to extend the field of application of this model to the nearshore. Because this model is based on the hyperbolic form of the action balance equation, CFL restrictions apply to the choice of the propagation time step, rendering nearshore simulation with high spatial resolution computationally expensive. In conjunction with the present study, a so-called quasi-stationary version of WAVEWATCH III has been developed by the NOAA collaborators. The resulting quasi-stationary model has been evaluated for idealized swell propagation and wind growth conditions, and field cases including swell propagation and a hurricane event. Computational savings of up to 50% relative to the default non-stationary model are found, depending on the wave condition and domain size, in combination with local errors in significant wave height and mean period of less than 5% and 2%,
126
NGI Progress Report NOAA Award #: NA06OAR4320264
Reporting Period: Jul 1, 2010 - Jun 30, 2011
respectively. The new model developed by our NOAA collaborators in this project has been transferred to researchers at LSU and MSU.
Information on collaborators / partners:
Hendrik Tolman, NOAA-NCEP-EMC, has collaborated on this project since July 2009. He provides the project with access to the database of Wax Lake Delta, but provides no financial support.
Information on any outreach activities:
Q. Jim Chen has collaborated with the Dauphin Island Sea Lab Discovery Hall Program on mentoring a high school student who is measuring salt marsh properties on wetlands in Dauphin Island as her research project.
127
NGI Progress Report NOAA Award #: NA06OAR4320264
Reporting Period: Jul 1, 2010 - Jun 30, 2011
NGI File # 09-NGI-09 Project Title: Visual Analytics for Assessment and Interpretation of Simulated River Flooding
Project Lead (PI) name, affiliation, email address: Philip Amburn, Mississippi State University, [email protected]
Co-PIs names, affiliation, email address: Jamie Dyer, Mississippi State University, [email protected]; Song Zhang, Mississippi State University, [email protected]
NOAA sponsor and NOAA office of primary technical contact: Julian Lartigue, NOAA Office of Oceanic and Atmospheric Research
NOAA Goal: Weather and Water Mission Goal
Project objectives and goals: The goals of this project are the development of visual analytics tools to enable scientists and forecasters to better interpret and distribute hydrologic information. Such a product would be useful in the research community as an interpretation tool for river level and flood data, but would also serve as a useful platform for hydrologic forecasters within the NWS to more quickly and accurately determine areas at risk for flooding. Another potential use is the emergency management community to better visualize areas to be impacted by flooding to support making decisions on evacuations. These tools will allow NOAA river forecasters to better visualize the extent of flooding, increasing their knowledge and understanding of the extent and effects of flooding. These tools will allow forecasters to relay more information to the emergency management community while issuing forecasts to help protect life and property. Images may be provided to the emergency managers and local officials to assist in making the decision to evacuate people.
Description of research conducted during the reporting period and milestones accomplished and/or completed
During this reporting period, the primary focus has been on software development. Close cooperation with LMRFC partners has been crucial during this time. A small but hard-working team of software developers at MSU have developed a software application called FloodViz. Eventually we would like to see the resulting software considered for operational use in NWS River Forecast Centers. This ambitious goal has led us to develop a cross-platform software application that can operate under MS Windows, Linux, and Mac OS/X.
Early in the project, prior to this reporting period, software requirements and a concept of operations were captured in several documents. These documents have been the foundation of the software development during this reporting period. Most of the work during this reporting period has been in getting to the point of alpha and beta releases of the software. These early releases have been where the software under development has been installed on an AWIPS compatible workstation at LMRFC. LMRFC partners have then testing the early software releases and provided us with valuable feedback.
The primary test case used at MSU is the Pascagoula river region, an area where the LMRFC has responsibility. Since the NWS has standardized on the use of Hydrologic Engineering Center – River Analysis System (HEC-RAS) for flood modeling, the FloodViz team has concentrated on visualizing data from that model. Combining HEC-RAS model output with digital elevation model data and overhead imagery, the development team has been able to develop and test multiple views of the Pascagoula region. The views supported by FloodViz are a cross-section view, a river profile view, a profile view, and a 3D view. In many respects FloodViz is a customized GIS application that supports both 2D and 3D visualization.
128
NGI Progress Report NOAA Award #: NA06OAR4320264
Reporting Period: Jul 1, 2010 - Jun 30, 2011
Date Milestone July 2010 HEC-RAS reader developed Aug 2010 Initial version of GUI developed Nov 2010 Cross-section and river profile views developed March 2011 3D view developed April 2011 Geotiff reader developed April 2011 Profile view developed Jun 2011 Initial integration of ensemble visualization into FloodViz
Description of significant research results, protocols developed, and research transitions
Since this is a software development project, the significant results in this reporting period are directly tied to development and testing of the software. The releases listed below are versions of the software that we have compiled and tested at MSU, and then installed at the Lower Mississippi River Forecast Center (LMRFC). Subsequently, LMRFC personnel have made the time to do testing of the release candidate and provided us with feedback including error reports and recommendations for further enhancements.
Date Milestone Dec 2010 Alpha release of FloodViz software Apr 2011 Beta release of FloodViz software (version 0.6) Jun 2011 Second Beta release of FloodViz software (version 0.7)
Information on collaborators / partners:
Throughout this project collaboration with the LMRFC has been essential. Representatives of the LMRFC have served as subject matter experts from the start of this project. Periodic GoToMeeting sessions and regular email have proven invaluable. Specifically, the collaborators are
1. Mr. David Reed Hydrologist in Charge Lower Mississippi River Forecast Center 62300 Airport Road Slidell, LA 70460 Phone: 985-641-4343 Fax: 985-643-1226 e-mail: [email protected] 2. Jeff Graschel Service Coordination Hydrologist Lower Mississippi River Forecast Center 62300 Airport Road Slidell, LA 70460 Phone:985-641-4343 Fax:985-643-1226 e-mail: [email protected]
129
NGI Progress Report NOAA Award #: NA06OAR4320264
Reporting Period: Jul 1, 2010 - Jun 30, 2011
3. David Welch Development and Operations Hydrologist Lower Mississippi River Forecast Center 62300 Airport Road Slidell, LA 70460 Phone:985-641-4343 Fax:985-643-1226 e-mail: [email protected]
Information on any outreach activities: During the week of February 14, 2011 LMRFC hosted the
Advanced HEC-RAS Workshop for NWS Hydraulic Modelers; Unsteady Flow and GIS Applications at Stennis Space Center. David Welch, LMRFC, was the organizer and primary coordinator. MSU personnel helped in the administration of the workshop.
130
NGI Progress Report NOAA Award #: NA06OAR4320264
Reporting Period: Jul 1, 2010 - Jun 30, 2011
NGI File # 09-NGI-10 Project Title: Climate-related Ichthyofaunal Shifts in the Northern Gulf of Mexico: Implications for
Estuarine Ecology and Near Shore Fisheries
Project Lead (PI) name, affiliation, email address: Kenneth L. Heck, Jr., Dauphin Island Sea Lab and University of South Alabama, [email protected]
Co-PIs names, affiliation, email address: F. Joel Fodrie, Institute of Marine Sciences and Department of Marine Sciences, University of North Carolina at Chapel Hill, [email protected]
NOAA sponsor and NOAA office of primary technical contact: Julian Lartigue, NOAA Office of Oceanic and Atmospheric Research
NOAA Goals: Ecosystems Mission Goal, Climate Mission Goal
Project objectives and goals
I. Utilize SEAMAP data made available by the NOAA Laboratory in Pascagoula, MS, to examine temporal and spatial trends in offshore, benthic fish species collected during semi-annual surveys over the last 25+ years. II. Survey seagrass meadows via otter trawling during summer/fall of each project year to extend the dataset begun by Fodrie et al. (2010) and further explore/evaluate climate-related, spatial and temporal patterns of seagrass-associated fish communities. III. Conduct manipulative experiments on growth and survivorship of juvenile L. griseus, L. synagris and endemics (e.g., L. rhomboides, and C. nebulosus) to explore how interactions between these species affect local food-web dynamics. IV. Conduct tests to quantify rates of parrotfish herbivory on local seagrasses and estimate magnitude of altered energy flow through estuarine food webs.
Description of research conducted during the reporting period and milestones accomplished and/or completed
In year 1 of our project, we directed our efforts towards objectives II, III and IV, with significant progress on each front. For instance, we conducted 132 additional trawl samples in 2010 within seagrass meadows from the Chandeleur Islands, LA, to St. Joseph Bay, FL. These trawl collections covered a linear distance of ~ 15 km, and resulted in the collection of over 27,000 individual fishes. As in the previous 4 years, snapper, grouper and parrotfish comprised a significant portion of the catch.
Additionally, we conducted a series of caging experiments and field collections to assess the growth rates of gray snapper and pinfish (a model temperate endemic species). For our gray snapper assays, we considered growth rates within seagrass, oyster reef, and salt marsh habitats. These habitats are the most common and widely recognized nursery habitats in the northern GOM. Growth studies of juvenile grey snapper were conducted in the field in each of the three habitats during fall 2009 and 2010. We also conducted pairwise habitat preference experiments in a lab setting to determine whether predation risk influences grey snapper choice of potential nursery habitat. In field trials, ANOVAs showed no significant difference in mean daily growth among habitats; however, mean growth in seagrass and marsh was higher (46% more) than oyster reef habitat. In lab trials, habitat choice did not differ significantly in the absence of a red drum (Sciaenops ocellatus) predator, but red drum presence significantly affected choice between seagrass vs. marsh and marsh vs. oyster reef treatments, with grey snapper selecting marsh over both seagrass and oyster reef habitats. Furthermore, one significant shift in habitat selection was observed, from seagrass with no predator present to salt marsh with predator presence. Combined with growth results, the preference
131
NGI Progress Report NOAA Award #: NA06OAR4320264
Reporting Period: Jul 1, 2010 - Jun 30, 2011
of salt marsh structure in the presence of a red drum predator indicates that marsh habitat may be an important nursery for juvenile grey snapper in the northern GOM.
To quantify the impact of parrotfish (along with pinfish and filefish) grazing on seagrass biomass, we also performed stomach content analyses using fish(es) collected during our 2010 surveys (285 fish thus far). These data document the biomass of seagrasses in the stomachs of individual herbivores (2 endemic species, plus parrotfishes), scaled by length and biomass of each individual fish (see attached data file). When combined with gut-clearance rate data (continuing in 2011) and abundance data (2006-2010), our results will help quantify top-down effects on seagrass biomass, and specifically whether parrotfishes are exerting significantly more top-down pressure on this valuable nursery habitat as regional climate continues to warm and these fishes migrate in to the northern GOM.
Description of significant research results, protocols developed, and research transitions
NGI funding allowed us to continue our seagrass-associated fish surveys in 2010, extending a survey begun in 2006, and ultimately providing invaluable data following the Deepwater Horizon disaster. The ecosystem-level impacts of the Deepwater Horizon disaster have been largely unpredictable due to the unique setting and magnitude of this spill. We used a five-year (2006-2010) data set within the oil-affected region to explore acute consequences for early-stage survival of fish species inhabiting seagrass nursery habitat. Although many of these species spawned during spring-summer, and produced larvae vulnerable to oil-polluted water, our (published) results have demonstrated that catch rates were high in 2010 after the spill relative to the previous four years. Notably, we also found that several exploited species were characterized by notably higher (i.e., over an order-of-magnitude change) juvenile catch rates during 2010 following large-scale fisheries closures in the northern Gulf. We conclude that immediate, catastrophic losses of 2010 cohorts were largely avoided, and that no shifts in species composition occurred following the spill. This information is critical for projecting the mode and tempo of ecological and economic recovery in the oil-affected GOM, as well as guiding future conservation/restoration activities to mitigate oil-spill injuries.
Information on collaborators / partners: a. Name of collaborating organization: NOAA/NMFS Pascagoula Labortatory b. Date collaborating established: Spr 2009 c. Does partner provide monetary support to project? Amount of support? No d. Does partner provide non-monetary (in-kind) support? Yes e. Short description of collaboration/partnership relationship. We will examine all data
generated throughout the life of the Southeast Monitoring and Assessment Program (SEAMAP) within Region 11, an area stretching E-W from Mobile Bay Inlet, AL, to the Mississippi River Outflow, LA, and N-S from nearshore environments out to the 50-m isobath. This will involve data synthesis and analysis in a collaboration between researchers at the Dauphin Island Sea Lab, UNC and co-PIs Pellegrin and Johnson at the NOAA Laboratory in Pascagoula, MS.
Information on any outreach activities: None
132
NGI Progress Report NOAA Award #: NA06OAR4320264
Reporting Period: Jul 1, 2010 - Jun 30, 2011
NGI File # 09-NGI-11 Project Title: Identifying linkages between zooplankton dynamics, fishery resources and climate
change in the Northern Gulf of Mexico
Project Lead (PI) name, affiliation, email address: Dr. Frank Hernandez, DISL, [email protected]; Dr. Malinda Sutor, LSU, [email protected]; Sara LeCroy, USM/GCRL, [email protected]
Co-PIs names, affiliation, email address: Harriet Perry, USM/GCRL/CFRD, [email protected]; Dr. William (Monty) Graham, DISL, [email protected]; Dr. Guillermo Sanchez, USM/GCRL/CFRD, [email protected]; Dr. Mark Benfield, LSU, [email protected]
NOAA sponsor and NOAA office of primary technical contact: Julian Lartigue, NOAA Office of Oceanic and Atmospheric Research
NOAA Goals: Ecosystems Mission Goal, Climate Mission Goal
Project objectives and goals
The primary goals are to: 1) combine regional zooplankton taxonomic expertise and methodologies to begin to identify the previously neglected invertebrate zooplankton taxa collected during SEAMAP Gulfwide surveys; 2) incorporate zooplankton abundance and distribution data into the recently revamped SEAMAP database; 3) identify relationships between larval fishes and their zooplankton prey and predators using data from historical SEAMAP samples and newly implemented collection methods; 4) examine variability and changes in the composition of both fish and invertebrate taxa over the SEAMAP time series as related to local, regional and global scale climatic events.
Specific objectives include:
1. Complete inventory of SEAMAP plankton samples recovered and lost due to Katrina at the SEAMAP Invertebrate Plankton Archiving Center (SIPAC).
2. Arrange shipment of select SEAMAP plankton samples back to the U.S. from the Sea Fisheries Institute, Gdynia, Poland, Plankton Sorting and Identification Center (ZSIOP). These samples will replace SIPAC holdings lost during Hurricane Katrina.
3. Assemble an electronic image database of archived SEAMAP plankton samples using Zooscan and begin analyses of zooplankton assemblages.
4. Assemble/summarize data on decapod crustacean larvae previously identified from SEAMAP samples at GCRL.
5. Verify and improve resolution (as feasible) of larval decapod crustacean identifications.
6. Direct additional zooplankton analysis of SEAMAP plankton samples at ZSIOP from select SEAMAP surveys to complete temporal and spatial survey coverage for decapod crustacean early life stages.
7. Incorporate invertebrate zooplankton data into the NMFS SEAMAP Oracle database and develop a GIS platform for the visualization and integration of data on the early life stages of both exploited and non-exploited fishes and invertebrates.
8. Assemble a reference series of invertebrate zooplankton specimens from SEAMAP samples for development of zooplankton ‘identification’ software and subsequent analysis of scanned images of SEAMAP plankton samples.
133
NGI Progress Report NOAA Award #: NA06OAR4320264
Reporting Period: Jul 1, 2010 - Jun 30, 2011
9. Undertake analyses of zooplankton and fish eggs in CUFES (continuous underway fish egg sampler) samples taken during recent SEAMAP plankton Gulfwide surveys; evaluate results of these collections.
10. Establish observational & sampling protocols for gelatinous zooplankton collection during SEAMAP surveys; implement these and evaluate results of data collected during surveys in 2009 – 2011.
11. Enhance student participation and involvement in SEAMAP resource surveys while augmenting graduate student training in the field of marine plankton.
12. Identify sources, assemble and summarize relevant environmental and climate data, and undertake analytical steps to identify linkages between abundance of target species of larval fish, zooplankton abundance and composition, and climatic and physical factors in the northern Gulf of Mexico.
Description of research conducted during the reporting period and milestones accomplished and/or completed
1. The post-Katrina inventory of the SIPAC unsorted plankton holdings was completed during Year 4 (4900 of 9010 pre-Katrina archived samples were recovered [54%]).
2. Additional SEAMAP plankton samples (n = 2200) were chosen for return by NMFS, packed for shipment in Poland and are en route to the U.S. (anticipated arrival mid July 2011). The samples in this second, NGI supported shipment will eventually be accessioned and held at SIPAC to replace samples destroyed by Hurricane Katrina. These samples will be stored at the NMFS warehouse at Stennis Space Center until additional space becomes available at SIPAC. A third shipment is being planned for this coming fall.
3. A web-based searchable database has been constructed and tested and will allow for easy upload of image data and searches of data based on time of collection, location of collection, and analysis status (archival image only, analyzed results, etc.). Over 200 images have been analyzed both manually and with semi-automated software to verify techniques and provide for quality control and assurance of the database. Scanning and analysis of samples is ongoing.
4. The post-Katrina inventory of the SIPAC identified invertebrate holdings was completed during this reporting period with 3954 of 7336 pre-Katrina archived samples recovered [54%]. An additional 193 samples were recovered that had not been recorded in pre-Katrina databases, bringing the total recovered to 4147 samples (Table 5). The majority of these samples (3106) were decapod crustaceans.
5. A total of 1404 sorted invertebrate zooplankton samples from the 2003 SEAMAP Fall Plankton Cruise were received from the NMFS Pascagoula lab. These included 387 larval portunid crab samples, 7 larval menippid crab samples, 285 larval penaeid shrimp samples and 130 larval sicyonid shrimp samples. The portunid crab larvae were selected as the first taxonomic group for further analysis because the diversity and distribution of these larvae forms the basis of graduate student Carley Knight’s masters research. Material from the 2003 fall cruise was chosen for two reasons: first, because of the extensive coverage of Gulf coastal and shelf waters represented by the stations sampled during that cruise and second, because it was conducted during one of two annual peak periods of portunid larval abundance in the northern Gulf.
134
NGI Progress Report NOAA Award #: NA06OAR4320264
Reporting Period: Jul 1, 2010 - Jun 30, 2011
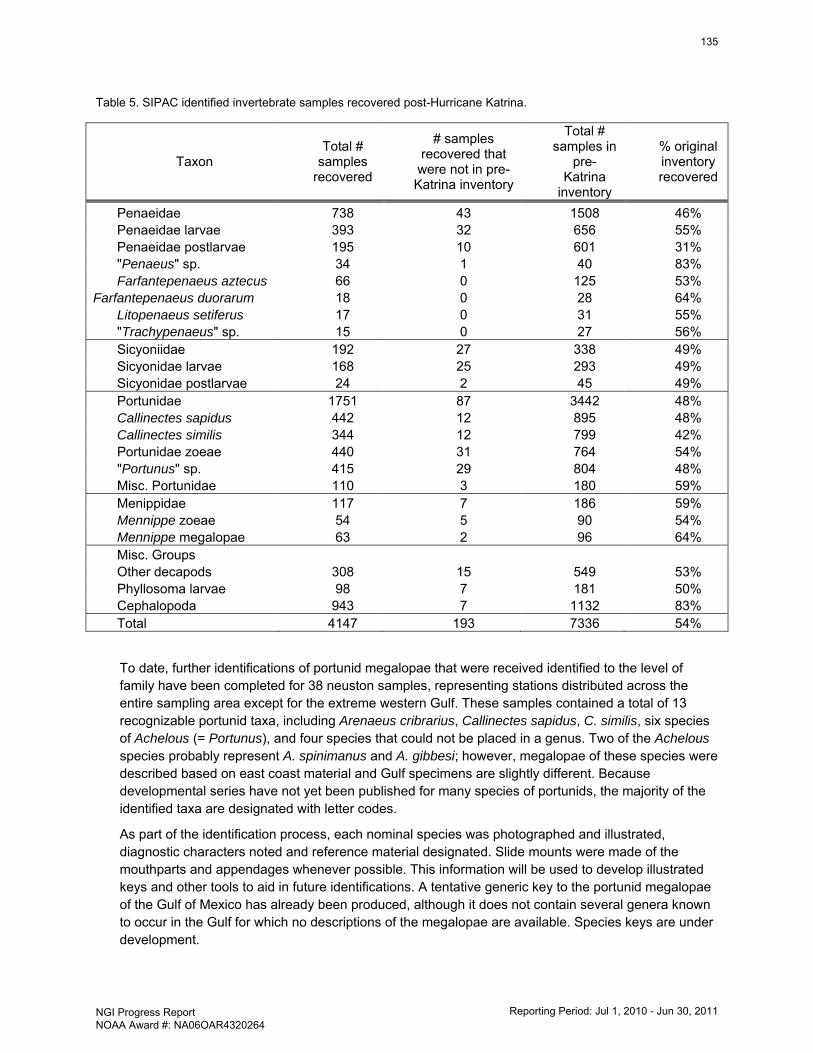
Table 5. SIPAC identified invertebrate samples recovered post-Hurricane Katrina.
Taxon Total #
samples recovered
# samples recovered that
were not in pre-Katrina inventory
Total # samples in
pre-Katrina
inventory
% original inventory recovered
Penaeidae 738 43 1508 46% Penaeidae larvae 393 32 656 55% Penaeidae postlarvae 195 10 601 31% "Penaeus" sp. 34 1 40 83% Farfantepenaeus aztecus 66 0 125 53%
Farfantepenaeus duorarum 18 0 28 64% Litopenaeus setiferus 17 0 31 55% "Trachypenaeus" sp. 15 0 27 56% Sicyoniidae 192 27 338 49% Sicyonidae larvae 168 25 293 49% Sicyonidae postlarvae 24 2 45 49% Portunidae 1751 87 3442 48% Callinectes sapidus 442 12 895 48% Callinectes similis 344 12 799 42% Portunidae zoeae 440 31 764 54% "Portunus" sp. 415 29 804 48% Misc. Portunidae 110 3 180 59% Menippidae 117 7 186 59% Mennippe zoeae 54 5 90 54% Mennippe megalopae 63 2 96 64% Misc. Groups Other decapods 308 15 549 53% Phyllosoma larvae 98 7 181 50% Cephalopoda 943 7 1132 83% Total 4147 193 7336 54%
To date, further identifications of portunid megalopae that were received identified to the level of family have been completed for 38 neuston samples, representing stations distributed across the entire sampling area except for the extreme western Gulf. These samples contained a total of 13 recognizable portunid taxa, including Arenaeus cribrarius, Callinectes sapidus, C. similis, six species of Achelous (= Portunus), and four species that could not be placed in a genus. Two of the Achelous species probably represent A. spinimanus and A. gibbesi; however, megalopae of these species were described based on east coast material and Gulf specimens are slightly different. Because developmental series have not yet been published for many species of portunids, the majority of the identified taxa are designated with letter codes.
As part of the identification process, each nominal species was photographed and illustrated, diagnostic characters noted and reference material designated. Slide mounts were made of the mouthparts and appendages whenever possible. This information will be used to develop illustrated keys and other tools to aid in future identifications. A tentative generic key to the portunid megalopae of the Gulf of Mexico has already been produced, although it does not contain several genera known to occur in the Gulf for which no descriptions of the megalopae are available. Species keys are under development.
135
NGI Progress Report NOAA Award #: NA06OAR4320264
Reporting Period: Jul 1, 2010 - Jun 30, 2011
The majority of the available specimens lack appendages, which is problematic, as published descriptions use the chelipeds and the 5th pereiopod in particular to aid in species identification. Thus, other morphological differences obtained from the literature and from observations of the material at hand must be used for distinguishing between the different portunid species in the SEAMAP samples. These include: overall size; the presence or absence of spines (dorsal, sternal, coxal, thoracic); antennal segment lengths and segmentation pattern; rostrum length, thickness and curvature; abdominal somite height (smooth vs humped); and telson shape. Additional characters will be added as they are recognized.
Identifications of the material from SEAMAP samples are verified by using previously identified voucher specimens and comparisons with the literature whenever possible. For those species which do not have published or accessible larval descriptions, we hope to use genetic data to attribute definitive identifications to the larvae. To that end, additional designated samples were collected and preserved in 95% ethanol during final leg of the 2011 Spring Plankton Cruise. Specimens from these samples, which generally have retained their appendages, will also be used for comparison with material from previous samples to confirm or improve identifications based on specimens without appendages.
6. Invertebrate zooplankton were removed and identified from 732, SEAMAP plankton samples taken during summer and fall shrimp/bottomfish surveys and late summer/early fall plankton surveys. Among the samples analyzed in Poland this year were 276 bongo and neuston samples taken in Aug and Sept, 2010.
7. Invertebrate zooplankton data generated during examination of SEAMAP samples at ZSIOP in Poland have been entered into an Access database using SEAMAP database formats, variable names etc. However, these data have not yet been incorporated into the NMFS SEAMAP Oracle database. Attainment of this objective was delayed because NMFS Mississippi Labs Oracle programmers were tasked last summer after the Deepwater Horizon oil spill event with developing and maintaining a seafood safety database in support of the monitoring of Gulf of Mexico seafood quality. Arc View GIS maps were generated from SEAMAP ichthyoplankton and zooplankton data immediately after the DWH event in order to visualize distributions of select taxa in relation to the presence and trajectory of DWH oil.
8. Plans are underway to conduct a meeting between personnel from NMFS, SIPAC and LSU in the fall of 2011 or winter of 2012. At that time a reference collection of identified decapod crustacean larvae will be transferred to the LSU zooplankton lab to be used in the development of zooplankton ‘identification’ software and subsequent analysis of scanned images of SEAMAP plankton samples.
9. Hierarchical cluster and correspondence analyses of 592 plankton samples taken with a Continuous Underway Fish Egg Sampler (CUFES) during the 2007 SEAMAP Fall plankton survey enabled the grouping of zooplankton taxa into three aggregates. These aggregates reflected similar trophic relationships and corresponded to the sub-units defined by other parameters. Analysis of CUFES samples from SEAMAP surveys in 2009 were begun late in this reporting period.
10. Gelatinous zooplankton sampling protocols were developed by DISL and NMFS scientists and implemented during the 2009 and 2010 field seasons on SEAMAP Plankton Surveys. Specimens collected in bongo, neuston, and MOCNESS samples were removed, identified, measured, weighed at sea and the data recorded on the following NMFS cruises: GU0901, 4 Feb –16 Mar; GU0902, 29 Mar –1 Jun; GU0904, 25 Aug –30 Sept; GU1001, 3 Apr –23 May; GU1004, 24 Aug –30 Sept.
136
NGI Progress Report NOAA Award #: NA06OAR4320264
Reporting Period: Jul 1, 2010 - Jun 30, 2011
11. Carley Knight, GCRL/USM graduate student, participated on Leg 3 of the SEAMAP Spring survey, cruise GU1101, May 1 – 10. She assisted in SEAMAP plankton sample and data collection and collected additional samples for her own research.
12. Atlantic and Pacific modes of variability such as Atlantic Multidecadal Oscillation (or AMO), North Atlantic Oscillation (or NAO), and El Nino Southern Oscillation (or ENSO) have been found to influence the climatology of the northern GOM during the winter months. The potential influence of these oceanic-atmospheric modes of variability on plankton dynamics in the northern Gulf of Mexico, i.e. within the SEAMAP plankton survey grid was examined. Net-caught zooplankton displacement volumes from the SEAMAP spring survey in offshore waters were compared for two years, 1982 and 1999, when winter weather and rainfall conditions preceding the April-May surveys were quite different.
Description of significant research results, protocols developed, and research transitions
Two important analyses were completed to provide vital quality control and assurance for the image analysis of the SEAMAP samples. First, the LSU lab participated in a comparative experiment organized by the SCOR 130 working group on plankton image analysis. A set of reference samples analyzed by a taxonomic expert were scanned and re-examined in three different labs by three different technicians to compare rates of error between operators and instruments. The final results are being verified, but initial results demonstrate that the results produced in each lab are very similar thus verifying that using our established techniques, there is a low rate of error between technicians who scan and analyze the image data.
The second experiment was performed exclusively in the LSU lab to determine best procedures for image analysis of SEAMAP samples. Three randomly selected samples were split to 1/4, 1/8, 1/16, and 1/32. Each of these individual splits was scanned with the Zooscan and analyzed using a manual image analysis software package called Digitizer. The splits that were sparse enough (1/32) to separate most individual plankton on the Zooscan were analyzed using the semi-automated software packages Zooprocess and Plankton Identifier. We are completing the verification of these results, but initial results show that a full digital archiving of the sample will be done by splitting to 1/4 and then the sample will be split to 1/32 and three of the 1/32 splits will be scanned and analyzed with the automated software. The initial results show that this provides robust estimates of abundant taxa and the 1/4 split scans can be analyzed manually for rare taxa. This technique will be used on the samples and modified as necessary to continue to achieve the goals of 1) expediting the analysis by using automated techniques and 2) providing a full-digital archival image of the sample and the ability to enumerate rare taxa that may not be encountered in a smaller split of the sample.
The 2003 SEAMAP fall plankton survey sampled the waters of the northern Gulf of Mexico from Texas to the Florida Keys, resulting in the collection of 146 neuston samples. These samples spanned inshore waters to the 200m isobath along the continental shelf, with sampling occurring from late August through September and throughout the 24 hr period. Of these neuston samples 133 contained portunid megalopae, with abundances ranging from 1 to nearly 6300 individuals per sample. Most of the higher density stations are located in the vicinity of riverine discharge or in the western Gulf. Thirteen portunid crab taxa were recognized in the 38 samples analyzed to date. Callinectes sapidus,C. similis, and Achelous spp. A and B were the most common taxa, occurring in nearly all of the samples analyzed. Arenaeus cribrarius was also common in samples from offshore Louisiana waters. Dominance of species in these samples appeared to shift slightly from Callinectes spp. and Achelous A and B on the shelf to other Achelous spp. and Portunidae spp. seaward of the coastal shelf break.
137
NGI Progress Report NOAA Award #: NA06OAR4320264
Reporting Period: Jul 1, 2010 - Jun 30, 2011
The Gulf of Mexico is functionally designated as a single Large Marine Ecosystem (LME) for the purposes of ecosystem-based management. However, the diversity of biogeographic regimes within the Gulf ranges both longitudinally and over coastal-neritic-oceanic transitions. Based on our re-analysis of the Fall 2007 zooplankton community structure (as revealed with CUFES samples), the northern Gulf of Mexico can be further divided into three LME sub-units corresponding to i) west Florida inner shelf, ii) northern River-dominated shelf, and iii) oligotrophic Gulf-wide. These sub-units can be further assessed by underlying drivers influencing productivity regimes across the northern Gulf namely salinity associated with river discharge, chlorophyll distribution and zooplankton biomass. We anticipate characterizing critical LME sub-units based on the differences we find as a means to better parameterize ecosystem models for management within the Gulf.
Gelatinous zooplankton (scyphomedusae, hydrozoans, and ctenophores) in the northern Gulf of Mexico are capable of forming large seasonal blooms, which have the potential to drastically affect coastal fisheries in a variety of ways: by directly preying on fish eggs and larvae; by competing with larval fish for invertebrate zooplankton prey; and by providing critical food and/or habitat for sea turtles and communal fish. The newly developed gelatinous zooplankton sampling protocols developed by DISL and NMFS scientists under this NGI project are now standard SEAMAP plankton survey methodology. These protocols are also being used on NRDA sponsored surveys to assess damage to Gulf planktonic biota caused by the DWH oil spill event. Incorporation of jellyfish data can now be incorporated into spatial and community analysis to determine which, if any, physical factors are driving jellyfish blooms and to assess their impact on ichthyoplankton and other zooplankton in a more quantitative way then was previously possible.
A seasonal association was found between worldwide oceanic-atmospheric modes of variability, meteorological and hydrological conditions and displacement volumes of zooplankton in the northern Gulf of Mexico. The combination of Atlantic Multidecadal Oscillation cold, North Atlantic Oscillation positive, and El Nino Southern Oscillation warm phases were associated with the stormy winter (January to March) weather (i.e. strong low pressure system, southern winds, and high moist air) of 1982, while the opposite phases of these modes of variability were related to the calm dry winter of 1999. The wet winter (high precipitation and surface runoff) of 1982 was further linked to high mean spring (April 24-May 26) displacement volumes of zooplankton, whereas the dry winter of 1999 was associated with low displacement volumes.
Information on collaborators / partners: Joanne Lyczkowski-Shultz, NOAA National Marine Fisheries Service, has contributed greatly to this project.
Information on any outreach activities: None
138
NGI Progress Report NOAA Award #: NA06OAR4320264
Reporting Period: Jul 1, 2010 - Jun 30, 2011
NGI File # 09-NGI-13 Project Title: Monitoring and Assessment of Coastal Ecosystems in the Northern Gulf
Project Lead (PI) name, affiliation, email address: Stephen Howden, University of Southern Mississippi, [email protected]
Co-PIs names, affiliation, email address: Chet F. Rakocinski, USM Dept. of Coastal Science, [email protected]
NOAA sponsor and NOAA office of primary technical contact: Julian Lartigue, NOAA Office of Oceanic and Atmospheric Research
NOAA Goal: Ecosystem Mission Goal
Project objectives and goals
Adverse effects of coastal eutrophication cause major ecosystem disruption. Ongoing anthropogenic impacts are exacerbating effects of eutrophication worldwide, including in the northern Gulf of Mexico and along the Mississippi coast. Resource managers need reliable indicators to contend with such growing pressures. Macrobenthic communities offer effective indicators of biotic integrity, but their use for distinguishing anthropogenic stress from natural stress is tricky because estuarine organisms are eurytolerant. Conventional benthic indices are based largely on taxonomic information and are not equally sensitive to all types of stressors, equally applicable across all habitats, or directly linked to ecosystem function. Effective coastal management calls for benthic indicators that respond to specific stressors, apply across different habitats, and reflect ecosystem function. Organic enrichment followed by hypoxia engenders depauperate macrofaunal communities consisting mostly of small short-lived opportunistic organisms. Thus, macrobenthic process indicators that integrate body-size descriptors should also reflect effects of eutrophication. The overarching purpose of the macrofaunal indicator component of the NOAA NGI Monitoring and Assessment for Ecosystem Management Program (MAEMP) is to elucidate how macrobenthic function may be impaired by hypoxia in the Mississippi Bight region.
Description of research conducted during the reporting period and milestones accomplished and/or completed
Nineteen benthic sampling events have been or will soon be completed since the initiation of the macrobenthic NGI project, including various sites and times in concert with the NOAA NGI Monitoring and Assessment for Ecosystem Management Project. (Table 6). Two NGI stations located on the Mississippi Bight at the 10 m (Station 6) and 20 m (Station 8) isobaths have become the primary focal sites for this project, as they have experienced intense sustained hypoxia in 2008 and further hypoxic stress in 2009.
Description of significant research results, protocols developed, and research transitions
Results – Site 6: May 2008 – June 2009
Problem: Coastal Mississippi experienced exceptionally widespread and sustained hypoxia throughout summer 2008, as documented by the NOAA NGI MAEMP. Site 6 located on the 10-m isobath in the center of the 2008 hypoxic zone served as a focal study area for examining effects of this event on the macrobenthic community. Five benthic sample events taken in 2008 and 2009 represented this site in late spring prior to the onset of hypoxia, in mid-summer during prolonged severe hypoxia, in autumn following a return to normoxia, and in the following spring and early summer of 2009.
139
NGI Progress Report NOAA Award #: NA06OAR4320264
Reporting Period: Jul 1, 2010 - Jun 30, 2011
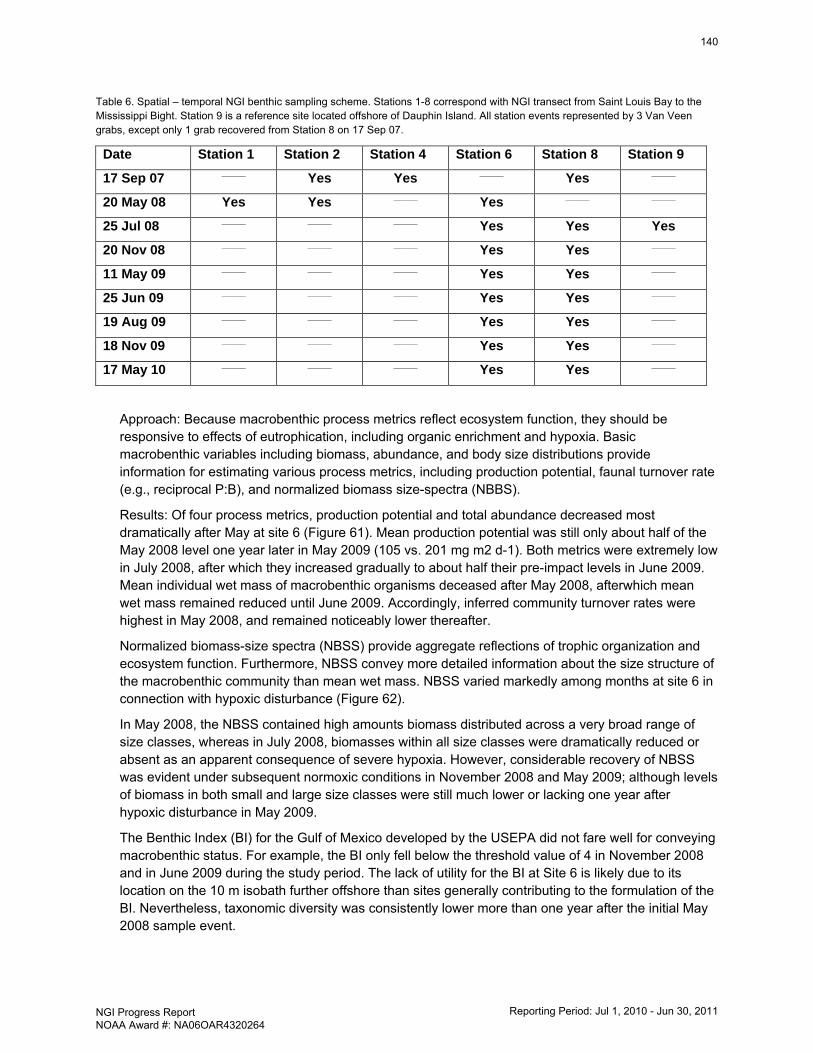
Table 6. Spatial – temporal NGI benthic sampling scheme. Stations 1-8 correspond with NGI transect from Saint Louis Bay to the Mississippi Bight. Station 9 is a reference site located offshore of Dauphin Island. All station events represented by 3 Van Veen grabs, except only 1 grab recovered from Station 8 on 17 Sep 07.
Date Station 1 Station 2 Station 4 Station 6 Station 8 Station 9
17 Sep 07 _____ Yes Yes _____ Yes _____
20 May 08 Yes Yes _____ Yes _____ _____
25 Jul 08 _____ _____ _____ Yes Yes Yes
20 Nov 08 _____ _____ _____ Yes Yes _____
11 May 09 _____ _____ _____ Yes Yes _____
25 Jun 09 _____ _____ _____ Yes Yes _____
19 Aug 09 _____ _____ _____ Yes Yes _____
18 Nov 09 _____ _____ _____ Yes Yes _____
17 May 10 _____ _____ _____ Yes Yes _____
Approach: Because macrobenthic process metrics reflect ecosystem function, they should be responsive to effects of eutrophication, including organic enrichment and hypoxia. Basic macrobenthic variables including biomass, abundance, and body size distributions provide information for estimating various process metrics, including production potential, faunal turnover rate (e.g., reciprocal P:B), and normalized biomass size-spectra (NBBS).
Results: Of four process metrics, production potential and total abundance decreased most dramatically after May at site 6 (Figure 61). Mean production potential was still only about half of the May 2008 level one year later in May 2009 (105 vs. 201 mg m2 d-1). Both metrics were extremely low in July 2008, after which they increased gradually to about half their pre-impact levels in June 2009. Mean individual wet mass of macrobenthic organisms deceased after May 2008, afterwhich mean wet mass remained reduced until June 2009. Accordingly, inferred community turnover rates were highest in May 2008, and remained noticeably lower thereafter.
Normalized biomass-size spectra (NBSS) provide aggregate reflections of trophic organization and ecosystem function. Furthermore, NBSS convey more detailed information about the size structure of the macrobenthic community than mean wet mass. NBSS varied markedly among months at site 6 in connection with hypoxic disturbance (Figure 62).
In May 2008, the NBSS contained high amounts biomass distributed across a very broad range of size classes, whereas in July 2008, biomasses within all size classes were dramatically reduced or absent as an apparent consequence of severe hypoxia. However, considerable recovery of NBSS was evident under subsequent normoxic conditions in November 2008 and May 2009; although levels of biomass in both small and large size classes were still much lower or lacking one year after hypoxic disturbance in May 2009.
The Benthic Index (BI) for the Gulf of Mexico developed by the USEPA did not fare well for conveying macrobenthic status. For example, the BI only fell below the threshold value of 4 in November 2008 and in June 2009 during the study period. The lack of utility for the BI at Site 6 is likely due to its location on the 10 m isobath further offshore than sites generally contributing to the formulation of the BI. Nevertheless, taxonomic diversity was consistently lower more than one year after the initial May 2008 sample event.
140
NGI Progress Report NOAA Award #: NA06OAR4320264
Reporting Period: Jul 1, 2010 - Jun 30, 2011
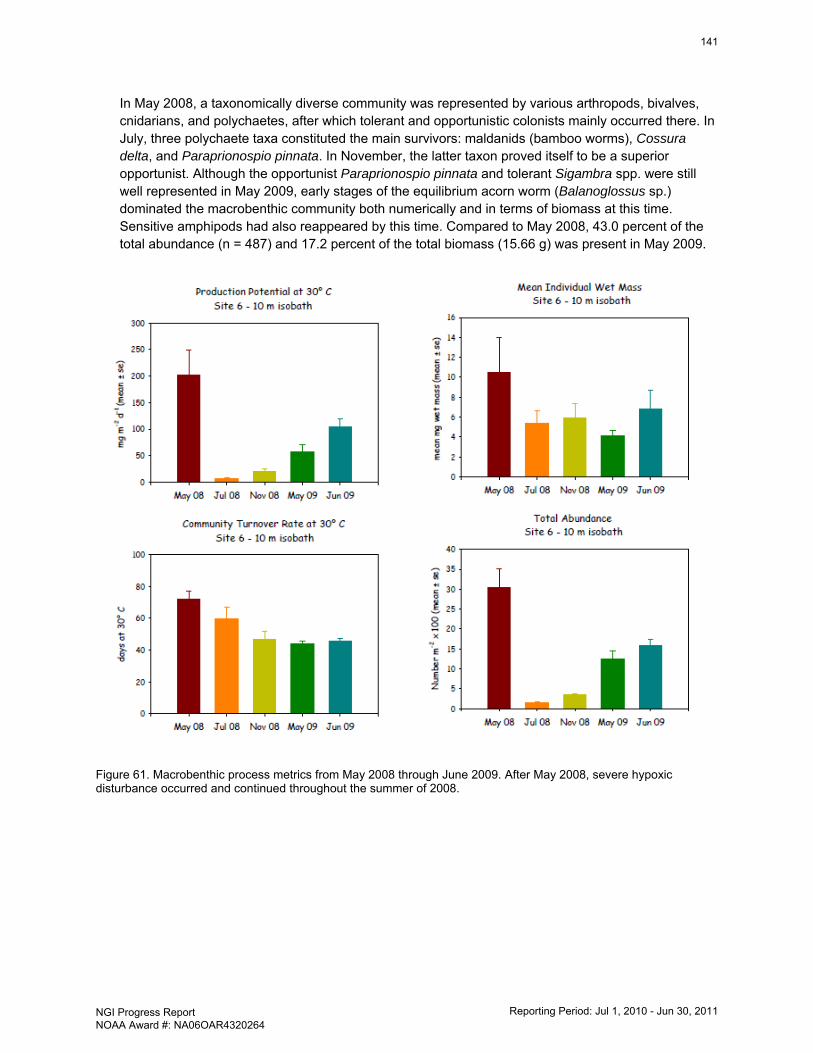
In May 2008, a taxonomically diverse community was represented by various arthropods, bivalves, cnidarians, and polychaetes, after which tolerant and opportunistic colonists mainly occurred there. In July, three polychaete taxa constituted the main survivors: maldanids (bamboo worms), Cossura delta, and Paraprionospio pinnata. In November, the latter taxon proved itself to be a superior opportunist. Although the opportunist Paraprionospio pinnata and tolerant Sigambra spp. were still well represented in May 2009, early stages of the equilibrium acorn worm (Balanoglossus sp.) dominated the macrobenthic community both numerically and in terms of biomass at this time. Sensitive amphipods had also reappeared by this time. Compared to May 2008, 43.0 percent of the total abundance (n = 487) and 17.2 percent of the total biomass (15.66 g) was present in May 2009.
Figure 61. Macrobenthic process metrics from May 2008 through June 2009. After May 2008, severe hypoxic disturbance occurred and continued throughout the summer of 2008.
141
NGI Progress Report NOAA Award #: NA06OAR4320264
Reporting Period: Jul 1, 2010 - Jun 30, 2011
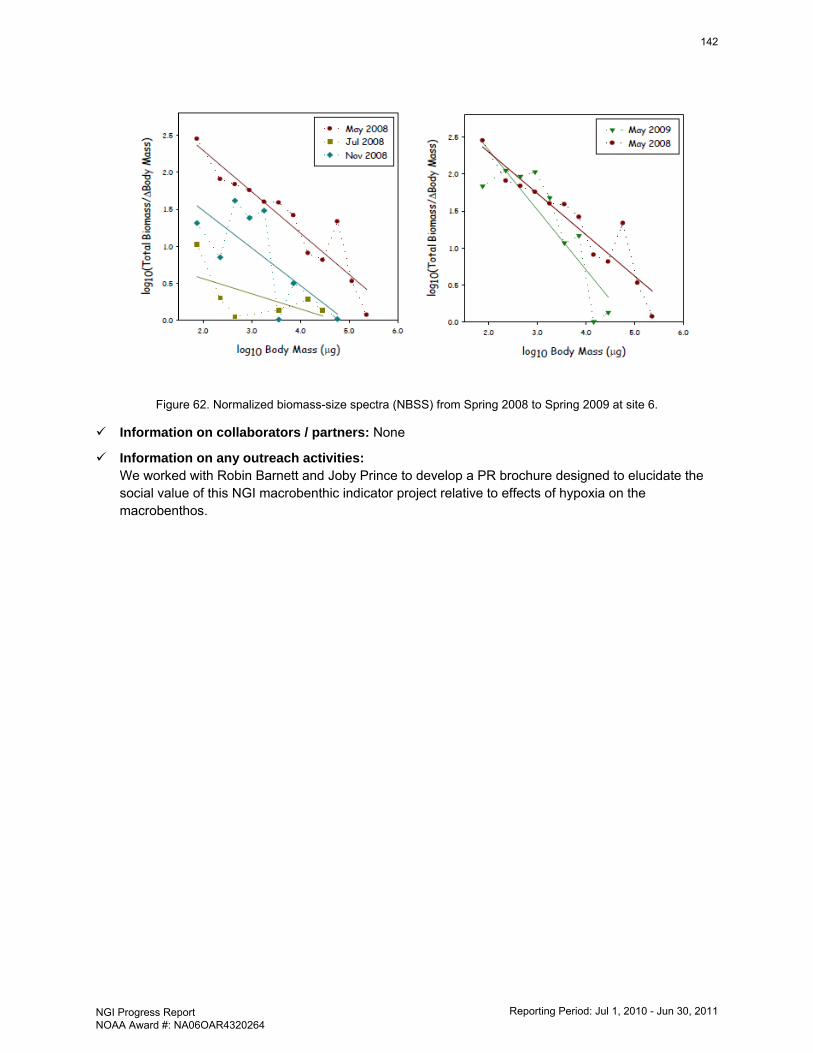
Figure 62. Normalized biomass-size spectra (NBSS) from Spring 2008 to Spring 2009 at site 6.
Information on collaborators / partners: None
Information on any outreach activities: We worked with Robin Barnett and Joby Prince to develop a PR brochure designed to elucidate the social value of this NGI macrobenthic indicator project relative to effects of hypoxia on the macrobenthos.
142
NGI Progress Report NOAA Award #: NA06OAR4320264
Reporting Period: Jul 1, 2010 - Jun 30, 2011
NGI File # 09-NGI-14 Project Title: Assessment of ecosystem services of selected coastal habitat types: Towards a model-
based management toolset
Project Lead (PI) name, affiliation, email address: Richard Fulford, Department of Coastal Sciences, University of Southern Mississippi, [email protected]
Co-PIs names, affiliation, email address: Mark Peterson, Department of Coastal Sciences, University of Southern Mississippi, [email protected]; Harriet Perry, Gulf Coast Research Lab, University of Southern Mississippi, [email protected]
NOAA sponsor and NOAA office of primary technical contact: Julian Lartigue, NOAA Office of Oceanic and Atmospheric Research
NOAA Goal: Ecosystem Mission Goal
Project objectives and goals
Emphasis area 1
a. Collect new data on fish distribution, biomass, and energy content in the Pascagoula River (PR) that is coordinated with similar data collection in Apalachicola Bay (AB, collaborative proposal K. Craig FSU) needed to validate the behavior component of the habitat-production model.
b. Collect new data on habitat quality in PR that is coordinated with similar data collection in AB to provide a regional validation data set for the habitat production model.
c. Use data from (1) and (2) to develop the habitat-production model to quantitatively link loss of salt marsh habitat to fish production and compare results between estuaries.
d. Use data on loss of salt marsh due to sea level rise from SLAMM modeling to examine impacts of sea level rise on fish production (collaborative proposal R. Allee, NOAA)
Emphasis area 2
e. Collect species composition and biomass data on restored oyster reef and use trophic model to compare 20 production of natural and restored oyster reefs in western Mississippi Sound (WMS, partnership with The Nature Conservancy)
Description of research conducted during the reporting period and milestones accomplished and/or completed
In this reporting period we have completed a series of lab experiments intended to improve model parameters describing fish movement. These were observational trials with wild-caught juvenile spot, Leiostomus xanthurus in a custom designed observational arena located in the Marine Environmental Research Laboratory located at GCRL. Two sets of trials were conducted: one with sandy beach habitat and a second with marsh edge habitat. Fish movement rate and direction were recorded in six 12-hr blocks during the day, and the data will be used to improve model parameters describing these two attributes. Data analysis is ongoing and we expect to submit a manuscript on the work by year’s end.
During this reporting period we also collected fish samples over our study oyster reefs in western Mississippi Sound for diet analysis. Four sample trips were conducted over two reef sites that targeted crepuscular periods to maximize the likelihood of captured fish having food in their stomachs. Over 100 fish from five species were retained for analysis. Examination of these fish is ongoing.
143
NGI Progress Report NOAA Award #: NA06OAR4320264
Reporting Period: Jul 1, 2010 - Jun 30, 2011
During this reporting period we also conducted our last settlement tray collection of oyster reef biota. Twelve trays were deployed in sets of three on two reef sites (n=6 per site) during July and were left in place for six weeks. After this settlement period the trays were retrieved and analysis of the resulting biotic samples is nearly complete. Analysis includes size and species composition of both fish and invertebrates found in each tray and rare specimens are being made available to the GCRL museum for their archival collections. The biomass and compositional data will be used to improve local parameterization of the oyster reef food web model under emphasis area 2.
In this reporting period we also have completed the validation of the habitat production model under emphasis area 1 and this has resulted in several presentations as at scientific meetings and submission of a peer-reviewed publication. We are now working to generate projections of effect for sea level rise under objective 1d. We have also completed data analysis for the food web model under Emphasis area 2 and are now working on model parameterization and validation.
Description of significant research results, protocols developed, and research transitions
Two simulation models have been developed. One has been validated and the second is in the parameterization stages for oyster reefs in western MS Sound. We have also transcended the current project as the food web model under emphasis area 2 is being used a template for ecological modeling work being conducted in association with the DwH oil spill.
Information on collaborators / partners: a. Name of collaborating organization: NOAA Gulf Coast Services Center b. Date collaborating established: Feb 2008 c. Does partner provide monetary support to project? Amount of support? No d. Does partner provide non-monetary (in-kind) support? Yes e. Short description of collaboration/partnership relationship. We are working with Dr.
Rebecca Allee to convert our model simulation results into habitat-specific visualization tools in line with current work at GCSS.
Information on any outreach activities: None
144
NGI Progress Report NOAA Award #: NA06OAR4320264
Reporting Period: Jul 1, 2010 - Jun 30, 2011
NGI File # 09-NGI-15 Project Title: Data Management in Support of NOAA's Integrated Ecosystem Assessment through
the NGI Ecosystem Data Assembly Center
Project Lead (PI) name, affiliation, email address: Just Cebrian, DISL/University of South Alabama, [email protected]
Co-PIs names, affiliation, email address: Susan Welsh, LSU, [email protected]; Tom Strange, Mississippi DMR, [email protected]
NOAA sponsor and NOAA office of primary technical contact: Julian Lartigue, NOAA Office of Oceanic and Atmospheric Research
NOAA Goals: Ecosystem Mission Goal, Technology and Mission Support Goal
Project objectives and goals
NOAA is developing and expanding the concept and techniques of Regional Ecosystem Data Management (REDM) to support ecosystem observations and ecosystem-based approaches to management. One of the principal NOAA programmatic efforts supported by REDM is Integrated Ecosystem Assessments (IEA). Under the umbrella of NGI, the EDAC serves as a developmental focal point for data management activities for both NOAA and NGI member institution projects related to ecosystem and marine habitat. One major goal is to develop NGI member institution internal data management systems that link to the existing data management program within the EDAC. A wealth of ecosystem datasets is held within the various labs and offices of individual faculty members within an academic marine laboratory or institution. These datasets are invaluable to both assess past and current states of Gulf of Mexico ecosystems. As these datasets are often not contained in a central database, they can be difficult to locate and are not readily accessible or searchable. Many potential end users may even be unaware that these datasets exist. Furthermore, faculty and laboratory personnel are often reticent to dedicate already tight time and financial resources to archiving past or current datasets. Proprietary tendencies related to publication often discourage data sharing. This problem is compounded when a faculty member moves to another facility. Data are valuable only if data and its metadata are readily available. Hence, making these datasets readily available and accessible and overcoming hurdles to faculty participation will facilitate scientific studies, public education, and outreach. The resulting data management systems will enhance the Regional Ecosystem Data Management effort and expand the capability of EDAC to gather ecosystem data. A second major goal is the improvement of EDAC data discovery, development of required data transformations and the direct integration into IEA models and tools in order to drive technological development activities closely aligned with NOAA Gulf of Mexico efforts and GOMA.
Description of research conducted during the reporting period and milestones accomplished and/or completed
Additional data was collected for research programs relevant to the expansion of the EDAC holdings. From June 2010 to June 2011, DISL made 17 sampling trips, related to the long term monitoring project in Perdido Bay. During these trips, we took 96 water samples for chlorophyll and nutrients (both particulate and dissolved), 160 core samples for benthic chlorophyll, 160 core samples for benthic invertebrates, seagrass and detrital matter, and 64 tissue samples for C/N analysis. We measured several physical parameters, including temperature, salinity, DO and light attenuation in the water column. In addition, we performed field 540 incubations for oxygen evolution in light/dark benthic chambers to determine benthic metabolism in the bare sediment and seagrass beds in each of the lagoons. Finally, we analyzed aerial photographs from 2004 to 2010 and documented the
145
NGI Progress Report NOAA Award #: NA06OAR4320264
Reporting Period: Jul 1, 2010 - Jun 30, 2011
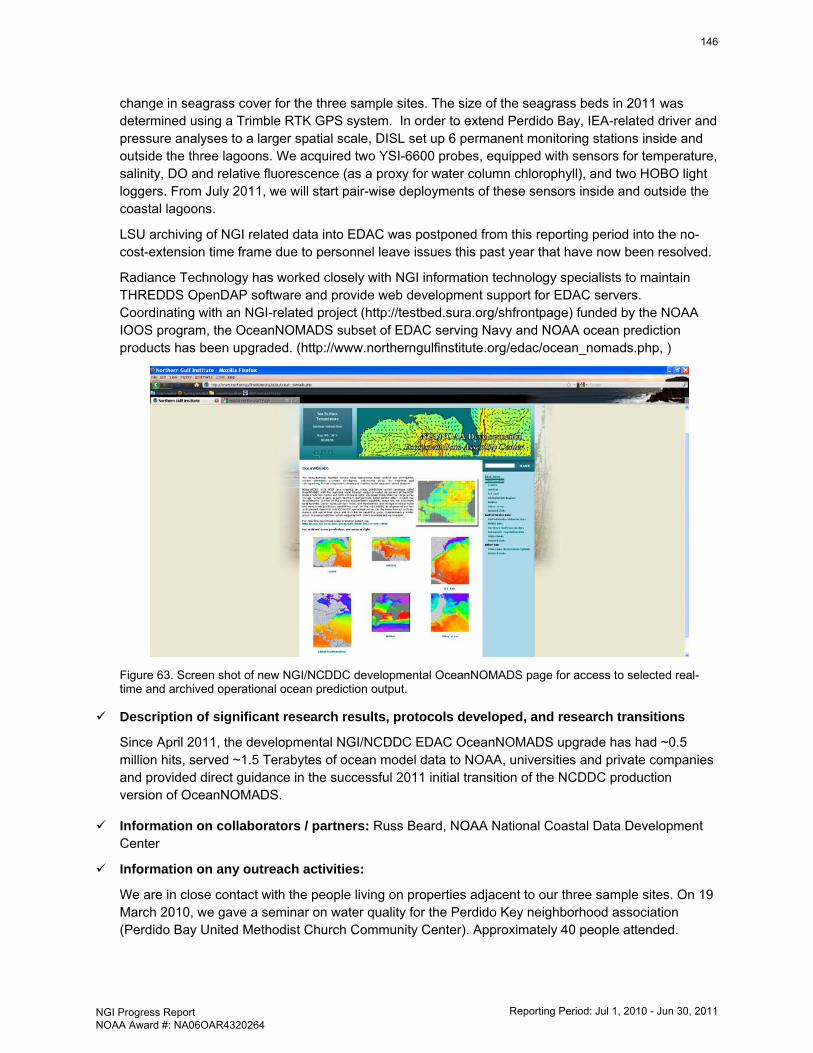
change in seagrass cover for the three sample sites. The size of the seagrass beds in 2011 was determined using a Trimble RTK GPS system. In order to extend Perdido Bay, IEA-related driver and pressure analyses to a larger spatial scale, DISL set up 6 permanent monitoring stations inside and outside the three lagoons. We acquired two YSI-6600 probes, equipped with sensors for temperature, salinity, DO and relative fluorescence (as a proxy for water column chlorophyll), and two HOBO light loggers. From July 2011, we will start pair-wise deployments of these sensors inside and outside the coastal lagoons.
LSU archiving of NGI related data into EDAC was postponed from this reporting period into the no-cost-extension time frame due to personnel leave issues this past year that have now been resolved.
Radiance Technology has worked closely with NGI information technology specialists to maintain THREDDS OpenDAP software and provide web development support for EDAC servers. Coordinating with an NGI-related project (http://testbed.sura.org/shfrontpage) funded by the NOAA IOOS program, the OceanNOMADS subset of EDAC serving Navy and NOAA ocean prediction products has been upgraded. (http://www.northerngulfinstitute.org/edac/ocean_nomads.php, )
Figure 63. Screen shot of new NGI/NCDDC developmental OceanNOMADS page for access to selected real-time and archived operational ocean prediction output.
Description of significant research results, protocols developed, and research transitions
Since April 2011, the developmental NGI/NCDDC EDAC OceanNOMADS upgrade has had ~0.5 million hits, served ~1.5 Terabytes of ocean model data to NOAA, universities and private companies and provided direct guidance in the successful 2011 initial transition of the NCDDC production version of OceanNOMADS.
Information on collaborators / partners: Russ Beard, NOAA National Coastal Data Development Center
Information on any outreach activities:
We are in close contact with the people living on properties adjacent to our three sample sites. On 19 March 2010, we gave a seminar on water quality for the Perdido Key neighborhood association (Perdido Bay United Methodist Church Community Center). Approximately 40 people attended.
146
NGI Progress Report NOAA Award #: NA06OAR4320264
Reporting Period: Jul 1, 2010 - Jun 30, 2011
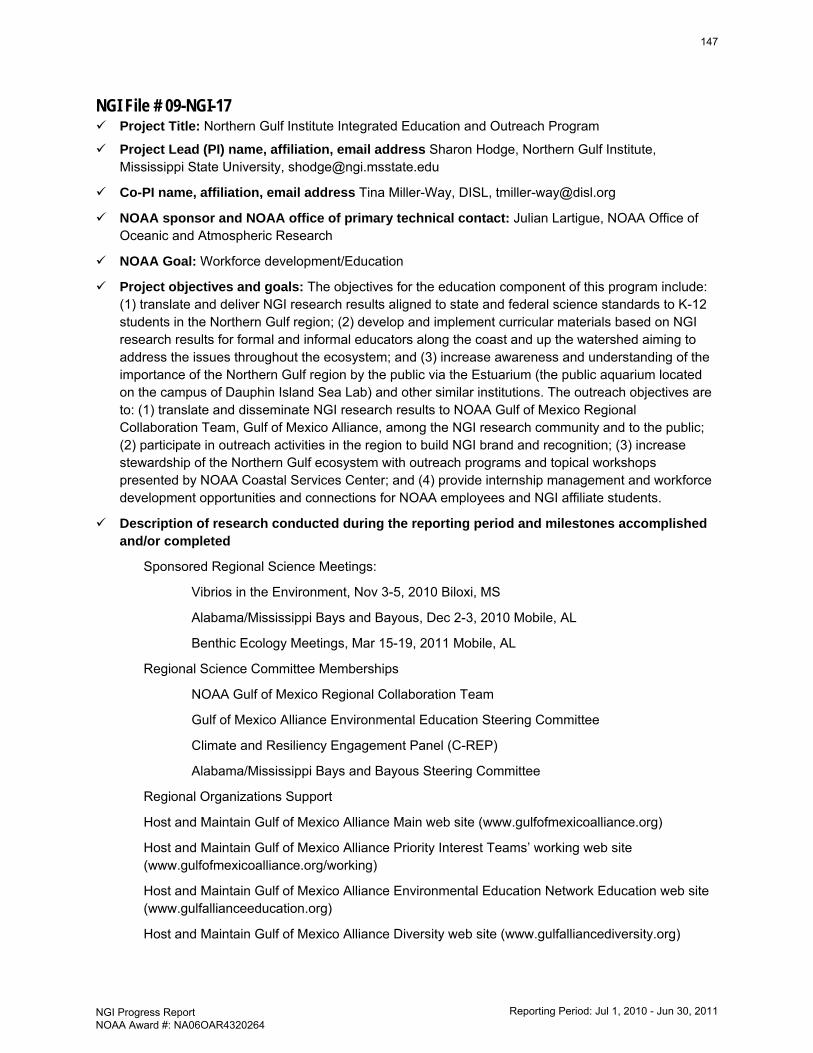
NGI File # 09-NGI-17 Project Title: Northern Gulf Institute Integrated Education and Outreach Program
Project Lead (PI) name, affiliation, email address Sharon Hodge, Northern Gulf Institute, Mississippi State University, [email protected]
Co-PI name, affiliation, email address Tina Miller-Way, DISL, [email protected]
NOAA sponsor and NOAA office of primary technical contact: Julian Lartigue, NOAA Office of Oceanic and Atmospheric Research
NOAA Goal: Workforce development/Education
Project objectives and goals: The objectives for the education component of this program include: (1) translate and deliver NGI research results aligned to state and federal science standards to K-12 students in the Northern Gulf region; (2) develop and implement curricular materials based on NGI research results for formal and informal educators along the coast and up the watershed aiming to address the issues throughout the ecosystem; and (3) increase awareness and understanding of the importance of the Northern Gulf region by the public via the Estuarium (the public aquarium located on the campus of Dauphin Island Sea Lab) and other similar institutions. The outreach objectives are to: (1) translate and disseminate NGI research results to NOAA Gulf of Mexico Regional Collaboration Team, Gulf of Mexico Alliance, among the NGI research community and to the public; (2) participate in outreach activities in the region to build NGI brand and recognition; (3) increase stewardship of the Northern Gulf ecosystem with outreach programs and topical workshops presented by NOAA Coastal Services Center; and (4) provide internship management and workforce development opportunities and connections for NOAA employees and NGI affiliate students.
Description of research conducted during the reporting period and milestones accomplished and/or completed
Sponsored Regional Science Meetings:
Vibrios in the Environment, Nov 3-5, 2010 Biloxi, MS
Alabama/Mississippi Bays and Bayous, Dec 2-3, 2010 Mobile, AL
Benthic Ecology Meetings, Mar 15-19, 2011 Mobile, AL
Regional Science Committee Memberships
NOAA Gulf of Mexico Regional Collaboration Team
Gulf of Mexico Alliance Environmental Education Steering Committee
Climate and Resiliency Engagement Panel (C-REP)
Alabama/Mississippi Bays and Bayous Steering Committee
Regional Organizations Support
Host and Maintain Gulf of Mexico Alliance Main web site (www.gulfofmexicoalliance.org)
Host and Maintain Gulf of Mexico Alliance Priority Interest Teams’ working web site (www.gulfofmexicoalliance.org/working)
Host and Maintain Gulf of Mexico Alliance Environmental Education Network Education web site (www.gulfallianceeducation.org)
Host and Maintain Gulf of Mexico Alliance Diversity web site (www.gulfalliancediversity.org)
147
NGI Progress Report NOAA Award #: NA06OAR4320264
Reporting Period: Jul 1, 2010 - Jun 30, 2011
NGI Projects updated on web page (covering new projects and MODS)
NGI Listserv Postings: 26
NGI Web News Stories: 51
NGI Brochure – NGI Research of DwH, One Year In
NGI Portals – Summer 2010, Winter 2010, Summer 2011
NGI Web Page redesign
NGI Strategic Plan Development with audience identification
Description of significant research results, protocols developed, and research transitions
• NGI at DISL has hosted 38 Boardwalk Talks, a series of informal conversations with research scientists about their work since July 1, 2010. These talks have reached approximately 1000 individuals.
• NGI at DISL has developed and implemented a service project for K-12 students visiting DISL based on a DISL NGI research project. Visiting middle school students created a small oyster reef in the waters off of BayFront park in south Mobile County.
• NGI at DISL has conducted 15 Summer Excursions which are field trips to marine habitats on Dauphin Island for the public. Approximately 250 individuals have participated in this program since July 2010.
• NGI at DISL has implemented ‘The NGI Activity Cart’ for informal interactions with Estuarium visitors. The cart includes materials and directions for short interactive lessons about NGI topics. Seven short interactives have been developed to date.
• NGI at DISL has visited Project WetKids programs at 2 middle schools in Pascagoula. Additionally, we have hosted these programs for a day at DISL.
• NGI at DISL continues to offer watershed curricula through DISL’s traveling marine science classroom, the BayMobile as well as to groups visiting DISL. As part of this project, we are testing the educational efficacy of ‘A Redfish Tale’, a video aimed at the middle school audience for teaching water quality and eutrophication issues.
• NGI at DISL continues to offer administrative support of internship activities to enhance NOAA workforce development through the NGI Diversity Internship program.
• Visitor numbers at the Estuarium were impacted by the Deepwater Horizon event; numbers for the last 6 months of 2010 were 18,985 compared to approximately 28,000 for the same time period in the previous 3 years. For this reporting period, July 1, 2010 to May 31, 2011 (June data are not yet available), visitorship totaled 48,631.
• NGI at DISL participated in several professional symposia and conferences, included Bays and Bayous (2), Benthic Ecology meeting (1) and the NGI Annual meeting (4) in May 2011.
• NGI at DISL participated in many regional outreach events including My Two Boots in Pascagoula, MS; Open House at the Roy Hyatt Environmental Center in Pensacola, FL; Ocean Commotion at Louisiana State University; ShrimpFest in Gulf Shores, AL; Open House at the Environmental Studies Center, Mobile, AL; Celebrate the Gulf in Pass Christian, MS; Earth Day in Fairhope, AL and Discovery Day at DISL.
• NGI at DISL is developing a K-12 curriculum on technologies used in marine science. The hands-on activity for students is the construction of a remotely operated vehicle (ROV). We are
148
NGI Progress Report NOAA Award #: NA06OAR4320264
Reporting Period: Jul 1, 2010 - Jun 30, 2011
testing this curriculum with several of our students camps and classes this summer and anticipate implementing it fully in Fall of 2011.
• NGI at DISL continues to incorporate NGI research results into existing K-12 coastal science curricula at DHP.
• NGI at DISL continues to bring the NGI name to other education and outreach grants at DISL including NOAA’s Office of Education support for 2 single day teacher workshops on Oil and Oil Spills and through NOAA’s support of DISL B-WET’s program.
• NGI at USM conducts outreach in the form of workshop participation by its students and faculty. The Department of Marine Science, which is the affiliated Department of NGI, also publishes a newsletter which to an extent provides outreach.
• NGI participated in the Stennis Open House, where relevant research was showcased for the general public.
Information on collaborators / partners: None
Information on any outreach activities: • Type: Professional Development Workshop • Name of event: NGI Regional Issues in the Gulf • Date: July 6-10, 2010 • Location: DISL • Description: Topics addressed through delivery of content and associated hands-on
activities included the Gulf of Mexico, watersheds, water quality, estuarine ecology, sampling methods, hypoxia, harmful algal blooms, hurricanes and the oil industry and oil spills (and the Northern Gulf Institute). Educators were provided with supplies and a resource notebook with CD. Pre and post-testing indicated significant gains in content knowledge and all of the participants reported the overall workshop as very valuable or valuable.
• Approximate Number of Participants: 15
• Type: Conference Booth • Name of event – Mississippi Water Resources Conference • Date – Nov. 3-5, 2010 • Location – Bay St. Louis, MS • Description - Mississippi is fortunate to have plentiful supplies of clean water. However,
issues facing future water supplies in the state and the region seem likely. With water wars between Alabama, Georgia and Florida and the U.S. Supreme Court contemplating the South Carolina-North Carolina water issue, Mississippi must be proactive in managing water resources in the State. The Mississippi Water Resources Conference provides a forum for the water resources community to discuss the complex water issues which face our state, region, and nation. Scheduled for November 3-5 in Bay St. Louis, this year’s conference promises to be an exciting event with a combined meeting of the Mississippi Water Resources Conference and the Mississippi Water Resources Association. This will be the water conference you will not want to miss, with exciting presentations and keynote speakers. http://www.wrri.msstate.edu/conference/index.asp
• Approximate Number of Participants – 70
149
NGI Progress Report NOAA Award #: NA06OAR4320264
Reporting Period: Jul 1, 2010 - Jun 30, 2011
• Type: Conference Booth • Name of event – Vibrios in the Environment • Date – Nov. 7-12, 2010 • Location – Biloxi, MS • Description - In 1980, the first conference to convene leading Vibrio researchers met in
Louisiana for the “Vibrios in the Environment” conference. In the following 30 years, Vibrio research increased exponentially, bringing these organisms into the forefront of basic scientific discovery and the global public health debate. Vibrios in the Environment 2010 Conference will focus on current research on Vibrio ecology and pathogenesis of humans and marine animals. The conference will also focus on the socioeconomics and public health impacts of Vibrio spp., as well as on current efforts to increase public safety through the development of improved risk assessment tools, early warning systems, improved hygiene, and post harvest treatments of shellfish. http://www.joss.ucar.edu/vibrios_2010/ index.html
• Approximate Number of Participants – 286 participants in attendance from 28 countries • Type: Conference Booth • Name of event – Alabama / Mississippi Bays and Bayous • Date – Dec. 1-2, 2010 • Location – Mobile, AL • Description The symposium, hosted by the Mobile Bay National Estuary Program and
Mississippi-Alabama Sea Grant Consortium, will provide a forum for discussion and exchange of information and experiences regarding the status of our understanding about the northern Gulf coastal ecosystem and processes that alter it; what industry is doing to sustain our coastal resources; and how citizen groups are participating in sustaining our coastal resources. Sessions at the symposium will focus on water quality, living resources, habitat management and sustainable communities.
• Approximate Number of Participants – 425+/- • Type: Graduate Student Travel Support • Name of event – Alabama / Mississippi Bays and Bayous • Date – Dec. 1-2, 2010 • Location – Mobile, AL • Description Funding travel and registration for NGI graduate students presenting at the
Bays and Bayous Conference • Approximate Number of Participants – 21 students
• Type: Conference • Name of event – NGI 2011 Annual Conference • Date – May 17-19, 2011 • Location – Mobile, AL • Description The Northern Gulf Institute hosted over 200 regional scientists, researchers,
and students at their 5th annual conference in Mobile. This year's conference highlighted the work of multi-university and multi-institutional teams under the theme of an Earth systems approach to northern Gulf science and management. The conference agenda included fifty-eight technical presentations and two interactive sessions with sixty-five
150
NGI Progress Report NOAA Award #: NA06OAR4320264
Reporting Period: Jul 1, 2010 - Jun 30, 2011
poster displays featuring current Gulf of Mexico research. Participants in the annual photography and student poster contests demonstrated exceptional artistic, technical, and scientific efforts. http://www.northerngulfinstitute.org/2011ngiconference/
• Approximate Number of Participants – 215+/-
• Type: Conference Booth • Name of event – Benthic Ecology Meeting • Date – Mar. 15-19, 2010 • Location – Mobile, AL • Description The Dauphin Island Sea Lab (DISL) and the University of South Alabama
(USA) are pleased to host the 40th annual meeting in Mobile, Alabama. This is the fourth time DISL and USA have hosted the Benthic Ecology Meeting, reflecting the importance of marine benthic ecology to both institutions and the contributions made by current and past faculty members to the discipline. We are excited that over 500 of our colleagues and their students will attend this year’s conference and present some 260 scientific talks and 115 posters.
• Approximate Number of Participants – 500+/-
Additional outreach activities are covered above.
151
NGI Progress Report NOAA Award #: NA06OAR4320264
Reporting Period: Jul 1, 2010 - Jun 30, 2011
NGI File # 09-NGI-18 Project Title: Forecasting Episodic Changes in Hurricane Intensity and Structure over the Gulf of
Mexico
Project Lead (PI) name, affiliation, email address: Christopher M. Hill, Mississippi State University, [email protected]
NOAA sponsor and NOAA office of primary technical contact: Julian Lartigue, NOAA Office of Oceanic and Atmospheric Research
NOAA Goal: Weather and Water Mission Goal
Project objectives and goals
The primary goal of this project was to provide greater insight into forecasting time-sensitive trends of rapid formation, changing intensity, and changing wind field area (or size) of hurricanes over the Gulf Mexico in the interest of reducing the uncertainty in the risk posed to Gulf Coast residents and infrastructure. The focus was to identify key features or processes present in the ambient atmosphere and in the Gulf of Mexico that led to critical episodic changes in the intensity and structure of recent hurricanes: Humberto, Gustav, and Ike.
The intent of the project was to provide insight into the following questions: 1) What are the key processes and features of the atmosphere leading to the episodic changes of intensity and size in each hurricane? 2) What are the respective contributions of the Gulf of Mexico waters and the adjacent land masses to the atmospheric processes and features leading to episodic changes in hurricane intensity and size? 3) Which observing platforms best depict, as well as best contribute to preparing the simulation of, the conditions leading to episodic changes in hurricane intensity and size? 4) Would the threat of rapid hurricane formation to citizens and infrastructure be best emphasized through the pre-emptive issuance of a watch, warning, or other public advisory (i.e. “warn on forecast” as opposed to “warn on detection”)?
It was further intended that a small research group effort to analyze and model individual hurricanes, utilizing an available array of traditional and modern observations, may yield insight into causes of the episodic changes experienced with hurricanes, and therefore provide improved guidance for forecasting similar, future events.
It should be noted that the participation of the NOAA Collaborators in this project was understandably limited, as their operational work responsibilities took precedence and their funding support from this project did not materialize.
Description of research conducted during the reporting period and milestones accomplished and/or completed
The initially proposed milestones for this project included A) Mesoscale analyses and model simulations for the study of the evolution of Hurricanes Gustav and Ike; and B) Mesoscale analyses and model simulations for the study of the rapid development of Hurricane Humberto (2007). Additionally, the distribution and frequency of cyclone size and intensity was analyzed for all Gulf of Mexico tropical cyclones observed over the period of 1988 to 2008 using the Extended Best Track Dataset, which was compiled by the Cooperative Institute for Research of the Atmosphere and provides the best estimates of cyclone center position and the radii of associated wind fields for a 6-hour interval.
The ‘mesoscale’ is a scale of both distance and time, with the scale of distance corresponding to the diameter of a tropical cyclone, and below, and the scale of time being on the order of minutes and
152
NGI Progress Report NOAA Award #: NA06OAR4320264
Reporting Period: Jul 1, 2010 - Jun 30, 2011
hours. The North American Regional Reanalysis dataset, prepared the National Centers for Environmental Prediction, provides the most comprehensive representation of the environment surrounding Gulf cyclones, and is used as the background for numerical model simulations in this study. Satellite and aircraft observations analyzed in this study provide the most consistently contiguous representation of a tropical cyclone situated over the Gulf of Mexico away from land-based observing platforms.
Aircraft observations were analyzed at multiple times for Hurricane Gustav. Radial cross sections of estimated sea-level pressure, flight-level wind speed, and surface wind speed measured from the stepped frequency microwave radiometer were examined.
The Weather Research and Forecast (WRF) model, provided by the National Center for Atmospheric Research, was used to perform mesoscale numerical simulations of Hurricane Gustav traversing the Gulf of Mexico over a period of 72 hours and of the environment fostering the development of Hurricane Humberto over a period of 96 hours.
The Hybrid Single Particle Lagrangian Integrated Trajectory (HYSPLIT) Model was used to perform Lagrangian-space, time-backward trajectory analyses of air parcel origin associated with Hurricane Gustav. The trajectory analyses were performed using the WRF representation of the hurricane environment over the period of 24 hours, and were initiated at 11 different positions in and around the circulation area of the hurricane.
The findings of this study shall be presented in one or two journal articles.
Description of significant research results, protocols developed, and research transitions
Analysis of the Extended Best Track data shows that Hurricanes Gustav and Ike were exceptionally large in size, each with a 34-knot wind field covering more than half the area of the largest symmetric circle hypothetically possible (622,000 km2, or 890 km in diameter) for the Gulf of Mexico. Hurricanes Gustav and Ike were the 9th and 3rd largest of 75 Gulf cyclones, respectively, for the period of 1988 to 2008. As occurred with Gustav and Ike, most large cyclones in the period of 1988 to 2008 traversed the center of the Gulf with a northward or northwestward heading. Assuming no change to cyclone intensity and no other significant influence on the cyclone, the maximal expanse of the low-friction water surface underlying a cyclone combined with increasing latitudinal position of a cyclone allows for an enhanced Coriolis effect to steer, and therefore expand, the inward-directed wind field of the cyclone more outward; this wind field expansion is more pronounced for relatively large cyclones. Conversely, Hurricane Humberto was small, being the 7th smallest Gulf cyclone during 1988 to 2008, and existed for only a short time (2 days), yet it intensified into a Category-2 hurricane prior to its landfall. A majority of cyclones originating over the Gulf of Mexico during 1988 to 2008 developed within 300 km of a section of the Gulf shoreline; Humberto developed within 100 km of the Texas shoreline.
Radial cross sections of air pressure and wind speed for Gustav reveal that the strongest pressure gradient and maximum wind speed, near to the cyclone center, shift outward over time as the wind field of the hurricane was observed to expand. The wind speed increases or remains steady away from the cyclone center with a secondary maximum of wind speed developing 200 km from the cyclone center in the northeast quadrant. The distribution of pressure gradient varies between each quadrant, which may help to explain the differences in the local maxima of wind speed and the local radii of maximum wind speed.
The WRF simulation generated an expanding wind field with Gustav, with the maximum radius of the 34-knot wind field measuring approximately 400 km to the northeast of the cyclone center, consistent with the Extended Best Track data. The forecast simulation initiated Gustav with a lower intensity
153
NGI Progress Report NOAA Award #: NA06OAR4320264
Reporting Period: Jul 1, 2010 - Jun 30, 2011
(Category 1) than was observed in reality (Category 4 on August 30), but the intensity became representative of reality (Category 2 on September 1) as the simulated cyclone eventually adjusted to its environment. The HYSPLIT time-backward trajectories of select air parcels show that much of the air contained throughout the circulation of Gustav was drawn in from the east and the south of the cyclone, where warm sea water exists. The incorporation into the cyclone of the warm, moist maritime air – instead of dry continental air from the north – likely precluded any significant weakening of Gustav as it approached the northern Gulf coast.
The WRF simulation of the Humberto environment shows the presence of cyclonic motion along the coast of Texas prior to the observed formation of Humberto. A cold front enters the Texas coastal plain from the north, while a tropical wave propagates along southeasterly flow and is steered into the northwestern Gulf of Mexico by an intensifying anticyclonic ridge over the eastern Gulf. The front and the wave are forced to converge near the Texas coastline a few hours prior to the observed formation of Humberto, The amalgamation of dynamics amongst the cold front, the tropical wave, and indirectly from the ridge, over the warm Gulf waters likely leads to the development of Humberto.
Information on collaborators / partners: Michael C. Koziara, NOAA National Weather Service, [email protected]; Felix Navejar, National Weather Service, [email protected]
Information on any outreach activities: None
154
NGI Progress Report NOAA Award #: NA06OAR4320264
Reporting Period: Jul 1, 2010 - Jun 30, 2011
NGI File # 09-NGI-19 Project Title: Integrated Research for the Northern Gulf of Mexico Big Bend Region
Project Lead (PI) name, affiliation, email address: Eric P. Chassignet, Florida State University, [email protected]
Co-PI name, affiliation, email address: William K. Dewar, Florida State University, [email protected]
NOAA sponsor and NOAA office of primary technical contact: Julian Lartigue, NOAA Office of Oceanic and Atmospheric Research
NOAA Goal: Ecosystem Mission Goal
Project objectives and goals
The project is an integrated study of the marine ecosystem of the northern West Florida Shelf (WFS) (including the Big Bend Region (BBR) using an interdisciplinary observational, experimental, and modeling approach. This represents a natural progression in our understanding of this ecosystem based on FSU’s current NOAA NGI projects and involves direct collaborations between FSU, NOAA (NMFS and AOML), and USM. The objectives of the research are:
1) To understand the physical processes responsible for distributing water within the BBR, including cross-shelf transport of riverine-influenced seawater, transport of biological material, and the natural and anthropogenic variability of the system;
2) To understand the nutrient cycling, resource connectivity, and trophic interactions between BBR river-dominated coastal areas, nearshore seagrass habitats, estuaries and offshore reef fish communities.
3) To study the processes supporting regional productivity of a number of reef fish species important to both commercial and recreational fisheries, using gag (Mycteroperca microlepis), as a primary model.
The goals of this program are motivated by the four research themes of the Cooperative Institute—ecosystem management, geospatial data integration, regional climate effects, and coastal hazards. Those goals include (1) quantifying the onshore and offshore transport mechanisms of the BBR, (2) documenting the basic regional physical oceanography, and (3) clarifying key aspects of the ecosystem that contribute to reef fish productivity. All three goals will be integrated within an overarching BBR modeling framework. The observations, experiments, and modeling foci are directed at ecosystem-based management, coastal hazards, and the impacts of climate variability.
We use a combination of physical monitoring, field studies of key habitat features, trophic analyses of a suite of reef fish species, and integrative modeling of all components. This approach is supported by an observational array established with NGI support, with regular sampling along a transect extending from an offshore observational platform (K-tower, ~32 km offshore) to the FSU Coastal and Marine Laboratory (FSUCML) and by characterizing habitat and predator-prey interactions of key species, conducted by the NMFS and the FSUCML. The platform supports bottom moorings at 3 depths (5-20 m), each housing multisensor probes that measure in real time water depth, temperature, salinity, light, pH, chlorophyll a, turbidity, and oxygen; a suite of meteorological instruments that sample the atmospheric boundary layer to determine air-sea fluxes. The data from K-tower are telemetered in real-time to the FSUCML and to FSU. These studies define the variability and connectivity among critical habitats and the relationship to fisheries productivity. The integrated modeling system will provide near-real time monitoring and prediction of the marine and coastal
155
NGI Progress Report NOAA Award #: NA06OAR4320264
Reporting Period: Jul 1, 2010 - Jun 30, 2011
ocean and atmospheric environment that will direct research activities. The system couples a 1.3 km resolution Weather Research and Forecasting model (WRF) with a 30 arcsec (~ 800 m) resolution Regional Ocean Modeling System simulation over the BBR, nested within larger scale (3-4 km) WRF and HYbrid Coordinate Ocean Model system for the Gulf of Mexico-Western Atlantic. This system complements the observing activities and facilitates interdisciplinary research objectives while enabling ecosystem-level quantification and assessment of the impacts of natural and anthropogenic disturbances at various temporal and spatial scales.
Description of research conducted during the reporting period and milestones accomplished and/or completed
Ecology Milestones
This year, we completed data collection for the most comprehensive examination to date of spatial patterns of faunal composition and abundance in one of the world’s largest seagrass beds. This, in combination with our NGI work on food web dynamics, provides remarkable insight into the on-offshore linkages in the northeastern Gulf of Mexico.
Nearshore Reefs and Seagrass Community Profiles
(1) Expanded efforts to characterize secondary nursery habitat of gag on nearshore reefs, conducting surveys to describe the fish communities, sessile benthic invertebrate communities, and geomorphologic features.
(2) Found seasonal patterns in fish communities of “boom” during spring thru fall, showing patterns of high total abundance and species density, and “bust” in the winter, exhibiting patterns with high turnover in composition.
(3) Observations of focal species gag, red grouper, and red snapper indicated that gag had the strongest seasonal differences in abundance.
(4) Faunal diversity and frequency in seagrass meadows were highest for crustaceans, bony fishes, bivalves, and gastropods
Trophic Transfer Project
(1) Established that seagrass derived and offshore 2° production have unique isotopic signals.
(2) Determined the extent to which seagrass derived carbon contributes to productivity in gag.
(3) Determined that gag used seagrass-derived energy for egg production.
(4) Calculated the amount of organic nitrogen transported to the offshore environment via the migration of pinfish from the BBR.
(5) Estimated the relative contribution of pinfish derived nitrogen to the nitrogen budget of the northeastern Gulf of Mexico.
Transport Milestones
● Telemetry of T and S data at K-tower continues, T, S online
● Transmission electronics deployed on K-tower for telemetry of environmental data;
● Underwater cable installed at K-Tower for telemetry of ADCP and T, S at bottom mount;
● Time series data quality controlled and compiled;
156
NGI Progress Report NOAA Award #: NA06OAR4320264
Reporting Period: Jul 1, 2010 - Jun 30, 2011
● Current meter data of bottom ADCPs processed and compiled;
● Production rate measurements completed and analyzed;
● Temperature gradient measurements completed
● Continuation of Station A and B time series data collection
Data Center Milestones
● Continued routine automated quality control and data distribution via the FSU/COAPS/NGI web pages for all meteorological data from N7. This includes rapid update (every 10 minutes) and ability to download daily, quality controlled files in netCDF format.
● Continued rapid dissemination of ocean temperature and salinity data from T/S sensors mounted on N7 via the web page. Data are provided via cabling from sensors to the tower logger and then via line of sight telemetry (established by transport and meteorology groups).
● C. Collier presented an analysis using the N7 meteorological data to assess the available offshore wind resource in the Northeastern Gulf for the wind power industry. The presentation was made at the 2nd Annual Florida Energy Systems Consortium Summit.
Modeling Milestones
● Extended model domain
● Impact of atmospheric forcing on larvae distribution
Description of significant research results, protocols developed, and research transitions
Significant Research Results: Ecology
The FSU ecology team continued its investigations of nursery habitat and trophic transfer for one of the more economically important fishes in the region, gag (Mycteroperca microlepis). On a broad scale, we examined the geospatial linkage between juvenile gag primary nursery habitat (seagrass meadows) and secondary nursery habitat (shallow water reefs) as staging areas for recruitment to adult populations offshore, consistent with an ecosystem-based management approach for reef fish species. We characterized the seagrass faunal communities across the BBR and started characterization of the secondary nursery habitat using a generalized random-tessellation stratified design, a spatially-balanced approach. For seagrass, this defines the spatial extent of the BBR seagrass bed, characterizes the composition of seagrass and faunal communities, and elucidates potential mechanisms driving the patterns (e.g., influence of saltmarsh and other adjacent terrestrial habitats allowing precise estimates of absolute abundances of gag and other species (e.g., gag prey). For shallow water reefs, we are just beginning to understand their distribution on the northeast GoM coast. By integrating habitat-specific information on juvenile fish production and egress within an ecosystem-level nitrogen (N) mass balance model, we can estimate the relative contributions of N inputs to the BBR of the WFS derived from multiple sources.
157
NGI Progress Report NOAA Award #: NA06OAR4320264
Reporting Period: Jul 1, 2010 - Jun 30, 2011
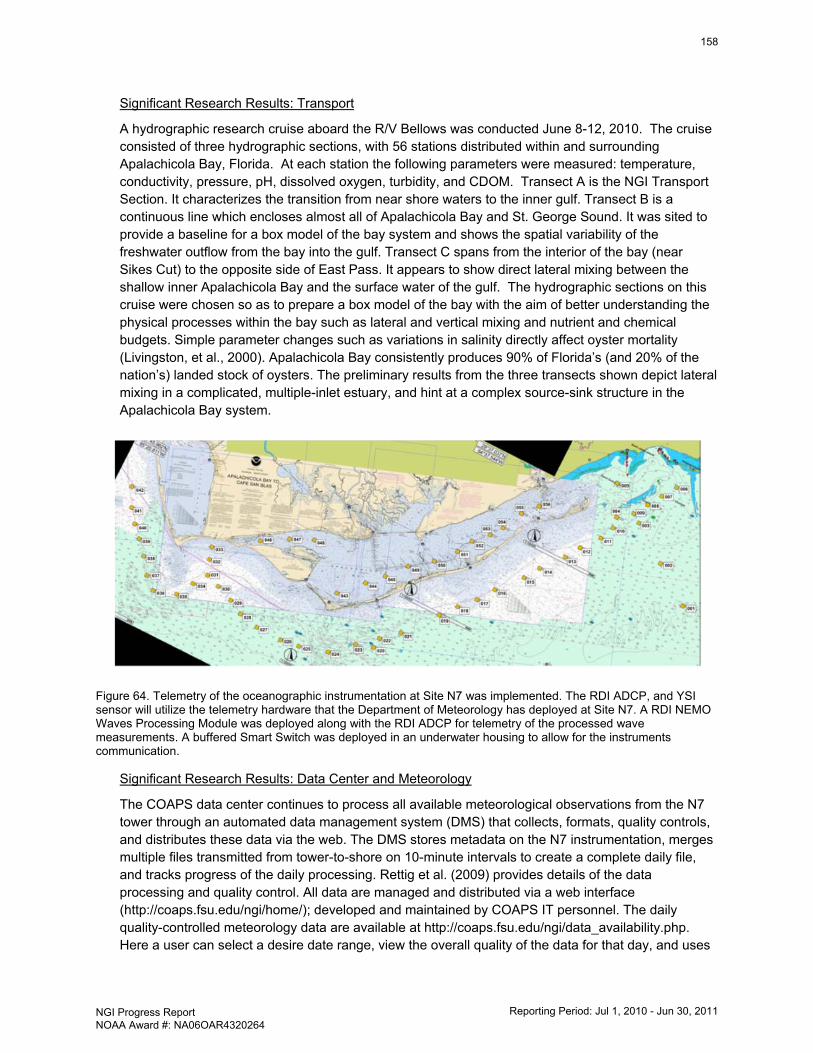
Significant Research Results: Transport
A hydrographic research cruise aboard the R/V Bellows was conducted June 8-12, 2010. The cruise consisted of three hydrographic sections, with 56 stations distributed within and surrounding Apalachicola Bay, Florida. At each station the following parameters were measured: temperature, conductivity, pressure, pH, dissolved oxygen, turbidity, and CDOM. Transect A is the NGI Transport Section. It characterizes the transition from near shore waters to the inner gulf. Transect B is a continuous line which encloses almost all of Apalachicola Bay and St. George Sound. It was sited to provide a baseline for a box model of the bay system and shows the spatial variability of the freshwater outflow from the bay into the gulf. Transect C spans from the interior of the bay (near Sikes Cut) to the opposite side of East Pass. It appears to show direct lateral mixing between the shallow inner Apalachicola Bay and the surface water of the gulf. The hydrographic sections on this cruise were chosen so as to prepare a box model of the bay with the aim of better understanding the physical processes within the bay such as lateral and vertical mixing and nutrient and chemical budgets. Simple parameter changes such as variations in salinity directly affect oyster mortality (Livingston, et al., 2000). Apalachicola Bay consistently produces 90% of Florida’s (and 20% of the nation’s) landed stock of oysters. The preliminary results from the three transects shown depict lateral mixing in a complicated, multiple-inlet estuary, and hint at a complex source-sink structure in the Apalachicola Bay system.
Figure 64. Telemetry of the oceanographic instrumentation at Site N7 was implemented. The RDI ADCP, and YSI sensor will utilize the telemetry hardware that the Department of Meteorology has deployed at Site N7. A RDI NEMO Waves Processing Module was deployed along with the RDI ADCP for telemetry of the processed wave measurements. A buffered Smart Switch was deployed in an underwater housing to allow for the instruments communication.
Significant Research Results: Data Center and Meteorology
The COAPS data center continues to process all available meteorological observations from the N7 tower through an automated data management system (DMS) that collects, formats, quality controls, and distributes these data via the web. The DMS stores metadata on the N7 instrumentation, merges multiple files transmitted from tower-to-shore on 10-minute intervals to create a complete daily file, and tracks progress of the daily processing. Rettig et al. (2009) provides details of the data processing and quality control. All data are managed and distributed via a web interface (http://coaps.fsu.edu/ngi/home/); developed and maintained by COAPS IT personnel. The daily quality-controlled meteorology data are available at http://coaps.fsu.edu/ngi/data_availability.php. Here a user can select a desire date range, view the overall quality of the data for that day, and uses
158
NGI Progress Report NOAA Award #: NA06OAR4320264
Reporting Period: Jul 1, 2010 - Jun 30, 2011
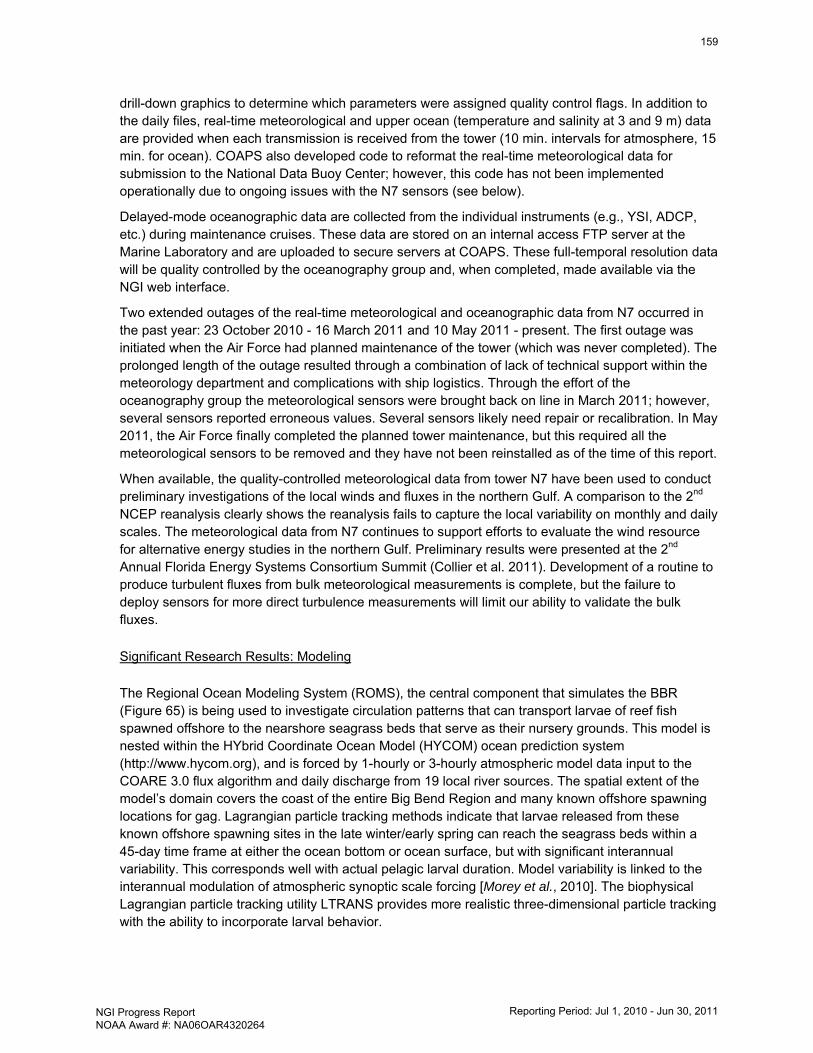
drill-down graphics to determine which parameters were assigned quality control flags. In addition to the daily files, real-time meteorological and upper ocean (temperature and salinity at 3 and 9 m) data are provided when each transmission is received from the tower (10 min. intervals for atmosphere, 15 min. for ocean). COAPS also developed code to reformat the real-time meteorological data for submission to the National Data Buoy Center; however, this code has not been implemented operationally due to ongoing issues with the N7 sensors (see below).
Delayed-mode oceanographic data are collected from the individual instruments (e.g., YSI, ADCP, etc.) during maintenance cruises. These data are stored on an internal access FTP server at the Marine Laboratory and are uploaded to secure servers at COAPS. These full-temporal resolution data will be quality controlled by the oceanography group and, when completed, made available via the NGI web interface.
Two extended outages of the real-time meteorological and oceanographic data from N7 occurred in the past year: 23 October 2010 - 16 March 2011 and 10 May 2011 - present. The first outage was initiated when the Air Force had planned maintenance of the tower (which was never completed). The prolonged length of the outage resulted through a combination of lack of technical support within the meteorology department and complications with ship logistics. Through the effort of the oceanography group the meteorological sensors were brought back on line in March 2011; however, several sensors reported erroneous values. Several sensors likely need repair or recalibration. In May 2011, the Air Force finally completed the planned tower maintenance, but this required all the meteorological sensors to be removed and they have not been reinstalled as of the time of this report.
When available, the quality-controlled meteorological data from tower N7 have been used to conduct preliminary investigations of the local winds and fluxes in the northern Gulf. A comparison to the 2nd NCEP reanalysis clearly shows the reanalysis fails to capture the local variability on monthly and daily scales. The meteorological data from N7 continues to support efforts to evaluate the wind resource for alternative energy studies in the northern Gulf. Preliminary results were presented at the 2nd Annual Florida Energy Systems Consortium Summit (Collier et al. 2011). Development of a routine to produce turbulent fluxes from bulk meteorological measurements is complete, but the failure to deploy sensors for more direct turbulence measurements will limit our ability to validate the bulk fluxes.
Significant Research Results: Modeling
The Regional Ocean Modeling System (ROMS), the central component that simulates the BBR (Figure 65) is being used to investigate circulation patterns that can transport larvae of reef fish spawned offshore to the nearshore seagrass beds that serve as their nursery grounds. This model is nested within the HYbrid Coordinate Ocean Model (HYCOM) ocean prediction system (http://www.hycom.org), and is forced by 1-hourly or 3-hourly atmospheric model data input to the COARE 3.0 flux algorithm and daily discharge from 19 local river sources. The spatial extent of the model’s domain covers the coast of the entire Big Bend Region and many known offshore spawning locations for gag. Lagrangian particle tracking methods indicate that larvae released from these known offshore spawning sites in the late winter/early spring can reach the seagrass beds within a 45-day time frame at either the ocean bottom or ocean surface, but with significant interannual variability. This corresponds well with actual pelagic larval duration. Model variability is linked to the interannual modulation of atmospheric synoptic scale forcing [Morey et al., 2010]. The biophysical Lagrangian particle tracking utility LTRANS provides more realistic three-dimensional particle tracking with the ability to incorporate larval behavior.
159
NGI Progress Report NOAA Award #: NA06OAR4320264
Reporting Period: Jul 1, 2010 - Jun 30, 2011
Figure 65. The ROMS BBR model surface temperature and currents for the 1 April 2004 hindcast nested within the 1/25° Gulf of Mexico HYCOM. The ROMS model domain is indicated with the black box.
Information on collaborators / partners: a. Name of collaborating organization: : NOAA National Marine Fisheries Service,
NOAA/AOML, the NOAA National Weather Service in Tallahassee, the NOAA National Estuarine Research Reserve in Apalachicola Bay, IAP Worldwide Services. and colleagues not directly involved in the NGI, including Dr. Sunhui Sim (FSU Geography Department)
b. Date collaborating established: Oct 1, 2006 c. Does partner provide monetary support to project? Amount of support? Yes, $118,000 d. Does partner provide non-monetary (in-kind) support? Yes, ship time to NOAA National
Marine Fisheries Service e. Short description of collaboration/partnership relationship. 1) Examination of temporal
and spatial patterns in fish community structure, abundance and demographics and 2) characterization of diets, predator-prey interactions, resource overlap and habitat-associated differences
Information on any outreach activities: Various exhibits at the Coastal Marine Laboratory, Oceans Day at the Capitol, FSU Campus, etc.
160
NGI Progress Report NOAA Award #: NA06OAR4320264
Reporting Period: Jul 1, 2010 - Jun 30, 2011
NGI File # 10-NGI-MOD-35 Project Title: Air Monitoring and Analysis at Grand Bay NERR
Project Lead (PI) name, affiliation, email address: Robert Moorhead, Northern Gulf Institute, [email protected]
NOAA sponsor and NOAA office of primary technical contact: Dave Ruple, Grand Bay NERR, [email protected]
NOAA Goal: Ecosystem
Project objectives and goals
Mercury levels in seafood pose a significant human health risk in the Northern Gulf of Mexico. While some mercury sources are local and easily identified, much of the mercury entering the Gulf of Mexico may originate in other parts of the country or world entering the system through wet and dry deposition from the atmosphere. Using dry deposition mercury analyzers, gas analyzers (Carbon monoxide, Sulfur dioxide, Ozone, and Nitrogen Oxides), and meteorological data, it should be possible to use atmospheric modeling to identify sources of air-borne mercury deposited in the Gulf of Mexico region. Data is processed and analyzed at NOAA’s Air Resources Laboratory (ARL). The station at the Grand Bay National Estuarine Research Reserve is one in a network of sites used to provide airborne contaminant data for ingest into atmospheric models. The goal of this project is therefore to collect multi-year samples of dry deposition mercury at Grand Bay NERR and provide them to NOAA’s ARL.
Description of research conducted during the reporting period and milestones accomplished and/or completed
2010 dry deposition mercury data collected and forwarded to NOAA ARL
Description of significant research results, protocols developed, and research transitions N/A
Information on collaborators / partners: a. Name of collaborating organization: Winston Luke, NOAA Air Resources Laboratory b. Date collaborating established: Jul 1, 2008 c. Does partner provide monetary support to project? Amount of support? Yes, $25,842 d. Does partner provide non-monetary (in-kind) support? No e. Short description of collaboration/partnership relationship. Primary funding organization
for this project.
Information on any outreach activities: None
161
NGI Progress Report NOAA Award #: NA06OAR4320264
Reporting Period: Jul 1, 2010 - Jun 30, 2011
NGI File # 10-NGI-MOD-37 Project Title: WISDOM Launch and Coordination Activities during Hurricane Season 2010
Project Lead (PI) name, affiliation, email address: David Shaw, MSU, [email protected]
Co-PIs names, affiliation, email address: Mike Carron, MSU, [email protected]; Louis Wasson, MSU, [email protected]
NOAA sponsor and NOAA office of primary technical contact: Justyna Nicinska, Office of Oceanic and Atmospheric Research
NOAA Goal: Weather and Water Mission Goal
Project objectives and goals
NOAA has mandated a 50% increase in hurricane forecast accuracy 3-7 days from possible landfall. The key technical issue is lack of data thousands of miles off shore for hurricane forecast models and how to obtain this scientific data in a safe yet frugal operational system? The intended use of the WISDOM system is to acquire important atmospheric measurements in the synoptic environment around hurricanes in the open oceans. Sensors carried by the WISDOM balloons record GPS, altitude and barometric pressure at 12,000 feet and 26,000 feet and stay aloft up to 10 days. These measurements may lead to a greater understanding of the dynamics driving hurricane track and intensity.
Description of research conducted during the reporting period and milestones accomplished and/or completed
No balloons were launched during the reporting period.
Description of significant research results, protocols developed, and research transitions
None
Information on collaborators / partners: None
Information on any outreach activities:
This project was featured in numerous publications promoting NGI and the Geosystems Research Institute at MSU.
162
NGI Progress Report NOAA Award #: NA06OAR4320264
Reporting Period: Jul 1, 2010 - Jun 30, 2011
NGI File # 10-NGI-MOD-38 Project Title: 2010 Summer Internship for the NGI Ecosystem Data Assembly Center
Project Lead (PI) name, affiliation, email address: Sharon Hodge, Northern Gulf Institute, Mississippi State University, [email protected]
NOAA sponsor and NOAA office of primary technical contact: Russ Beard, NCDDC
NOAA Goal: Workforce development/Education
Project objectives and goals: Provides career exploration opportunities in coastal science data management, data stewardship for fisheries, and ecosystem data management including metadata development to eligible undergraduate and graduate students.
Description of research conducted during the reporting period and milestones accomplished and/or completed: Interns were hired during the process and assigned to NOAA related jobs. For the second year, intern Micah Elkins distributed NOAA Extreme Weather Information Sheets to coastal states, and tracked distribution data in a GIS. Intern Harrison Pounds provided IT support to NOAA NCDDC and performed so well he was asked to return and participate in the next internship session. Consistently involving students in NOAA activities supports the workforce development goal.
Description of significant research results, protocols developed, and research transitions: Not applicable
Information on collaborators / partners: a. Name of collaborating organization: Russ Beard, NOAA National Coastal Data
Development Center, Stennis Space Center, MS b. Date collaborating established: 10/08 c. Does partner provide monetary support to project? Amount of support? Yes, $16K d. Does partner provide non-monetary (in-kind) support? Yes, administration and placement
help e. Short description of collaboration/partnership relationship: NOAA partner in the internship
program collaborating with the development, operations, and candidate selection processes of the program
Information on any outreach activities: None
163
NGI Progress Report NOAA Award #: NA06OAR4320264
Reporting Period: Jul 1, 2010 - Jun 30, 2011
NGI File # 10-NGI-MOD-39 Project Title: Development and Demonstration of a Single-Point-of-Access to Satellite Wind and
Wave Products
Project Lead (PI) name, affiliation, email address: Mark A. Bourassa, Florida State University, [email protected]
NOAA sponsor and NOAA office of primary technical contact: Stan Wilson, NOAA Satellite and Information Service
NOAA Goals: Climate Mission Goal, Weather and Water Mission Goal, Commerce and Transportation Mission Goal, Technology and Mission Support Goal
Project objectives and goals
Develop a website that will provide a single-point-of-access for global satellite altimeter-derived significant wave height (SWH) and wind speed (WS) and scatterometer-derived ocean vector wind (OVW) products. This website is to provide a capability for one-stop-shopping enabling a user to easily access OVW, WS and SWH products from multiple satellites corresponding to a user-specified region and time frame (typically collected within the past three hours for operational use) of interest. The web site is to simplify access to these satellite products for the non-specialist users, thereby potentially broadening the impact that timely access to such products can have, but frequently is not realized due to lack or practical access to the data.
Such a single-point-of-access means, in effect, one-stop shopping, so that a prospective user does not have to go to multiple international sites, to obtain multiple products in multiple formats according to multiple procedures. It also means that the delivery of these products will require less communication bandwidth and computing power to access the data products, and that the retrieved data will be in a format practical for selected end users.
This web site would:
• Provide access to current altimeter and scatterometer products are initially made available in near real time.
• Build a global data base of these products as they are made available.
• Output data with minimal, easy-to-understand flagging based on the L2 flags
• OVW products would be Level 2B, where 2B = swath-oriented, vector wind cells
• 24/7 support will not be provided – this is a best effort demonstration product
User to be able to:
• Specify the geographic area and time period of interest for accessing OVW, SWH and WS products.
• Be able to look at a low-res image of the products of interest before obtaining the full digital files.
• Access those data products in an easy-to-use format like NetCDF (or equivalent)
164
NGI Progress Report NOAA Award #: NA06OAR4320264
Reporting Period: Jul 1, 2010 - Jun 30, 2011
Description of research conducted during the reporting period and milestones accomplished and/or completed
We have developed the protocol for retrieving roughly half the satellite data covered by the proposed work, and have commitments for the other have from KNMI. The data sets we have are converted into NetCDF format and a file structure designed for easy searching and subsetting of the data. The prototype web interface has been developed,
The following milestones have been revised based on changes in NOAA timing. They are consistent with the goals expressed by Dr. Stan Wilson, who arranged for the funding of this project.
• July 31, 2011 – Test single-point-of-access web site. Testing to include being able to access OVW from two satellites using ASCAT with QuikSCAT for a retrospective test. Once this testing has been completed, then be prepared to incorporate OSCAT products as soon as Oceansat moves from its Commissioning Phase to its Operational Phase.
• Aug 31, 2011 – Collect feedback from test group
• Sept. 15, 2011 – Modify the web site based on feedback from the test group
• Sept. 30, 2011 – complete version (all planned satellites) ready for use. Demonstrate to NESDIS how the web site works, hopefully starting the process of NESDIS incorporating such a capability into its suite of ongoing, operational services
Description of significant research results, protocols developed, and research transitions We have developed the protocol for retrieving roughly half the satellite data covered by the proposed work, and have commitments for the other have from KNMI. File structure was designed for easy searching and subsetting of the data. The prototype web interface has been developed, and we are working on communications between the website and the data. We are on schedule for timely delivery of the product.
Information on collaborators / partners:
W. Stan Wilson, Silver Spring, MD, [email protected]; Kerry Sawyer, Silver Spring, MD, [email protected]
Kerry Sawyer and Dr. Stan Wilson will interface on Dr. Bourassa’s behalf, as needed, with foreign space agencies of the current satellites of interest, as needed; in particular, we will need to get ESA to simplify its access procedures so no proposals need to be written and no questions asked when data are pulled out of their web sites.
Information on any outreach activities: Interaction with a subset of users in South America and Fiji.
165
NGI Progress Report NOAA Award #: NA06OAR4320264
Reporting Period: Jul 1, 2010 - Jun 30, 2011
NGI File # 10-NGI-MOD-40 Project Title: Inundation Mapping Strategies Workshop and Support
Project Lead (PI) name, affiliation, email address: John Harding, Northern Gulf Institute, Mississippi State University, [email protected]
NOAA sponsor and NOAA office of primary technical contact: Doug Marcy, NOS Coastal Services Center
NOAA Goal: Weather and Water Mission Goal
Project objectives and goals
One of the NOAA Storm Surge Roadmap Phase 1 priorities is computed operational inundation depth maps using high resolution data. However, a gap exists in the understanding of available techniques: what are the advantages and disadvantages, validity of mapping from coarse models to higher resolution models, the relationship between modeling uncertainty and mapping, cost of creating, etc. This project developed a Gulf Coast workshop to bring together experts to discuss the issue and provide input for a white paper of proposed actions and recommended practices required to address this need.
The goal of this project is to identify the issues associated with the creation of operational inundation depth maps using high resolution data. The project will hold workshop(s) to address these issues and provide input for a NOAA developed plan of action and milestones.
Description of research conducted during the reporting period and milestones accomplished and/or completed
Sponsored and participated in the Operational Storm Surge Inundation Mapping Workshop 15-16 March, 2011 to develop research plan of action.
Description of significant research results, protocols developed, and research transitions
Workshop participants discussed and catalogued coastal inundation best practices and limitations as well as operational implementation strategy
Information on collaborators / partners: a. Name of collaborating organization: Doug Marcy, NOAA NOS Coastal Services Center b. Date collaborating established: Jul 1, 2010 c. Does partner provide monetary support to project? Amount of support? Yes, $50K d. Does partner provide non-monetary (in-kind) support? Yes e. Short description of collaboration/partnership relationship. Primary funding organization
for this project and active participation as co-sponsor in planning and conduct of workshop.
a. Name of collaborating organization: Jamie Rhome, NOAA NWS National Hurricane Center
b. Date collaborating established: Jul 1, 2010 c. Does partner provide monetary support to project? No d. Does partner provide non-monetary (in-kind) support? Yes e. Short description of collaboration/partnership relationship. Workshop Co-sponsor &
participant
166
NGI Progress Report NOAA Award #: NA06OAR4320264
Reporting Period: Jul 1, 2010 - Jun 30, 2011
Information on any outreach activities: i. Type: Workshop ii. Name of event : Operational Storm Surge Inundation Mapping Workshop iii. Date: Mar 15-16, 2011 iv. Location: Bay St. Louis, MS v. Description: Workshop designed to discuss and catalogue inundation best
mapping strategies and develop a strategy for operational implementation. vi. Approximate Number of Participants: 40
167
NGI Progress Report NOAA Award #: NA06OAR4320264
Reporting Period: Jul 1, 2010 - Jun 30, 2011
NGI File # 10-NGI-MOD-41 Project Title: Developments of Global Bias Monitoring System
Project Lead (PI) name, affiliation, email address: Xiaolei Zou, Florida State University, [email protected]
NOAA sponsor and NOAA office of primary technical contact: Fuzhong Weng, NOAA NESDIS
NOAA goals: Weather and Water Mission Goal, Technology and Mission Support Goal
Project objectives and goals
This project aims at developing global satellite bias monitoring system. The objectives of the research are:
1) To understand the sources responsible for O-B biases; and
2) To understand the key O-B characteristics of GOES and POES satellite radiances at different channels; and
3) To study and develop innovative ways of display and monitor the global bias.
Preliminary results from our previous studies indicated that direct assimilation of Spinning Enhanced Visible and Infrared Imager (SEVIRI) and Geostationary satellite (GOES) imager infrared (IR) radiances improved water vapor analysis fields and also resulted in some positive impacts on global and regional numerical weather prediction (NWP). This project will continue refining the assimilation process for both SEVIRIS and GOES imager radiances and incorporate these data into National Centers for Environmental Prediction (NCEP) operational Gridpoint Statistical Interpolation (GSI) forecast systems. The proposed effort also well prepares us for the future Geostationary Operational Environmental Satellite "R" Series (GOES-R) data assimilation. The Community Radiative Transfer Model (CRTM) that simulates imager radiances will be enhanced with several critical components such as a dynamic-updating land surface emissivity data and improved fast and accurate gaseous absorption modules. Biases in SEVIRI and GOES IR imager radiances will be reduced using polar-orbiting and geostationary satellite calibration algorithms developed within the World Meteorological Organization (WMO) Global Space-based Inter-calibration system (GSICS). The infrared land surface emissivity database in CRTM will be enhanced over land and cloudy areas where the SEVIRI and GOES observations are available. Comprehensive quality control (QC) procedures will be developed for both clear-sky and cloudy conditions. Cloudy-radiance assimilation will be developed and tested by employing cloud parameters diagnosed from the window channel radiances and/or predicted from NWP models. Assimilation of the original raw imager data at high horizontal resolution (a few kilometers) and temporal resolution (several tenth minutes) and its impact on precipitation forecast will be developed and assessed. In parallel, microwave temperature and humidity sounders on board Chinese FengYun (FY) three satellites A (morning satellite) and B (afternoon satellite) (FY-3A/B) will be first validated against similar instruments on board NOAA and European polar-orbiting satellites, then incorporated into NCEP GSI operational systems. The complementary contributions of FY-3A/B to NWP forecast skill with and without European (morning satellite) and NOAA-18 (afternoon satellite) will finally be assessed.
Description of research conducted during the reporting period and milestones accomplished and/or completed
● Investigated global biases of GOES imager radiance data, NOAA-18 and MetOp-A AMSU-A and MHS radiances, and FY-3A MWTS and MWHS radiances from NCEP GFS 6-h forecasts;
● Assessed the quality of the new instruments MWTS and MWHS on FY-3A;
168
NGI Progress Report NOAA Award #: NA06OAR4320264
Reporting Period: Jul 1, 2010 - Jun 30, 2011
● Continuation of developing global bias monitoring system by extending data record, and incorporating more satellite instruments (MEtOp, FY-3B etc.).
Description of significant research results, protocols developed, and research transitions
AMSU-A versus MWTS:
The measurements from FY-3 MicroWave Humidity Sounder (MWHS) are compared with the data from NOAA-18 Microwave Humidity Sounder (MHS) under various atmospheric and surface conditions. A quality control (QC) procedure is applied to allow the comparison be conducted separately for outliers and non-outliers. The QC algorithm includes a gross error check, instrument noise spikes through noise equivalent differential temperature ( NE∆T ), and an O-B bi-weighting check, where O represents satellite observations, and B is model-simulated brightness temperature by Radiative Transfer for TIROS-N Operational Vertical Sounder (RTTOV) based on the 6-h forecast fields of the National Centers for Environmental Prediction (NCEP) Global Forecast System (GFS). It is found that (i) the global bias and standard deviation of O-B from MWHS brightness temperatures are comparable in magnitudes to those of MHS measurements; (ii) positive O-B outliers prevail in channel 3 for both MWHS and MHS instruments; and (iii) biases of channels 4 and 5 are predominantly negative over land for both MWHS and MHS. A series of sensitivity experiments are carried out to demonstrate that the large positive O-B biases could be due to the errors in the atmospheric water vapor profiles from the analysis fields being too wet, and that the negative biases over land arise mostly from errors in surface emissivity, but smooth model terrain also contributes to negative biases over land.
MHS versus MWTS:
After the successful launches of the first two polar-orbiting satellites in a new Fengyun three (FY-3) series, FY-3A/B, into a morning-configured and an afternoon-configured orbit in May 2008 and November 2010, respectively, China will launch its next three polar-orbiting satellites before 2020. The MicroWave Temperature Sounder (MWTS) on FY-3A/B satellites has four-channels which are the same in channel frequency as channels 3, 5, 7 and 9 of Advanced Microwave Sounding Unit-A (AMSU-A). Thus, the quality of the brightness temperature measurements from FY-3A MWTS can be assessed using the AMSU-A brightness temperature observations from NOAA-18 satellite. Overall, MWTS data compares favorably with AMSU-A data in terms of its global bias to NWP simulations. The standard deviations of global MWTS brightness temperatures are slightly larger than those of AMSU-A data. The scan-angle dependence of the brightness temperature bias is found to be symmetric for MWTS channels 3 as well as AMSU-A channel 7; and asymmetric for MWTS channels 2 and 4 and AMSU-A channels 5 and 9, with a warm (cold) bias being located at the beginning (end) of a scan line for all asymmetric channels except for MWTS channel 4. A major difference between the two instruments is that the MWTS biases in channels 3 and 4 are negative in low latitudes and positive in high latitudes, while the AMSU-A biases are negative in all latitudes. A detailed analysis of data reveals that such a difference is closely related to the difference in the temperature dependence of biases between the two instruments. The AMSU-A biases are independent of the scene temperature, but MWTS biases vary with the earth scene brightness temperature. The root-cause of the bias could be a combination of several factors, including solar contamination on its calibration target, detector nonlinearity, and the center frequency drift. This study further demonstrates the utility of a well-calibrated radiometer like AMSU-A for the assessment of a new instrument with NWP fields used as inputs to forward radiative transfer simulations.
Information on collaborators / partners: None
Information on any outreach activities: None
169
NGI Progress Report NOAA Award #: NA06OAR4320264
Reporting Period: Jul 1, 2010 - Jun 30, 2011
NGI File # 09-NGI-MOD-42 Project Title: The Mississippi Digital Earth Model
Project Lead (PI) name, affiliation, email address: Scott A. Samson, Geosystems Research Institute, Mississippi State University, [email protected]
Co-PI name, affiliation, email address: Robert Moorhead, Geosystems Research Institute, Mississippi State University, [email protected]
NOAA sponsor and NOAA office of primary technical contact: Miki Schmidt, NOS Coastal Services Center
NOAA Goals: Workforce Development/Education
Project objectives and goals
The Geospatial Education and Outreach Project was charged with the development and implementation of educational programs throughout local and state government agencies in Mississippi. The government workforce is becoming increasingly technologically competent in the utilization of the geospatial applications derived from NGI research activities.
Description of research conducted during the reporting period and milestones accomplished and/or completed
This project is focused on outreach, education and data acquisition. There is not a research component. The Geospatial Education and Outreach Project was developed in response to the limited availability of geospatial data needed by first responders immediately following Hurricane Katrina of August 29, 2005. An assessment was conducted of the educational needs of Mississippi’s local governments, especially the localities in the southern portions of the state most susceptible to the effects of hurricanes. A series of intensive 2, 3 and 5 day workshops were compiled that would provide a strong foundation in the fundamentals and applications of GIS. Courses offered range from basic concepts of GIS to advanced, enterprise database management systems. Technical assistance is provided to local governments following classroom preparation as a means to increase the success rate of implementation of GIS in the work place. A Mississippi law created in 2003 allocates public sector responsibilities for (1) research and education and (2) implementation in remote sensing and geographic information systems. The law created the Mississippi Coordinating Council for Remote Sensing and Geographic Information Systems to “set and assure enforcement of policies and standards to make it easier for remote sensing and geographic information system users around the state to share information and to facilitate cost-sharing arrangements to reduce the costs of acquiring remote sensing and geographic information system data.” The law requires the Mississippi Department of Environmental Quality (MDEQ) to develop seven base data layers of geographic information for the state, referred to as the Mississippi Digital Earth Model (MDEM). The MDEM is composed of seven framework layers as defined by the Federal Geographic Data Community’s National Spatial Data Infrastructure. Data for the MDEM is acquired and managed through joint operations between the MDEQ and the Mississippi Department of Information Technology Services. The on-going program will be largely self-funded in the long term because of coordinating regular governmental and agency data acquisition plans and efficiencies in coordinating statewide data purchases. In the near term, however, federal funding to help transition research results into an operational implementation in developing the initial data layers and an efficient data delivery system will be necessary.
170
NGI Progress Report NOAA Award #: NA06OAR4320264
Reporting Period: Jul 1, 2010 - Jun 30, 2011
MSU/GRI and ESRI collaborated in the development of a software “request for proposals” for rural local government agencies in Mississippi. Fifteen agencies submitted proposals and received software from ESRI. The recipients have 12 months to complete the implementation plan outlined in their respective proposals. Upon successful completion, the recipients will receive a long-term license for their software. Mississippi was the first state to develop a RFP of this nature for rural, local governments. The software vendor is monitoring the project and will publicize the successful “case studies.” Fifteen awards have been delivered to participating local governments. Deadline for completing projects was October 30, 2010. The MDEQ is in the process of acquiring, processing and assessing the QA/QC of the high-resolution digital elevation data across Mississippi. The data was delivered to the public in the 3rd quarter.
Description of significant research results, protocols developed, and research transitions
This project is focused on outreach, education and data acquisition. There is not a research component. The Extension Service model of the land-grant university is used to assist in technology transfer. Workshops, presentations and on-site assistance have been proven to be effective in educating the citizens of Mississippi. A network of county extension offices and state-level specialists provide efficient support in a wide range of areas, such as crop production, youth development through 4-H and geospatial technologies.
Information on collaborators / partners: a. Name of collaborating organization: Mississippi Department of Environmental Quality b. Date collaborating established: Jul 1, 2009 c. Does partner provide monetary support to project? Amount of support? No d. Does partner provide non-monetary (in-kind) support? Yes e. Short description of collaboration/partnership relationship. The MDEQ has been given the
charge by the State of Mississippi to develop the 7 National Spatial Data Infrastructure layers for the MDEM. A subcontract was issued from this project to support MDEQ with their tasks.
Information on any outreach activities: Workshops and training: The GEO Project curriculum consists of 8 courses in GIS applications and geospatial database management. Thirty-seven 2 and 3 day workshops with 327 participants at 8 locations across the state.
Since July 1 of 2010, 37 workshops representing 31 of the 82 counties in Mississippi.
171
NGI Progress Report NOAA Award #: NA06OAR4320264
Reporting Period: Jul 1, 2010 - Jun 30, 2011
NGI File # 10-NGI-MOD-43 Project Title: Developments of Advanced Satellite Microwave Products
Project Lead (PI) name, affiliation, email address: Xiaolei Zou, Florida State University, [email protected]
NOAA sponsor and NOAA office of primary technical contact: Fuzhong Weng, NOAA NESDIS
NOAA Goal(s): Weather and Water Mission Goal, Technology and Mission Support Goal
Project objectives and goals
This project aims at developing advanced satellite microwave products. The first major task of the proposed study is to develop advanced satellite microwave products for improving typhoon and hurricane predictions. The primary hazards from tropical cyclones include storm surge, inland flooding and wind damage (directly from the storm winds and from typhoon-spawned tornados). Preparing for these hazards requires accurate forecasting of the storm track, the storm intensity, the size of the storm wind field, and the precipitation. These forecasts are currently obtained from numerical model predictions and from simpler, empirical techniques. The United States (NOAA and NASA) has invested on satellite products from operational and research satellites that can be used for storm monitoring and forecasts. But, the product quality needs to be improved further under severe storm conditions. Also, transition of existing algorithms and products to the operational centers needs to be improved and accelerated. The second major task of the proposed study is to develop through data assimilation of conventional and satellite data, generate climate-quality of observations, and to better our understanding of the climate variations at global and regional scales. This work will contribute to a high quality of climate data record (level 2: atmospheric temperature) with 30 years of microwave sounding unit (MSU) data and will allow for community studies of the impacts of human activities and natural processes on climate change.
Description of research conducted during the reporting period and milestones accomplished and/or completed
● Investigated characteristics of surface-sensitive microwave channels within typhoons and hurricanes;
● Assessed the quality of the new instrument MWI=RI on FY-3A using AMSR-E data on Aqua;
● Quality control of AIRS total ozone;
● Ability of running HWRF by ourselves.
Description of significant research results, protocols developed, and research transitions
MHS radiance observations from polar-orbiting satellites:
The potential applications of high-frequency microwave brightness temperature (TB) observations from polar-orbiting satellites to Hurricane Earl’s rapid intensification forecasting is investigated. Specifically, TB observations from the Microwave Humidity Sounders (MHS) on board European MetOp-A and United States NOAA-15, 16, 18, 19 and MicroWave Humidity Sounder (MWTS) on board Chinese FY-3A were analyzed during the rapid intensification period of Hurricane Earl from August 29 to September 3, 2010. A 126-h model forecast initialized at 0000 UTC 29 August 2010 was made using the Hurricane Weather Research and Forecasting (HWRF) System. The HWRF system is a coupled system composed of the nonhydrostatic, two-way interactive, moving nest model and the three-dimensional Princeton Ocean Model (POM). The weak vortex at the initial time in GFS analysis was replaced by a 2D axisymmetric synthetic vortex. The track, intensity and size of model-simulated Hurricane Earl compared favorably with the best track data. The HWRF outputs of temperature, water
172
NGI Progress Report NOAA Award #: NA06OAR4320264
Reporting Period: Jul 1, 2010 - Jun 30, 2011
vapor, hydrometeor profiles and surface winds were then used as inputs to the Community Radiative Transfer Model (CRTM) to produce TB simulations at MHS and MWHS frequencies for Hurricane Earl. Comparisons are made for the cloud structures of Hurricane Earl among MHS/MWHS TBs, airborne radar reflectivity and the HWRF model simulation. By relating the TBs with reflectivity, liquid water content (LWC) and ice water content (IWC) from both models and observations, the ability for MHS/MWTS to see through hurricane clouds was assessed. Insights on an effective use of high-frequency microwave cloudy radiances from multiple polar-orbiting satellites gained from this study will also be discussed.
Satellite total ozone:
Total column ozone data contains useful meteorological information and was shown to have a positive impact on numerical weather forecasts of mesoscale storm systems and hurricanes when assimilated (Jiang et al, 2003; Wu and Zou, 2008). Atmospheric Infrared Sounder (AIRS) provides twice daily global observations. Total column ozone data can be retrieved from the AIRS infrared multi-channel radiance observations. However, about 20~30% of AIRS ozone data are flagged to be of bad quality. Most of flagged data were identified to have total precipitable water (PW) errors, defined by when the ratio between PW errors and PW retrieval exceeded 35%. It was found that most data within hurricanes were flagged due to extremely low total PW from AIRS. In this study, a new PW ratio, defined by the AIRS PW error divided by the NCEP zonal average PW, is used to replace the one in AIRS quality control (QC) scheme. Data is removed if the new PW error ratio exceeds 33%. Only about 5~10% of AIRS ozone data are flagged to be of bad quality. Following this step of QC, a linear regression model, which links the total column ozone to the model’s vertical mean potential vorticity (MPV), is established for future data assimilation of AIRS total ozone. Outliers identified by a biweight algorithm are further removed. Numerical results implementing the proposed QC method are compared with those provided by AIRS for typhoon Sinlaku (2008) in the Pacific Ocean and Hurricane Earl (2010) in the Atlantic Ocean. It is shown that the new scheme works by retaining more of the good data while removing the bad data.
Information on collaborators / partners: None
Information on any outreach activities: None
173
NGI Progress Report NOAA Award #: NA06OAR4320264
Reporting Period: Jul 1, 2010 - Jun 30, 2011
NGI File # 10-NGI-MOD-44 Project Title: Time-Series and Underway Assessments of Ocean Acid CO2
Project Lead (PI) name, affiliation, email address: Steven E. Lohrenz, University of Southern Mississippi, [email protected]
Co-PI(s) name(s), affiliation, email address: Stephan Howden, University of Southern Mississippi, [email protected]; Laodong Guo, University of Southern Mississippi, [email protected]; Wei-Jun Cai, University of Georgia, [email protected]; Xinping Hu, University of Georgia, [email protected]; Scott Noakes, University of Georgia, [email protected], Robert Byrne, University of South Florida, [email protected]; Joseph Salisbury, University of New Hampshire, [email protected]; Douglas Vandemark, University of New Hampshire, [email protected]; James D. Irish, University of New Hampshire, [email protected]
NOAA sponsor and NOAA office of primary technical contact:
NOAA Goal(s):
Project objectives and goals
The principal goals for the NOAA Ocean and Great Lakes Acidification Research Implementation Plan are to:
− develop the monitoring capacity to quantify and track ocean acidification in open-ocean, coastal, and Great Lake systems; − assess the response of marine and freshwater organisms to ocean and lake acidification; − forecast biogeochemical and ecological responses to acidification; − provide a synthesis of ocean and Great Lake acidification data and information that aids in development of tools for managing coastal, open ocean, and Great Lakes ecosystems and preparing human communities for potential OA-related changes; − and provide information about ocean acidification to educators and develop materials for public outreach. This project will involve a close collaboration with NOAA scientists to provide information critical to NOAA’s mission and global concerns regarding ocean acidification and its impacts on ecosystems.
Specific tasks to be accomplished include the following:
1. Deploy and maintain the NOAA partial pressure of carbon dioxide (pCO2) sensor in conjunction with coastal buoy deployments at several locations (USM, UGA, UNH) 2. Provide near-real time quality controlled ancillary meteorological and near-surface ocean environmental data from the buoy to aid in the interpretation of the pCO2 time series (USM, UGA, UNH) 3. Conduct regular water sampling in the vicinity of the buoy for carbon system properties as well as other water quality variables that may include chlorophyll, nutrients, and dissolved oxygen (USM, UGA, UNH) 4. Conduct underway sampling of pCO2 in the Gulf of Mexico and off the U.S. east coast using
ships of opportunity (USF)
174
NGI Progress Report NOAA Award #: NA06OAR4320264
Reporting Period: Jul 1, 2010 - Jun 30, 2011
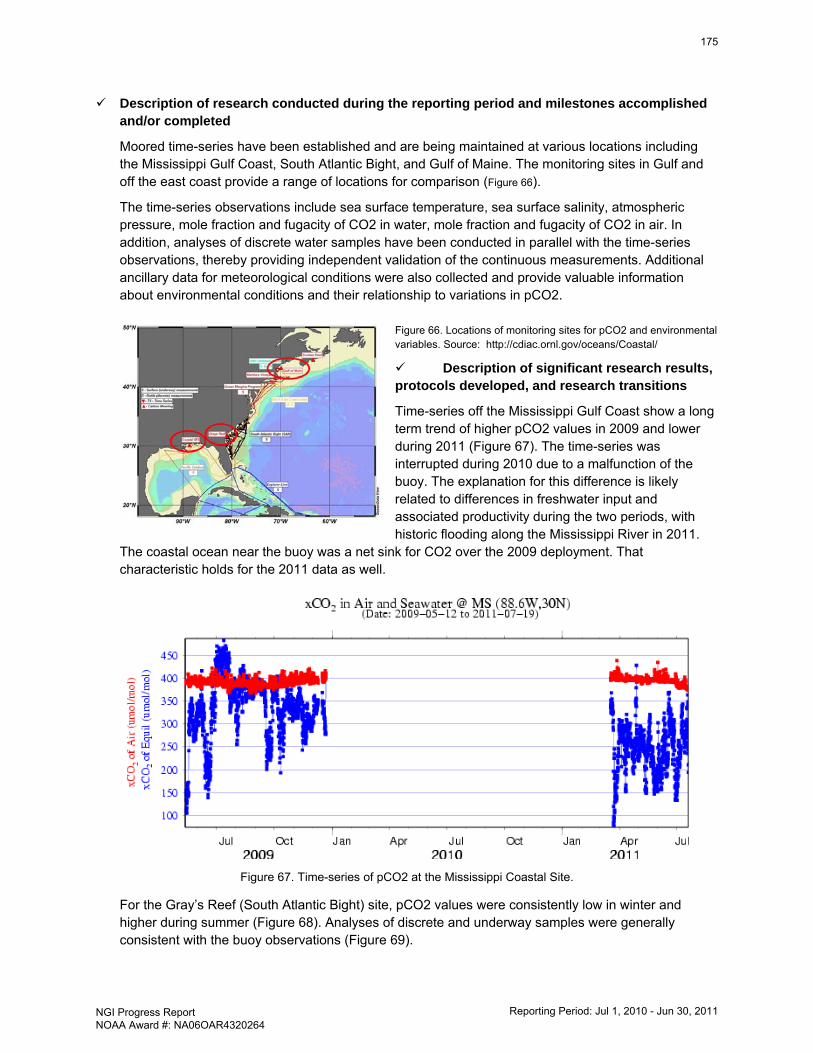
Description of research conducted during the reporting period and milestones accomplished and/or completed
Moored time-series have been established and are being maintained at various locations including the Mississippi Gulf Coast, South Atlantic Bight, and Gulf of Maine. The monitoring sites in Gulf and off the east coast provide a range of locations for comparison (Figure 66).
The time-series observations include sea surface temperature, sea surface salinity, atmospheric pressure, mole fraction and fugacity of CO2 in water, mole fraction and fugacity of CO2 in air. In addition, analyses of discrete water samples have been conducted in parallel with the time-series observations, thereby providing independent validation of the continuous measurements. Additional ancillary data for meteorological conditions were also collected and provide valuable information about environmental conditions and their relationship to variations in pCO2.
Figure 66. Locations of monitoring sites for pCO2 and environmental variables. Source: http://cdiac.ornl.gov/oceans/Coastal/
Description of significant research results, protocols developed, and research transitions
Time-series off the Mississippi Gulf Coast show a long term trend of higher pCO2 values in 2009 and lower during 2011 (Figure 67). The time-series was interrupted during 2010 due to a malfunction of the buoy. The explanation for this difference is likely related to differences in freshwater input and associated productivity during the two periods, with historic flooding along the Mississippi River in 2011.
The coastal ocean near the buoy was a net sink for CO2 over the 2009 deployment. That characteristic holds for the 2011 data as well.
Figure 67. Time-series of pCO2 at the Mississippi Coastal Site.
For the Gray’s Reef (South Atlantic Bight) site, pCO2 values were consistently low in winter and higher during summer (Figure 68). Analyses of discrete and underway samples were generally consistent with the buoy observations (Figure 69).
175
NGI Progress Report NOAA Award #: NA06OAR4320264
Reporting Period: Jul 1, 2010 - Jun 30, 2011
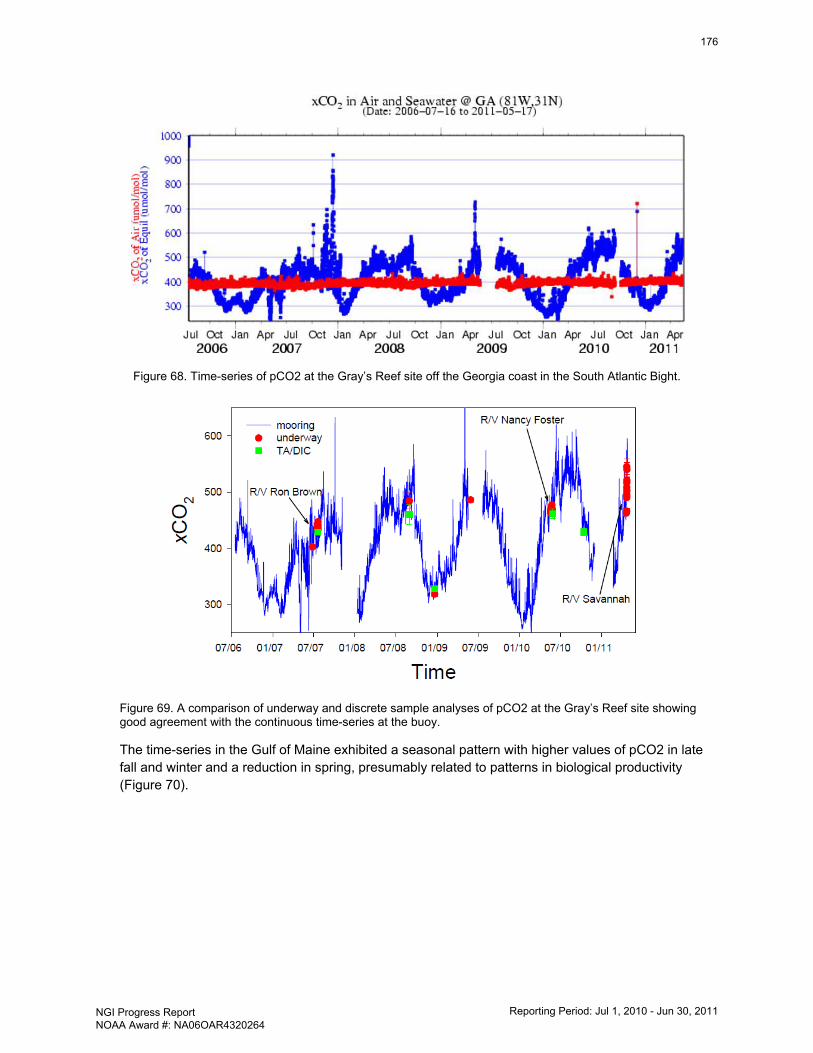
Figure 68. Time-series of pCO2 at the Gray’s Reef site off the Georgia coast in the South Atlantic Bight.
Figure 69. A comparison of underway and discrete sample analyses of pCO2 at the Gray’s Reef site showing good agreement with the continuous time-series at the buoy.
The time-series in the Gulf of Maine exhibited a seasonal pattern with higher values of pCO2 in late fall and winter and a reduction in spring, presumably related to patterns in biological productivity (Figure 70).
176
NGI Progress Report NOAA Award #: NA06OAR4320264
Reporting Period: Jul 1, 2010 - Jun 30, 2011
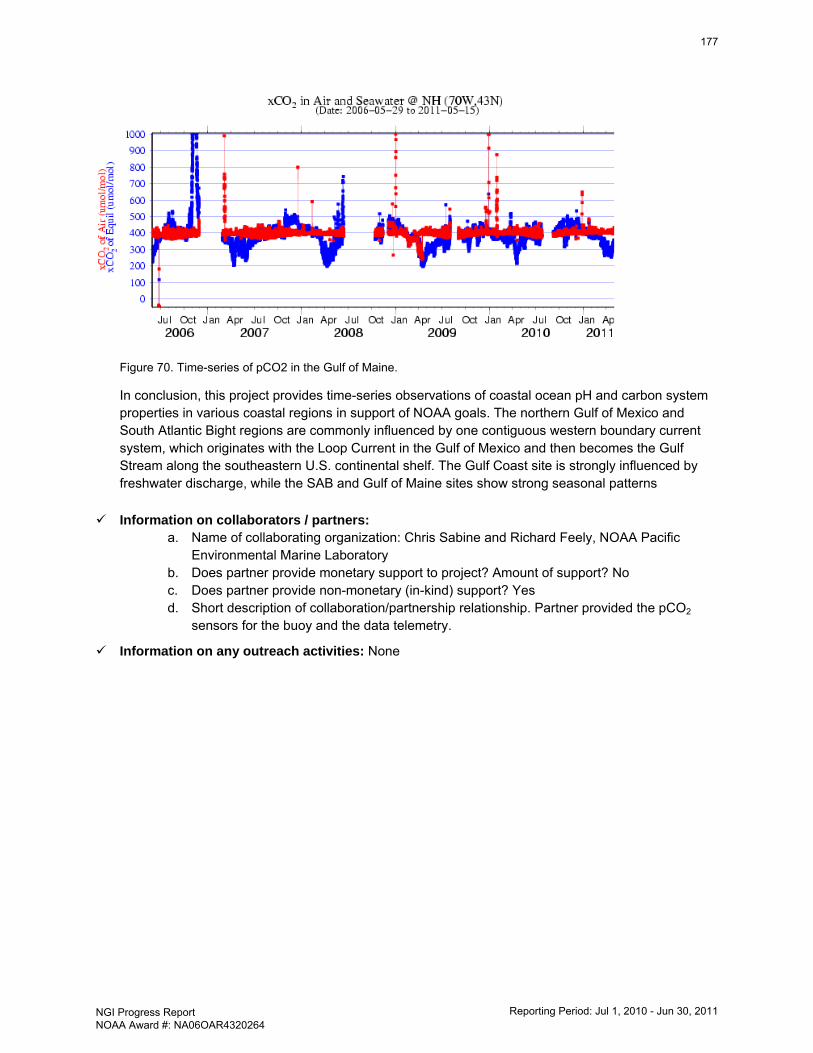
Figure 70. Time-series of pCO2 in the Gulf of Maine.
In conclusion, this project provides time-series observations of coastal ocean pH and carbon system properties in various coastal regions in support of NOAA goals. The northern Gulf of Mexico and South Atlantic Bight regions are commonly influenced by one contiguous western boundary current system, which originates with the Loop Current in the Gulf of Mexico and then becomes the Gulf Stream along the southeastern U.S. continental shelf. The Gulf Coast site is strongly influenced by freshwater discharge, while the SAB and Gulf of Maine sites show strong seasonal patterns
Information on collaborators / partners: a. Name of collaborating organization: Chris Sabine and Richard Feely, NOAA Pacific
Environmental Marine Laboratory b. Does partner provide monetary support to project? Amount of support? No c. Does partner provide non-monetary (in-kind) support? Yes d. Short description of collaboration/partnership relationship. Partner provided the pCO2
sensors for the buoy and the data telemetry.
Information on any outreach activities: None
177
NGI Progress Report NOAA Award #: NA06OAR4320264
Reporting Period: Jul 1, 2010 - Jun 30, 2011
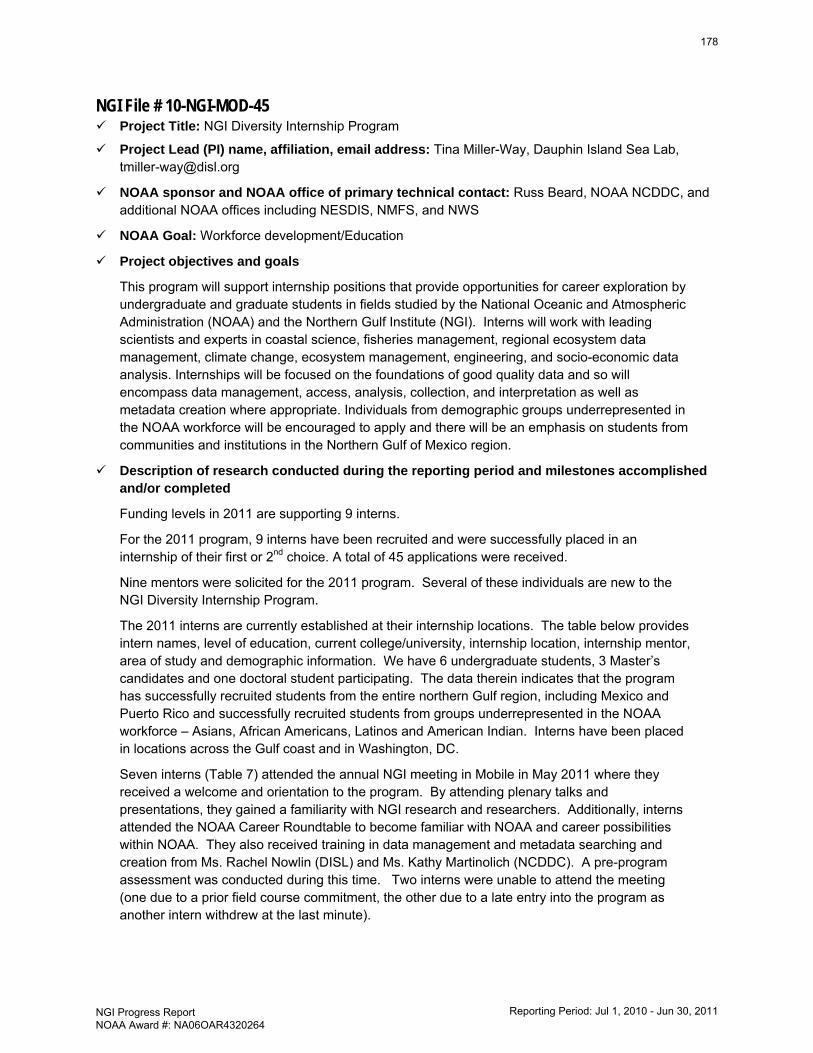
NGI File # 10-NGI-MOD-45 Project Title: NGI Diversity Internship Program
Project Lead (PI) name, affiliation, email address: Tina Miller-Way, Dauphin Island Sea Lab, [email protected]
NOAA sponsor and NOAA office of primary technical contact: Russ Beard, NOAA NCDDC, and additional NOAA offices including NESDIS, NMFS, and NWS
NOAA Goal: Workforce development/Education
Project objectives and goals
This program will support internship positions that provide opportunities for career exploration by undergraduate and graduate students in fields studied by the National Oceanic and Atmospheric Administration (NOAA) and the Northern Gulf Institute (NGI). Interns will work with leading scientists and experts in coastal science, fisheries management, regional ecosystem data management, climate change, ecosystem management, engineering, and socio-economic data analysis. Internships will be focused on the foundations of good quality data and so will encompass data management, access, analysis, collection, and interpretation as well as metadata creation where appropriate. Individuals from demographic groups underrepresented in the NOAA workforce will be encouraged to apply and there will be an emphasis on students from communities and institutions in the Northern Gulf of Mexico region.
Description of research conducted during the reporting period and milestones accomplished and/or completed
Funding levels in 2011 are supporting 9 interns.
For the 2011 program, 9 interns have been recruited and were successfully placed in an internship of their first or 2nd choice. A total of 45 applications were received.
Nine mentors were solicited for the 2011 program. Several of these individuals are new to the NGI Diversity Internship Program.
The 2011 interns are currently established at their internship locations. The table below provides intern names, level of education, current college/university, internship location, internship mentor, area of study and demographic information. We have 6 undergraduate students, 3 Master’s candidates and one doctoral student participating. The data therein indicates that the program has successfully recruited students from the entire northern Gulf region, including Mexico and Puerto Rico and successfully recruited students from groups underrepresented in the NOAA workforce – Asians, African Americans, Latinos and American Indian. Interns have been placed in locations across the Gulf coast and in Washington, DC.
Seven interns (Table 7) attended the annual NGI meeting in Mobile in May 2011 where they received a welcome and orientation to the program. By attending plenary talks and presentations, they gained a familiarity with NGI research and researchers. Additionally, interns attended the NOAA Career Roundtable to become familiar with NOAA and career possibilities within NOAA. They also received training in data management and metadata searching and creation from Ms. Rachel Nowlin (DISL) and Ms. Kathy Martinolich (NCDDC). A pre-program assessment was conducted during this time. Two interns were unable to attend the meeting (one due to a prior field course commitment, the other due to a late entry into the program as another intern withdrew at the last minute).
178
NGI Progress Report NOAA Award #: NA06OAR4320264
Reporting Period: Jul 1, 2010 - Jun 30, 2011
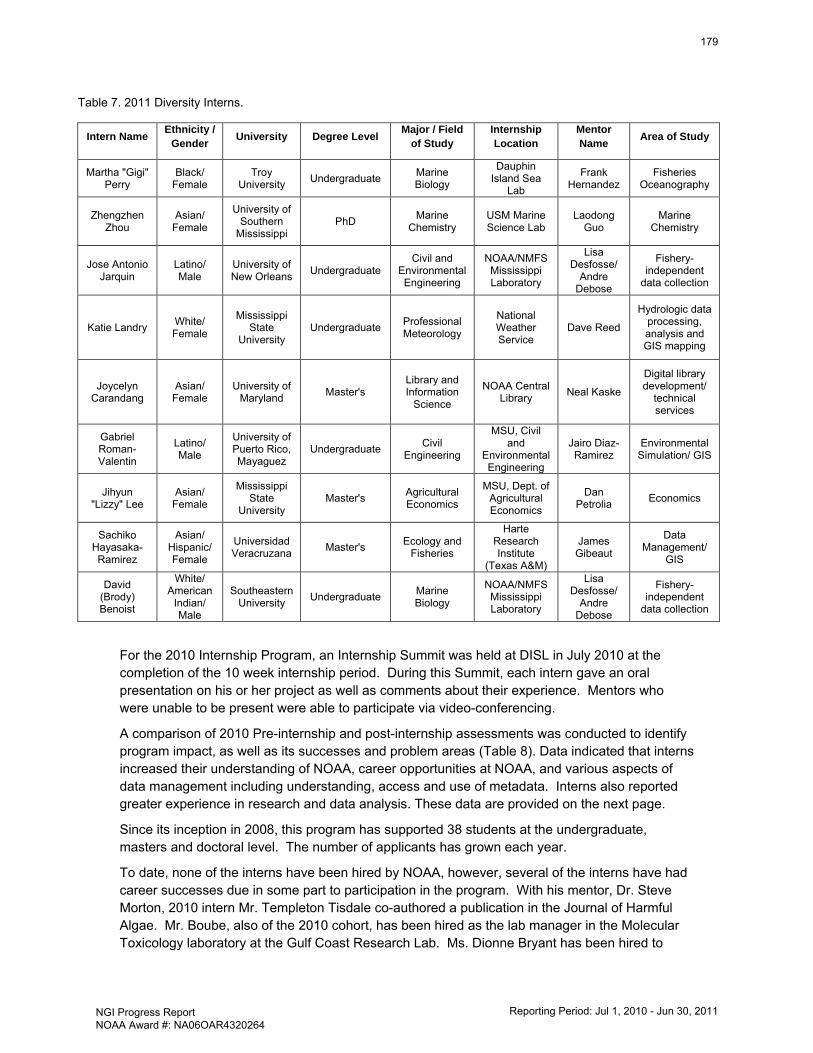
Table 7. 2011 Diversity Interns.
Intern Name Ethnicity / Gender University Degree Level Major / Field
of Study Internship Location
Mentor Name Area of Study
Martha "Gigi" Perry
Black/ Female
Troy University Undergraduate Marine
Biology
Dauphin Island Sea
Lab
Frank Hernandez
Fisheries Oceanography
Zhengzhen Zhou
Asian/ Female
University of Southern
Mississippi PhD Marine
Chemistry USM Marine Science Lab
Laodong Guo
Marine Chemistry
Jose Antonio Jarquin
Latino/ Male
University of New Orleans Undergraduate
Civil and Environmental Engineering
NOAA/NMFS Mississippi Laboratory
Lisa Desfosse/
Andre Debose
Fishery-independent
data collection
Katie Landry White/ Female
Mississippi State
University Undergraduate Professional
Meteorology
National Weather Service
Dave Reed
Hydrologic data processing, analysis and GIS mapping
Joycelyn Carandang
Asian/ Female
University of Maryland Master's
Library and Information
Science
NOAA Central Library Neal Kaske
Digital library development/
technical services
Gabriel Roman-Valentin
Latino/ Male
University of Puerto Rico, Mayaguez
Undergraduate Civil Engineering
MSU, Civil and
Environmental Engineering
Jairo Diaz-Ramirez
Environmental Simulation/ GIS
Jihyun "Lizzy" Lee
Asian/ Female
Mississippi State
University Master's Agricultural
Economics
MSU, Dept. of Agricultural Economics
Dan Petrolia Economics
Sachiko Hayasaka-Ramirez
Asian/ Hispanic/ Female
Universidad Veracruzana Master's Ecology and
Fisheries
Harte Research Institute
(Texas A&M)
James Gibeaut
Data Management/
GIS
David (Brody) Benoist
White/ American
Indian/ Male
Southeastern University Undergraduate Marine
Biology
NOAA/NMFS Mississippi Laboratory
Lisa Desfosse/
Andre Debose
Fishery-independent
data collection
For the 2010 Internship Program, an Internship Summit was held at DISL in July 2010 at the completion of the 10 week internship period. During this Summit, each intern gave an oral presentation on his or her project as well as comments about their experience. Mentors who were unable to be present were able to participate via video-conferencing.
A comparison of 2010 Pre-internship and post-internship assessments was conducted to identify program impact, as well as its successes and problem areas (Table 8). Data indicated that interns increased their understanding of NOAA, career opportunities at NOAA, and various aspects of data management including understanding, access and use of metadata. Interns also reported greater experience in research and data analysis. These data are provided on the next page.
Since its inception in 2008, this program has supported 38 students at the undergraduate, masters and doctoral level. The number of applicants has grown each year.
To date, none of the interns have been hired by NOAA, however, several of the interns have had career successes due in some part to participation in the program. With his mentor, Dr. Steve Morton, 2010 intern Mr. Templeton Tisdale co-authored a publication in the Journal of Harmful Algae. Mr. Boube, also of the 2010 cohort, has been hired as the lab manager in the Molecular Toxicology laboratory at the Gulf Coast Research Lab. Ms. Dionne Bryant has been hired to
179
NGI Progress Report NOAA Award #: NA06OAR4320264
Reporting Period: Jul 1, 2010 - Jun 30, 2011
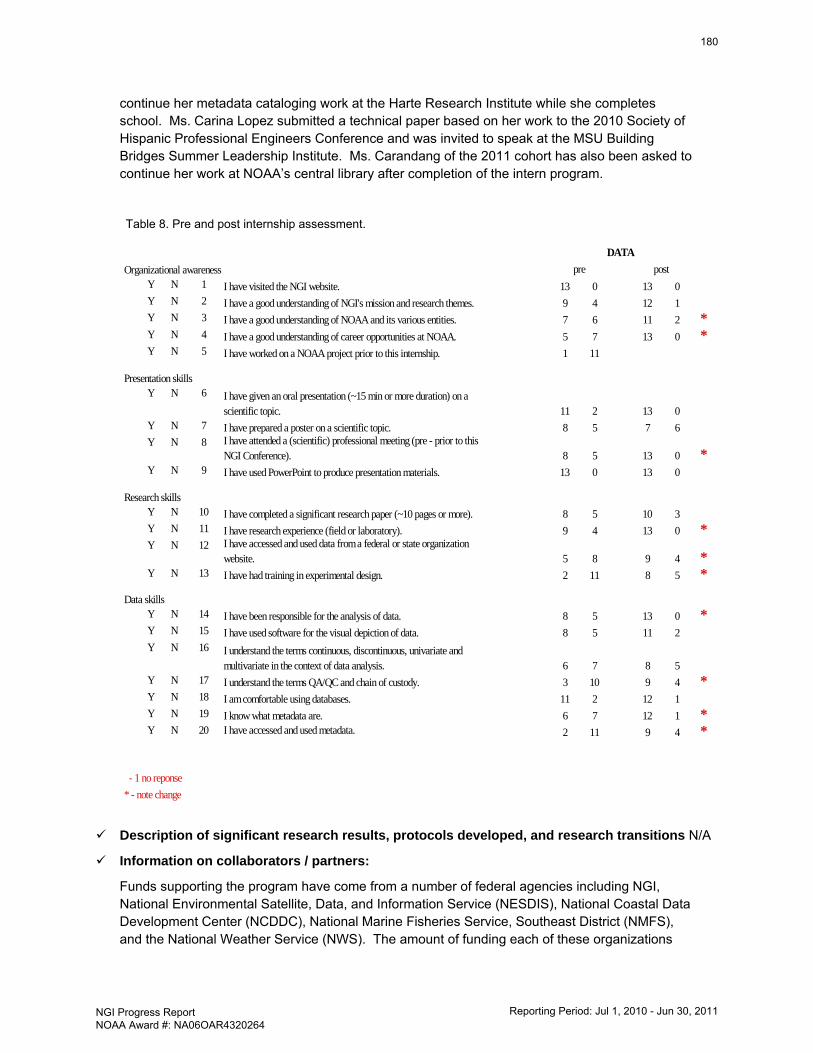
continue her metadata cataloging work at the Harte Research Institute while she completes school. Ms. Carina Lopez submitted a technical paper based on her work to the 2010 Society of Hispanic Professional Engineers Conference and was invited to speak at the MSU Building Bridges Summer Leadership Institute. Ms. Carandang of the 2011 cohort has also been asked to continue her work at NOAA’s central library after completion of the intern program.
Table 8. Pre and post internship assessment.
Description of significant research results, protocols developed, and research transitions N/A
Information on collaborators / partners:
Funds supporting the program have come from a number of federal agencies including NGI, National Environmental Satellite, Data, and Information Service (NESDIS), National Coastal Data Development Center (NCDDC), National Marine Fisheries Service, Southeast District (NMFS), and the National Weather Service (NWS). The amount of funding each of these organizations
Organizational awarenessY N 1 I have visited the NGI website. 13 0 13 0Y N 2 I have a good understanding of NGI's mission and research themes. 9 4 12 1Y N 3 I have a good understanding of NOAA and its various entities. 7 6 11 2 *Y N 4 I have a good understanding of career opportunities at NOAA. 5 7 13 0 *Y N 5 I have worked on a NOAA project prior to this internship. 1 11
Presentation skillsY N 6 I have given an oral presentation (~15 min or more duration) on a
scientific topic. 11 2 13 0Y N 7 I have prepared a poster on a scientific topic. 8 5 7 6Y N 8 I have attended a (scientific) professional meeting (pre - prior to this
NGI Conference). 8 5 13 0 *Y N 9 I have used PowerPoint to produce presentation materials. 13 0 13 0
Research skillsY N 10 I have completed a significant research paper (~10 pages or more). 8 5 10 3Y N 11 I have research experience (field or laboratory). 9 4 13 0 *Y N 12 I have accessed and used data from a federal or state organization
website. 5 8 9 4 *Y N 13 I have had training in experimental design. 2 11 8 5 *
Data skillsY N 14 I have been responsible for the analysis of data. 8 5 13 0 *Y N 15 I have used software for the visual depiction of data. 8 5 11 2Y N 16 I understand the terms continuous, discontinuous, univariate and
multivariate in the context of data analysis. 6 7 8 5Y N 17 I understand the terms QA/QC and chain of custody. 3 10 9 4 *Y N 18 I am comfortable using databases. 11 2 12 1Y N 19 I know what metadata are. 6 7 12 1 *Y N 20 I have accessed and used metadata. 2 11 9 4 *
- 1 no reponse* - note change
pre postDATA
180
NGI Progress Report NOAA Award #: NA06OAR4320264
Reporting Period: Jul 1, 2010 - Jun 30, 2011
has contributed each year has varied. The NOAA liaison for this project, Mr. Russ Beard, has been working to stabilize these contributions by the various organizations and to make the program a recognized program in NESDES EEO efforts.
Information on any outreach activities: i. Type (speaker, workshop, training): Training ii. Name of event: Metadata training iii. Date: May 19, 2011 iv. Location: NGI Annual conference, Mobile, AL v. Description: Training in data management, including metadata reading and
creation using MERMAid by Ms. Kathy Martinolich (NCDDC) and Ms. Rachel Nowlin (DISL)
vi. Approximate Number of Participants: 7
i. Type (speaker, workshop, training): Speaker/Workshop ii. Name of event: NGI Annual conference iii. Date: May 18-20, 2011 iv. Location:, Mobile, AL v. Description: The annual meeting of NGI including plenary speakers, oral and
poster presentations by NGI scientists and students, NOAA Career Roundtable and opportunities for networking with attendees
vi. Approximate Number of Participants: 350
i. Type (speaker, workshop, training): Speaker/Workshop ii. Name of event: Northern Gulf Institute Diversity Internship Summit iii. Date: Jul 25-27, 2010 iv. Location: Dauphin Island Sea Lab, AL v. Description: This was the ‘end of internship’ meeting for 2010 allowing interns,
mentors, program personnel, and DISL scientists to learn about the projects completed under the auspices of the program. Mentors who were not able to be physically present were able to participate via video-conferencing.
vi. Approximate Number of Participants: 20
181
NGI Progress Report NOAA Award #: NA06OAR4320264
Reporting Period: Jul 1, 2010 - Jun 30, 2011
NGI File # 10-NGI-MOD-46 Project Title: Ecosystem Services Valuation Workshop and Support
Project Lead (PI) name, affiliation, email address: Jay Ritchie, Northern Gulf Institute, Mississippi State University,[email protected]
NOAA sponsor and NOAA office of primary technical contact: Becky Allee, NOS Gulf Coast Services Center
NOAA Goals: Ecosystem Mission Goal, Climate Mission Goal
Project objectives and goals
This project supported the Gulf of Mexico Alliance’s Ecosystem Integration and Assessment Priority Issue Team in planning and hosting an Ecosystem Services Valuation workshop that was held June 16-18, 2010, in Bay St. Louis, Mississippi and the subsequent white paper. The goals of this workshop is to build consensus on a common definition of ecosystem services and to identify and prioritize the ecosystem services most relevant to coastal and marine ecosystems in the Gulf of Mexico.
Description of research conducted during the reporting period and milestones accomplished and/or completed
In the 2nd quart of FY10, we were able to 1) Identify possible dates and confirm location, 2) generate a workshop draft agenda, including topics, speakers, items of discussion, 3) develop list of invitees, 4) finalize schedule, 5) send out invitations, 6) plan travel, accommodations, support, and finally 7) hold the Gulf Coast Workshop. During the remainder of the reporting period, we prepared post-workshop white papers on findings and conclusions, including draft POA&M.
Description of significant research results, protocols developed, and research transitions
The results of the workshop will be incorporated into Gulf of Mexico Alliance activities in the area of ecosystem services as well as informing the needs identified in the Roadmap. Workshop outcomes will be developed into a suggested “best practices” document that will be publically available to be utilized by practitioners of ecosystem services. The goals of this workshop is to build consensus on a common definition of ecosystem services and to identify and prioritize the ecosystem services most relevant to coastal and marine ecosystems in the Gulf of Mexico.
Information on collaborators / partners: a. Name of collaborating organization: Harte Research Institute b. Date collaborating established: May 2010 c. Does partner provide monetary support to project? Amount of support? No d. Does partner provide non-monetary (in-kind) support? Yes e. Short description of collaboration/partnership relationship: Co-host of the Ecosystem
Valuation workshop and lead organization for the Ecosystem Valuation Ecollaboratory
Information on any outreach activities: i. Type: Workshop ii. Name of event: Ecosystem Services Valuation Workshop iii. Date: Jun 16-18, 2010 iv. Location: Bay St. Louis, MS v. Description: workshop will be to build consensus on a common definition of
relevant to coastal and marine ecosystems in the Gulf of Mexico vi. Approximate Number of Participants: 45
182
NGI Progress Report NOAA Award #: NA06OAR4320264
Reporting Period: Jul 1, 2010 - Jun 30, 2011
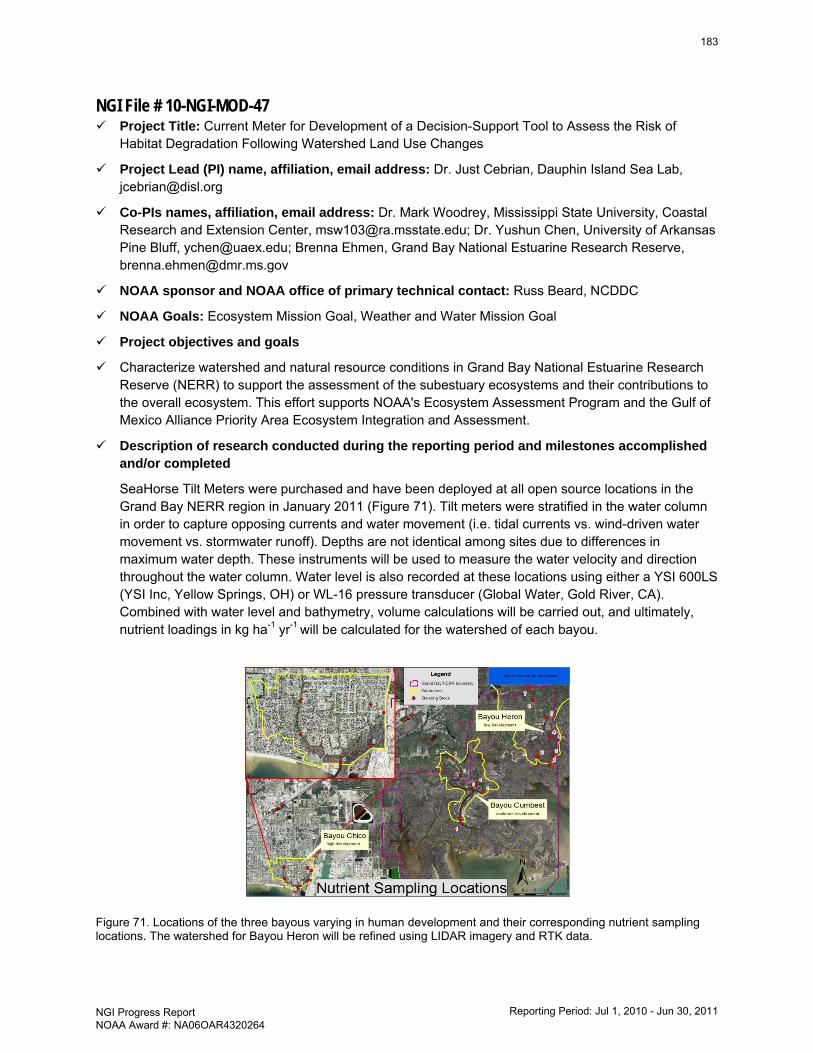
NGI File # 10-NGI-MOD-47 Project Title: Current Meter for Development of a Decision-Support Tool to Assess the Risk of
Habitat Degradation Following Watershed Land Use Changes
Project Lead (PI) name, affiliation, email address: Dr. Just Cebrian, Dauphin Island Sea Lab, [email protected]
Co-PIs names, affiliation, email address: Dr. Mark Woodrey, Mississippi State University, Coastal Research and Extension Center, [email protected]; Dr. Yushun Chen, University of Arkansas Pine Bluff, [email protected]; Brenna Ehmen, Grand Bay National Estuarine Research Reserve, [email protected]
NOAA sponsor and NOAA office of primary technical contact: Russ Beard, NCDDC
NOAA Goals: Ecosystem Mission Goal, Weather and Water Mission Goal
Project objectives and goals
Characterize watershed and natural resource conditions in Grand Bay National Estuarine Research Reserve (NERR) to support the assessment of the subestuary ecosystems and their contributions to the overall ecosystem. This effort supports NOAA's Ecosystem Assessment Program and the Gulf of Mexico Alliance Priority Area Ecosystem Integration and Assessment.
Description of research conducted during the reporting period and milestones accomplished and/or completed
SeaHorse Tilt Meters were purchased and have been deployed at all open source locations in the Grand Bay NERR region in January 2011 (Figure 71). Tilt meters were stratified in the water column in order to capture opposing currents and water movement (i.e. tidal currents vs. wind-driven water movement vs. stormwater runoff). Depths are not identical among sites due to differences in maximum water depth. These instruments will be used to measure the water velocity and direction throughout the water column. Water level is also recorded at these locations using either a YSI 600LS (YSI Inc, Yellow Springs, OH) or WL-16 pressure transducer (Global Water, Gold River, CA). Combined with water level and bathymetry, volume calculations will be carried out, and ultimately, nutrient loadings in kg ha-1 yr-1 will be calculated for the watershed of each bayou.
Figure 71. Locations of the three bayous varying in human development and their corresponding nutrient sampling locations. The watershed for Bayou Heron will be refined using LIDAR imagery and RTK data.
183
NGI Progress Report NOAA Award #: NA06OAR4320264
Reporting Period: Jul 1, 2010 - Jun 30, 2011
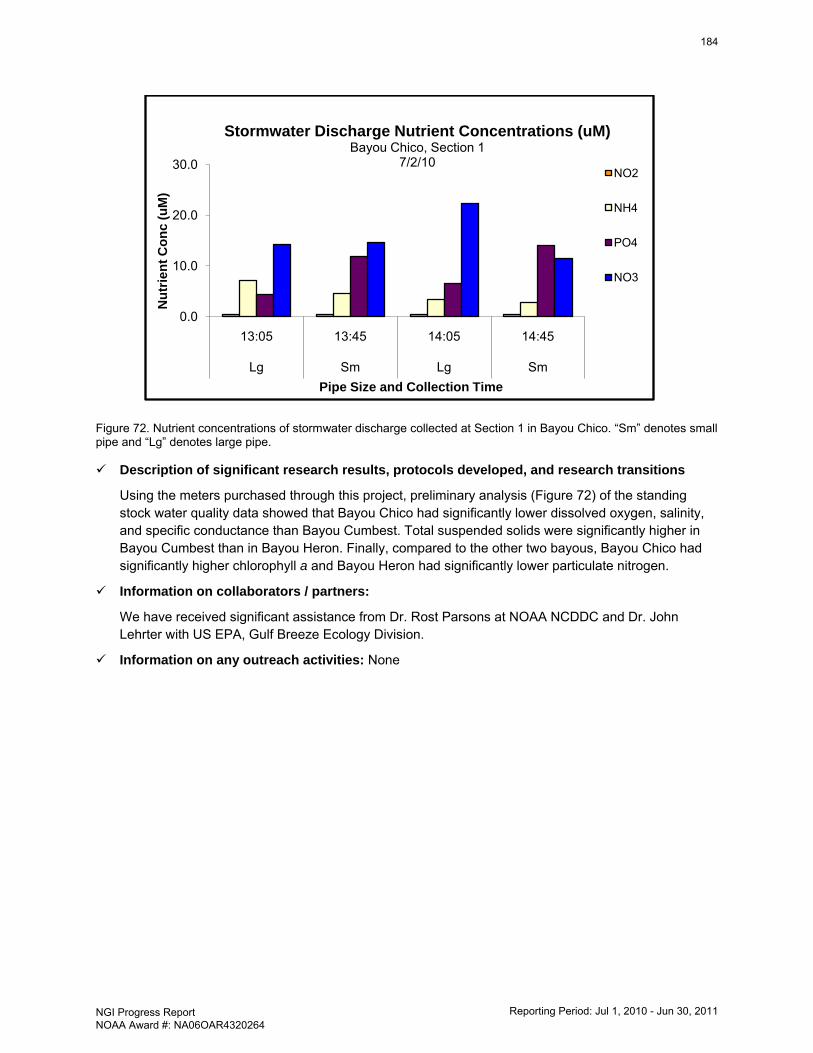
Figure 72. Nutrient concentrations of stormwater discharge collected at Section 1 in Bayou Chico. “Sm” denotes small pipe and “Lg” denotes large pipe.
Description of significant research results, protocols developed, and research transitions
Using the meters purchased through this project, preliminary analysis (Figure 72) of the standing stock water quality data showed that Bayou Chico had significantly lower dissolved oxygen, salinity, and specific conductance than Bayou Cumbest. Total suspended solids were significantly higher in Bayou Cumbest than in Bayou Heron. Finally, compared to the other two bayous, Bayou Chico had significantly higher chlorophyll a and Bayou Heron had significantly lower particulate nitrogen.
Information on collaborators / partners:
We have received significant assistance from Dr. Rost Parsons at NOAA NCDDC and Dr. John Lehrter with US EPA, Gulf Breeze Ecology Division.
Information on any outreach activities: None
0.0
10.0
20.0
30.0
13:05 13:45 14:05 14:45
Lg Sm Lg Sm
Nut
rient
Con
c (u
M)
Pipe Size and Collection Time
Stormwater Discharge Nutrient Concentrations (uM)Bayou Chico, Section 1
7/2/10 NO2
NH4
PO4
NO3
184
NGI Progress Report NOAA Award #: NA06OAR4320264
Reporting Period: Jul 1, 2010 - Jun 30, 2011
NGI File # 10-NGI-MOD-48 Project Title: Ecosystem Approach to Management in The Northern Gulf
Project Lead (PI) name, affiliation, email address: William H. McAnally - Northern Gulf Institute, Mississippi State University, [email protected]
Co-PIs names, affiliation, email address: Just Cebrian, Dauphin Island Sea Lab, [email protected]; Richard Fulford, University of Southern Mississippi Department of Coastal Sciences, [email protected]; Erick Swenson, Louisiana State University Department of Oceanography & Coastal Sciences, [email protected]; John Harding, Northern Gulf Institute, Mississippi State University, [email protected]
NOAA sponsor and NOAA office of primary technical contact: Buck Sutter, NMFS
NOAA Goals: Ecosystem Mission Goal, Weather and Water Mission Goal
Project objectives and goals
The overall goal of this effort is to contribute toward the NOAA goal of an Ecosystem Approach to Management and Coastal and Marine Spatial Planning concepts to systems and regions throughout the northern Gulf of Mexico.
The work will achieve the following objectives: (1) develop indicators that will define ecosystem “States” for previously initiated Integrated Ecosystem Assessments (IEA) of Perdido Bay, Florida; Mississippi Sound, Mississippi; and Barataria Basin, Louisiana; (2) produce a model framework to link State indicators to Drivers and Pressures; and (3) create a prototype system for the northern Gulf that incorporates findings of these IEA.
Previous work on the three estuarine systems examined IEA Pressures and Drivers and recommended steps to complete and extend those efforts.
Description of research conducted during the reporting period and milestones accomplished and/or completed
We have continued to develop Ecological reference points using the Driving Forces-Pressures-State-Impacts-Responses framework and based on the development of Drivers and Pressures accomplished as a part of phase I.
Description of significant research results, protocols developed, and research transitions
We have had multiple discussions with management partners for the Mississippi Sound, Barataria Basin, and Perdido Bay ecosystems focused on identifying consensus ecological indicators of ecosystem health. Most of these discussions have centered on effects of the Deepwater Horizon oil spill and how to integrate this massive incident into a broader ecosystem assessment.
Information on collaborators / partners: None
Information on any outreach activities: A modeling workshop was held January 25-26, 2011 at the Gulf Coast Research Laboratory in Ocean Springs, MS. This workshop was co-supported by the NGI Ecosystem Approach to Management Team and the NGI Ecosystem modeling Team and funded with NGI-BP monies to foster discussion on converting Drivers and Pressures into a conceptual modeling framework. The workshop was attended by over 50 modelers and ecologists from academia as well as state and federal agencies such as the EPA, NOAA, USACE, and Mississippi Department of Marine Resources. The outcome of this workshop was a model framework that will be used to develop a quantitative ecological model,
185
NGI Progress Report NOAA Award #: NA06OAR4320264
Reporting Period: Jul 1, 2010 - Jun 30, 2011
and as a guide point for identifying ecological indicators for four reference coastal ecosystems: Barataria Bay, western Mississippi Sound, Perdido Bay, and Apalachicola Bay
186
NGI Progress Report NOAA Award #: NA06OAR4320264
Reporting Period: Jul 1, 2010 - Jun 30, 2011
NGI File # 10-NGI-MOD-49 Project Title: Sea Grant Peer Listening Network Support Project
Project Lead (PI) name, affiliation, email address: Jay Ritchie, Northern Gulf Institute, Mississippi State University, [email protected]
Co-PI(s) name(s), affiliation, email address
NOAA sponsor and NOAA office of primary technical contact: Todd Davison, NOS Gulf Coast Services Center
NOAA Goal(s): Workforce development/Education
Project objectives and goals
The application of the peer-listening concept to communities impacted by oil spills was pioneered in Alaska following the Exxon Valdez oil spill. The peer-listening approach trains residents of impacted communities how to listen and informally counsel others. This project provides coordination, management and funding support to publish and distribute a Gulf of Mexico specific Peer-Listening Training manual and DVD to support Sea Grant’s efforts to enable communities to establish Peer-Listening networks.
This project provides coordination, management and funding support to publish and distribute a Gulf of Mexico specific Peer-Listening Training manual and DVD to support Sea Grant’s efforts to enable communities to establish Peer-Listening networks.
Description of research conducted during the reporting period and milestones accomplished and/or completed
–NGI supported the coordination, printing and delivery of training manuals. NGI also supported arranging travel for trainers participating in the Sea Grant Peer Listening Network Support Project workshop.
Description of significant research results, protocols developed, and research transitions Not applicable
Information on collaborators / partners: a. Name of collaborating organization: Mississippi Alabama Sea Grant b. Date collaborating established: Sep 2010 c. Does partner provide monetary support to project? Amount of support? No d. Does partner provide non-monetary (in-kind) support? Yes e. Short description of collaboration/partnership relationship: This project directly supports
MS/AL Sea Grant’s Peer Listening Program
Information on any outreach activities: None
187
NGI Progress Report NOAA Award #: NA06OAR4320264
Reporting Period: Jul 1, 2010 - Jun 30, 2011
NGI File # 10-NGI-MOD-50 Project Title: Well-being Indicators and Collection of Oral Histories/Project
Project Lead (PI) name, affiliation, email address: Jay Ritchie, Northern Gulf Institute, Mississippi State University, [email protected]
Co-PI(s) name(s), affiliation, email address: Louis Kyriakoudes, University of Southern Mississippi, [email protected]
NOAA sponsor and NOAA office of primary technical contact: Susan Abbott-Jamieson, NOAA National Marine Fisheries Service, Office of Science and Technology
NOAA Goal(s): Ecosystems Mission Goal
Project objectives and goals
This project employs oral history methods to document the human experience in fishing communities affected by the Deepwater Horizon (DWH) oil spill disaster. Oral histories are providing narrative data about local experience with the DWH oil spill for the Gulf of Mexico Fishery Management Council, state fishery agencies, and NOAA fishery managers as they rebuild fish stocks and sustain fishing and fishing ports in the region.
Description of research conducted during the reporting period and milestones accomplished and/or completed
During reporting period, interview protocols developed in consultation with NOAA anthropologist. Community contacts developed with subject communities, including Vietnamese- American communities in Louisiana, Mississippi and Alabama & United Houma Nation in Louisiana. Summer contract interviewers identified, trained and out working in the field. Six substantial interviews accomplished and are undergoing transcription and inductive coding.
Description of significant research results, protocols developed, and research transitions
None to date
Information on collaborators / partners: None
Information on any outreach activities: None
188
NGI Progress Report NOAA Award #: NA06OAR4320264
Reporting Period: Jul 1, 2010 - Jun 30, 2011
NGI File # 10-NGI-MOD-51 Project Title: 2011 Summer Internship for the NGI Ecosystem Data Assembly Center
Project Lead (PI) name, affiliation, email address: Sharon Hodge, Northern Gulf Institute, Mississippi State University, [email protected]
NOAA sponsor and NOAA office of primary technical contact: Russ Beard, NOAA NCDDC
NOAA Goals: Technology and Mission Support Goal, Workforce Development/Education
Project objectives and goals
The National Coastal Data Development Center (NCDDC), located at Stennis Space Center, MS, is searching for qualified summer student interns to participate in the continued development of the Ecosystem Data Assembly Center (EDAC) hosted at NOAA’s Northern Gulf Institute. The ideal summer student intern would be an undergraduate or rising college freshman with an interest or declared major in Engineering, Computer Science, Biology Social Science or GeoSciences with strong computer skills.
Three primary intern tasks have been identified. In the first task, the incumbent works under NCDDC and National Centers for Coastal Ocean Science on programming that supports Gulf of Mexico data and ingesting them into the EDAC architecture. The second task focuses on assisting NCDDC and NGI staff on the continuing work of generating socioeconomic maps and geospatially cataloging data/emergency services related to response and preparedness for extreme weather events in the Gulf of Mexico. The third task targets computer science majors with an interest in configuring and maintaining a diverse IT infrastructure used to support ecosystem data management. Summer interns would be exposed to the broad range of ongoing research efforts within the NGI and the relationship of those efforts to the EDAC. Finally, during the internship, the student will gain knowledge of NOAA activities and the potential career paths NOAA can offer. The summer internship is programmed for 10 weeks and began in June 2011.
Description of research conducted during the reporting period and milestones accomplished and/or completed
NGI was awarded this project just a couple of weeks before the end of this reporting period. EDAC Interns applications were reviewed, interns were selected and hired and began tasks in EDAC programming, NOAA Extreme Weather Information Sheet distribution and tracking, and information technology support.
Description of significant research results, protocols developed, and research transitions N/A
Information on collaborators / partners: Collaboration with NCDDC to support EDAC Internship Program for 2011. NGI Program office continues to build programs with NCDDC to address important NOAA needs
Information on any outreach activities: None
189
NGI Progress Report NOAA Award #: NA06OAR4320264
Reporting Period: Jul 1, 2010 - Jun 30, 2011
APPENDIX 1. PUBLICATION DOCUMENTATION
CI Nam
ePI N
ame / Author N
ames
Publication DatePublication Title
Published In (Journal Nam
e, volume and page num
ber)Type of
PublicationCitation N
o. (Digital O
bject Identifier)
Research Support Aw
ard No.
CI Lead Author
NOAA
Lead Author
Other Lead Author
Peer Review
edNon Peer
Reviewed
NGI
Bourgoin, S.5/20/2011
The variability of certain life‐history parameters of early juvenile gag grouper
(Mycteroperca m
icrolepis, Pisces: Serrenidae) in the northern Gulf of M
exico Ph. D. Thesis defense, Florida State U
niversityPresentation
NA06O
AR4320264
NGI
Bourgoin, S., D. Thistle, C. Koenig, S. Harter, and E. Easton5/18/2011
The gag roller coasterAnnual N
orthern Gulf Institute Conference, M
ay 17‐19, Mobile, AL
PresentationNA06O
AR4320264NGI
Boyette, A.D., and D.G. Redalje
12/1/2010Prim
ary production distributions along the river‐influenced shoreline of the Bay of Saint Louis, M
SBays and Bayous Sym
posium, Decem
ber 1‐2, Mobile, AL
PresentationNA06O
AR4320264
NGI
Carr, M., S. W
ang, T. McLean, C. Flood and R. Ellender
2010Salm
onella rarely detected in Mississippi coastal w
aters and sediment
Journal of Applied Microbiology 109:2191‐2199
Journal Article10.1111/j.1365‐2672.2010.04851.x
NA06O
AR4320264X
NGI
Cebrian J., B. Christiaen, J. Lehrter, J. Stutes, and A. Anton3/16/2011
Disparate im
pacts of eutrophication in shallow coastal system
s of the northern Gulf
of Mexico
Benthic Ecology Meeting, M
arch 16‐20, Mobile, AL
PresentationNA06O
AR4320264X
NGI
Chen Y., J. Cebrian, B. Christiaen, and J. Stutes3/5/2010
Synergistic effects of watershed developm
ent and climatic events on ecosystem
health in Perdido Bay lagoons, Florida
Ecological Society of America Annual M
eeting, Aug 1‐6, Pittsburgh, PAPresentation
NA06O
AR4320264
NGI
Chen Y., J. Cebrian, B. Christiaen, and J. Stutes2/2/2011
Effects of watershed developm
ent and climate events on ecosystem
health in lagoons in the north central G
ulf of Mexico
Joint Meeting of the Arkansas Chapters of the Am
erican Fisheries Society and the W
ildlife Society, Feb 2‐4, Little Rock, ARPresentation
NA06O
AR4320264
NGI
Chen, Q. and H. Zhao
5/18/2011Surge‐dependent vegetation effects on hurricane‐generated w
avesAnnual N
orthern Gulf Institute Conference, M
ay 17‐19, Mobile, AL
PresentationNA06O
AR4320264X
NGI
Chen, Q., L. Zhu, Q
. Fan, and X. Wan
6/3/2011Num
erical modeling of nonlinear w
ater waves w
ith sigma coordinate
ASCE‐EMI Engineering M
echanics Conference, Jun 2‐6, Boston, MA
PresentationNA06O
AR4320264X
NGI
Christiaen B., J. Stutes, J. Goff, and J. Cebrian
12/1/2010Living on the edge: ecosystem
dynamics in shallow
coastal lagoons in the NW Gulf of
Mexico
Bays and Bayous Symposium
, December 1‐2, M
obile, ALPresentation
NA06O
AR4320264
NGI
Christiaen B., J. Stutes, J. Lehrter, and J. Cebrian3/16/2011
Tidal exchange of organic matter in shallow
lagoons in the NW Gulf of M
exicoBenthic Ecology M
eeting, March 16‐20, M
obile, ALPresentation
NA06O
AR4320264NGI
Coleman, F.
5/18/2011Ecological studies of biogenic habitats in the shallow
waters of the northeastern G
ulf of M
exico Annual N
orthern Gulf Institute Conference, M
ay 17‐19, Mobile, AL
PresentationNA06O
AR4320264X
NGI
Czubakowski, J.
2010Estuarine phytoplankton response to annual and m
anipulated river inputsMS Thesis, Louisiana State U
niversityPublication List
NA06O
AR4320264NGI
Das, A., D. Justic, E. Swenson, R. E. Turner, M
. Inoue, and D. Park
2011Coastal land loss and hypoxia: The ‘outw
elling’ hypothesis revisitedEnvironm
ental Research Letters 6(025001):1‐9Journal Article
10.1088/1748‐9326/6/2025001NA06O
AR4320264
NGI
Diaz‐Ramirez, J. N
., W. H. M
cAnally, and J. L. Martin
9/9/2010Rainfall Database Effects on Hydrology Sim
ulation in a Small Coastal Catchm
entAlabam
a Water Resources Conference, Sep 9‐10, O
range Beach, ALPresentation
NA06O
AR4320264X
NGI
Diaz‐Ramirez, J. N
., W. H. M
cAnally, J. L. Martin, K.
McN
eal, J. E. Ezell, J. Sharp, K. Pevey, M. Follum
, and S. P hipps
9/9/2010
Assessment of W
eeks Bay and Its Watershed
Alabama W
ater Resources Conference, Sep 9‐10, Orange Beach, AL
PresentationNA06O
AR4320264X
NGI
Diercks, A.‐R., R. C. Highsm
ith, V. L. Asper, D. Joung, Z. Zhou, L. G
uo, A. M. Shiller, S. B. Joye, A. P. Teske, N
. Guinasso, T. L. W
ade, and S. E. Lohrenz2010
Characterization of subsurface polycyclic aromatic hydrocarbons at the Deepw
ater Horizon site
Geophysical Research Letters, 37(20), L20602, 6 pp.Journal Article
10.1029/2010gl045046NA06O
AR4320264
NGI
Dong, Q. and Z.‐P. Lee
5/182011Variability of organic and inorganic particles in the N
orthern Gulf of M
exicoAnnual N
orthern Gulf Institute Conference, M
ay 17‐19, Mobile, AL
PresentationNA06O
AR4320264NGI
Dornback, M
. and S. Lohrenz11/3/2010
Ph ytoplankton Biomass Variability in a W
estern Mississippi Sound Tim
e‐SeriesMississippi W
ater Resources Conference, Nov 3‐5, Bay St. Louis, M
SPresentation
NA06O
AR4320264X
NGI
Dornback, M
. and S. Lohrenz2/18/2011
Temporal and spatial variations in phytoplankton biom
ass in Mississippi coastal
waters
ASLO Aquatic Sciences M
eeting, Feb 13‐18, San Juan, Puerto RicoPresentation
NA06O
AR4320264X
NGI
Dornback, M
. and S. Lohrenz12/1/2010
Phytoplankton abundance in relation to environmental disturbances in the w
estern Mississippi Sound
Bays and Bayous Symposium
, December 1‐2, M
obile, ALPresentation
NA06O
AR4320264
NGI
Dukhovskoy, D. S., S. L. Morey, E. P. Chassignet, O
. Garcia,
and I. MacDonald
5/18/2011Objective evaluation of oil spill m
odels using SAR imagery
Annual Northern G
ulf Institute Conference, May 17‐19, M
obile, ALPresentation
NA06O
AR4320264
NGI
Durbha, S. S., R. L. King, S. K. Amanchi, S. Bheem
ireddy, and N
. H. Younan2010
Standards Based Middlew
are and Tools for the Coastal Sensor Web Applications
IEEE Journal of Selected Topics in Applied Earth Observations and
Remote Sensing 3(4):451‐466
Journal Article10.1109/JSTARS.2010.2056674
XX
Publication Request Template for CI's
FY11 Annual Progress Report Request
g()
/NGI
Dyer, J., P. Am
burn, D. Reed, and D. Welch
1/24/2011Utility of 2D
/3D Visualization Methods in Analyzing and Dissem
inating Flood Inform
ationAm
erican Meteorological Society Annual M
eeting, Jan 24‐26, Seattle, WA
erence ProceedignsNA06O
AR4320264X
NGI
Easton, E., S. Bourgoin, D. Thistle, S. Harper, C. Koenig, and A. David
5/18/2011The variability of certain life‐history param
eters of early juvenile gag grouper (M
ycteroperca microlepis, Pisces: Serrenidae) in the northern G
ulf of Mexico
Annual Northern G
ulf Institute Conference, May 17‐19, M
obile, ALPresentation
NA06O
AR4320264
NGI
Eilertsen, J., K. A. Gallivan, L. M
athelin, and S. Morey
5/18/2011Uncertainty quantification of oil spills
Annual Northern G
ulf Institute Conference, May 17‐19, M
obile, ALPresentation
NA06O
AR4320264NGI
Feng, Z., and C. Li2010
Cold‐front‐induced flushing of the Louisiana BaysJournal of M
arine Systems 82: 252‐264
Journal Article10.1016/j.jm
arsys.2010.05.015 NA06O
AR4320264X
NGI
Fitzpatrick, P. J.11/2/2010
Modeling efforts at M
SU and U
SA relevant to ADCIRC Surge Guidance System
Coastal Hazards Collaboratory Kick O
ff Meeting, N
ov 2‐3, New
Orleans,
LAPresentation
NA06O
AR4320264X
NGI
Fitzpatrick, P. J.02/08/11
Alternative MRG
O salinity plan
MRG
O Ecosystem
Restoration PlanPresentation
NA06O
AR4320264X
NGI
Fitzpatrick, P. J.07/11/11
An overview on hurricanes and storm
surgeNational Science Foundation sum
mer teacher training project, Stennis
Space Center, MS
PresentationNA06O
AR4320264X
NGI
Fitzpatrick, P. J., C. Hill, J. Corbin, Y. Lau, and S. Bhate06/15/11
From research to peer‐review
publication: a Northern G
ulf Coast sea breeze studyNaval Research Laboratory sum
mer sem
inar series, Stennis Space Center, M
SPresentation
NA06O
AR4320264X
NGI
Fitzpatrick, P. J., C. M. Hill, Y. Lau, H. Karan, and G
. Mostovoy
5/17/2011Hurricane w
ind analyses schemes using HW
RF GSI amd 4 DVAR
Annual Northern G
ulf Institute Conference, May 17‐19, M
obile, ALPresentation
NA06O
AR4320264X
NGI
Fitzpatrick, P. J., Y. Lau, and C. M. Hill
1/31/2011Meteorological m
odelingCenter for the Study of N
atural Hazards and Disasters Departm
ent of Hom
eland Security Center of Excellence Annual Meeting, Jan 31 ‐ Feb
1, Chapel Hill, NC
PresentationNA06O
AR4320264X
NGI
Fitzpatrick, P. J., Y. Lau, and C. M. Hill
04/08/11An overview
of GRI‐SSC research
Louisiana State University, Dept. of Civil Engineering, Baton Rouge, LA
PresentationNA06O
AR4320264X
NGI
Fitzpatrick, P. J., Y. Lau, and C. M. H
ill4/18/2011
A new storm
surge scale demonstrating the vulnerability of the N
orthern Gulf Coast
National Hurricane Conference, Apr 18‐21, Atlanta, G
APresentation
NA06O
AR4320264X
NGI
Fitzpatrick, P. J., Y. Lau, and C. M. Hill
04/22/11An overview
of GRI‐SSC research
Univ. of South Florida, Dept. of M
arine Sciences seminar series, St.
Petersburg, FL Presentation
NA06O
AR4320264X
NGI
Fitzpatrick, P. J., Y. Lau, and C. M. Hill
04/01/11An overview
of GRI‐SSC research
Univ. of Southern M
ississippi, Dept. of Marine Sciences Sem
inar Series, Stennis Space Center, M
S Presentation
NA06O
AR4320264X
NGI
Fitzpatrick, P. J., Y. Lau, J. Chen, V. Anantharaj, and S. Shean
5/18/2011Wetland erosion issues near the Caernarvon freshw
ater diversionAnnual N
orthern Gulf Institute Conference, M
ay 17‐19, Mobile, AL
PresentationNA06O
AR4320264X
NGI
Flood, C., J. Ufnar, S. W
ang, M. Carr, and R. Ellender
2011Lack of correlation betw
een enterococcal counts and th e presence of human specific
fecal markers in M
ississippi creek and coastal waters
Water Research 45:872‐878
Journal Article10.1016/j.w
atres.2010.09.026NA06O
AR4320264X
NGI
Fodrie, F. J., and K. L. Heck, Jr.
3/16/2011Early response of coastal fishes to the G
ulf of Mexico oil disaster
Benthic Ecology Meeting, M
arch 16‐20, Mobile, AL
PresentationNA06O
AR4320264NGI
Fodrie, F. J., and K. L. Heck, Jr.
2011Response of coastal fishes to the G
ulf of Mexico oil disaster
PLoS ONE 6(7): e21609
Journal Article10.1371/journal.pone.0021609
NA06O
AR4320264X
NGI
Fry, B. and B. Boyd2010
Oxygen concentration and isotope studies of productivity and respiration on the
Louisiana continental shelf, July 2007Naohiko O
hkouchi, Ichiro Tayasu, and Keisuke Koba (eds), Earth, Life, and Isotopes, Kyoto U
niversity Press, pp. 223‐241Publication List
NA06O
AR4320264X
NGI
Fulford, R. S.12/4/2010
Putting wings on a bus: Ecosystem
‐based tools for maangem
ent of estuarine system
sInvited sem
inar at Dauphin Island Sea Lab and the USACE ERDC
PresentationNA06O
AR4320264X
NGI
Fulford, R. S. 5/16/2011
Putting wings on a bus: Ecosystem
‐based tools for managem
ent of estuarine system
sInvited presentation at the U
SEPA Gulf Ecology Division
PresentationNA06O
AR4320264X
NGI
Fulford, R. S., M. S. Peterson, and P. O
. Gram
mer
5/17/2011Identifying critical habitat across m
ultiple scales for estuarine dependent fishes with
a landscape modeling approach
Annual Northern G
ulf Institute Conference, May 17‐19, M
obile, ALPresentation
NA06O
AR4320264X
NGI
Fulford, R. S., M. S. Peterson, and P. O
. Gram
mer
2011
An ecological model of the habitat m
osaic in estuarine nursery areas: Part I ‐ interaction of dispersal theory and habitat variaibiltiy in describing juvenile fish distributions
Ecological modelling: in press
Journal ArticleNA06O
AR4320264X
NGI
Fulford, R. S., M. S. Peterson, H. Perry, and P. O
. Grammer
5/18/2011Developm
ent of model‐based tools for ecosystem
managem
ent in the northern Gulf
of Mexico
Annual Northern G
ulf Institute Conference, May 17‐19, M
obile, ALPresentation
NA06O
AR4320264X
NGI
Garland, H. G., D. L. Kim
bro, R. A. Hughes, and T. Miller
5/18/2011The use of standard elem
ental analysis‐isotope ratio mass spectrom
etry to quantify the am
ount and origin of hydrocarbons in marshes along the northeastern G
ulf coast Annual Northern G
ulf Institute Conference, May 17‐19, M
obile, ALPresentation
NA06O
AR4320264
NGI
Gokaraju, B., S. S. Durbha, R. L. King, and N
. H. Younan7/26/2010
An improved ensem
ble approach for reduction of false alarm rate in harm
ful algal bloom
detectionIEEE International Geoscience and Rem
ote Sensing Symposium
, Jul 25‐30, H
onolulu, HIConference Proceedigns
NA06O
AR4320264
NGI
Gornish, E. S. and T. E. Miller
5/18/2011How
to use long‐term data to predict persisting effects of the Deepw
ater Horizon oil spill
Annual Northern G
ulf Institute Conference, May 17‐19, M
obile, ALPresentation
NA06O
AR4320264
NGI
Gouillon, F., S. L. Morey, D. S. Dukhovskoy, and J. J. O
'Brien2010
Forced tidal response in the Gulf of M
exicoJournal of Geophysical Research 115:C10050
Journal Article10.1029/2010JC006122
NA06O
AR4320264X
NGI
Harri, A., A. Muham
mad, and K. Jones
7/27/2010Market integration for shrim
p and the effect of catastrophic eventsAgricultural and Applied Econom
ics Association Annual Meeting, Jul 25‐
27, Denver, COPresentation
NA06O
AR4320264
NGI
He, H. and L. Guo
5/17/2011Spatial and tem
poral variations in nutrient species in Lake PontchartrainAnnual N
orthern Gulf Institute Conference, M
ay 17‐19, Mobile, AL
PresentationNA06O
AR4320264NGI
Heath, N., M
. Bourassa, D. Dukhovskoy, and J. Ahlquist5/18/2011
Determining the effects of Stokes Drift on the m
ovement of oil in the G
ulf of Mexico
Annual Northern G
ulf Institute Conference, May 17‐19, M
obile, ALPresentation
NA06O
AR4320264
NGI
Heck, Jr., K. L, F. J. Fodrie and D. Byron5/17/2011
Climate‐related ichthyofaunal shifts in the northern G
ulf of Mexico: Im
plications for estuarine ecology and nearshore fisheries
Annual Northern G
ulf Institute Conference, May 17‐19, M
obile, ALPresentation
NA06O
AR4320264X
NGI
Hill, C. M., P. J. Fitzpatrick, and Y. Lau
2/28/2011Direct interpretation of CO
SMIC refractivity data on the tropical cyclone
environment
Interdepartmental Hurricane Conference, Feb 28 ‐ M
ar 3, Miam
i, FLPresentation
NA06O
AR4320264X
NGI
Hill, C. M., Y. Lau, and P. J. Fitzpatrick
5/18/2011Multiple observational platform
analysis of recent Gulf hurricanes
Annual Northern G
ulf Institute Conference, May 17‐19, M
obile, ALPresentation
NA06O
AR4320264X
XNGI
Hu, K. and Q
. Chen5/17/2011
Directional spectra of hurricane waves in the G
ulf of Mexico
Annual Northern G
ulf Institute Conference, May 17‐19, M
obile, ALPresentation
NA06O
AR4320264X
XNGI
Hu, K., Q
. Chen, H. Zhao, J. Tao, L. Jiang, and S. R. Brandt5/17/2011
Num
erical experiments on ecosystem
restoration and flood risks reduction in the Northern G
ulf Coast – a need for integrated cyberinfrastructure.Annual N
orthern Gulf Institute Conference, M
ay 17‐19, Mobile, AL
PresentationNA06O
AR4320264X
NGI
Huang, H., D. Justic, K. A. Rose, and C. Li5/17/2011
The feasibility of using Caernarvon Freshwater Diversion to prevent oil slicks from
flushing into the Breton Sound Estuary
Annual Northern G
ulf Institute Conference, May 17‐19, M
obile, ALPresentation
NA06O
AR4320264X
NGI
Huang, H., D. Justic, K. A. Rose, and C. Li4/29/2010
The feasibility of using Caernarvon Freshwater Diversion to prevent oil slicks from
flushing into the Breton Sound Estuary
Deepwater Horizon O
il Spill Conference Apr 29, Baton Rouge, LAPresentation
NA06O
AR4320264X
NGI
Huettel, M
., J. Kostka, J. Kaba, and C. Hagan
5/18/2011Buried oil layers in G
ulf of Mexico beach sands and their im
pact on sediment
physical and biogeochemical characteristics
Annual Northern G
ulf Institute Conference, May 17‐19, M
obile, ALPresentation
NA06O
AR4320264X
NGI
Justic, D., K. A. Rose, L. Wang, A. Hoda, and H. Huang
2/15/2011Beyond conventional m
odeling of coastal hypoxia: Coupling three‐dimentional
hydrodynamic‐biological hypoxia m
odels with individual based fish m
odelsASLO
Aquatic Sciences Meeting, Feb 13‐18, San Juan, Puerto Rico
PresentationNA06O
AR4320264X
NGI
Justic, D., K. A. Rose, L. Wang, and H. Huang
5/18/2011From
physics to fish: Coupling three‐dimentional hydrodynam
ic‐biological hypoxia models w
ith individual based fish models
Annual Northern G
ulf Institute Conference, May 17‐19, M
obile, ALPresentation
NA06O
AR4320264X
X
NGI
Kim, G
., D. R. Petrolia, and M. G
. Interis5/18/2011
Improving value estim
ates for restoration of Mississippi’s Barrier Islands
Annual Northern G
ulf Institute Conference, May 17‐19, M
obile, ALPresentation
NA06O
AR4320264NGI
Kim, G
., D. R. Petrolia, and M. G
. Interis12/1/2010
Using m
ultiple‐scenario contingent valuation data to estimate w
illingness to pay for restoration of M
ississippi’s Barrier IslandsBays and Bayous Sym
posium, Decem
ber 1‐2, Mobile, AL
PresentationNA06O
AR4320264
NGI
Kim, G
., D. R. Petrolia, and M. G
. Interis2/5/2011
Using m
ultiple‐scenario contingent valuation data to estimate w
illingness to pay for restoration of M
ississippi’s Barrier IslandsSouthern Agricultural Econom
ics Association Annual Meeting, Feb 5‐8,
Corpus Christi, TXPresentation
NA06O
AR4320264
NGI
Kimbro, D. L. and A.R. Hughes
5/18/2011The effects of oil exposure and biorem
ediation on salt marsh com
munities across
the northeastern Gulf coast
Annual Northern G
ulf Institute Conference, May 17‐19, M
obile, ALPresentation
NA06O
AR4320264
NGI
Knight, C., S. Lecroy, C. Rakocinski, and J.Lyczkowski‐Shultz
Diversity and distribution of portunid crab megalopae from
SEAMAP plankton
Annual Northern G
ulf Institute Conference, May 17‐19, M
obile, ALNA06O
AR4320264X
5/18/2011sam
plesPresentation
NA06O
AR4320264
NGI
Knight, C., S. Lecroy, C. Rakocinski, and J.Lyczkowski‐Shultz
10/29/2010Diversity and distribution of portunid crab m
egalopae from SEAM
AP plankton sam
plesUSM
Letters DayPresentation
NA06O
AR4320264X
NGI
Kostka, J. and M. H
uettel5/18/2011
Hydrocarbon‐degrading bacteria and the bacterial community response in G
ulf of Mexico beach sands im
pacted by the Deepwater Horizon oil spill
Annual Northern G
ulf Institute Conference, May 17‐19, M
obile, ALPresentation
NA06O
AR4320264X
NGI
Lee, Z.‐P., C. Huang, R. Lubac, L. G
uo, D.‐S. Ko, S. Lohrenz, and R. G
ould10/3/2010
Characterization of suspended particulates in the Northern G
ulf of Mexico from
ocean color rem
ote sensingOcean O
ptics Conference, Oct 1 – 4, Anchorage, AK
PresentationNA06O
AR4320264X
NGI
Lee, Z.‐P. , Y.‐H. Ahn, C. Mobley, and R. Arnone
2010Rem
oval of surface‐reflected light for the measurem
ent of remote‐sensing
reflectance from an above‐surface platform
Optics Express 18(25): 26313‐26342
Journal ArticleNA06O
AR4320264X
X
NGI
Li, C., C. Chen, H. Lin, and L. Yan5/18/2011
Development and validation of sturge‐w
ave‐inundation models for Louisiana coast
Annual Northern G
ulf Institute Conference, May 17‐19, M
obile, ALPresentation
NA06O
AR4320264X
NGI
Li, C., H. Roberts, G. W
. Stone, E. Weeks, and Y. Luo
2011Wind surge and saltw
ater intrusion in Atchafalaya Bay during onshore winds prior to
cold front passageHydrobiologia 658: 27‐39
Journal Article10.1007/s10750‐010‐0467‐5
NA06O
AR4320264
XX
NGI
Li , C., J. R. White, C. Chen, H. Lin, E. W
eeks, K. Galvan, and
S. Bargu2011
Summertim
e tidal flushing of Barataria Bay: Transports of water and suspended
sediments
Journal of Geophysical Research 116:C04009Journal Article
10.1029/2010JC006566NA06O
AR4320264X
X
NGI
Lohrenz, S. E.11/9/2010
The role of science in a national crisis: Update on the Deepw
ater Horizon oil spillNational Science W
riters’ Conference, Nov 9, N
ew Haven, CT
PresentationNA06O
AR4320264X
NGI
Lohrenz, S. E.7/19/2010
An Update on the G
ulf of Mexico oil spill
Ocean Carbon and Biogeochem
istry Workshop, Jul 19‐22, San Diego,
CAPresentation
NA06O
AR4320264X
NGI
Lyczkowski‐Shultz, J., S. Lecroy, M
. Sutor, W. G
raham, H.
Perry, M. Benfield, and F. Hernandez
5/17/2011Identifying linkages betw
een zooplankton dynamics, fishery resources and clim
ate change in the northern G
ulf of Mexico
Annual Northern G
ulf Institute Conference, May 17‐19, M
obile, ALPresentation
NA06O
AR4320264X
NGI
M. Santem
a, M. H
uettel, K. Speer, and S. White
5/18/2011Spatial and tem
poral dynamics of oxygen, chlorophyll, and density in the Florida Big
Bend area Annual N
orthern Gu lf Institute Conference, M
ay 17‐19, Mobile, AL
PresentationNA06O
AR4320264
NGI
Maksim
ora, E. and A. J. Clarke5/18/2011
Multi‐Year current observations near the Florida Big Bend coast
Annual Northern G
ulf Institute Conference, May 17‐19, M
obile, ALPresentation
NA06O
AR4320264NGI
Maksim
ora, E. and A. J. Clarke5/18/2011
Multi‐Year current observations near the Florida Big Bend coast
Annual Northern G
ulf Institute Conference, May 17‐19, M
obile, ALPresentation
NA06O
AR4320264NGI
Marancik, K. E., D. E. Richardson, J. Lyczkow
ski‐Shultz, M.
Konieczna, and R. K. Cowen
2010Evaluation of m
orphological characters to identify grouper (Serranidae: Epinephelini) larvae in the G
ulf of Mexico using genetically identified specim
ensBulletin of M
arine Science 86(3):571‐624Journal Article
NA06O
AR4320264X
NGI
Marks, B. W
., J. R. White, and R. D. DeLaune
1/1/2010Effect of short term
changes in salinity on nitrogen cycling in a Louisiana Coastal Estuary
Soil Science Society of American N
ational Meeting, O
ct 31 ‐ Nov 3, Long
Beach, CAPresentation
NA06O
AR4320264
NGI
Marsh, K., L. Kasparek, and J. Cable
5/18/2011Effects of vegetation characteristics on coastal w
etland hydrodynamics
Annual Northern G
ulf Ins titute Conference, May 17‐19, M
obile, ALPresentation
NA06O
AR4320264NGI
McAnally, W
. H. 5/17/2011
Ecosystem Approach to M
anagement (EAM
)Annual N
orthern Gulf Institute Conference, M
ay 17‐19, Mobile, AL
PresentationNA06O
AR4320264X
NGI
McAnally, W
. H., D. W. Evans, J. L. M
artin, J. Sloan, and V. Alarcon
5/18/2011Sedim
ent and mercury path and fate m
odeling Annual N
orthern Gulf Institute Conference, M
ay 17‐19, Mobile, AL
PresentationNA06O
AR4320264X
NGI
McAnally, W
. H., P. Fitzpatrick, P. Amburn, J. M
artin, E. Chassignet, Q
. Chen, and F. Fulford5/18/2011
Community earth ecosystem
models
Annual Northern G
ulf Institute Conference, May 17‐19, M
obile, ALPresentation
NA06O
AR4320264X
NGI
Miller, T. and E. G
ornish 5/18/2011
Quantifying effects of oil on coastal dune vegetation
Annual Northern G
ulf Ins titute Conference, May 17‐19, M
obile, ALPresentation
NA06O
AR4320264NGI
Millett, A., J. Lyczkow
ski‐Shultz, and W. Kalandyk
5/19/2011Analysis of the invertebrate zooplankton com
ponent of SEAMAP plankton sam
plesAnnual N
orthern Gulf Institute Conference, M
ay 17‐19, Mobile, AL
PresentationNA06O
AR4320264NGI
Millett, A., W
. Graham
, and G.Zapfe
5/17/2011Expanding data collection for gelatinous zooplankton during SEAM
AP plankton surveys
Annual Northern G
ulf Institute Conference, May 17‐19, M
obile, ALPresentation
NA06O
AR4320264
NGI
Mitra, K., Z. Zhou, and L. G
uo12/1/2010
Variations in the partitioning of carbohydrates between dissolved and particulate
phases in the Bay of St. LouisBays and Bayous Sym
posium, Decem
ber 1‐2, Mobile, AL
PresentationNA06O
AR4320264
NGI
Mojzis, A. K.
9/23/2010Explaining the variability in free‐living and attached bacterioplankton abundances in the Bay of St. Louis M
SMS Thesis Defense
PresentationNA06O
AR4320264
NGI
Molina, L. K. and D. G
. Redalje12/1/2010
Phytoplankton abundance and pigment taxonom
y composition in coastal M
ississippi waters
Bays and Bayous Symposium
, December 1‐2, M
obile, ALPresentation
NA06O
AR4320264
NGI
Montee, G
., S. Smith, and M
. Bourassa5/18/2011
Raw data processing in SAM
OS 2.0
Annual Northern G
ulf Institute Conference, May 17‐19, M
obile, ALPresentation
NA06O
AR4320264NGI
Nelson, J. A. , J. P. Chanton, F. C. Colem
an, and C. C. Koenig2011
Patterns of stable carbon isotope turnover in gag, Mycteroperca m
icrolepis, an econom
ically important m
arine piscivore determined w
ith a non‐lethal surgical biopsy procedure
Environmental Biology of Fishes 90:243–252
Journal Article10.1007/s10641‐010‐9736‐4
NA06O
AR4320264X
NGI
Nelson, J. A., C. W
. Hanson, C. C. Koenig, and J. P. Chanton2011
The influence of diet on stable carbon isotope composition in otoliths of juvenile Red
Drum (Sciaenops ocellatus)
Aquatic Biology: in pressJournal Article
10.3354/ab00354NA06O
AR4320264X
NGI
Nelson, J. A., R. M
. Wilson, J. P. Chanton, F. C. Colem
an, and C. C. Koenig
2011Fish m
ediated carbon and nutrient flux in the N.E. G
ulf of Mexico
Ecological Applications: in pressJournal Article
NA06O
AR4320264
NGI
Now
lin, R. and T. Miller‐W
ay 5/18/2011
NOAA‐N
GI Diversity Internship Program
Annual Northern G
ulf Institute Conference, May 17‐19, M
obile, ALPresentation
NA06O
AR4320264NGI
Petrolia, D. R. and T. Kim2011
Preventing land loss in coastal Louisiana: Estimates of W
TP and WTA
Journal of Environmental M
anagement 92(3): 859‐865
Journal Article10.1016/j.jenvm
an.2010.10.040NA06O
AR4320264X
XNGI
Petrolia, D. R. and T. Kim2011
Contingent valuation with heterogeneous reasons for uncertainty
Resource and Energy Economics 33(2011): 515‐526
Journal Article10.1016/j.reseneeco.2010.10.001
NA06O
AR4320264X
XNGI
Petrolia, D. R. , R. G. M
oore, and T. Kim2011
Preferences for timing of w
etland loss prevention in LouisianaWetlands 31(2): 295‐307
Journal Article10.1007/s13157‐011‐0150‐2
NA06O
AR4320264X
XNGI
Prouhet, J., K. M. Yeager, C. A. Brunner, M
. A. Kulp, K. J. Schindler, and B. Penrose
2010Autocom
paction rates across a suspected growth fault, Pearl River m
arsh, Louisiana, USA
Eos Transactions, AGU 91(26), M
eeting of the Americas Supplem
ental: Abstract GC11B‐01
PresentationNA06O
AR4320264
NGI
Richards, T. and K. Craig5/18/2011
Investigating the relative value of seagrass beds to spotted seatrout and other upper trophic level nekton in Apalachicola Bay
Annual Northern G
ulf Institute Conference, May 17‐19, M
obile, ALPresentation
NA06O
AR4320264
NGI
Ritchie, J., D. Yoskowitz, C. Santos, B. Allee, C. Carollo, J.
Henderson, S. Jordan, and J. Ritchie10/1/2010
Proceedings of the Gulf of M
exico Ecosystem Services W
orkshop Gulf of M
exico Ecosystem Services W
orkshop, Jun 16‐18, Bay St. Louis, MS
Workshop
ProceedingsNA06O
AR4320264X
NGI
Rozas, L. P., J. Valentine, C. Martin, and L. Steele
5/18/2011Use of shallow
estuarine habitats by nekton in the Mobile‐Tensaw
River Delta, Alabam
aAnnual N
orthern Gulf Institute Conference, M
ay 17‐19, Mobile, AL
PresentationNA06O
AR4320264X
NGI
Rudlosky, S. D.2010
Assessing storm severity using lightning and radar inform
ationPh.D
. Dissertation, Florida State University
NA06O
AR4320264NGI
Rudlosky, S. D. and H. E. Fuelberg1/25/2011
Determining relationships betw
een lightning and radar in severe and non‐severe storm
sAm
erican Meteorological Society Annual M
eeting, Jan 24‐26, Seattle, WA
Conference Proceedigns
NA06O
AR4320264X
NGI
Rudlosky, S. D. and H. E. Fuelberg12/3/2010
Determining relationships betw
een lightning and radar in severe and non‐severe storm
sGOES‐R3 Science M
eeting, Dec 3, Huntsville, ALNA06O
AR4320264X
NGI
Rudlosky, S. D. and H. E. Fuelberg2010
Pre‐ and postupgrade distributions of NLDN
reported cloud‐to‐ground lightning characteristics in the contiguous U
nited StatesMonthly W
eather Review 138(9):3623‐3633
Journal Article10.1175/2010M
WR3283.1
NA06O
AR4320264X
X
NGI
Rudlosky, S. D. and H. E. Fuelberg2011
Seasonal, regional and storm‐scale variability of cloud‐to‐ground lightning
characteristics in FloridaMonthly W
eather Review 139(6):1826‐1843
Journal Article10.1175/2010M
WR3585.1
NA06O
AR4320264X
X
NGI
Sanchez‐Rubio, G., H. Perry, and J. Lyczkow
ski‐Shultz5/17/2011
Influence of Atlantic and Pacific modes of variability on w
inter climatology and
spring zooplankton displacement volum
es n the northern Gulf of M
exicoAnnual N
orthern Gulf Institute Conference, M
ay 17‐19, Mobile, AL
PresentationNA06O
AR4320264
NGI
Sanyal, J., P. Amburn, J. Dyer, S. Zhang, and R. M
oorhead5/17/2011
Visualization of river forecast ensembles
Annual Northern G
ulf Institute Conference, May 17‐19, M
obile, ALPresentation
NA06O
AR4320264NGI
Schellinger, J.5/18/2011
The effect of depth, location and substrate relief on hard‐bottom sessile
invertebrate communities in the northeastern G
ulf of Mexico
Annual Northern G
ulf Institute Conference, May 17‐19, M
obile, ALPresentation
NA06O
AR4320264
NGI
Smith, C., K. Speer, N
. Wienders, E. M
ortenson, and E. Sim
ons5/18/2011
Hydrological survey of NGI Apalachicola Bay sites
Annual Northern G
ulf Institute Conference, May 17‐19, M
obile, ALPresentation
NA06O
AR4320264
NGI
Speer, K., S. White, N
. Wienders, M
. Huettel, and E. Sim
ons5/18/2011
Waves and currents at FSU
NGI sites
Annual Northern G
ulf Institute Conference, May 17‐19, M
obile , ALPresentation
NA06O
AR4320264X
NGI
Stallings, C. D., F. C. Coleman, C. C. Koenig, and D. A.
Markiew
icz2010
Energy allocation in juveniles of a warm
‐temperate reef fish
Environmental Biology of Fishes 88: 389‐398
Journal Article10.1007/s10641‐010‐9655‐4
NA06O
AR4320264X
NGI
Stauffenburg, H. A., K. S. McN
eal, C. Guthrie, S. Dutta, and D. Evans
5/18/2011Sedim
ent and mercury analysis in W
eeks Bay, Alabama
Annual Northern G
ulf Institute Conference, May 17‐19, M
obile, ALPresentation
NA06O
AR4320264X
NGI
Steele, L. J. F. Valentine, B. Mortazavi, A. Vedral, and L.
Rozas5/18/2011
Seasonally varying habitat linkages in a northern Gulf of M
exico estuary Annual N
orthern Gulf Institute Conference, M
ay 17‐19, Mobile, AL
PresentationNA06O
AR4320264X
NGI
Steele, L. J. F. Valentine, B. Mortazavi, A. Vedral, and L.
Rozas3/16/2011
Seasonally varying habitat linkages in a northern Gulf of M
exico estuary Benthic Ecology M
eeting, March 16‐20, M
obile, ALPresentation
NA06O
AR4320264
NGI
Stone, M.
10/22/2010How
fluctuating light in algal cultures can help save the world: A sm
all part in a large project
Anderson University, Anderson, SC
PresentationNA06O
AR4320264X
NGI
Taylor, M. A., J. K. Cr aig, and J. W
anat5/18/2011
Juvenile fish foraging success: An indicator for nursery habitat quality? Annual N
orthern Gulf Institute Conference, M
ay 17‐19, Mobile, AL
PresentationNA06O
AR4320264X
NGI
Todd, A. C., S. L. Morey, and E. P. Chassignet
5/18/2011Circulation dynam
ics and larval transport in the Florida Big BendAnnual N
orthern Gulf Institute Conference, M
ay 17‐19, Mobile, AL
PresentationNA06O
AR4320264NGI
van der Zwaag, J., P. Am
burn, and D. Welch
5/17/2011Visual analytics for assessm
ent and interpretation of simulated river flooding
Annual Northern G
ulf Institute Conference, May 17‐19, M
obile, ALPresentation
NA06O
AR4320264NGI
Vedral, A., B. Mortazavi, J. F. Valentine, and L. Steele
5/18/2011Using stable isotopes to investigate a cross‐habitat linkage presented by the post‐
mating m
igration of female blue crabs in M
obile Bay, Alabama
Annual Northern G
ulf Institute Conference, May 17‐19, M
obile, ALPresentation
NA06O
AR4320264
NGI
W. G
raham, F. Hernandez, A. M
illett, L. Carassou, K. Bayha, R. Collini, G
. Zapfe, K. Robinson, J. Lyczkowski‐
Shultz5/17/2011
Using zooplankton com
munity distribution to identify large m
arine ecosystem sub‐
units within the northern G
ulf of Mexico
Annual Northern G
ulf Institute Conference, May 17‐19, M
obile, AL
PresentationNA06O
AR4320264
NGI
Zhou, Z., H. He, L. G
uo and Z.‐P. Lee5/18/2011
Spatial and temporal variations in optical properties of CDO
M in Lake Pontchartrain
Annual Northern G
ulf Institute Conference, May 17‐19, M
obile, ALPresentation
NA06O
AR4320264
NGI
Zhou, Z., L. Guo, A. M
. Shiller, and S. E. Lohrenz12/1/2010
Influence of oil and dispersant on optical properties of dissolved organic matter in
the Mississippi Sound/Bight
Bays and Bayous Symposium
, December 1‐2, M
obile, ALPresentation
NA06O
AR4320264
NGI
Zhou, Z., L. Guo, A. M
. Shiller, and S. E. Lohrenz11/1/2010
Characterization of oil and dispersant in the northern Gulf of M
exico using fluorescence EEM
and size fractionation techniquesCollaborative Scientific Research O
pportunities Relative to the Gulf O
il Spill Conference, N
ovember 1‐2, N
ew Orleans, LA
PresentationNA06O
AR4320264
NGI
Zhou, Z., L. Guo, A. M
. Shiller, and S. E. Lohrenz2010
Optical characterization of crude oils and dispersant used in the northern G
u lf of Mexico by fluorescence EEM
techniquesThe 2010 AG
U Fall M
eeting, December 12‐17, 2010. San Francisco, CA
PresentationNA06O
AR4320264
NGI
Gokaraju, B., S. Durbha, R. King, and N
. Younan2011
A machine learning based spatio‐tem
poral data mining approach for
detection of harmful algal bloom
s in the Gulf of M
exicoIEEE Journal of Selected Topics in Applied Earth O
bservations and Rem
ote Sensing: acceptedJournal Article
10.1109/JSTARS.2010.2103927NA06O
AR4320264X
NGI
Gokaraju, B., S. Durbha, R. King, and N
. Younan2011
Ensemble m
ethodology using multi‐stage learning for im
proved detection of harmful
algal blooms
IEEE Letters Geoscience and Remote Sensing: accepted
Journal ArticleNA06O
AR4320264X
NGI
Zou, X., Z. Qin, and F. W
eng2011
Improved coastal precipitation forecasts w
ith direct assimilation of G
OES 11/12
imager radiances
Monthly W
eather Review: accepted
Journal Article10.1175/M
WR‐D‐10‐05040.1
NA06O
AR4320264X
NGI
Guan L., X. Zou, F. W
eng and G. Li
2011Assessm
ents of FY‐3A Microw
ave Humidity Sounder (M
WHS) m
easurements using
NOAA‐18 M
icrowave Hum
idity Sounder (MHS)
Journal of Geophysical Research 116:D10106Journal Article
10.1029/2010JD015412NA06O
AR4320264X
NGI
Zou, X., Wang X., F. W
eng and G. Li
2011Assessm
ents of Chinese FengYun Microw
ave Temperature Sounder (M
WTS)
measurem
ents for we ather and clim
ate applicationsJournal of Atm
ospheric and Oceanic Technology: accepted
Journal Article10.1175/JTECH‐D‐11‐00023.1
NA06O
AR4320264X
NGI
Braatz, A.2011
An analytical study of air‐sea CO2 gas exchange in the N
orthwest M
ississippi Bight Region
MS Thesis, U
niversity of Southern Mississippi
NA06O
AR4320264X
How to Com
plete the FormEach article or paper that has been published during the current reporting period please list:INCLU
DE Workshop Proceedings, Conference Proceedings or Presentations
1. The lead PI name first follow
ed additional authors2. Date article or paper w
as published. If the article or paper has not yet been published, please indicate "IN PRESS"
APPENDIX 2. EMPLOYEE SUPPORT
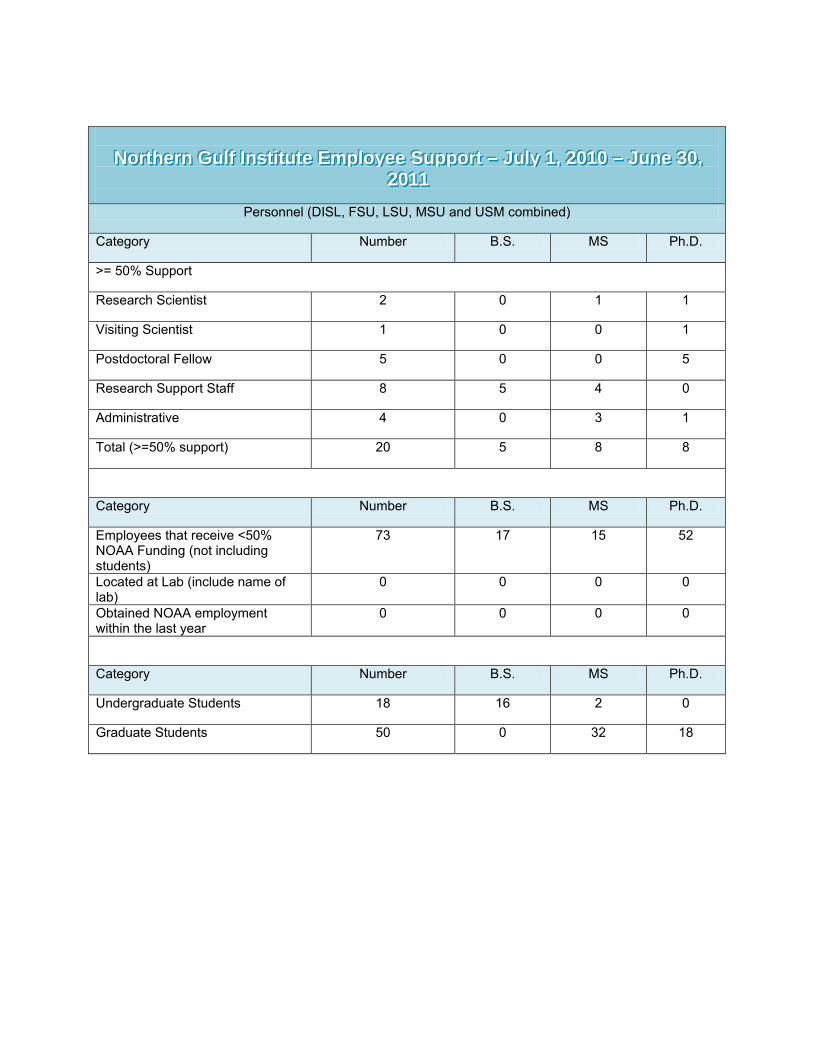
NNNooorrrttthhheeerrrnnn GGGuuulllfff IIInnnssstttiiitttuuuttteee EEEmmmpppllloooyyyeeeeee SSSuuuppppppooorrrttt ––– JJJuuulllyyy 111,,, 222000111000 ––– JJJuuunnneee 333000,,,
222000111111
Personnel (DISL, FSU, LSU, MSU and USM combined)
Category Number B.S. MS Ph.D.
>= 50% Support
Research Scientist 2 0 1 1
Visiting Scientist 1 0 0 1
Postdoctoral Fellow 5 0 0 5
Research Support Staff 8 5 4 0
Administrative 4 0 3 1
Total (>=50% support) 20 5 8 8
Category Number B.S. MS Ph.D.
Employees that receive <50% NOAA Funding (not including students)
73 17 15 52
Located at Lab (include name of lab)
0 0 0 0
Obtained NOAA employment within the last year
0 0 0 0
Category Number B.S. MS Ph.D.
Undergraduate Students 18 16 2 0
Graduate Students 50 0 32 18
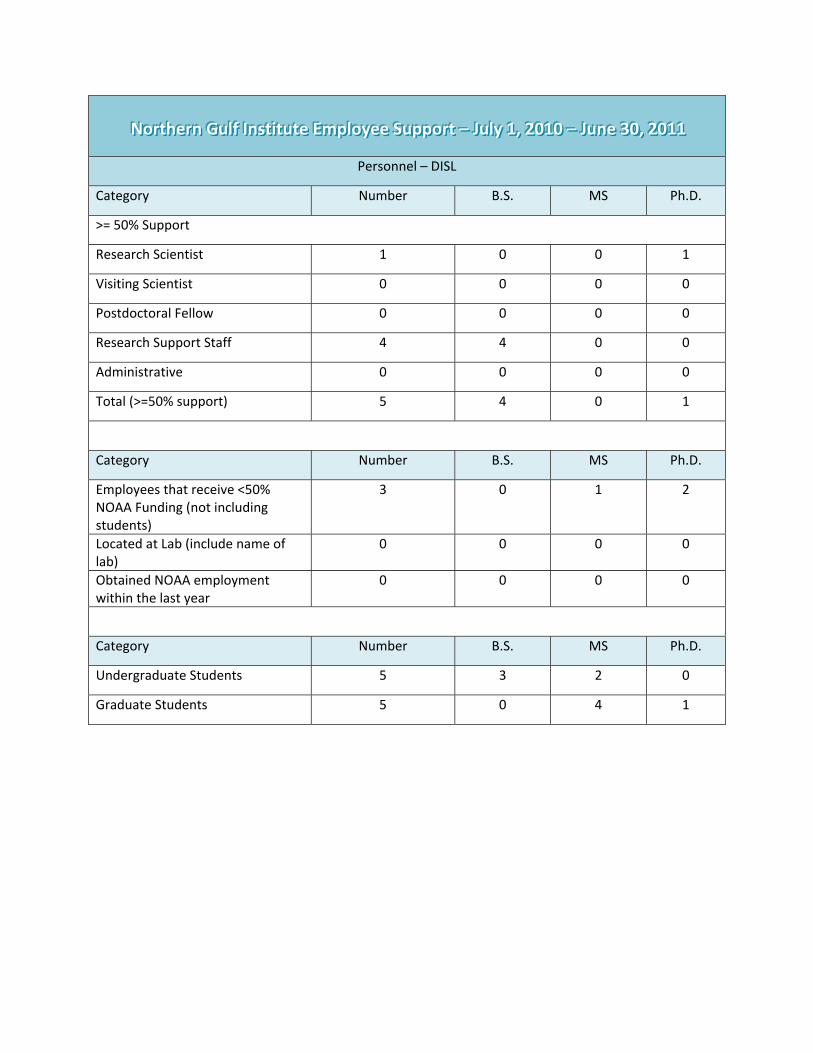
NNNooorrrttthhheeerrrnnn GGGuuulllfff IIInnnssstttiiitttuuuttteee EEEmmmpppllloooyyyeeeeee SSSuuuppppppooorrrttt ––– JJJuuulllyyy 111,,, 222000111000 ––– JJJuuunnneee 333000,,, 222000111111
Personnel – DISL
Category Number B.S. MS Ph.D.
>= 50% Support
Research Scientist 1 0 0 1
Visiting Scientist 0 0 0 0
Postdoctoral Fellow 0 0 0 0
Research Support Staff 4 4 0 0
Administrative 0 0 0 0
Total (>=50% support) 5 4 0 1
Category Number B.S. MS Ph.D.
Employees that receive <50% NOAA Funding (not including students)
3 0 1 2
Located at Lab (include name of lab)
0 0 0 0
Obtained NOAA employment within the last year
0 0 0 0
Category Number B.S. MS Ph.D.
Undergraduate Students 5 3 2 0
Graduate Students 5 0 4 1
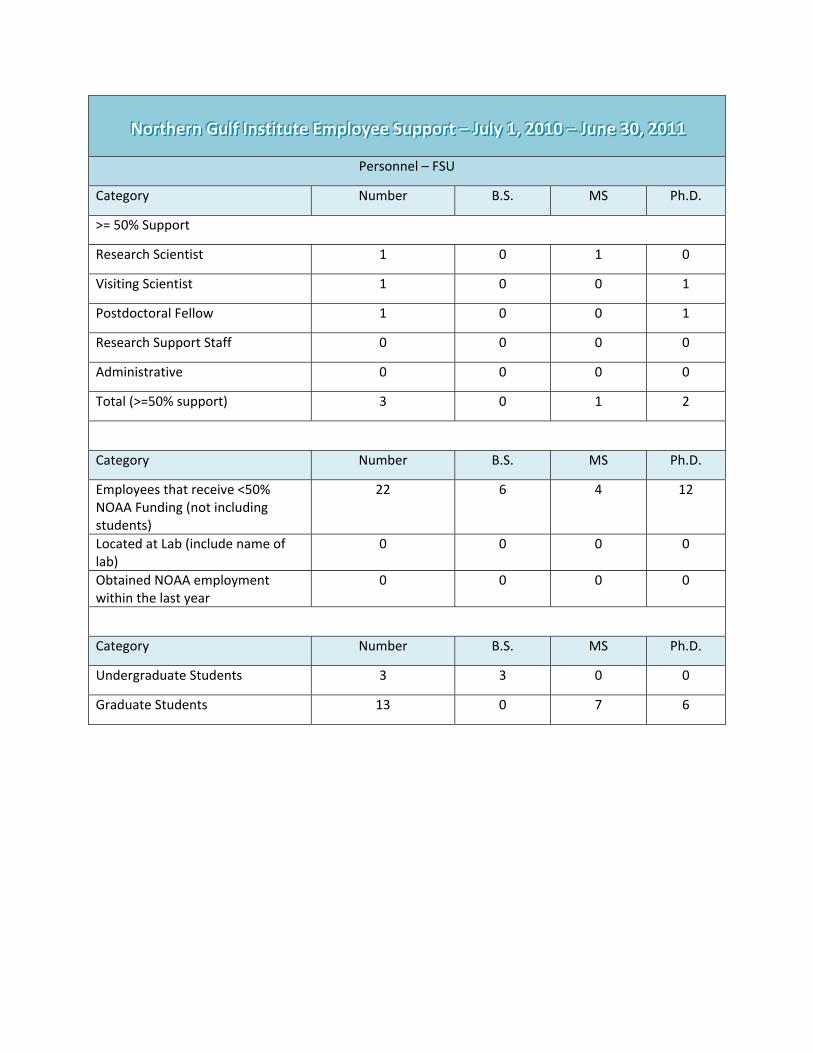
NNNooorrrttthhheeerrrnnn GGGuuulllfff IIInnnssstttiiitttuuuttteee EEEmmmpppllloooyyyeeeeee SSSuuuppppppooorrrttt ––– JJJuuulllyyy 111,,, 222000111000 ––– JJJuuunnneee 333000,,, 222000111111
Personnel – FSU
Category Number B.S. MS Ph.D.
>= 50% Support
Research Scientist 1 0 1 0
Visiting Scientist 1 0 0 1
Postdoctoral Fellow 1 0 0 1
Research Support Staff 0 0 0 0
Administrative 0 0 0 0
Total (>=50% support) 3 0 1 2
Category Number B.S. MS Ph.D.
Employees that receive <50% NOAA Funding (not including students)
22 6 4 12
Located at Lab (include name of lab)
0 0 0 0
Obtained NOAA employment within the last year
0 0 0 0
Category Number B.S. MS Ph.D.
Undergraduate Students 3 3 0 0
Graduate Students 13 0 7 6

NNNooorrrttthhheeerrrnnn GGGuuulllfff IIInnnssstttiiitttuuuttteee EEEmmmpppllloooyyyeeeeee SSSuuuppppppooorrrttt ––– JJJuuulllyyy 111,,, 222000111000 ––– JJJuuunnneee 333000,,, 222000111111
Personnel – LSU
Category Number B.S. MS Ph.D.
>= 50% Support
Research Scientist 0 0 0 0
Visiting Scientist 0 0 0 0
Postdoctoral Fellow 2 0 0 2
Research Support Staff 0 0 0 0
Administrative 0 0 0 0
Total (>=50% support) 2 0 0 2
Category Number B.S. MS Ph.D.
Employees that receive <50% NOAA Funding (not including students)
20 3 3 14
Located at Lab (include name of lab)
0 0 0 0
Obtained NOAA employment within the last year
0 0 0 0
Category Number B.S. MS Ph.D.
Undergraduate Students 0 0 0 0
Graduate Students 4 0 3 1

NNNooorrrttthhheeerrrnnn GGGuuulllfff IIInnnssstttiiitttuuuttteee EEEmmmpppllloooyyyeeeeee SSSuuuppppppooorrrttt ––– JJJuuulllyyy 111,,, 222000111000 ––– JJJuuunnneee 333000,,, 222000111111
Personnel – MSU
Category Number B.S. MS Ph.D.
>= 50% Support
Research Scientist 0 0 0 0
Visiting Scientist 0 0 0 0
Postdoctoral Fellow 2 0 0 2
Research Support Staff 4 1 3 0
Administrative 4 0 3 1
Total (>=50% support) 10 1 6 3
Category Number B.S. MS Ph.D.
Employees that receive <50% NOAA Funding (not including students)
28 3 4 20
Located at Lab (include name of lab)
0 0 0 0
Obtained NOAA employment within the last year
0 0 0 0
Category Number B.S. MS Ph.D.
Undergraduate Students 5 5 0 0
Graduate Students 14 0 7 7

NNNooorrrttthhheeerrrnnn GGGuuulllfff IIInnnssstttiiitttuuuttteee EEEmmmpppllloooyyyeeeeee SSSuuuppppppooorrrttt ––– JJJuuulllyyy 111,,, 222000111000 ––– JJJuuunnneee 333000,,, 222000111111
Personnel – USM
Category Number B.S. MS Ph.D.
>= 50% Support
Research Scientist 0 0 0 0
Visiting Scientist 0 0 0 0
Postdoctoral Fellow 0 0 0 0
Research Support Staff 1 0 1 0
Administrative 0 0 0 0
Total (>=50% support) 1 0 1 0
Category Number B.S. MS Ph.D.
Employees that receive <50% NOAA Funding (not including students)
12 5 3 4
Located at Lab (include name of lab)
0 0 0 0
Obtained NOAA employment within the last year
0 0 0 0
Category Number B.S. MS Ph.D.
Undergraduate Students 5 5 0 0
Graduate Students 14 0 11 3