Embed Size (px)
Citation preview

Organismo Internacional de Energía Atómica
SPECT in LV Dyssynchrony
Intraventricular Systolic
Dyssynchrony
Diana Páez
Médico Nuclear
Sección de Medicina Nuclear
e Imágenes Diagnósticas
Organismo Internacional de Energía Atómica
• How can we measure it with MPI
• How accurate is it
• How to use it to predict CRT
response
• How to use it to guide CRT lead
placement
SPECT in LV Dyssynchrony Intraventricular Systolic Dyssynchrony
Courtesy of Ernest V. Garcia
Emory University School of Medicine
Ventricular Synchronicity: Homogeneity of the Onset of Contraction
• Time when the electrical wave of activation
reaches the contractile segment (electrical)
• Time when the contractile segment starts to
thicken (mechanical)
• Time when the corresponding endocardial
segment starts to move inward (mechanical)
• In dyssynchrony electrical activation is not
necessarily equal to mechanical activation Courtesy of
Ernest V. Garcia Emory University School of Medicine
Cardiac Resynchronization Therapy (CRT)
in Heart Failure
• CRT was approved by the FDA in 2001 based on the the MUSTIC and the MIRACLE trials
• In patients with end-stage HF, depressed LVEF and wide QRS (>120 ms).
• 20% to 30% of these patients do not respond to CRT
• 30% of patients with a wide QRS complex (>120 ms) do not have substantial LV dyssynchrony on echocardiography
• one third of patients with a narrow QRS appear to have substantial LV dyssynchrony on echocardiography
• Results of the PROSPECT trial showed that TDI and myocardial strain-rate is not ready for routine clinical evaluation of LV dyssynchrony.
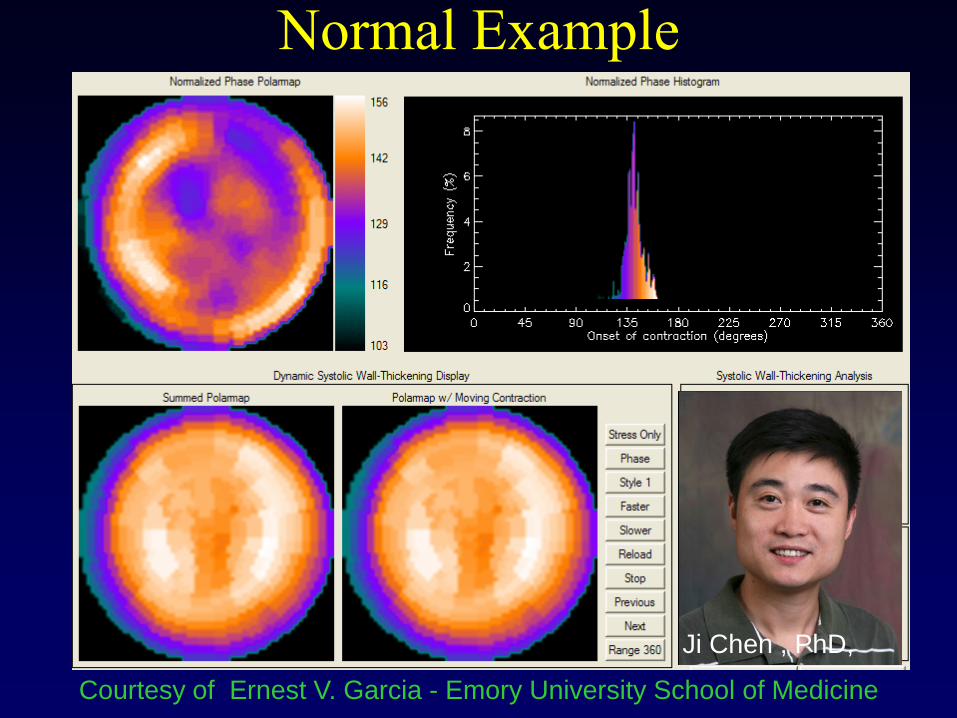
Normal Example
Ji Chen , PhD,
Courtesy of Ernest V. Garcia - Emory University School of Medicine
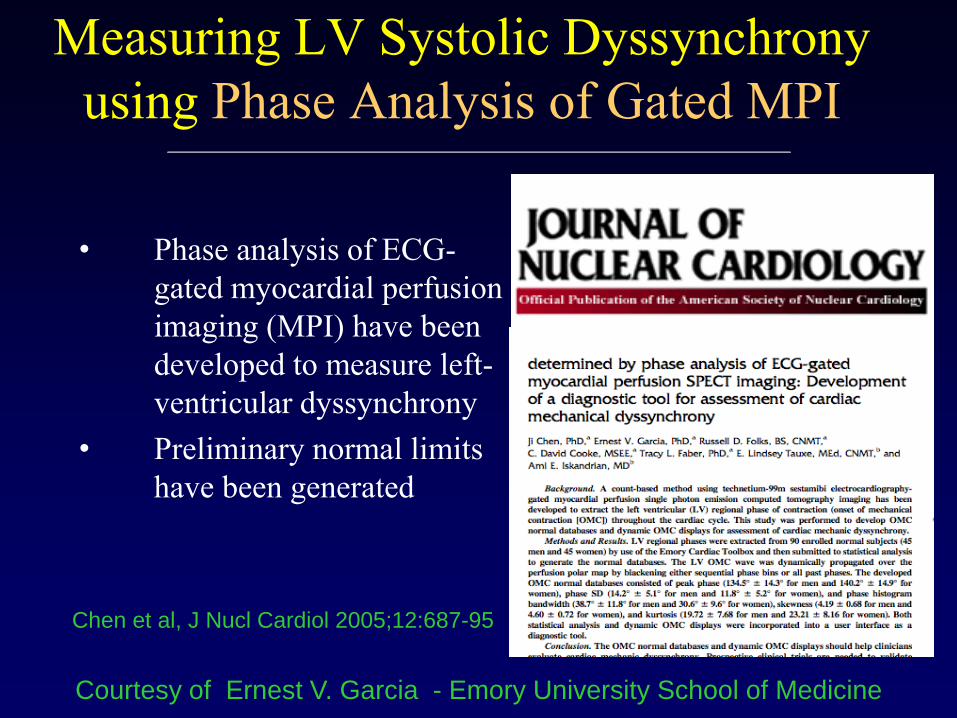
Measuring LV Systolic Dyssynchrony
using Phase Analysis of Gated MPI
• Phase analysis of ECG-
gated myocardial perfusion
imaging (MPI) have been
developed to measure left-
ventricular dyssynchrony
• Preliminary normal limits
have been generated
Chen et al, J Nucl Cardiol 2005;12:687-95
Courtesy of Ernest V. Garcia - Emory University School of Medicine
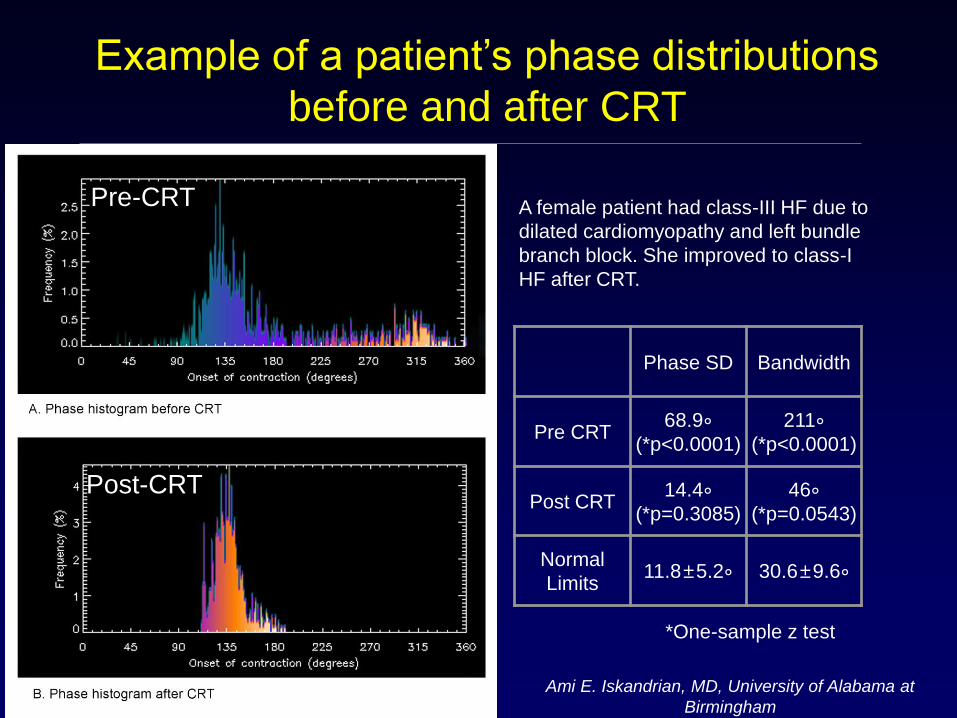
A female patient had class-III HF due to
dilated cardiomyopathy and left bundle
branch block. She improved to class-I
HF after CRT.
Phase SD Bandwidth
Pre CRT 68.9∘
(*p<0.0001)
211∘ (*p<0.0001)
Post CRT 14.4∘
(*p=0.3085)
46∘ (*p=0.0543)
Normal
Limits 11.8±5.2∘ 30.6±9.6∘
Ami E. Iskandrian, MD, University of Alabama at
Birmingham
*One-sample z test
Example of a patient’s phase distributions
before and after CRT
Pre-CRT
Post-CRT
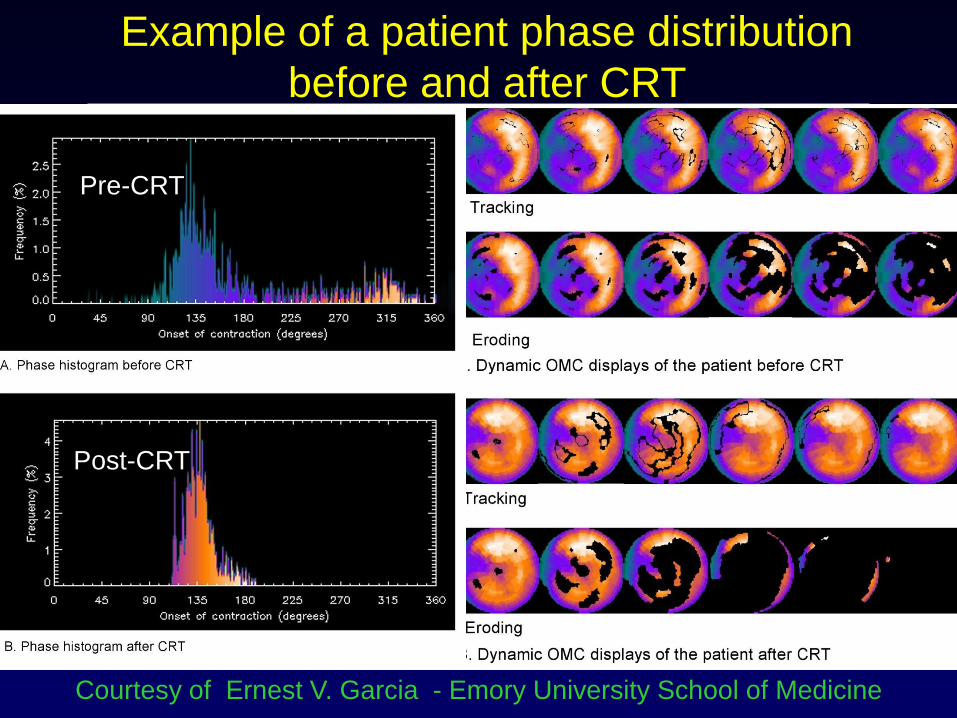
Example of a patient phase distribution
before and after CRT
Pre-CRT
Post-CRT
Courtesy of Ernest V. Garcia - Emory University School of Medicine
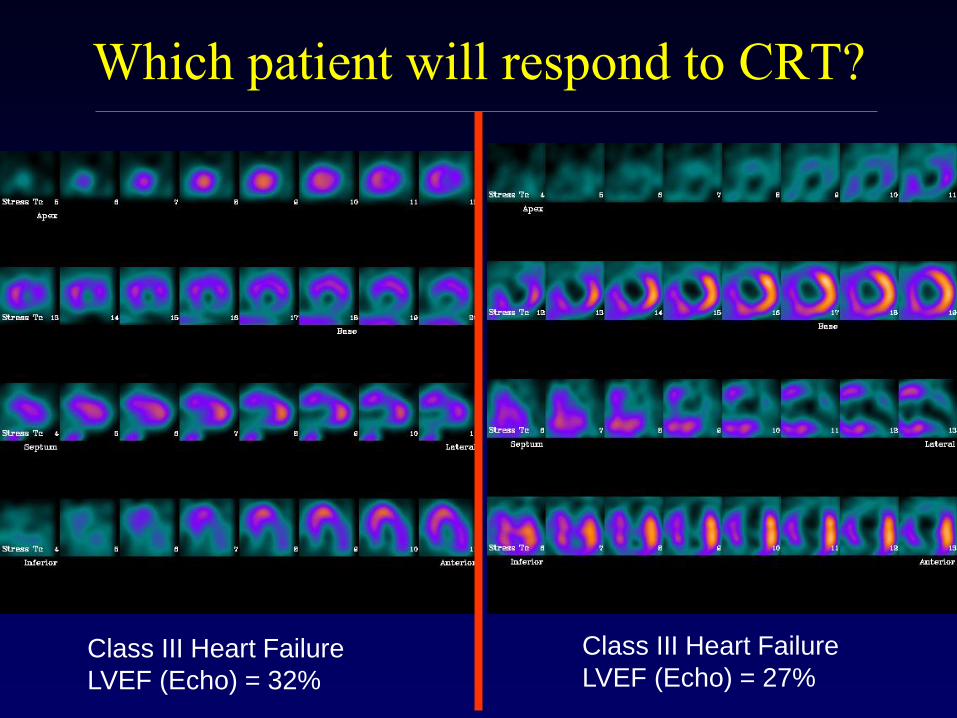
Which patient will respond to CRT?
Class III Heart Failure
LVEF (Echo) = 32%
Class III Heart Failure
LVEF (Echo) = 27%
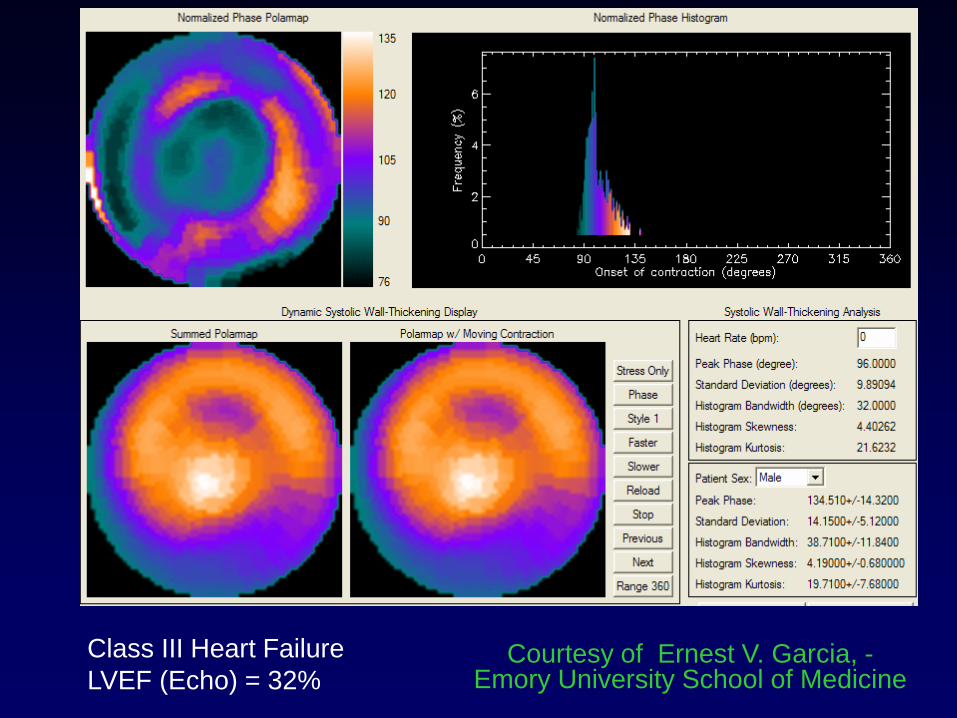
Class III Heart Failure
LVEF (Echo) = 32% Courtesy of Ernest V. Garcia, -
Emory University School of Medicine
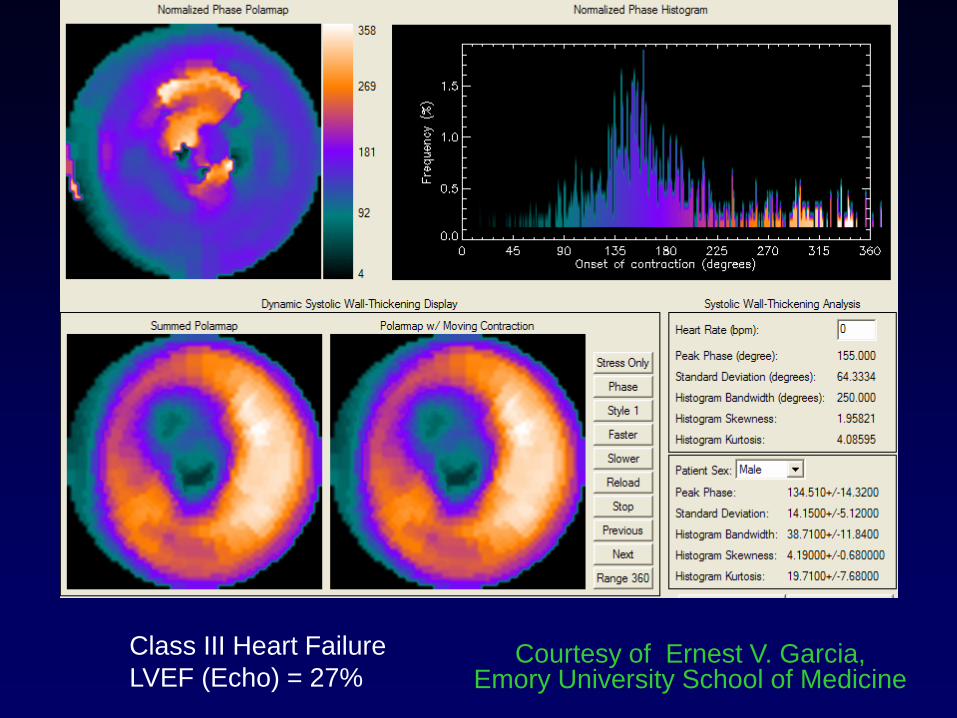
Class III Heart Failure
LVEF (Echo) = 27% Courtesy of Ernest V. Garcia,
Emory University School of Medicine
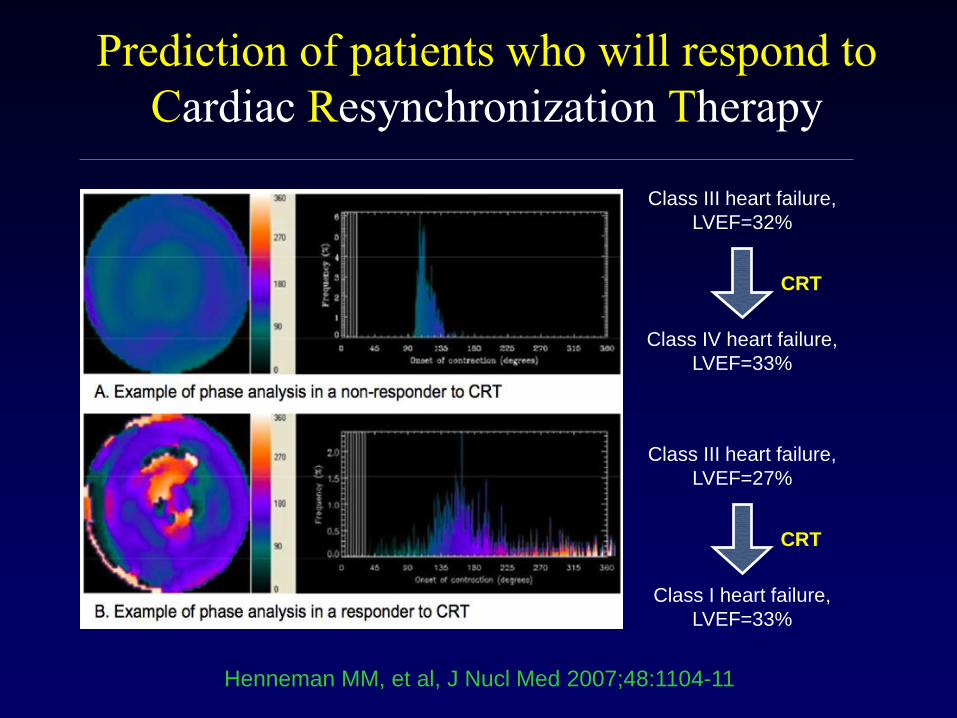
Henneman MM, et al, J Nucl Med 2007;48:1104-11
Prediction of patients who will respond to
Cardiac Resynchronization Therapy
Class III heart failure,
LVEF=32%
Class IV heart failure,
LVEF=33%
CRT
Class III heart failure,
LVEF=27%
Class I heart failure,
LVEF=33%
CRT
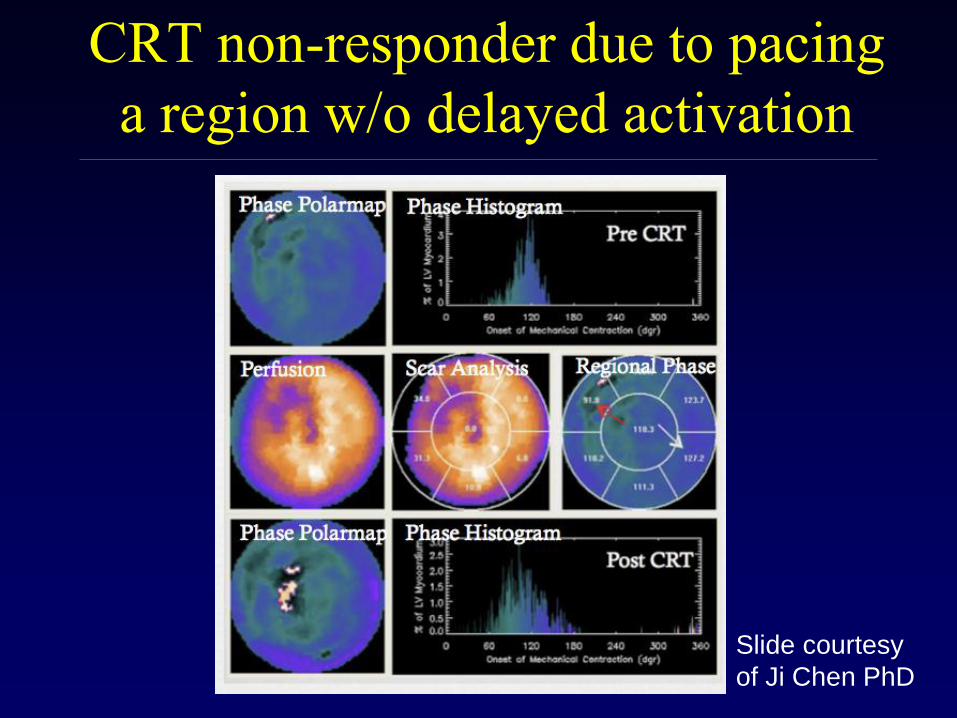
CRT non-responder due to pacing
a region w/o delayed activation
Slide courtesy
of Ji Chen PhD
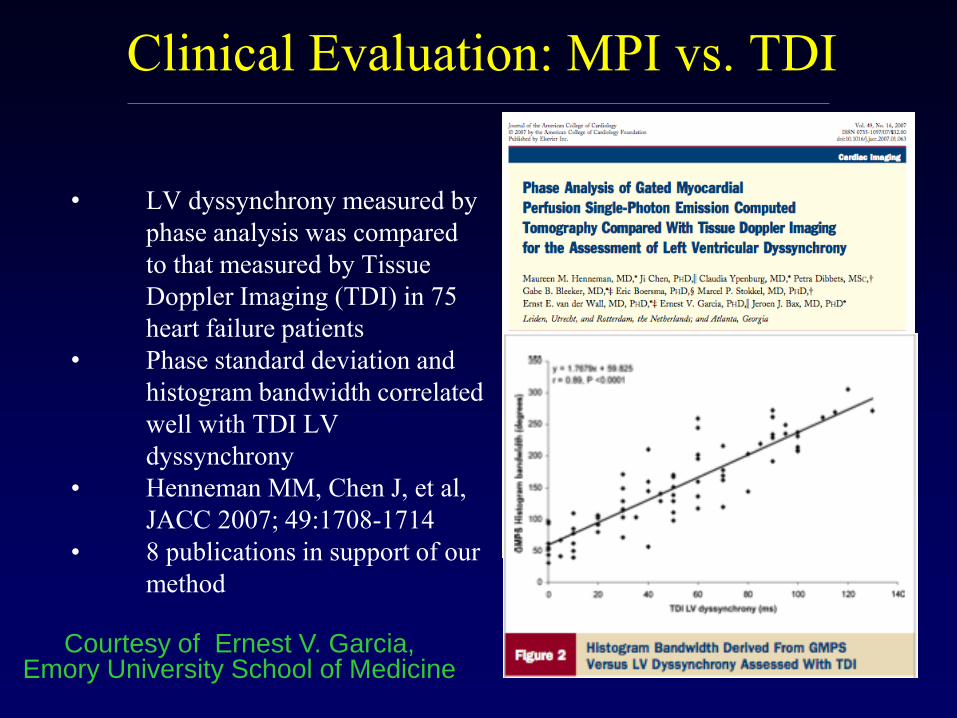
Clinical Evaluation: MPI vs. TDI
• LV dyssynchrony measured by
phase analysis was compared
to that measured by Tissue
Doppler Imaging (TDI) in 75
heart failure patients
• Phase standard deviation and
histogram bandwidth correlated
well with TDI LV
dyssynchrony
• Henneman MM, Chen J, et al,
JACC 2007; 49:1708-1714
• 8 publications in support of our
method
Courtesy of Ernest V. Garcia, Emory University School of Medicine
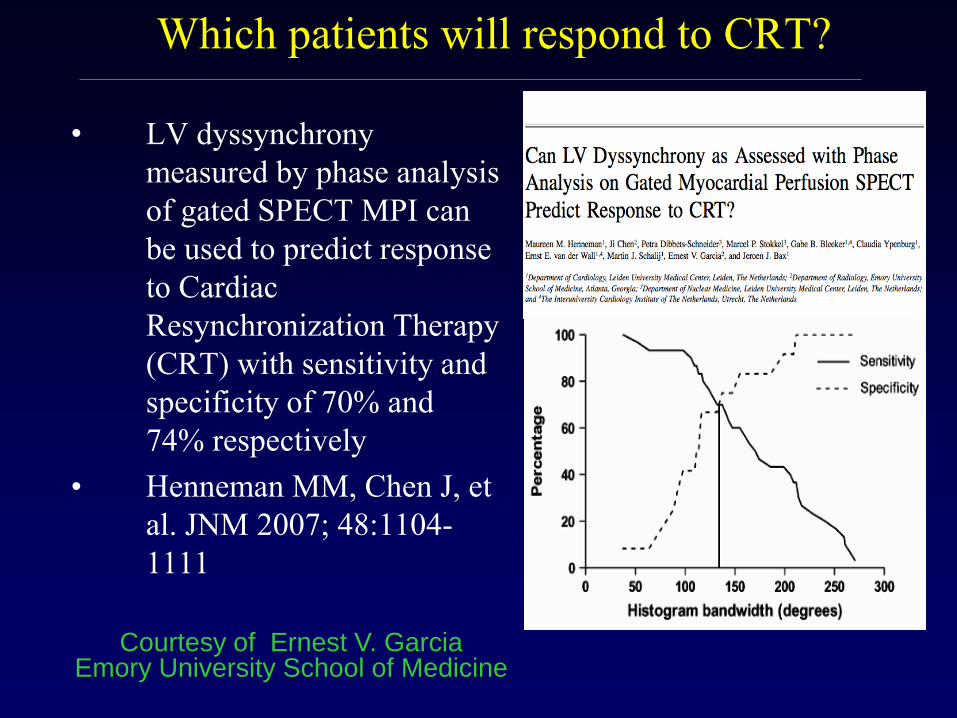
Which patients will respond to CRT?
• LV dyssynchrony
measured by phase analysis
of gated SPECT MPI can
be used to predict response
to Cardiac
Resynchronization Therapy
(CRT) with sensitivity and
specificity of 70% and
74% respectively
• Henneman MM, Chen J, et
al. JNM 2007; 48:1104-
1111
Courtesy of Ernest V. Garcia Emory University School of Medicine
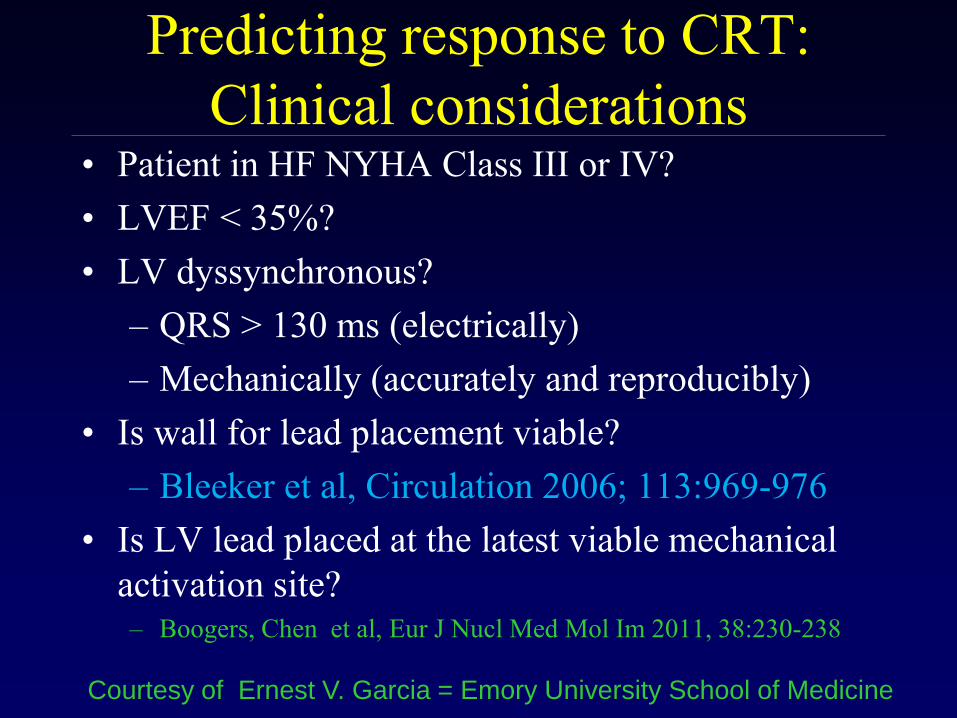
Predicting response to CRT:
Clinical considerations • Patient in HF NYHA Class III or IV?
• LVEF < 35%?
• LV dyssynchronous?
– QRS > 130 ms (electrically)
– Mechanically (accurately and reproducibly)
• Is wall for lead placement viable?
– Bleeker et al, Circulation 2006; 113:969-976
• Is LV lead placed at the latest viable mechanical
activation site? – Boogers, Chen et al, Eur J Nucl Med Mol Im 2011, 38:230-238
Courtesy of Ernest V. Garcia = Emory University School of Medicine
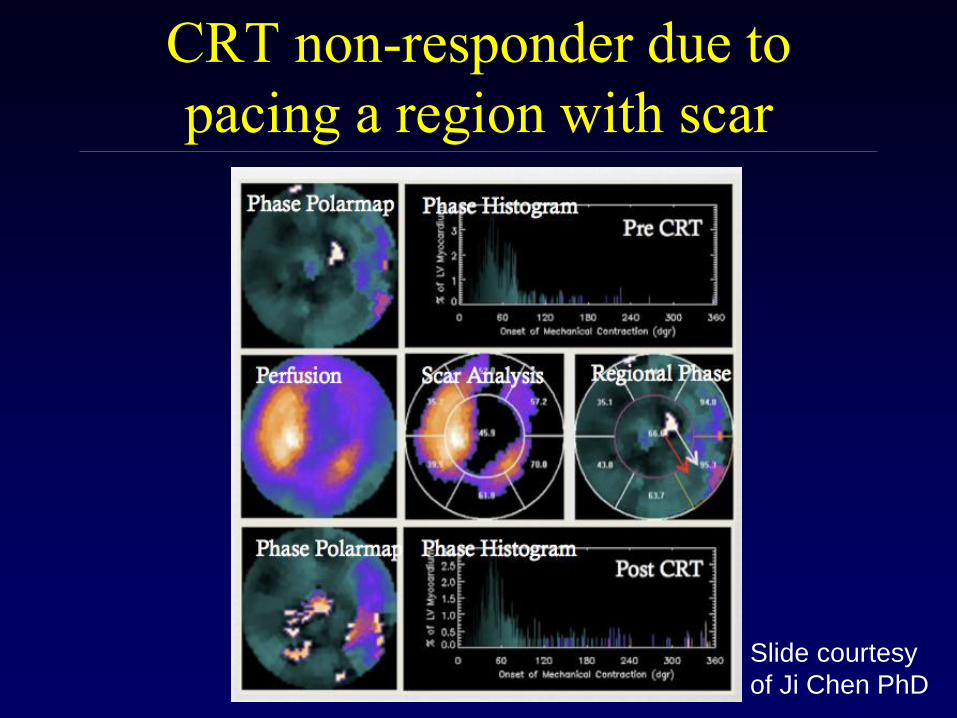
CRT non-responder due to
pacing a region with scar
Slide courtesy
of Ji Chen PhD
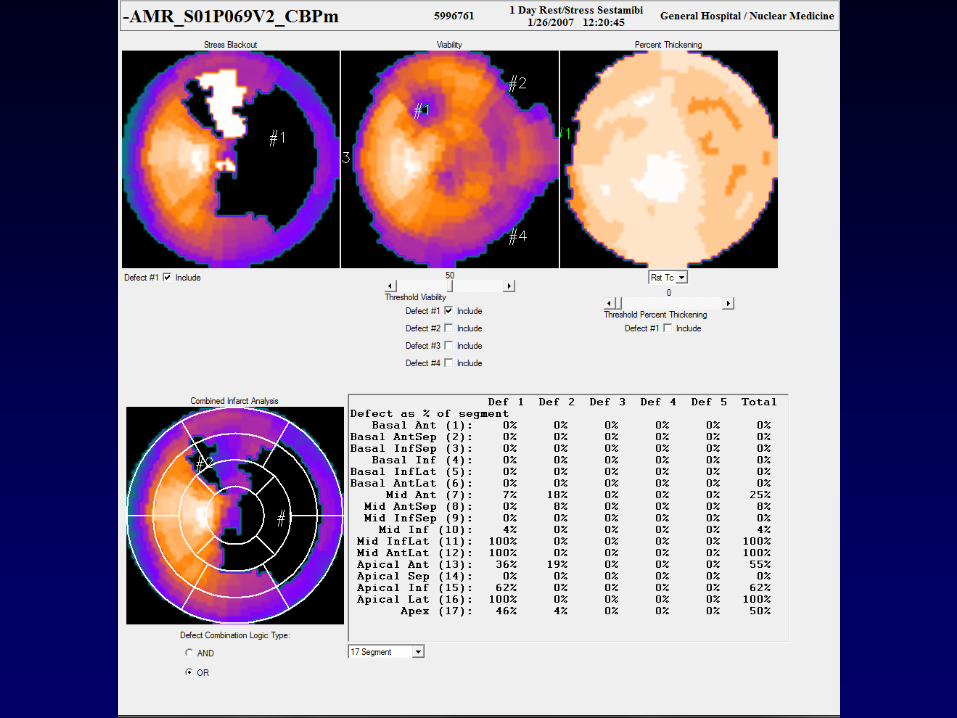
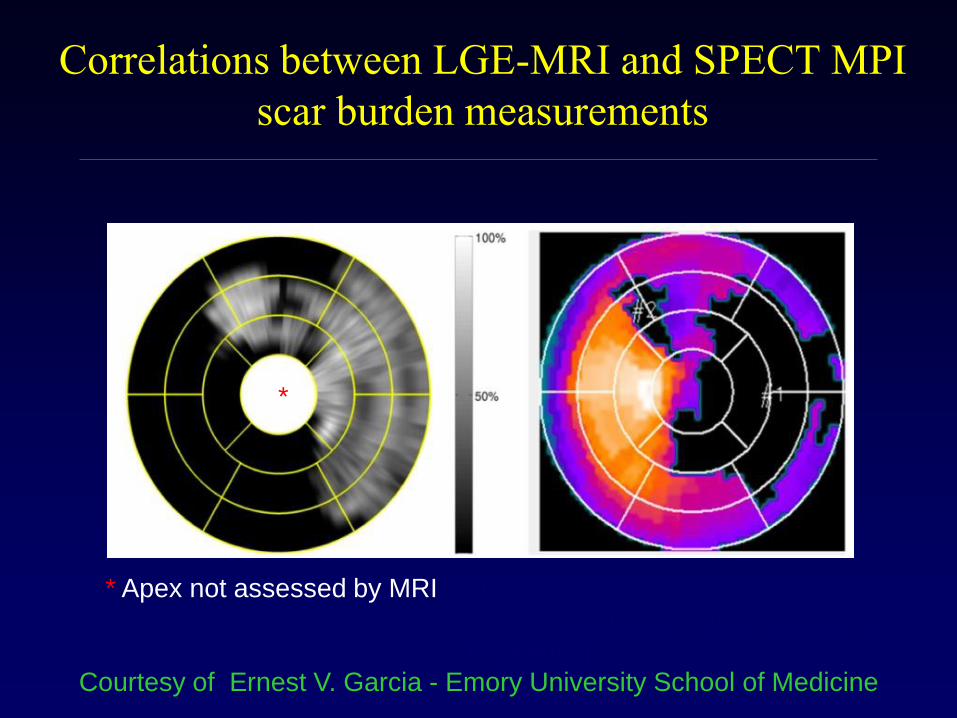
Correlations between LGE-MRI and SPECT MPI
scar burden measurements
LGE-MRI > 50% Transmurality Tc-99m SPECT
3-criteria – NDB, % max &
Thickening
* Apex not assessed by MRI
*
Courtesy of Ernest V. Garcia - Emory University School of Medicine
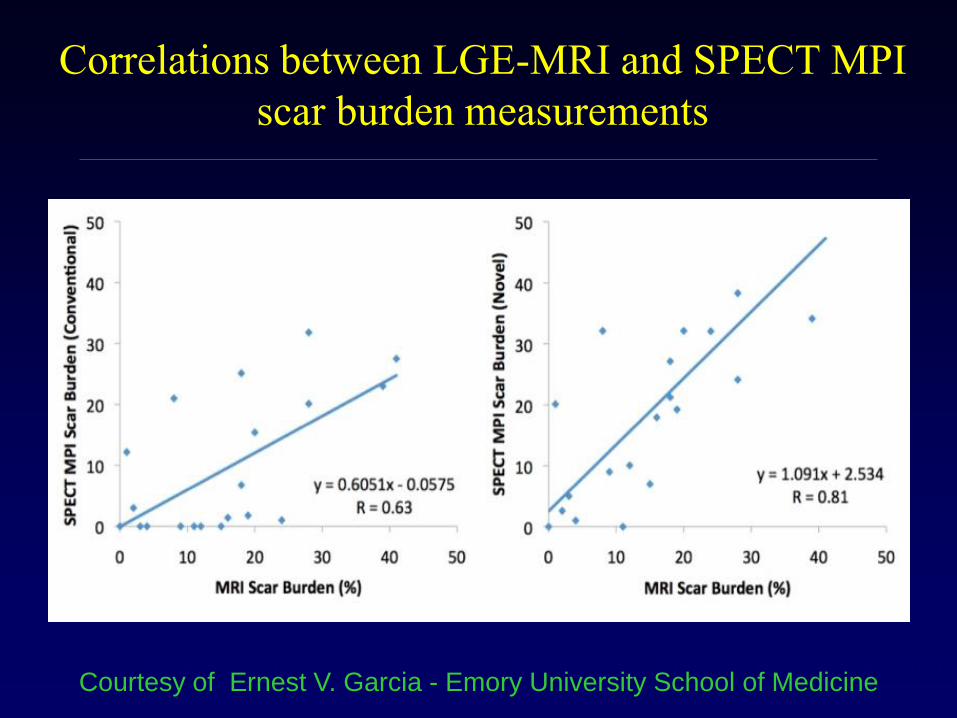
Correlations between LGE-MRI and SPECT MPI
scar burden measurements
% Max Counts 3-criteria – NDB, % max & Thickening Courtesy of Ernest V. Garcia - Emory University School of Medicine
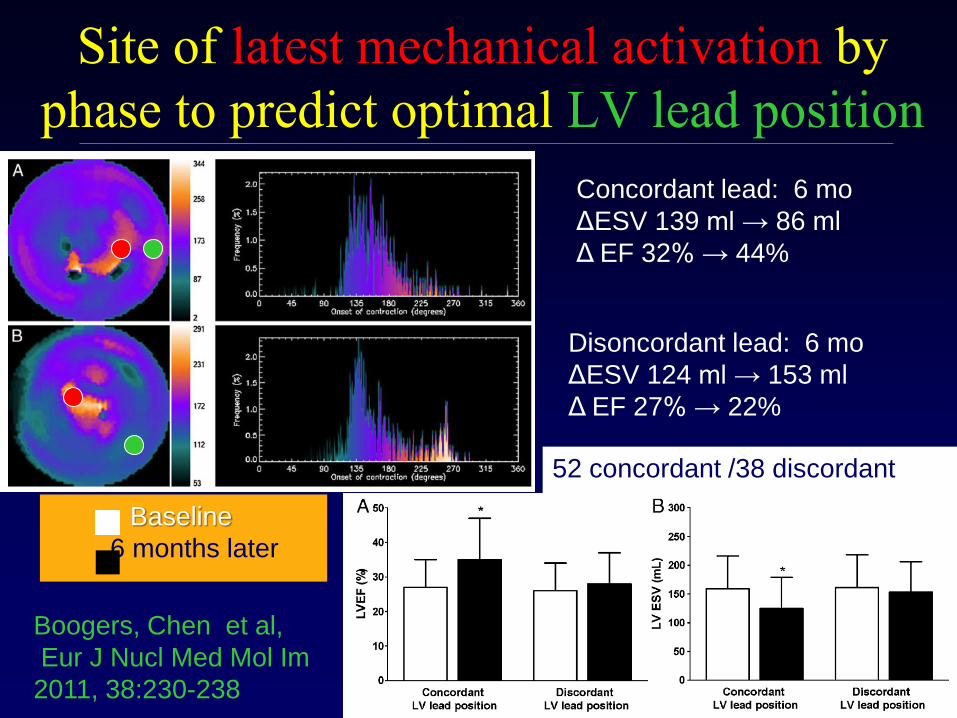
Site of latest mechanical activation by
phase to predict optimal LV lead position
Concordant lead: 6 mo
ΔESV 139 ml → 86 ml
Δ EF 32% → 44%
Disoncordant lead: 6 mo
ΔESV 124 ml → 153 ml
Δ EF 27% → 22%
Boogers, Chen et al,
Eur J Nucl Med Mol Im
2011, 38:230-238
Baseline
6 months later
52 concordant /38 discordant
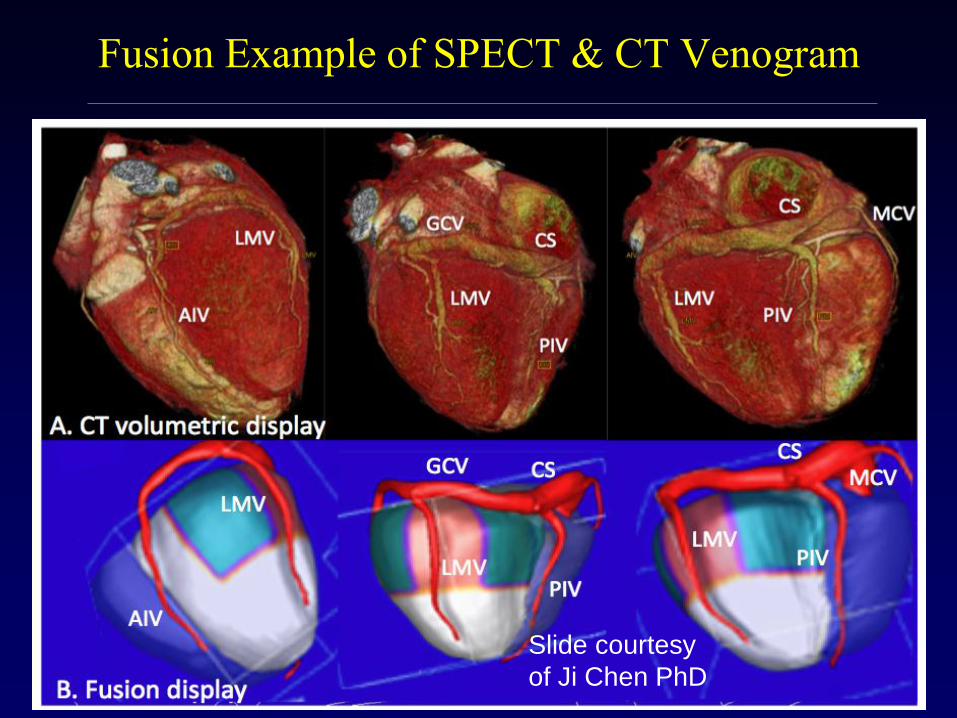
Fusion Example of SPECT & CT Venogram
Slide courtesy
of Ji Chen PhD
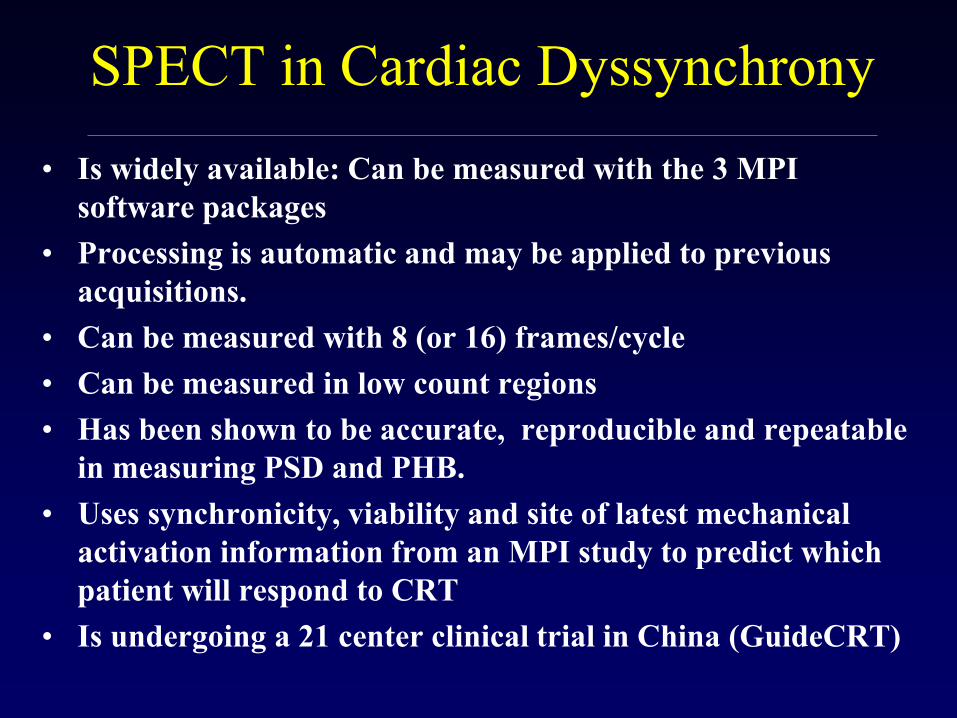
• Is widely available: Can be measured with the 3 MPI
software packages
• Processing is automatic and may be applied to previous
acquisitions.
• Can be measured with 8 (or 16) frames/cycle
• Can be measured in low count regions
• Has been shown to be accurate, reproducible and repeatable
in measuring PSD and PHB.
• Uses synchronicity, viability and site of latest mechanical
activation information from an MPI study to predict which
patient will respond to CRT
• Is undergoing a 21 center clinical trial in China (GuideCRT)
SPECT in Cardiac Dyssynchrony
Nuevos horizontes en equipos
Llamas del nacimiento
de
una estrella
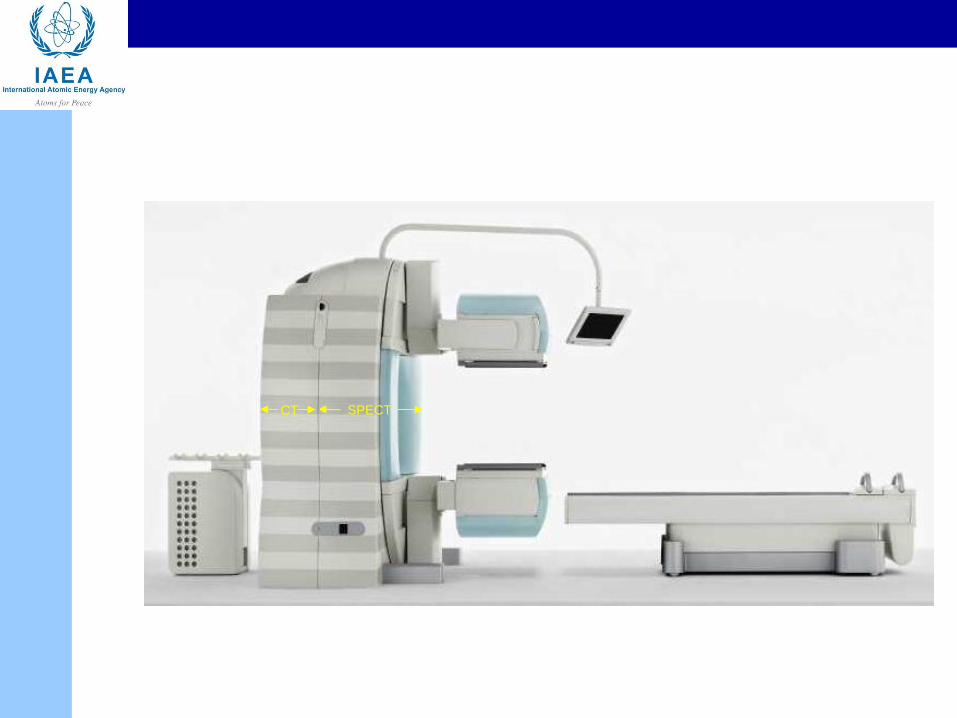
SPECT CT
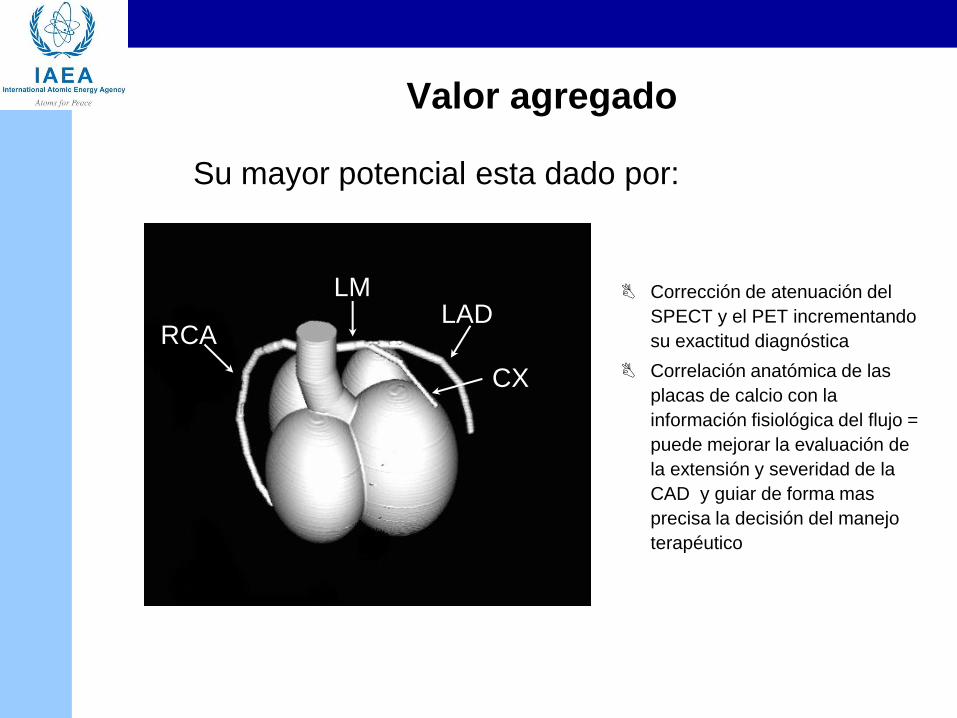
Valor agregado
Corrección de atenuación del
SPECT y el PET incrementando
su exactitud diagnóstica
Correlación anatómica de las
placas de calcio con la
información fisiológica del flujo =
puede mejorar la evaluación de
la extensión y severidad de la
CAD y guiar de forma mas
precisa la decisión del manejo
terapéutico
RCA
LM
CX
LAD
Su mayor potencial esta dado por:
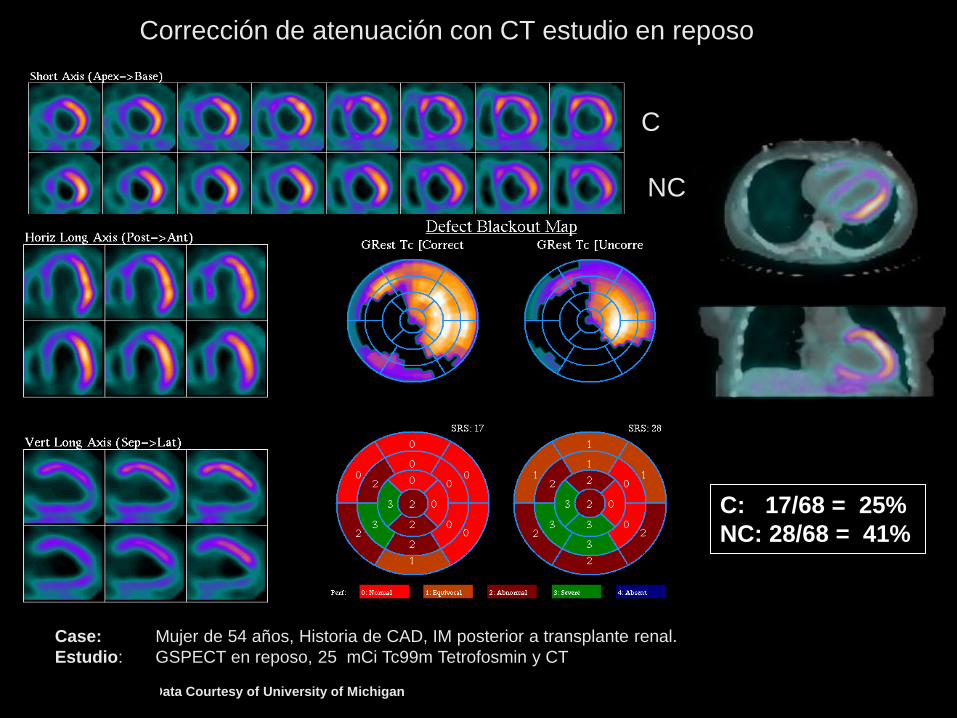
C
U
Corrección de atenuación con CT estudio en reposo
Data Courtesy of University of Michigan
Case: Mujer de 54 años, Historia de CAD, IM posterior a transplante renal.
Estudio: GSPECT en reposo, 25 mCi Tc99m Tetrofosmin y CT
C: 17/68 = 25%
NC: 28/68 = 41%
C
NC
Evaluación de
Calcio Coronario
y
Morfología de la
Placa Coronaria
Headline Headline
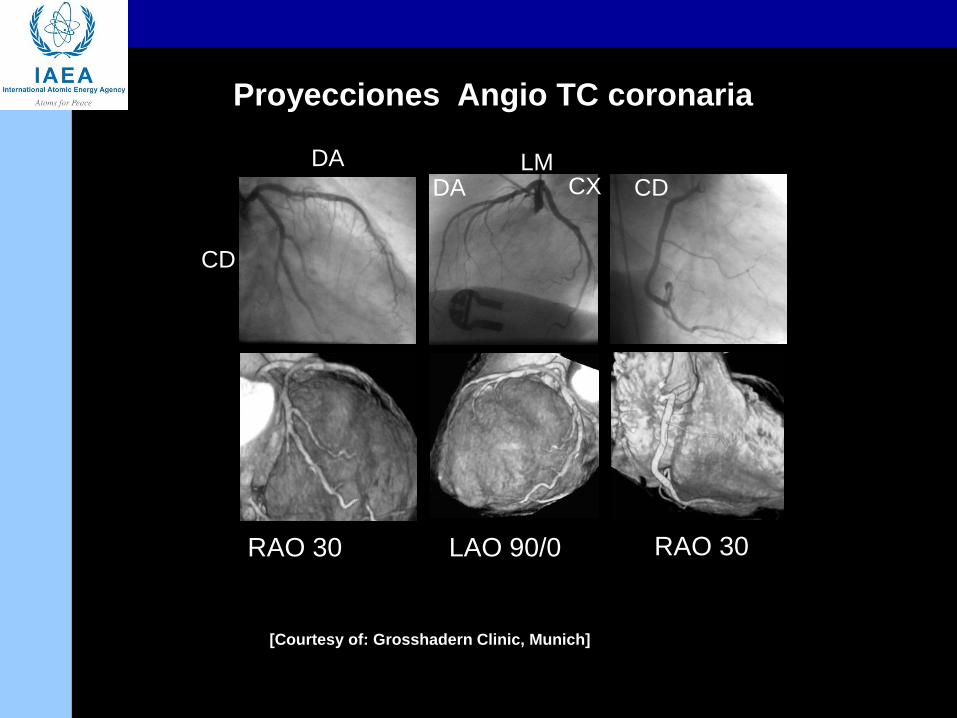
RAO 30 LAO 90/0 RAO 30
[Courtesy of: Grosshadern Clinic, Munich]
Proyecciones Angio TC coronaria
DA
CD
LM DA CX CD
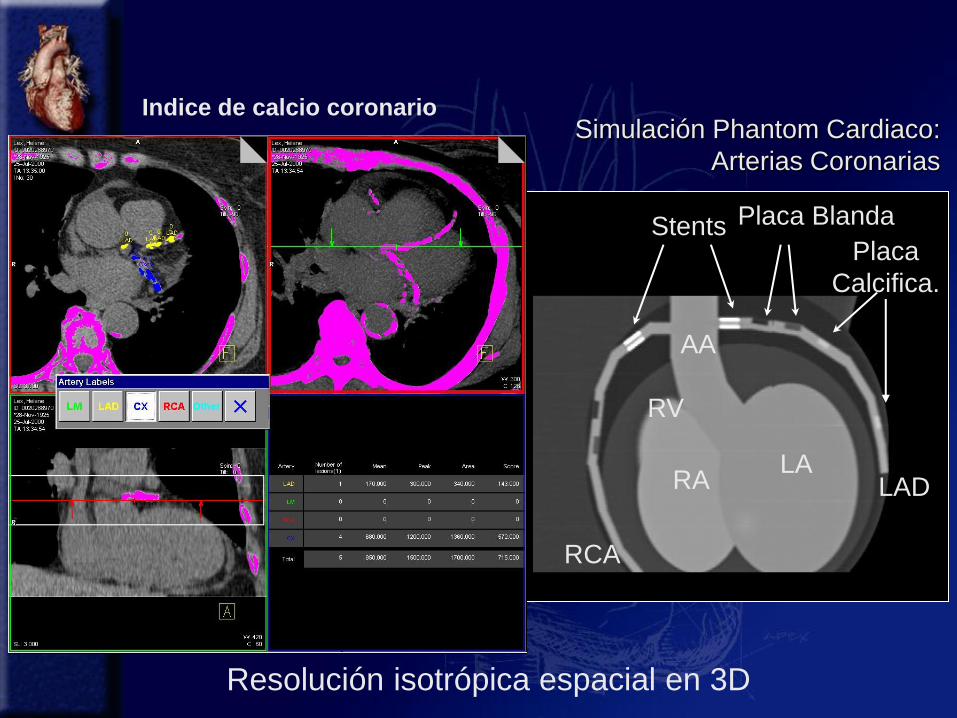
Simulación Phantom Cardiaco:
Arterias Coronarias
Resolución isotrópica espacial en 3D
Stents Placa Blanda
Placa
Calcifica.
AA
LA RA
RV
RCA
LAD
Indice de calcio coronario
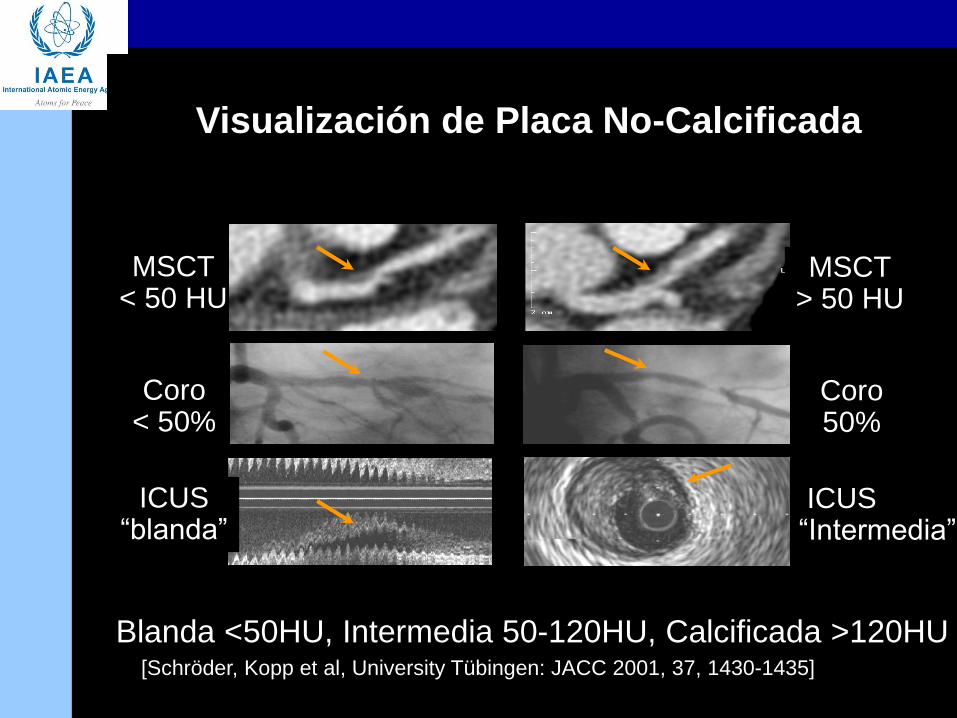
Visualización de Placa No-Calcificada
Blanda <50HU, Intermedia 50-120HU, Calcificada >120HU [Schröder, Kopp et al, University Tübingen: JACC 2001, 37, 1430-1435]
MSCT < 50 HU
Coro < 50%
ICUS “blanda”
MSCT > 50 HU
Coro 50%
ICUS “Intermedia”
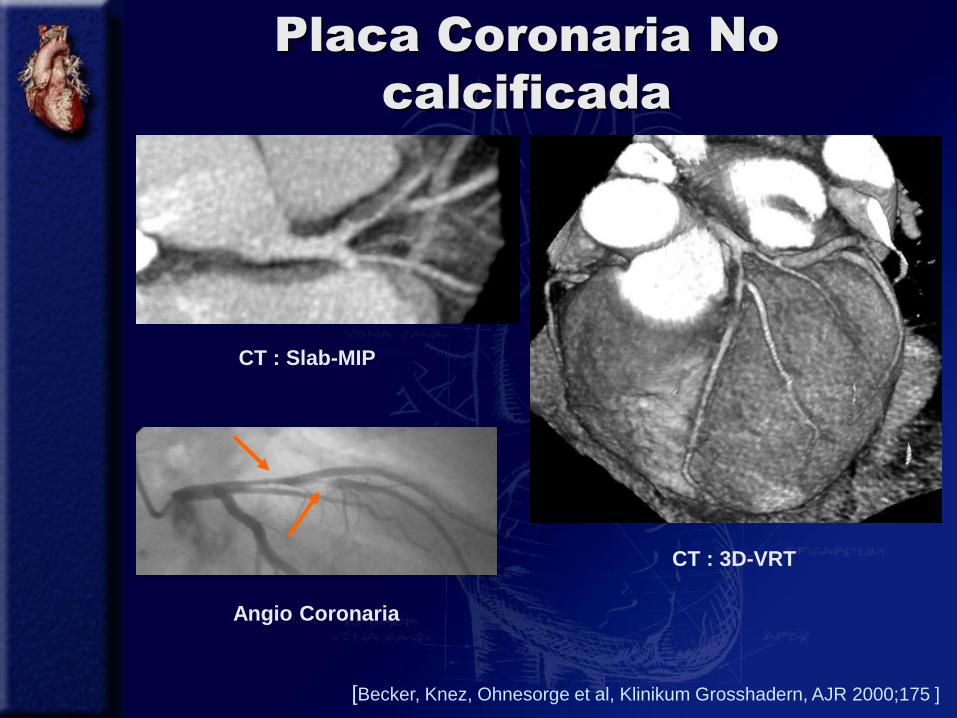
Placa Coronaria No
calcificada
CT : Slab-MIP
Angio Coronaria
CT : 3D-VRT
[Becker, Knez, Ohnesorge et al, Klinikum Grosshadern, AJR 2000;175 ]
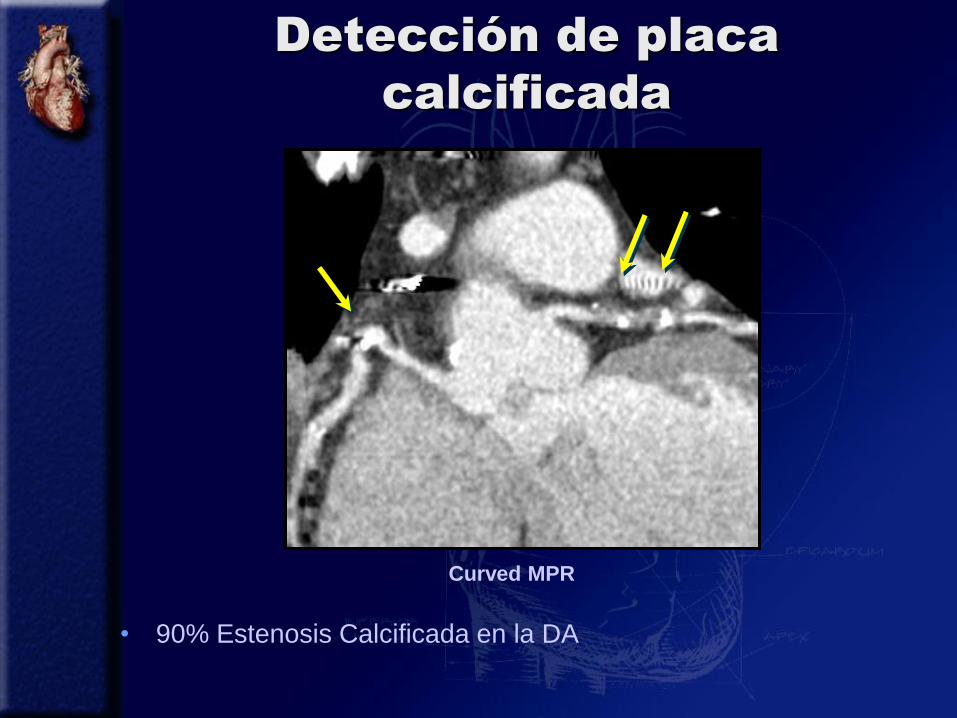
Detección de placa
calcificada
Curved MPR
• 90% Estenosis Calcificada en la DA
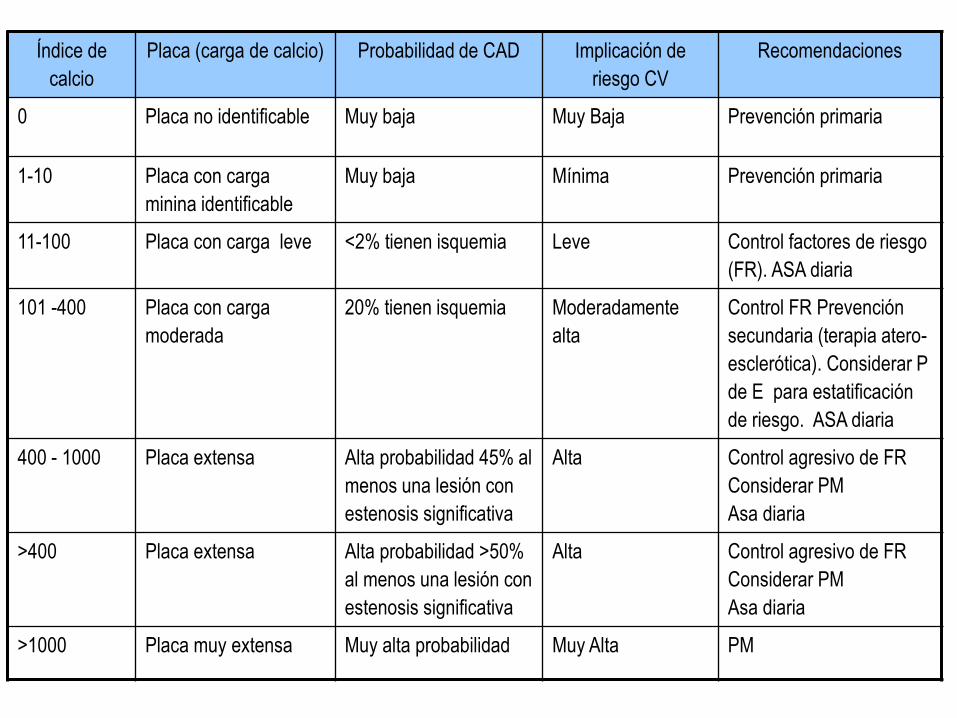
Índice de
calcio
Placa (carga de calcio) Probabilidad de CAD Implicación de
riesgo CV
Recomendaciones
0 Placa no identificable Muy baja Muy Baja Prevención primaria
1-10 Placa con carga
minina identificable
Muy baja Mínima Prevención primaria
11-100 Placa con carga leve <2% tienen isquemia Leve Control factores de riesgo
(FR). ASA diaria
101 -400 Placa con carga
moderada
20% tienen isquemia Moderadamente
alta
Control FR Prevención
secundaria (terapia atero-
esclerótica). Considerar P
de E para estatificación
de riesgo. ASA diaria
400 - 1000 Placa extensa Alta probabilidad 45% al
menos una lesión con
estenosis significativa
Alta Control agresivo de FR
Considerar PM
Asa diaria
>400 Placa extensa Alta probabilidad >50%
al menos una lesión con
estenosis significativa
Alta Control agresivo de FR
Considerar PM
Asa diaria
>1000 Placa muy extensa Muy alta probabilidad Muy Alta PM
PM E INDICE DE CALCIO
Altamente complementarios
PM pronóstico a corto plazo
IC pronóstico a largo plazo
Ateroesclerosis subclínica alto riesgo de
desarrollar CAD a largo plazo = modificación
factores de riesgo
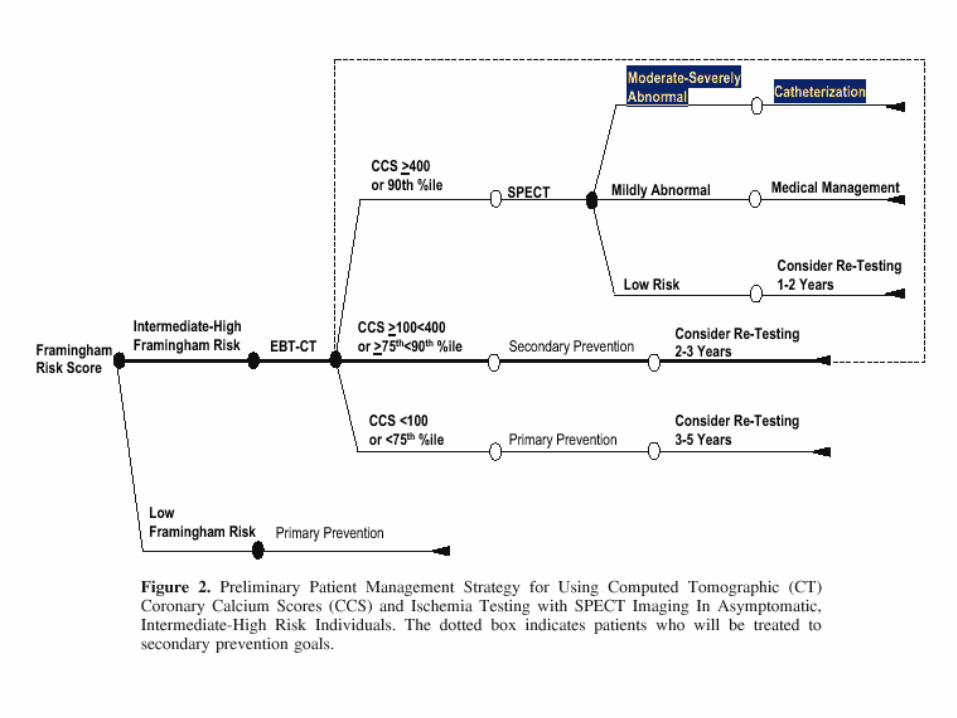
Integración del SPECT y CT para
guía terapéutica
La evidencia actual sugiere que la combinación de
ICC y SPECT es mejor que el SPECT sólo para
determinar la necesidad de una terapia más agresiva
Más que identificar el riesgo del paciente el propósito
de las imágenes de PM en una estrategia combinada
es la identificación de pacientes que se pueden
beneficiar de RVM o intervención para prevención de
isquemia o reducción de riesgo
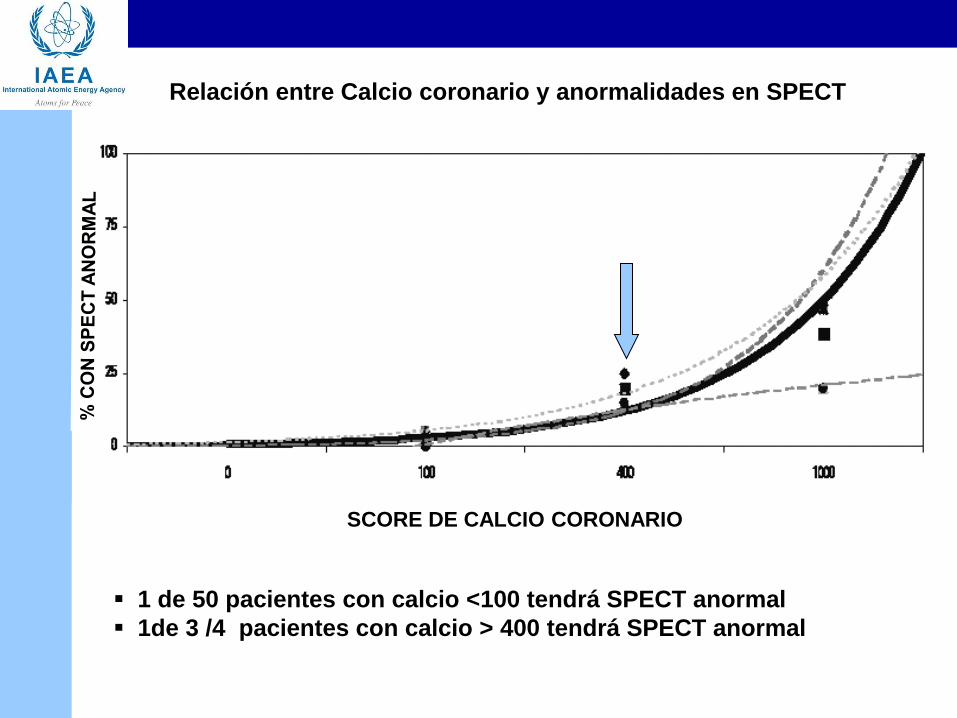
Relación entre Calcio coronario y anormalidades en SPECT
1 de 50 pacientes con calcio <100 tendrá SPECT anormal
1de 3 /4 pacientes con calcio > 400 tendrá SPECT anormal
SCORE DE CALCIO CORONARIO
Caso
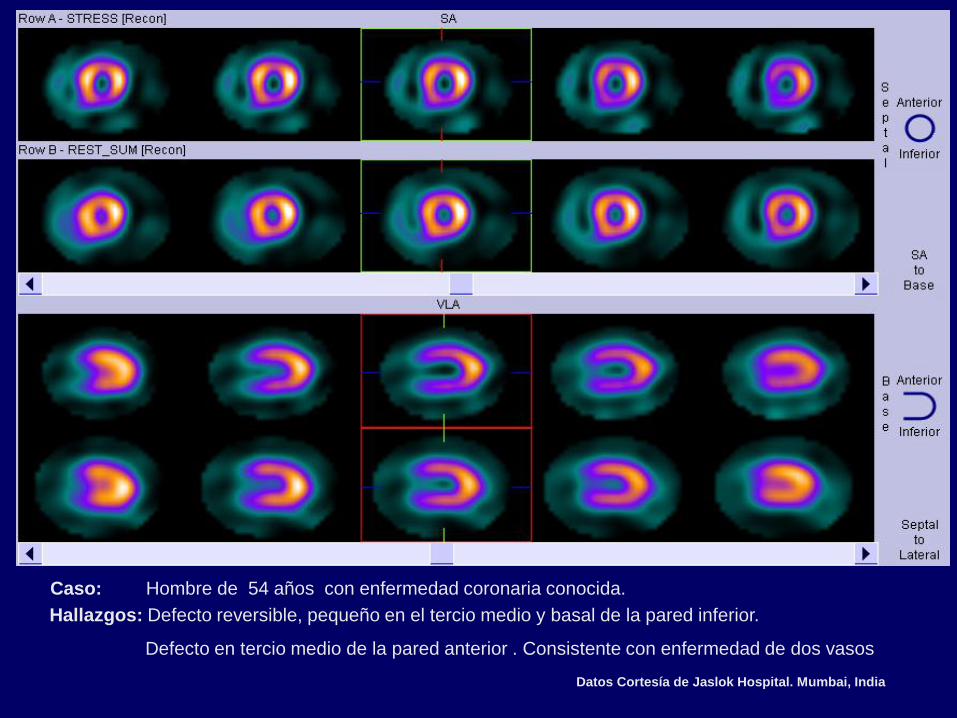
Datos Cortesía de Jaslok Hospital. Mumbai, India
Caso: Hombre de 54 años con enfermedad coronaria conocida.
Hallazgos: Defecto reversible, pequeño en el tercio medio y basal de la pared inferior.
Defecto en tercio medio de la pared anterior . Consistente con enfermedad de dos vasos
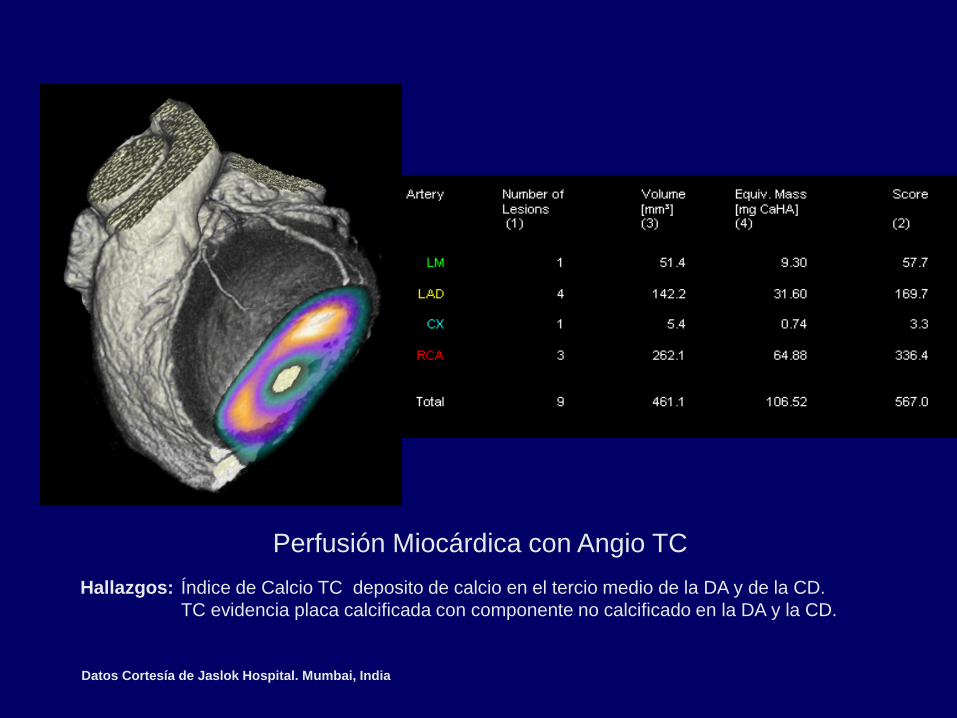
Hallazgos: Índice de Calcio TC deposito de calcio en el tercio medio de la DA y de la CD.
TC evidencia placa calcificada con componente no calcificado en la DA y la CD.
Perfusión Miocárdica con Angio TC
Datos Cortesía de Jaslok Hospital. Mumbai, India
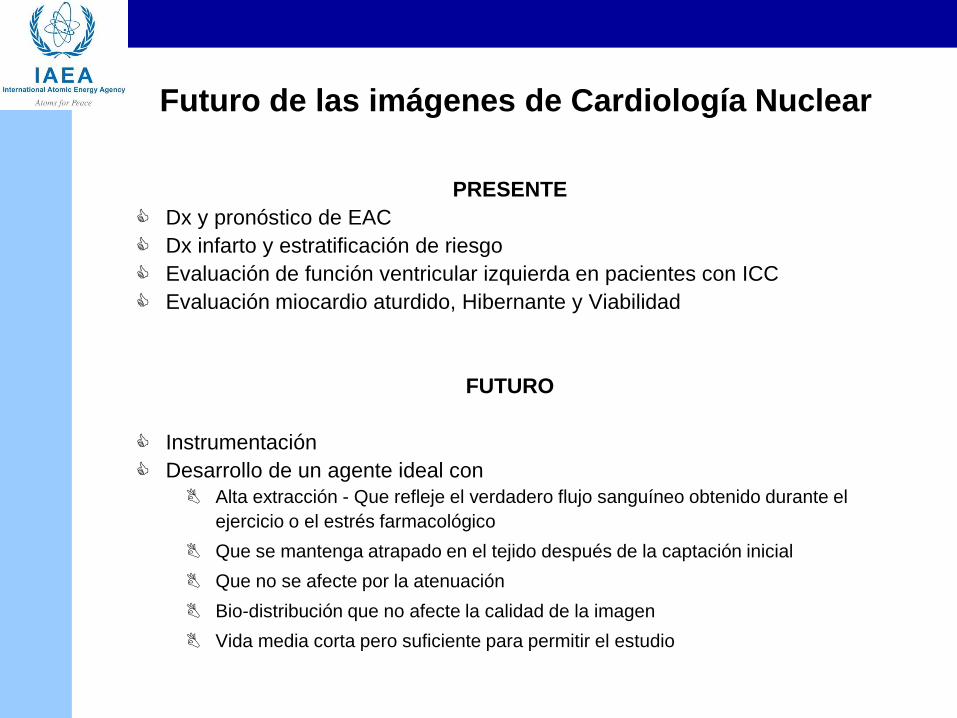
Futuro de las imágenes de Cardiología Nuclear
PRESENTE
Dx y pronóstico de EAC
Dx infarto y estratificación de riesgo
Evaluación de función ventricular izquierda en pacientes con ICC
Evaluación miocardio aturdido, Hibernante y Viabilidad
FUTURO
Instrumentación
Desarrollo de un agente ideal con
Alta extracción - Que refleje el verdadero flujo sanguíneo obtenido durante el
ejercicio o el estrés farmacológico
Que se mantenga atrapado en el tejido después de la captación inicial
Que no se afecte por la atenuación
Bio-distribución que no afecte la calidad de la imagen
Vida media corta pero suficiente para permitir el estudio

Gracias