Embed Size (px)
Citation preview
Revista deMetalurgiaVolumen 55 Nº 1 enero - marzo 2019 Madrid (España) ISSN-L: 0034-8570
editorial.csic.es CONSEJO SUPERIOR DE INVESTIGACIONES CIENTÍFICAS
CS
IC
Revista deMetalurgia
Revi
sta d
e M
eta
lurg
iaV
olum
en 5
5 |
Nº
1 | 2
01
9
| M
adrid
http://revistademetalurgia.revistas.csic.es
SumarioEvaluación ultrasónica de las fases formadas de un acero inoxidable dúplex 2205 tratado térmicamente a 750 °C y su comportamiento frente a la corrosiónUltrasonic evaluation of the formed phases in a duplex stainless steel 2205 heat treated at 750 °C and corrosion behavior
P. Trocoli-MonTesino, e. rodríguez-PraTo, a. rosales-Mendoza, W. gonzález-HerMosilla
Estudio comparativo de la nitrocarburación de los aceros AISI 4340 y AISI 347 mediante el proceso Tenifer-QPQ®Comparative study of AISI 4340 and AISI 347 nitrocarburizing by Tenifer-QPQ® process
l. Bellas, g. casTro, l. Mera, J.l. Mier, a. garcía, a. Varela
Análisis del envejecimiento artificial en horno de inducción y los costos de energía de los materiales 6082 Al y 7075 AlAnalysis of artificial aging with induction and energy costs of 6082 Al and 7075 Al materials
M. TasTan, H. gökozan, P.s. ÇaVdar, g. soy, u. ÇaVdar
La eliminación de metales tóxicos presentes en efluentes líquidos mediante resinas de cambio iónico.
Parte IX: Plomo(II))/H+/Amberlite IR-120The removal of toxic metals from liquid effluents by ion exchange resins. Part IX: Lead(II)/H+/Amberlite IR-120
F.J. alguacil
Efecto del cobalto sobre nano-partículas de óxido de zinc en el desempeño anticorrosivo de un imprimante alquídicoEffect of cobalt on zinc oxide nanoparticles in the anticorrosive performance of an alkyd primer
s. Flores, o. cHuMPiTaz
Efecto del sistema de apantallamiento de la soldadura y el tiempo de almacenaje de los electrodos en el contenido de hidrógeno difundido en el metal depositadoEffect of the welding environment and storage time of electrodes on the diffusible hydrogen content in deposited metal
J. ToMkóW, d. FydrycH, g. rogalski, J. ŁaBanoWski
Nº 1 enero - marzo 2019 Madrid (España) ISSN-L: 0034-8570Volumen 55
Centro naCional de investigaCiones MetalúrgiCas
Volumen 55 Nº 1 enero - marzo 2019 Madrid (España) ISSN-L: 0034-8570
Revista de Metalurgia
SERVICIOS DE INFORMACIÓN
REVISTA DE METALURGIA se incluye también en las bases de datos siguientes: Chemical Abstracts, Pascal Metadex, Aluminum Industry Abstracts, Compendex Plus, World Translations, Dialog Source one Engineering, Energy Science & Technology, Nuclear Science Abstracts, Analytical Abstracts, Paperchem y las bases de datos del ISI, SciSearch, SCI Ex-pandes, Research Alert, Materials Science Citation Index, Current Contents/Engineering, Computing & Technology (CC/EC&T), ICYT y Catálogo Lantidex.
Copyright: © 2019 CSIC. La edición electrónica de esta revista se distribuye bajo los términos de una licencia de uso y distribución Creative Commons Reconocimiento 4.0 Internacional (CC BY 4.0).
El Centro no se hace responsable del contenido de ningún artículo y el hecho de que patrocine su difusión no implica, necesariamente, conformidad con las tesis expuestas. Los originales de la revista “Revista de Metalurgia”, publicados en papel y en versión electrónica, son propiedad del Consejo Superior de Investigaciones Científicas, siendo necesario citar la procedencia en cualquier reproducción parcial o total. De acuerdo con las disposiciones vigentes, deberá mencionarse el nombre de esta revista en toda reproducción total o parcial de los trabajos contenidos en la misma.
ISSN-L: 0034-8570ISSN: 0034-8570eISSN: 1988-4222NIPO (en línea): 694-19-056-6Impreso en España. Printed in Spain
Imprime: DATAPAGE
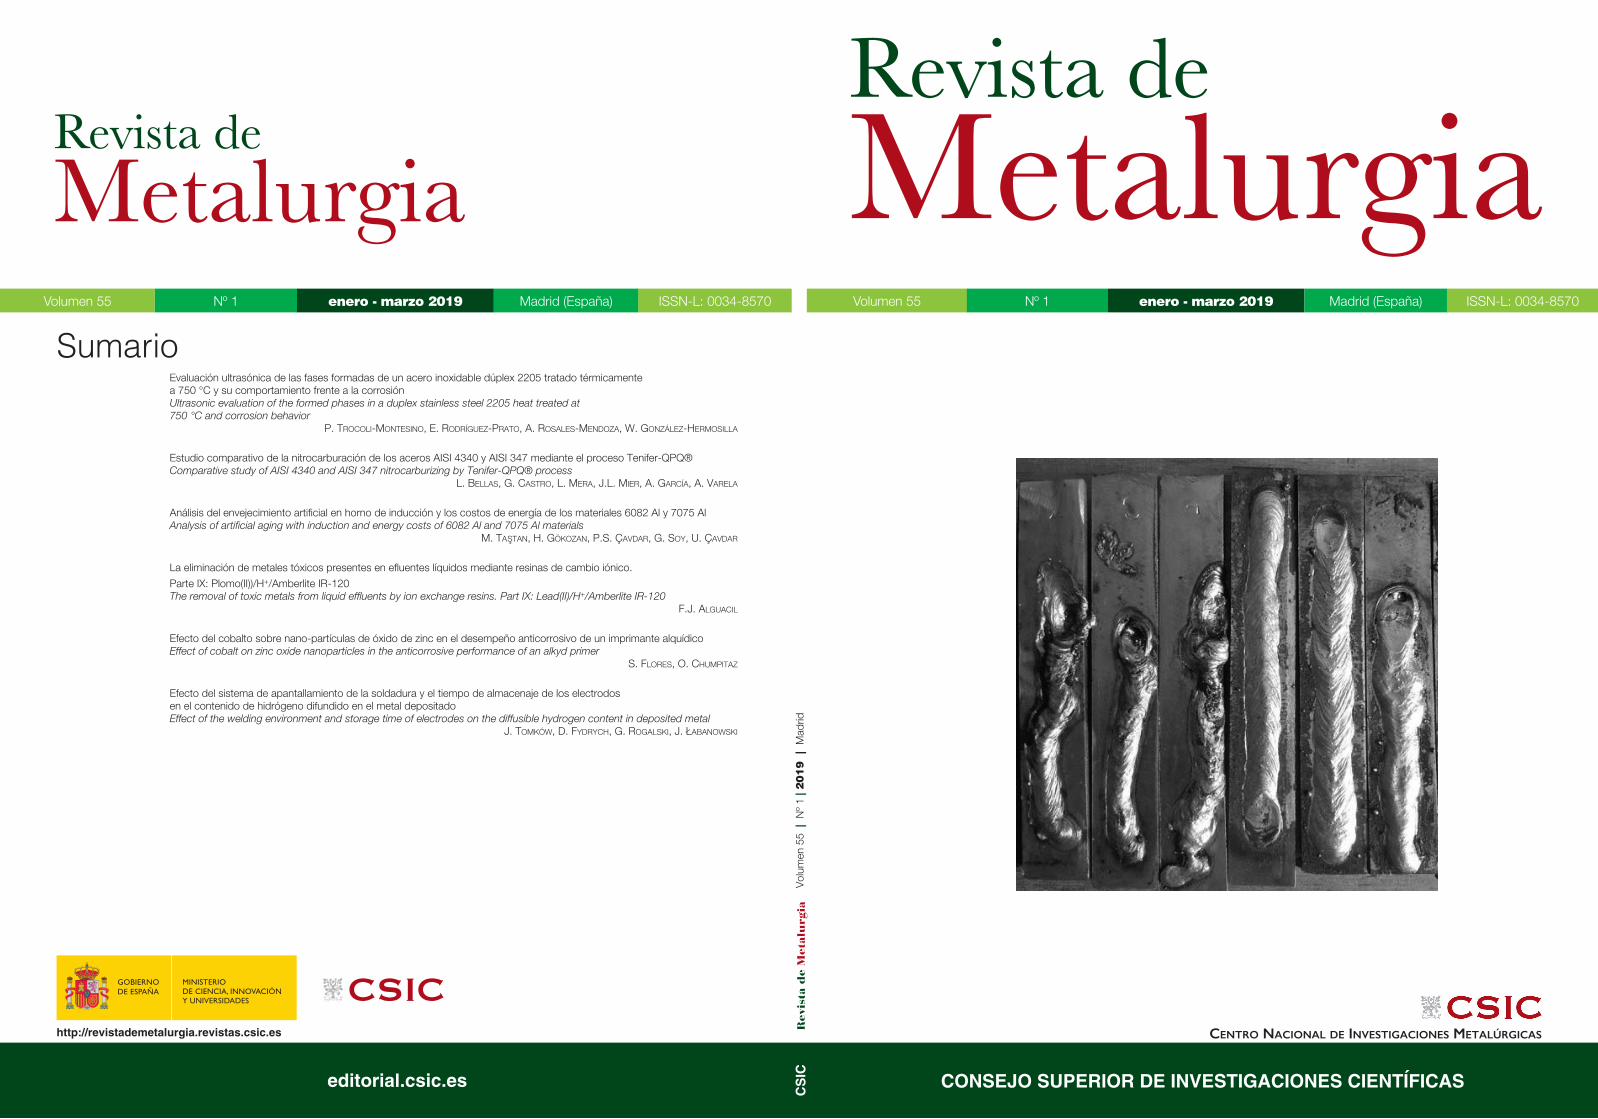
Exemplary specimens after pad welding, first three-welded in the water, second three-welded in air. J.Tomkóv, D.Fydrych, G.Rogalski, J.Labanowsky, e140 (2019)
REVISTA DE METALURGIA Revista publicada por el Centro Nacional de Investigaciones Metalúrgicas (CENIM)
Director: Félix A. López Gómez. CENIM, CSICSecretaria: Nancy Ayala Montes. CENIM, CSIC
Consejo de Redacción:
Consejo Asesor:
Revista de Metalurgia es una publicación bimestral. Desde 1998, Revista de Metalurgia y Revista Soldadura se funden en una sola publicación. Los temas de soldadura y corte se incluyen en la nueva publicación que conserva el nombre de Revista de Metalurgia.Revista de Metalurgia está incluida, desde 1997, en el producto del ISI denominado Journal Citation Reports (JCR), Science Edition.La revista se publica en la modalidad de acceso abierto en: http://revistademetalurgia.revistas.csic.es/index.php/revistademetalurgia.
Revista de Metalurgia is a bimonthly publication. Since 1998 Revista de Metalurgia and Revista Soldadura have been combined in a single publication that conserves the name Revista de Metalurgia but also includes welding and cutting topics. Revista de Metalurgia is, since 1997, cited in the ISI Journal Citation Reports (JCR), Science Edition.The journal is published in electronic edition and in the open access system in: http://revistademetalurgia.revistas.csic.es/index.php/revistademetalurgia.
David Bastidas. University of AkronAgustina Asenjo. ICMM, CSICCarmen Cepeda. Instirtuto Imdea MaterialesCarmen Baudín de la Lastra. ICV, CSICPaloma Fernández. Facultad de Físicas, Universidad Complutense de MadridCarlos Capdevila Montes. CENIM, CSICJuan José De Damborenea. CENIM, CSICAsunción García Escorial. CENIM, CSICIván Gutiérrez-Urrutia. Max Planck Institute for Iron Research
Félix A. López Gómez. CENIM, CSICUgur Çadvar. Mechanical Engineering Deparment, Izmir Demokrasi UniversityLucien Veleva. Departamento de Física, Centro de Investigación y Estudios Avanzados del Instituto Politécnico Nacional de MéxicoFernando Pedraza. La Rochelle UniversitéMagdalena Regel-Rosocka. Institute of Chemical Technology and Engineering, Poznan UniversityPedro Rivera. Department of Materials Science and Metallurgy, University of Cambridge
Fernando Audebert. Universidad de Buenos AiresG. Tim Burtein. Universidad de CambridgeJosé María Cabrera Marrero. Universidad Politécnica de CataluñaKatia R. Cardoso. Universidad de Sao PauloAna Conde. CENIM, CSICDaniel De la Fuente. CENIM, CSICMaría Teresa Freire Vieira. Universidad de CoimbraMarina Galano. Universidad de OxfordAmauri García. Universidade Estadual de CampinasSandra Judith García Vergara. Universidad Industrial de SantanderFrancesc Xavier Gil. Universidad Politécnica de CataluñaIñaki Hurtado Hurtado. Universidad de MondragónAntonie Jérusalem. Universidad de Oxford
Dietmar Letzig. Helmholtz Zentrum GeesthachtChristofer Leygraf. KTH Royal Institute for Materials Research and TestingMarta López Jenssen. Universidad de ConcepciónEnrique Otero Huerta. Universidad Rey Juan CarlosAngelo Fernando Padilha. Universidad de Sao PauloAngel Pardo. Universidad Complutense de MadridPedro Portela. BAM Federal Institute for Materials Research and TestingIlchat Sabirov. Instituto IMDEA MaterialesRoberto Sagaró Zamora. Universidad de OrienteDavid. San Martín. CENIM, CSICMartin Stratmann. Max-Planck-Institut für Eisenforschung GmbHIan Todd. Universidad de Sheffield
REDACCIÓN E INTERCAMBIO
Centro Nacional de Investigaciones MetalúrgicasAvda. Gregorio del Amo, 828040 MadridTeléfono: +34 915 538 900Fax: +34 915 347 425E-mail: [email protected]ágina web:www.cenim.csic.es
DISTRIBUCIÓN, SUSCRIPCIÓN Y VENTA
EDITORIAL CSIC / CSIC PressC/ Vitruvio,8. 28006 MadridTel.: +34 91 568 1402editorial.csic.ese-mail: [email protected]
VENTASDigitalia US: https://www.digitaliapublishing.com/ejournals
(Buscar libros/ por editoriales/Editorial CSIC)Torrossa Casalini: https://www.torrossa.it/csic
Volumen 55 Nº 1 enero - marzo 2019 Madrid (España) ISSN-L: 0034-8570
Evaluación ultrasónica de las fases formadas de un acero inoxidable dúplex 2205 tratado térmicamente a 750 °C y su comportamiento frente a la corrosiónUltrasonic evaluation of the formed phases in a duplex stainless steel 2205 heat treated at 750 °C and corrosion behaviorP. Trocoli-Montesino, E. Rodríguez-Prato, A. Rosales-Mendoza, W. González-Hermosilla .............. e135
Estudio comparativo de la nitrocarburación de los aceros AISI 4340 y AISI 347 mediante el proceso Tenifer-QPQ®Comparative study of AISI 4340 and AISI 347 nitrocarburizing by Tenifer-QPQ® processL. Bellas, G. Castro, L. Mera, J.L. Mier, A. García, A. Varela ................................................................ e136
Análisis del envejecimiento artificial en horno de inducción y los costos de energía de los materiales 6082 Al y 7075 AlAnalysis of artificial aging with induction and energy costs of 6082 Al and 7075 Al materialsM. Tastan, H. Gökozan, P.S. Çavdar, G. Soy, U. Çavdar ...................................................................... e137
La eliminación de metales tóxicos presentes en efluentes líquidos mediante resinas de cambio iónico. Parte IX: Plomo(II))/H+/Amberlite IR-120The removal of toxic metals from liquid effluents by ion exchange resins. Part IX: Lead(II)/H+/Amberlite IR-120F.J. Alguacil ............................................................................................................................................ e138
Efecto del cobalto sobre nano-partículas de óxido de zinc en el desempeño anticorrosivo de un imprimante alquídicoEffect of cobalt on zinc oxide nanoparticles in the anticorrosive performance of an alkyd primerS. Flores, O. Chumpitaz ......................................................................................................................... e139
Efecto del sistema de apantallamiento de la soldadura y el tiempo de almacenaje de los electrodos en el contenido de hidrógeno difundido en el metal depositadoEffect of the welding environment and storage time of electrodes on the diffusible hydrogen content in deposited metalJ. Tomków, D. Fydrych, G. Rogalski, J. Łabanowski ............................................................................ e140
Revista de Metalurgia
Sumario/Summary
Volumen 55 Nº 1 enero - marzo 2019 Madrid (España) ISSN-L: 0034-8570
Revista de MetaluRgia Enero–Marzo 2019, 55(1), e135
ISSN-L: 0034-8570https://doi.org/10.3989/revmetalm.135
Evaluación ultrasónica de las fases formadas de un acero inoxidable dúplex 2205 tratado térmicamente a 750 °C y su
comportamiento frente a la corrosión
Paola Trocoli-Montesino, Edda Rodríguez-Prato*, Adalberto Rosales-Mendoza, Wilfrido González-Hermosilla
a Universidad Simón Bolívar, Dpto. de Ciencias de los Materiales, Apartado 89000, Caracas 1080, Venezuela
(*Autor para la correspondencia: [email protected])
Enviado: 6 Marzo 2018; Aceptado: 28 Agosto 2018; Publicado on-Line: 20 Marzo 2019
RESUMEN: El presente estudio evalúa el comportamiento de las variables ultrasónicas en probetas de acero inoxidable dúplex 2205 (UNS31803/ EN1.4462), tratadas térmicamente a 750 °C durante distintos tiempos, con el objetivo de promover la precipitación de fases secundarias, chi (χ) y sigma (σ). Se estudió la evolución microestructural mediante microscopía óptica y electrónica de barrido, y utilizando la técnica ultrasónica pulso eco de contacto. Finalmente, se realizaron ensayos electroquímicos con el objetivo de evaluar la resistencia a la corrosión. Los resultados revelaron que a medida que aumenta el tiempo de tratamiento térmico se produce un incremento de las cantidades relativas de fases χ y σ a lo largo de las interfases ferrita/ferrita y ferrita/aus-tenita, especialmente hacia el interior del grano ferrítico. La velocidad de onda longitudinal y el coeficiente de atenuación presentaron una tendencia que coincide con los cambios microestructurales generados por efecto del tratamiento térmico. La evaluación electroquímica reveló una alta resistencia a la corrosión uniforme. No obstante, se observó una correlación entre el aumento del tiempo de tratamiento térmico con la pérdida de la resistencia a la corrosión localizada.
PALABRAS CLAVE: Acero inoxidable dúplex 2205; Corrosión; Evaluación ultrasónica; Fase Chi; Fase Sigma; Tratamiento térmico
Citar como/Citation: Trocoli-Montesino, P.; Rodríguez-Prato, E.; Rosales-Mendoza, A.; González-Hermosilla, W. (2019). “Evaluación ultrasónica de las fases formadas de un acero inoxidable dúplex 2205 tratado térmicamente a 750 °C y comportamiento frente a la corrosión”. Rev. Metal. 55(1): e135. https://doi.org/10.3989/revmetalm.135
ABSTRACT: Ultrasonic evaluation of the formed phases in a duplex stainless steel 2205 heat treated at 750 °C and corrosion behavior. The aim of this study is to investigate the behavior of the ultrasonic parameters in a duplex stainless steel type 2205 (UNS31803/EN1.4462) through aging heat treatments at 750 °C during differ-ent times. The main objective is to promote the precipitation of secondary phases, especially chi (χ) and sigma (σ). The microstructural evolution was studied using optical microscopy and scanning electron microscopy and afterwards the specimens were evaluated using the ultrasonic pulse echo technique. Electrochemical experi-ments were carried out to evaluate the uniform and localized corrosion resistance of the specimens. The results revealed that the relative amounts of χ and σ phases increase with the time of heat treatment at ferrite/ferrite and ferrite/austenite grain boundaries, especially inside the ferritic grain. The longitudinal wave velocity and the attenuation coefficient presented a trend that coincides with the microstructural changes generated by the effect of the heat treatment. The electrochemical evaluation revealed a high resistance to uniform corrosion; however, the results showed a correlation between the increase in aging treatment time and the loss of localized corrosion resistance.
KEYWORDS: Corrosion; Duplex stainless steel 2205; Heat treatment; Phase Chi; Phase Sigma; Ultrasonic testing
ORCID: Paola Trocoli-Montesino (https://orcid.org/0000-0002-1080-7153); Edda Rodríguez-Prato (https://orcid. org/0000-0002-7853-9722); Adalberto Rosales-Mendoza (https://orcid.org/0000-0003-0355-6525); Wilfrido González-Hermosilla (https://orcid.org/0000-0002-2532-842X)
Copyright: © 2019 CSIC. Este es un artículo de acceso abierto distribuido bajo los términos de la licencia de uso y distribución Creative Commons Reconocimiento 4.0 Internacional (CC BY 4.0).
2 • P. Trocoli-Montesino et al.
Revista de Metalurgia 55(1), Enero-Marzo 2019, e135, ISSN-L: 0034-8570. https://doi.org/10.3989/revmetalm.135
1. INTRODUCCIÓN
Los aceros inoxidables dúplex incluyen un amplio rango de aleaciones que presentan una microestruc-tura mixta de granos de ferrita (α) y austenita (γ) en proporciones equilibradas. Esta distribución de fases hace que estos aceros tengan simultáneamente buenas propiedades mecánicas y de resistencia a la corrosión (Gunn, 1997; Karlsson, 1999). Además de las fases mayoritarias α y γ, se puede presentar una variedad de fases secundarias indeseables que se forman por efecto de los elementos aleantes y de los tratamientos térmicos, entre ellas destacan los nitruros hexagonales (Cr2N), fase sigma (σ), fase chi (χ), austenita secundaria (γ2), fase R, fase π, fase G, M7C3, M23C6 y fase τ (Gunn, 1997; Mateo y Llanes, 1997; Karlsson, 1999). La precipitación de peque-ñas cantidades de las fases χ y σ afecta drástica-mente a las propiedades mecánicas y de resistencia a la corrosión características de estos aceros (Gironès et al., 2007; Fargas et al., 2009; Gao et al., 2018). La fase σ es una fase intermetálica no magnética, de estructura tetragonal, cuya precipitación es obser-vada en un rango de temperaturas entre los 600 y 1000 ºC y ocurre principalmente a través de la des-composición eutectoide de α en σ y γ2. Esta reacción comienza en la interfase α/γ, en la que la descom-posición de la fase α ocurre por la alta velocidad de difusión de los elementos que conforman la fase σ, como el Cr y el Mo, motivada por la similitud de la estructura tetragonal de la fase σ y la estructura BCC de la fase α (Gunn, 1997; Karlsson, 1999). La precipitación de la nueva fase origina que la matriz quede enriquecida de Ni, elemento estabilizador de la fase γ, dando como resultado la formación de γ2 con una composición química muy aproximada a la de la fase γ generada a altas temperaturas (Gunn, 1997; Karlsson, 1999; Pohl et al., 2007).
En contraste con la fase σ, la precipitación de la fase χ es termodinámicamente metaestable, ocurre entre 750 y 950 ºC, y siempre tiene lugar previa-mente a la formación de la fase σ. Tal como sucede con la fase σ, la fase χ se forma frecuentemente en la interfase α/γ y crece hacia la fase α. Con el comienzo de la precipitación de la fase σ, la fase χ se trans-forma parcialmente para formar σ y, generalmente, ambas pueden coexistir simultáneamente, lo que dificulta su estudio de forma individual. Trabajos previos (Michalska y Sozańska, 2006; Escriba et al., 2009), indican que la composición de la fase χ es más rica en Mo y presenta un mayor peso atómico que la fase σ, lo que la hace identificable por micros-copía electrónica de barrido (MEB) con electrones retrodispersados, aun cuando generalmente es iden-tificada por microscopia electrónica de transmisión (TEM). La fase χ es menos importante que la fase σ debido a que su fracción en volumen es inferior, no obstante, ésta no debe ser ignorada debido a que su precipitación genera un efecto desfavorable en
la resistencia mecánica y la corrosión del material, el cual es comparable al efecto que tiene la fase σ. Esto es particularmente significativo si se utiliza este tipo de aceros en medios altamente agresivos, tales como plantas de desulfuración, aviación, plantas de manufactura y de procesos químicos, entre otras (Gunn, 1997; Karlsson, 1999).
Numerosos estudios realizados sobre distintos tipos de aceros inoxidables dúplex, han evaluado el efecto de los tratamientos térmicos como la causa principal de la aparición de distintas fases interme-tálicas (Ghosh y Mondal, 2008; Escriba et al., 2009; Fargas et al., 2009). La presencia de las fases, χ, σ y γ2 reduce la resistencia a la corrosión por picadura y la formación de resquicios, debido al empobreci-miento de Cr y Mo en la matriz. Es la fase γ2 empo-brecida en Cr y Mo, que precipita adyacente a la fase σ, la que se corroe preferentemente. Cabe desta-car que este tipo de empobrecimiento en la matriz es mucho más significativo con la presencia de fase σ que con las fases χ y R, dado que su tamaño de grano es frecuentemente mucho mayor (Karlsson, 1999). Además, estudios realizados por Ginn y Gooch (1998), indican que los precipitados de fase σ que se forman a bajas temperaturas son más per-judiciales que una fracción equivalente formada a temperaturas elevadas. Es así como la resistencia a la formación de picaduras depende más del tamaño máximo de los intermetálicos que de la fracción volumétrica presente en el acero.
Desde hace más de dos décadas las técnicas ultrasónicas se utilizan como una herramienta de evaluación en la caracterización de materiales, per-mitiendo evaluar la influencia de la microestructura sobre la velocidad de propagación de la onda, par-ticularmente con la presencia de precipitados y de diferentes fases (Rodríguez et al., 2011a). Estudios recientes en aleaciones metálicas han evaluado la influencia de la microestructura sobre los paráme-tros acústicos, entre los que destacan la velocidad longitudinal y la transversal (Jayakumar et al., 1991; Hakan y Orkun, 2005; Rajkumar et al., 2007). Pocos trabajos han analizado la variación de estas variables ultrasónicas en aceros inoxida-bles dúplex, siendo uno de ellos el mostrado por Macedo et al. (2009), para evaluar la formación de ferrita prima (α´) en probetas de aceros UNS S31803 tratadas térmicamente entre 425 y 475 ºC. Ruiz et al. (2009) estudiaron el efecto de los cam-bios microestructurales en probetas laminadas de aceros inoxidables dúplex por medio de medicio-nes ultrasónicas, mostrando la sensibilidad de estos parámetros ultrasónicos (coeficiente de atenuación en modo longitudinal y velocidad de la onda trans-versal) a los cambios que se presentan en el mate-rial por efecto del tratamiento térmico, tales como las transformaciones de fase y la precipitación de segundas fases. Finalmente, Rodríguez et al. (2011a) evaluaron probetas de acero inoxidable dúplex 2205
Evaluación ultrasónica de las fases formadas de un acero inoxidable dúplex 2205 tratado térmicamente a 750 °C • 3
Revista de Metalurgia 55(1), Enero-Marzo 2019, e135, ISSN-L: 0034-8570. https://doi.org/10.3989/revmetalm.135
tratadas térmicamente entre 875 y 950 °C con el fin de estudiar la correlación entre la atenuación y la velocidad de la onda ultrasónica con el tamaño de grano y las fases, mostrando que el tamaño prome-dio de grano, la distribución y su morfología afec-tan al comportamiento de las señales ultrasónicas, puesto que la velocidad de la onda ultrasónica en materiales policristalinos está controlada por el módulo de elasticidad del material (E) y la densi-dad, así como también por la microestructura, la textura y la presencia de fases secundarias.
Dado que la corrosión localizada es la causa prin-cipal del fallo prematuro de materiales metálicos, resulta imprescindible poder cuantificar la presencia y distribución de los precipitados y las variaciones en sus dimensiones en función del tiempo (Nayar, 2002). Sin embargo, las características microestruc-turales de este tipo de acero influyen notablemente en la detección exacta de discontinuidades, gene-rando altos niveles de ruido, así como también una altísima atenuación en la señal ultrasónica.
Habitualmente esta cuantificación no se realiza en servicio sino cuando hay un deterioro conside-rable en las propiedades del material y la misma se puede hacer de forma no destructiva aplicando técnicas de evaluación microestructural in situ. El método ultrasónico por contacto directo es una de las técnicas que permite el estudio y caracterización de los materiales. Así pues, al efectuar la evaluación ultrasónica, las características microestructurales del material pueden afectar a la respuesta ultrasó-nica. La velocidad de la onda longitudinal y el coe-ficiente de atenuación asociado a la interacción con la microestructura son dos de los parámetros más comúnmente utilizados por esta técnica en la carac-terización de materiales (Rodríguez et al., 2011a).
En la presente investigación se evalúa el compor-tamiento de probetas de acero inoxidable dúplex 2205 tratadas térmicamente a 750 °C, haciendo uso de técnicas ultrasónicas y electroquímicas. El estu-dio pretende correlacionar la microestructura de las probetas tratadas térmicamente con las señales ultrasónicas y los parámetros electroquímicos, y de esta manera obtener una información del compor-tamiento que permita deducir el estado microestruc-tural del material.
2. MATERIALES Y MÉTODOS
2.1. Materiales
El material estudiado es un acero inoxidable dúplex comercial 2205 (UNS S31803/EN1.4462) en forma de barra cilíndrica y con un tratamiento de solubilización a 1050 ºC, suministrado por la empresa SANDVIK de Venezuela. Las probetas de 50,00 mm de longitud y 20,07 mm de espesor se trataron tér-micamente a 750 ºC y se prepararon metalográfica-mente de acuerdo con la norma ASTM E3-01 (2007)
para ser caracterizadas por microscopía óptica (MO) y electrónica de barrido (MEB).
2.2. Evaluación Ultrasónica
La evaluación ultrasónica por contacto directo se llevó a cabo considerando la cara frontal de las pro-betas sobre la que se hizo el pulido, haciendo incidir el haz ultrasónico en dirección paralela al eje de cada una de ellas. El estudio se realizó utilizando aceite como medio de acoplamiento acústico, el detector de fallos Krautkramer USN-58L y transductores de 0,25 pulgadas de haz normal y frecuencias de 2,25; 3,5; 5,0; 10,0 y 22,0 MHz. La velocidad de propagación de la onda ultrasónica longitudinal se determinó por medio de la diferencia del tiempo de llegada de la señal registrada en el detector ultrasónico, conside-rando para ello dos ecos sucesivos en la evaluación de cada una de las probetas. El coeficiente de atenuación en cada una de las probetas se determinó en base a la comparación de las amplitudes de los ecos de fondo.
2.3. Evaluación Electroquímica
Se utilizó la técnica de resistencia de polariza-ción lineal (Rp), para ello se empleó una solución de NaCl 3,5% a temperatura ambiente. Esta técnica se aplicó con el uso de un Potenciostato General-Purpose Model 2049 de AMEL Instruments. La escala de potencial se fijó en 10 mV más electrone-gativos en relación al potencial de corrosión (Ecorr) correspondiente, se empleó una velocidad de barrido de potencial de 10 mV·min-1 en sentido anódico. Posteriormente y de forma adicional, se procedió a la obtención de la curva completa de polarización. Para ello, se fijó nuevamente la escala de poten-cial en 300 mV más electronegativo que el Ecorr. Se registraron los valores de densidad de corriente en función del potencial hasta alcanzar 300 mV por encima de Ecorr. El potencial se midió con respecto al electrodo de referencia de Ag/AgCl.
Adicionalmente, se utilizó una tercera técnica electroquímica, para determinar la resistencia a la corrosión por picadura se empleó el método de curvas de polarización cíclica galvanostática esca-lonada (PCGE) de acuerdo con lo establecido en la norma ASTM G100-89 (1999), utilizando la misma solución electrolítica de NaCl al 3,5% y un potenciostato/galvanostato General-Purpose Model 2049 AMEL Instruments. El proceso gal-vanostático se realizó con escalones de densidad de corriente de 20 μA·cm-2 y una duración de 2 min cada uno. El ensayo se inició en 0 μA·cm-2 hasta alcanzar un máximo de 120 μA·cm-2, para poste-riormente regresar escalonadamente a la condición inicial (0 μA·cm-2). Las curvas registraron los cam-bios de potencial con respecto al tiempo para cada escalón de densidad de corriente. Los potenciales también se refirieron con respecto a Ag/AgCl.
4 • P. Trocoli-Montesino et al.
Revista de Metalurgia 55(1), Enero-Marzo 2019, e135, ISSN-L: 0034-8570. https://doi.org/10.3989/revmetalm.135
3. RESULTADOS
3.1. Caracterización Microestructural
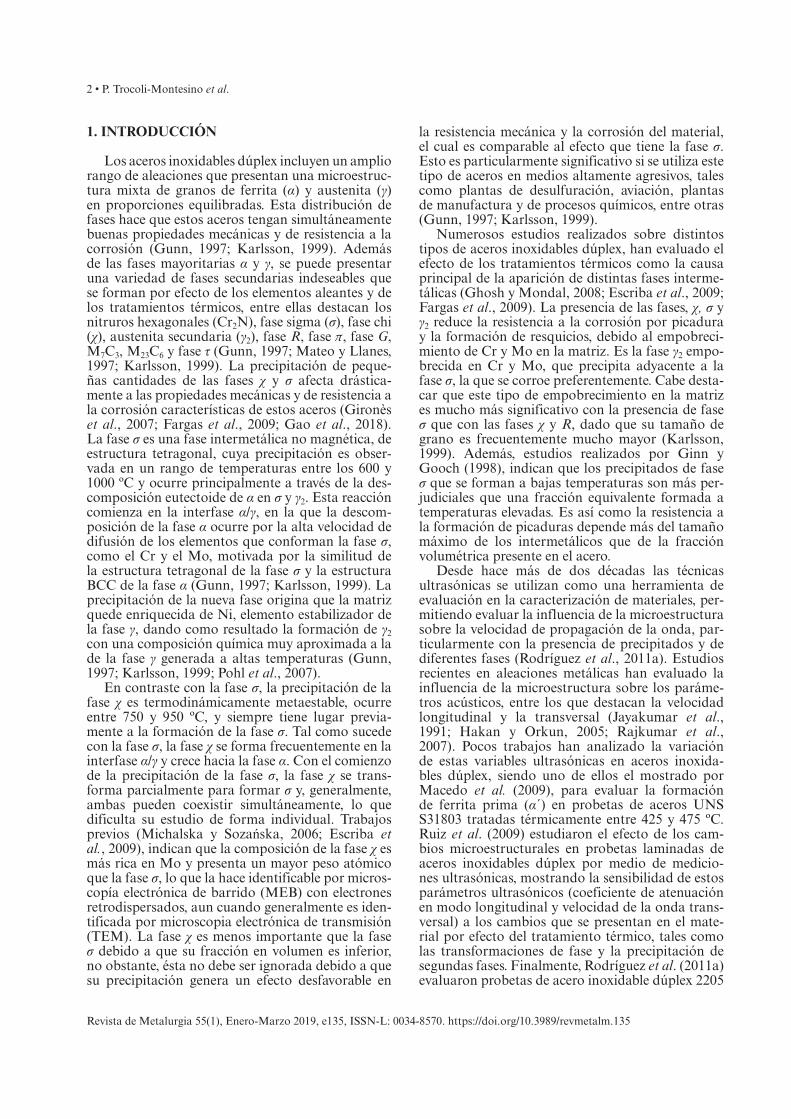
La Fig. 1 muestra la microestructura del acero inoxidable dúplex 2205 en estado de recepción. Se observa una microestructura mixta de grano fino, donde la matriz es la fase α (zona oscura) y porciones en forma de islas constituyen la γ (zona clara), en fracciones volumétricas aproximadamente iguales. La fracción de área se determinó mediante MO cuantitativa, resultando un 49% de fase α y un 51% de fase γ.
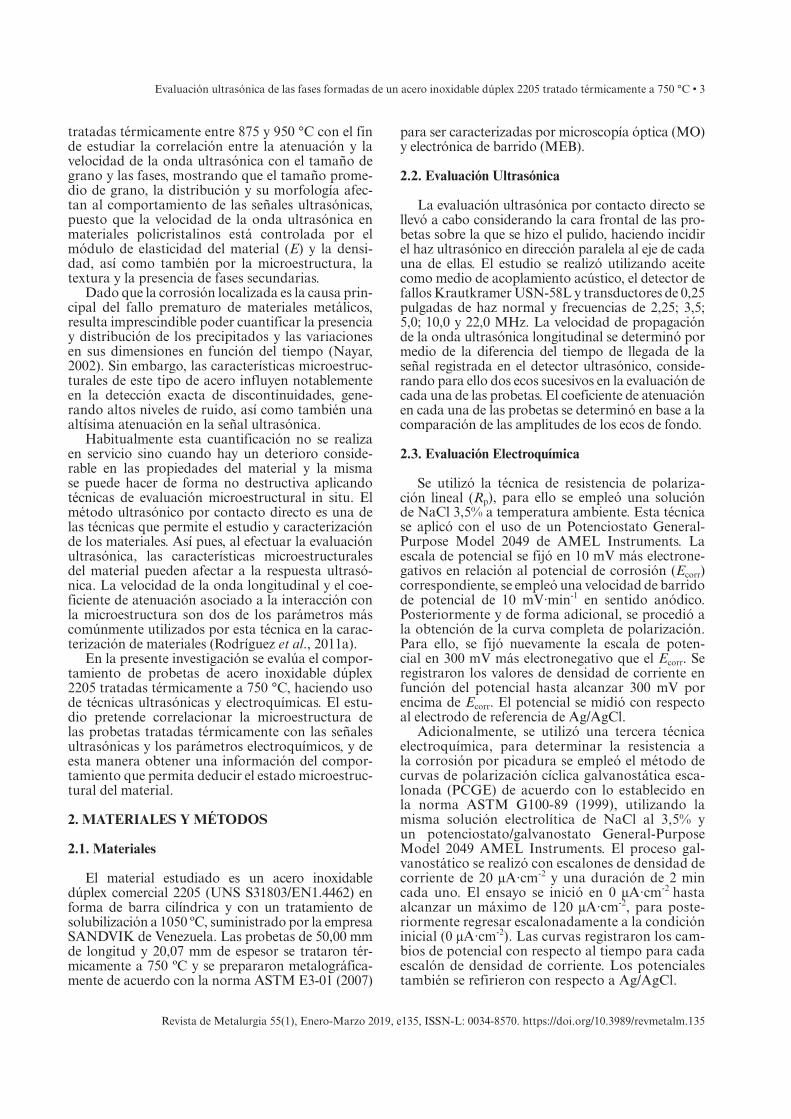
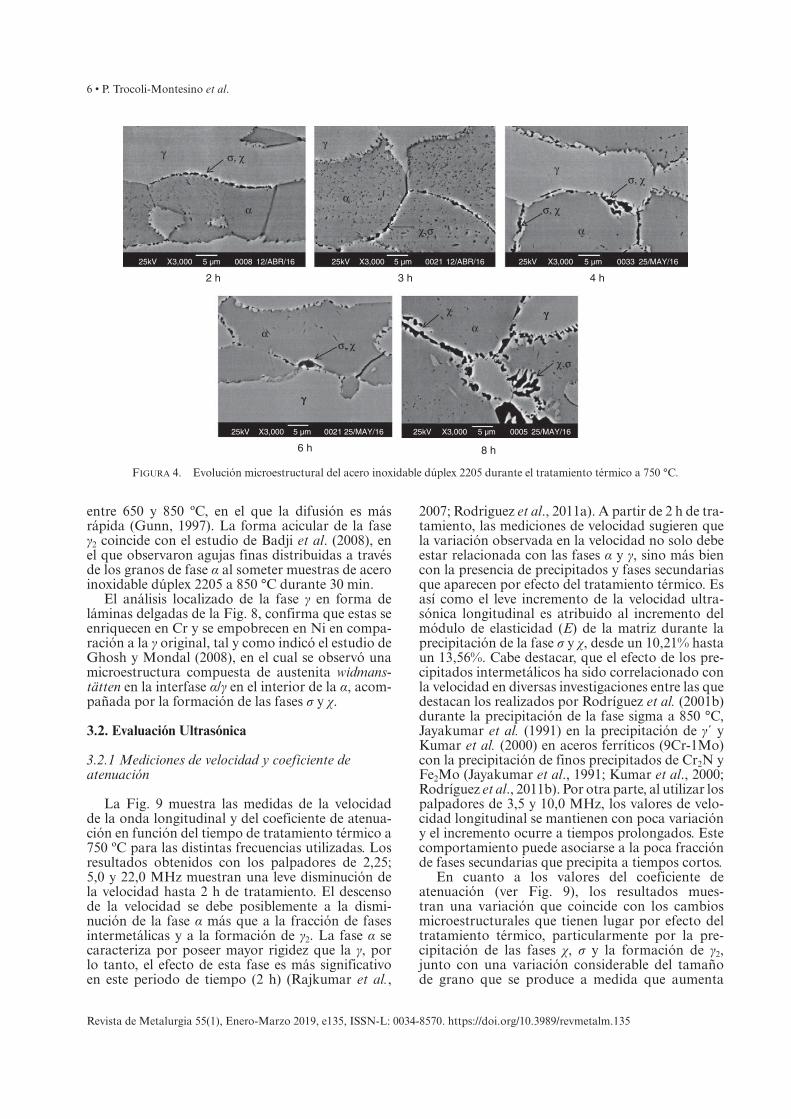
La Fig. 2 muestra la evolución microestructural de cada una de las probetas tratadas a 750 ºC para distintos periodos de tiempo (2, 3, 4, 6 y 8 h), con el objetivo de promover la precipitación de fases secundarias. Al observar las imágenes se distinguen
zonas más claras alrededor del borde de grano α/α, además se aprecia la formación de fase σ en las inter-fases α/γ y α/α, visualizándose con un alto contraste (zona muy oscura). La evolución microestructu-ral, en función del tiempo de tratamiento térmico, muestra que las reacciones de precipitación consu-men gradualmente la fase α, debido a que las fases secundarias crecen y se expanden a lo largo de la misma. La alta susceptibilidad de los aceros inoxi-dables dúplex a la formación de fases intermetálicas es atribuida a la composición química de la fase α, debido a que es más rica en elementos formadores de fase σ, como lo son el Cr y Mo, y más pobre en elementos de estabilización de γ, como el C, N y Ni (Escriba et al., 2009). La alta velocidad de difusión de los elementos que componen la fase σ, originada por la semejanza entre la estructura tetragonal de la fase σ y la estructura BCC de la fase α en la red
Figura 1. Microestructura dúplex del acero inoxidable 2205 en estado de recepción: A) Cara lateral y B) Cara frontal.
α
30 µm 30 µm
γ
A B
Figura 2. Evolución microestructural del acero inoxidable dúplex 2205 tratado a 750 °C durante distintos tiempos de tratamiento.
α
2 h 3 h 4 h
8 h6 h
α
α
α
6 µm 6 µm 6 µm
6 µm 6 µm
γ
γ
γ
γ
σ, χ
σ, χ
σ, χσ, χ
σ, χ
γ
Evaluación ultrasónica de las fases formadas de un acero inoxidable dúplex 2205 tratado térmicamente a 750 °C • 5
Revista de Metalurgia 55(1), Enero-Marzo 2019, e135, ISSN-L: 0034-8570. https://doi.org/10.3989/revmetalm.135
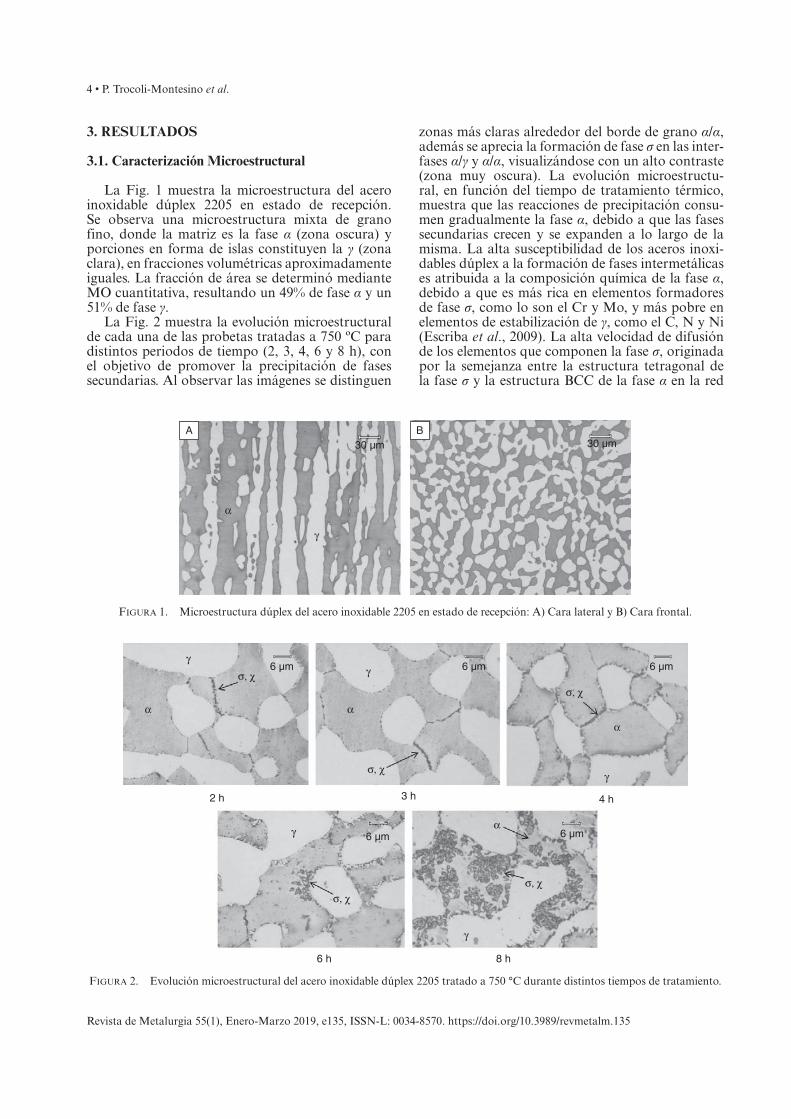
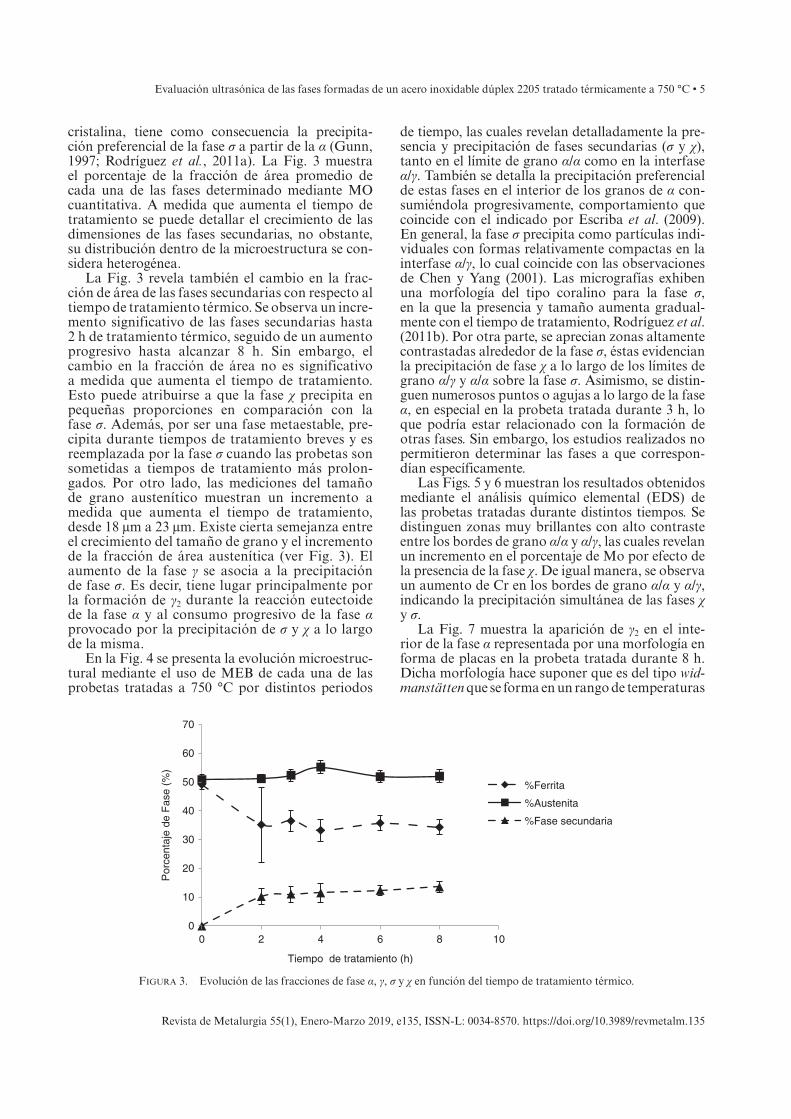
cristalina, tiene como consecuencia la precipita-ción preferencial de la fase σ a partir de la α (Gunn, 1997; Rodríguez et al., 2011a). La Fig. 3 muestra el porcentaje de la fracción de área promedio de cada una de las fases determinado mediante MO cuantitativa. A medida que aumenta el tiempo de tratamiento se puede detallar el crecimiento de las dimensiones de las fases secundarias, no obstante, su distribución dentro de la microestructura se con-sidera heterogénea.
La Fig. 3 revela también el cambio en la frac-ción de área de las fases secundarias con respecto al tiempo de tratamiento térmico. Se observa un incre-mento significativo de las fases secundarias hasta 2 h de tratamiento térmico, seguido de un aumento progresivo hasta alcanzar 8 h. Sin embargo, el cambio en la fracción de área no es significativo a medida que aumenta el tiempo de tratamiento. Esto puede atribuirse a que la fase χ precipita en pequeñas proporciones en comparación con la fase σ. Además, por ser una fase metaestable, pre-cipita durante tiempos de tratamiento breves y es reemplazada por la fase σ cuando las probetas son sometidas a tiempos de tratamiento más prolon-gados. Por otro lado, las mediciones del tamaño de grano austenítico muestran un incremento a medida que aumenta el tiempo de tratamiento, desde 18 μm a 23 μm. Existe cierta semejanza entre el crecimiento del tamaño de grano y el incremento de la fracción de área austenítica (ver Fig. 3). El aumento de la fase γ se asocia a la precipitación de fase σ. Es decir, tiene lugar principalmente por la formación de γ2 durante la reacción eutectoide de la fase α y al consumo progresivo de la fase α provocado por la precipitación de σ y χ a lo largo de la misma.
En la Fig. 4 se presenta la evolución microestruc-tural mediante el uso de MEB de cada una de las probetas tratadas a 750 °C por distintos periodos
de tiempo, las cuales revelan detalladamente la pre-sencia y precipitación de fases secundarias (σ y χ), tanto en el límite de grano α/α como en la interfase α/γ. También se detalla la precipitación preferencial de estas fases en el interior de los granos de α con-sumiéndola progresivamente, comportamiento que coincide con el indicado por Escriba et al. (2009). En general, la fase σ precipita como partículas indi-viduales con formas relativamente compactas en la interfase α/γ, lo cual coincide con las observaciones de Chen y Yang (2001). Las micrografías exhiben una morfología del tipo coralino para la fase σ, en la que la presencia y tamaño aumenta gradual-mente con el tiempo de tratamiento, Rodríguez et al. (2011b). Por otra parte, se aprecian zonas altamente contrastadas alrededor de la fase σ, éstas evidencian la precipitación de fase χ a lo largo de los límites de grano α/γ y α/α sobre la fase σ. Asimismo, se distin-guen numerosos puntos o agujas a lo largo de la fase α, en especial en la probeta tratada durante 3 h, lo que podría estar relacionado con la formación de otras fases. Sin embargo, los estudios realizados no permitieron determinar las fases a que correspon-dían específicamente.
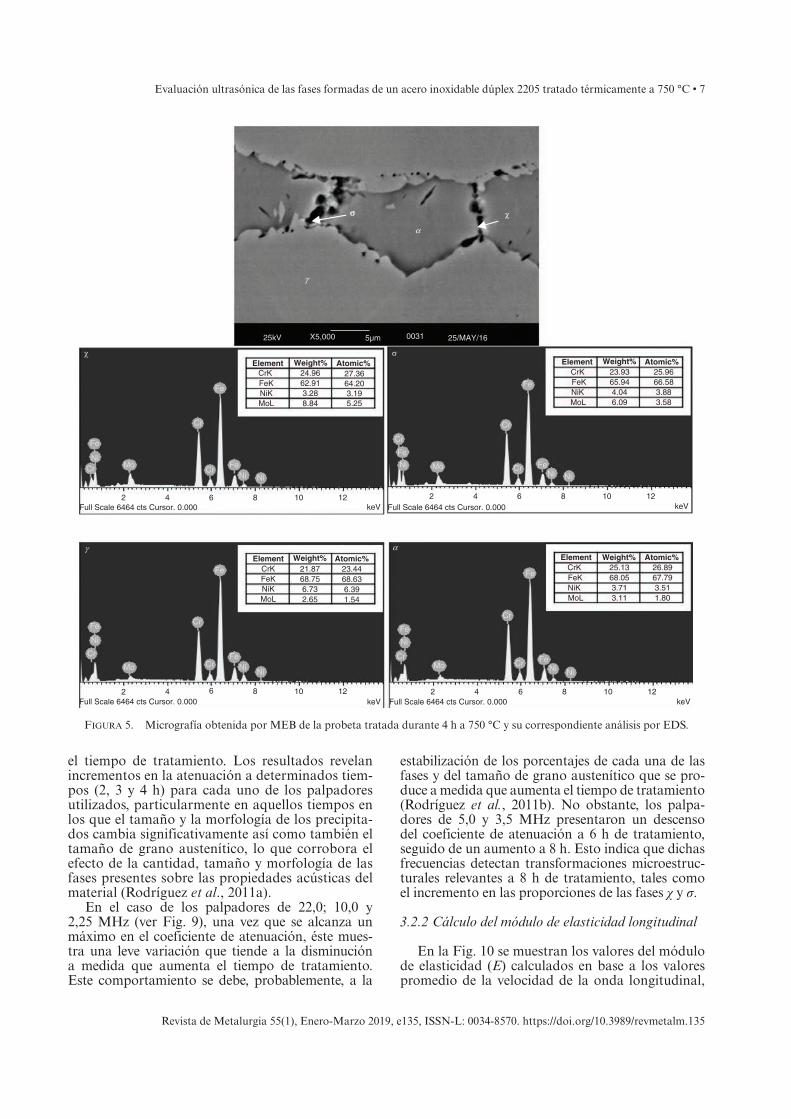
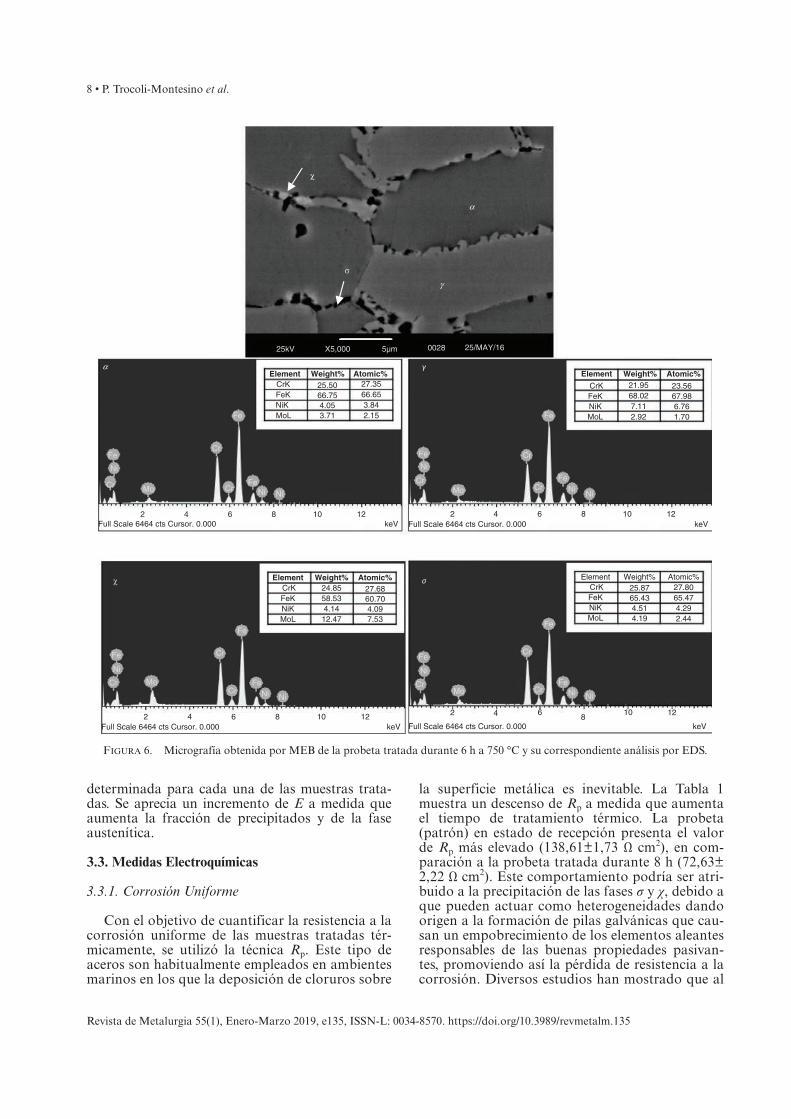
Las Figs. 5 y 6 muestran los resultados obtenidos mediante el análisis químico elemental (EDS) de las probetas tratadas durante distintos tiempos. Se distinguen zonas muy brillantes con alto contraste entre los bordes de grano α/α y α/γ, las cuales revelan un incremento en el porcentaje de Mo por efecto de la presencia de la fase χ. De igual manera, se observa un aumento de Cr en los bordes de grano α/α y α/γ, indicando la precipitación simultánea de las fases χ y σ.
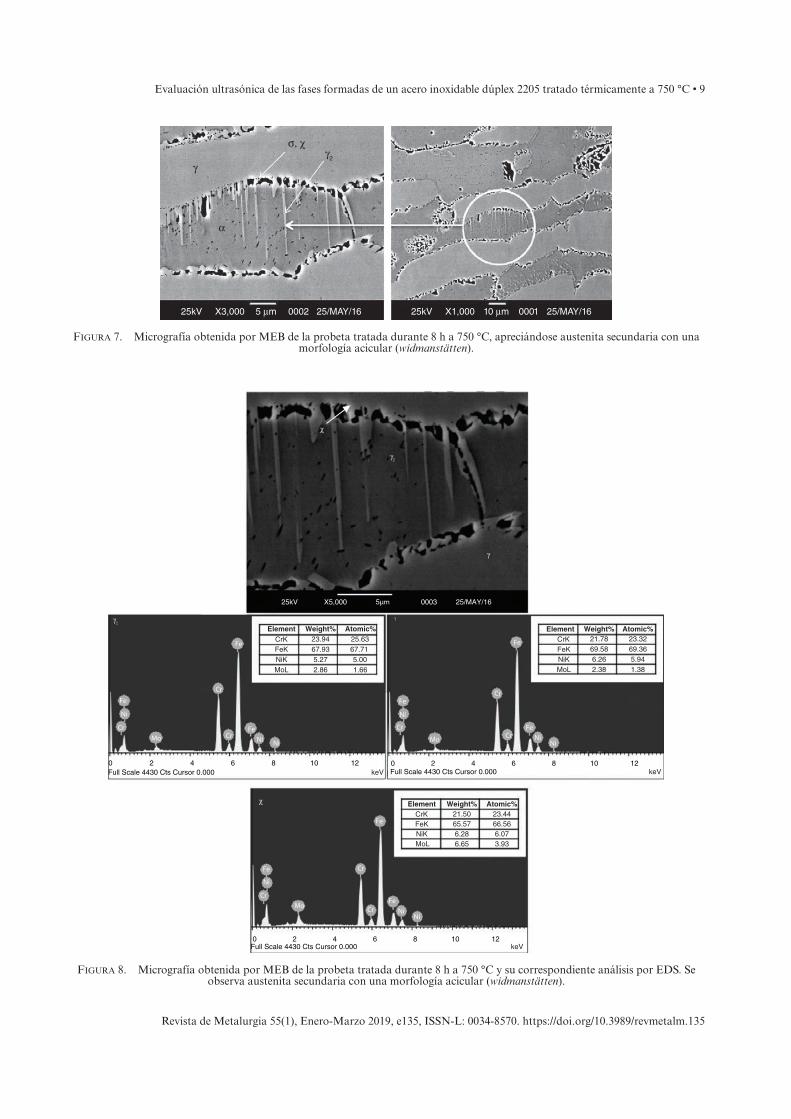
La Fig. 7 muestra la aparición de γ2 en el inte-rior de la fase α representada por una morfología en forma de placas en la probeta tratada durante 8 h. Dicha morfología hace suponer que es del tipo wid-manstätten que se forma en un rango de temperaturas
0
10
20
30
40
50
60
70
0 2 4 6 8 10
Por
cent
aje
de F
ase
(%)
Tiempo de tratamiento (h)
%Ferrita
%Austenita
%Fase secundaria
Figura 3. Evolución de las fracciones de fase α, γ, σ y χ en función del tiempo de tratamiento térmico.
6 • P. Trocoli-Montesino et al.
Revista de Metalurgia 55(1), Enero-Marzo 2019, e135, ISSN-L: 0034-8570. https://doi.org/10.3989/revmetalm.135
entre 650 y 850 ºC, en el que la difusión es más rápida (Gunn, 1997). La forma acicular de la fase γ2 coincide con el estudio de Badji et al. (2008), en el que observaron agujas finas distribuidas a través de los granos de fase α al someter muestras de acero inoxidable dúplex 2205 a 850 °C durante 30 min.
El análisis localizado de la fase γ en forma de láminas delgadas de la Fig. 8, confirma que estas se enriquecen en Cr y se empobrecen en Ni en compa-ración a la γ original, tal y como indicó el estudio de Ghosh y Mondal (2008), en el cual se observó una microestructura compuesta de austenita widmans-tätten en la interfase α/γ en el interior de la α, acom-pañada por la formación de las fases σ y χ.
3.2. Evaluación Ultrasónica
3.2.1 Mediciones de velocidad y coeficiente de atenuación
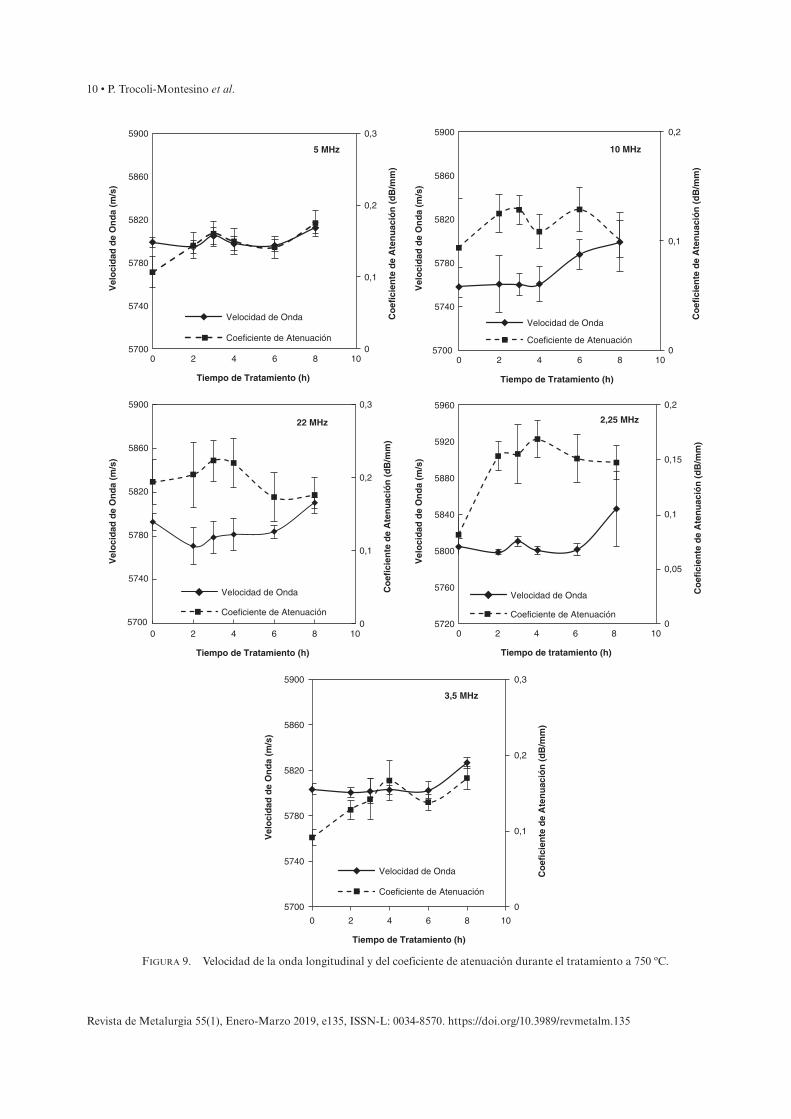
La Fig. 9 muestra las medidas de la velocidad de la onda longitudinal y del coeficiente de atenua-ción en función del tiempo de tratamiento térmico a 750 ºC para las distintas frecuencias utilizadas. Los resultados obtenidos con los palpadores de 2,25; 5,0 y 22,0 MHz muestran una leve disminución de la velocidad hasta 2 h de tratamiento. El descenso de la velocidad se debe posiblemente a la dismi-nución de la fase α más que a la fracción de fases intermetálicas y a la formación de γ2. La fase α se caracteriza por poseer mayor rigidez que la γ, por lo tanto, el efecto de esta fase es más significativo en este periodo de tiempo (2 h) (Rajkumar et al.,
2007; Rodriguez et al., 2011a). A partir de 2 h de tra-tamiento, las mediciones de velocidad sugieren que la variación observada en la velocidad no solo debe estar relacionada con las fases α y γ, sino más bien con la presencia de precipitados y fases secundarias que aparecen por efecto del tratamiento térmico. Es así como el leve incremento de la velocidad ultra-sónica longitudinal es atribuido al incremento del módulo de elasticidad (E) de la matriz durante la precipitación de la fase σ y χ, desde un 10,21% hasta un 13,56%. Cabe destacar, que el efecto de los pre-cipitados intermetálicos ha sido correlacionado con la velocidad en diversas investigaciones entre las que destacan los realizados por Rodríguez et al. (2001b) durante la precipitación de la fase sigma a 850 °C, Jayakumar et al. (1991) en la precipitación de γ´ y Kumar et al. (2000) en aceros ferríticos (9Cr-1Mo) con la precipitación de finos precipitados de Cr2N y Fe2Mo (Jayakumar et al., 1991; Kumar et al., 2000; Rodríguez et al., 2011b). Por otra parte, al utilizar los palpadores de 3,5 y 10,0 MHz, los valores de velo-cidad longitudinal se mantienen con poca variación y el incremento ocurre a tiempos prolongados. Este comportamiento puede asociarse a la poca fracción de fases secundarias que precipita a tiempos cortos.
En cuanto a los valores del coeficiente de atenuación (ver Fig. 9), los resultados mues-tran una variación que coincide con los cambios microestructurales que tienen lugar por efecto del tratamiento térmico, particularmente por la pre-cipitación de las fases χ, σ y la formación de γ2, junto con una variación considerable del tamaño de grano que se produce a medida que aumenta
Figura 4. Evolución microestructural del acero inoxidable dúplex 2205 durante el tratamiento térmico a 750 °C.
αα
α α
α
5 µm
5 µm
5 µm 5 µm
5 µm
0008 12/ABR/16 12/ABR/16 25/MAY/16
25/MAY/16 25/MAY/16
X3,000
X3,000
X3,000 X3,000
X3,000 0005
25kV
25kV 25kV
25kV 25kV
2 h
6 h 8 h
3 h 4 h
0021
0021 0033
γγ
γ
γ
γ
γ
γσ, χ
σ, χ
σ, χ
σ, χ
χ,σ
χ,σ
χ
Evaluación ultrasónica de las fases formadas de un acero inoxidable dúplex 2205 tratado térmicamente a 750 °C • 7
Revista de Metalurgia 55(1), Enero-Marzo 2019, e135, ISSN-L: 0034-8570. https://doi.org/10.3989/revmetalm.135
el tiempo de tratamiento. Los resultados revelan incrementos en la atenuación a determinados tiem-pos (2, 3 y 4 h) para cada uno de los palpadores utilizados, particularmente en aquellos tiempos en los que el tamaño y la morfología de los precipita-dos cambia significativamente así como también el tamaño de grano austenítico, lo que corrobora el efecto de la cantidad, tamaño y morfología de las fases presentes sobre las propiedades acústicas del material (Rodríguez et al., 2011a).
En el caso de los palpadores de 22,0; 10,0 y 2,25 MHz (ver Fig. 9), una vez que se alcanza un máximo en el coeficiente de atenuación, éste mues-tra una leve variación que tiende a la disminución a medida que aumenta el tiempo de tratamiento. Este comportamiento se debe, probablemente, a la
estabilización de los porcentajes de cada una de las fases y del tamaño de grano austenítico que se pro-duce a medida que aumenta el tiempo de tratamiento (Rodríguez et al., 2011b). No obstante, los palpa-dores de 5,0 y 3,5 MHz presentaron un descenso del coeficiente de atenuación a 6 h de tratamiento, seguido de un aumento a 8 h. Esto indica que dichas frecuencias detectan transformaciones microestruc-turales relevantes a 8 h de tratamiento, tales como el incremento en las proporciones de las fases χ y σ.
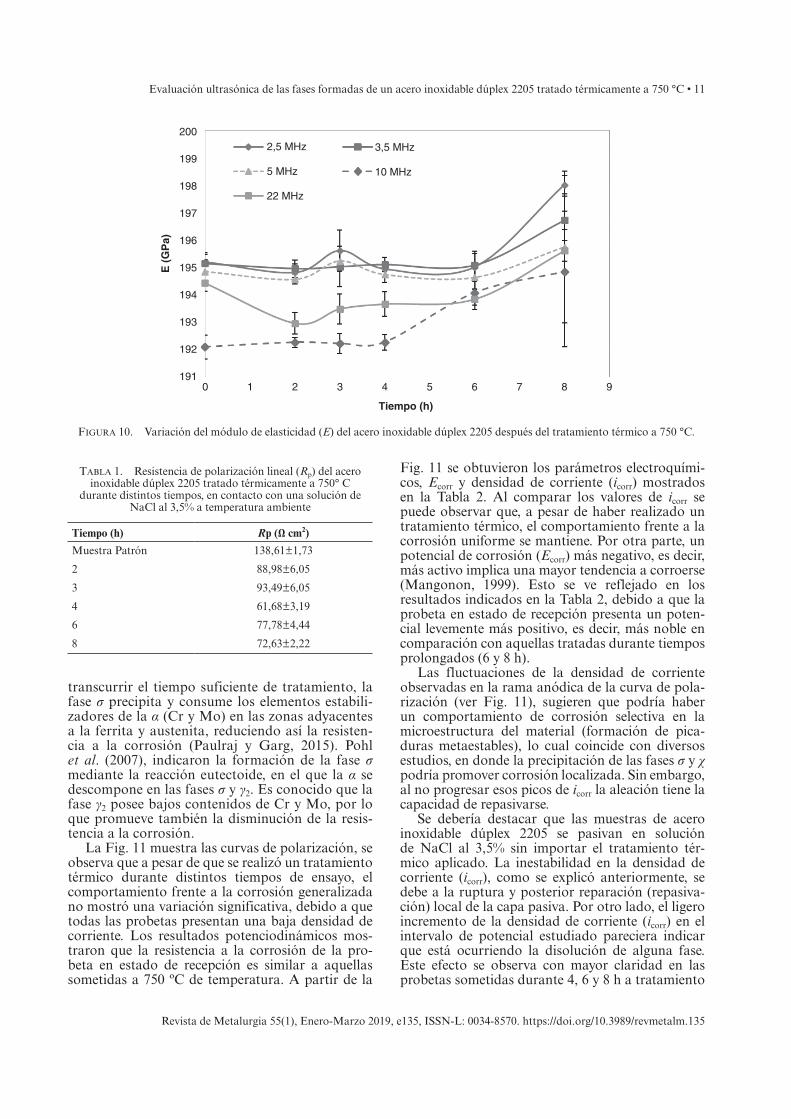
3.2.2 Cálculo del módulo de elasticidad longitudinal
En la Fig. 10 se muestran los valores del módulo de elasticidad (E) calculados en base a los valores promedio de la velocidad de la onda longitudinal,
Figura 5. Micrografía obtenida por MEB de la probeta tratada durante 4 h a 750 °C y su correspondiente análisis por EDS.
CrKElement
FeKNiKMoL
Weight% Atomic%24.9662.913.288.84
27.3664.203.195.25
CrKElement
FeKNiKMoL
Weight% Atomic%23.9365.944.046.09
25.9666.583.883.58
2 4 6 8 10 12keVFull Scale 6464 cts Cursor. 0.000 Full Scale 6464 cts Cursor. 0.000
2 4 6 8 10 12keV
CrKElement
FeKNiKMoL
Weight% Atomic%25.1368.053.713.11
26.8967.793.511.80
CrKElement
FeKNiKMoL
Weight% Atomic%21.8768.756.732.65
23.4468.636.391.54
Full Scale 6464 cts Cursor. 0.0002 4 6 8 10 12
keVFull Scale 6464 cts Cursor. 0.0002 4 6 8 10 12
keV
25kV X5,000 5µm 0031 25/MAY/16
g
a
χσ
χ
Fe
NiCr Mo
Cr
CrFe
Ni Ni
Fe
σ
Fe
Ni
Cr
Mo
Cr
Cr FeNi Ni
Fe
a
Fe
Ni
CrMo
Cr
Cr FeNi Ni
Fe
g
Fe
Ni
Cr
Mo
Cr
CrFe
NiNi
Fe
8 • P. Trocoli-Montesino et al.
Revista de Metalurgia 55(1), Enero-Marzo 2019, e135, ISSN-L: 0034-8570. https://doi.org/10.3989/revmetalm.135
determinada para cada una de las muestras trata-das. Se aprecia un incremento de E a medida que aumenta la fracción de precipitados y de la fase austenítica.
3.3. Medidas Electroquímicas
3.3.1. Corrosión Uniforme
Con el objetivo de cuantificar la resistencia a la corrosión uniforme de las muestras tratadas tér-micamente, se utilizó la técnica Rp. Este tipo de aceros son habitualmente empleados en ambientes marinos en los que la deposición de cloruros sobre
la superficie metálica es inevitable. La Tabla 1 muestra un descenso de Rp a medida que aumenta el tiempo de tratamiento térmico. La probeta (patrón) en estado de recepción presenta el valor de Rp más elevado (138,61±1,73 Ω cm2), en com-paración a la probeta tratada durante 8 h (72,63± 2,22 Ω cm2). Este comportamiento podría ser atri-buido a la precipitación de las fases σ y χ, debido a que pueden actuar como heterogeneidades dando origen a la formación de pilas galvánicas que cau-san un empobrecimiento de los elementos aleantes responsables de las buenas propiedades pasivan-tes, promoviendo así la pérdida de resistencia a la corrosión. Diversos estudios han mostrado que al
a γ
σ
CrKElement
FeKNiKMoL
Weight% Atomic%25.5066.754.053.71
27.3566.653.842.15
CrK
Element
FeKNiKMoL
Weight% Atomic%21.9568.027.112.92
23.5667.986.761.70
2 4 6 8 10 12keVFull Scale 6464 cts Cursor. 0.000 Full Scale 6464 cts Cursor. 0.000
2 4 6 8 10 12keV
CrKElement
FeKNiKMoL
Weight% Atomic%25.8765.434.514.19
27.8065.474.292.44
CrKElement
FeKNiKMoL
Weight% Atomic%24.8558.534.1412.47
27.6860.704.097.53
Full Scale 6464 cts Cursor. 0.000
2 4 68
10 12
keVFull Scale 6464 cts Cursor. 0.0002 4 6 8 10 12
keV
25kV X5,000 5µm 0028 25/MAY/16
g
a
χ
Fe
Ni
Cr Mo Cr
Cr
FeNi Ni
Fe
σ
Fe
Ni
CrMo
Cr
Cr
Fe
NiNi
Fe
Fe
Ni
CrMo
Cr
CrFe
Ni Ni
Fe
Fe
Ni
Cr Mo
Cr
CrFe
Ni Ni
Fe
χ
Figura 6. Micrografía obtenida por MEB de la probeta tratada durante 6 h a 750 °C y su correspondiente análisis por EDS.
Evaluación ultrasónica de las fases formadas de un acero inoxidable dúplex 2205 tratado térmicamente a 750 °C • 9
Revista de Metalurgia 55(1), Enero-Marzo 2019, e135, ISSN-L: 0034-8570. https://doi.org/10.3989/revmetalm.135
σ, χ
α
γ2
25kV X3,000 0002 25/MAY/165 µm 25kV X1,000 0001 25/MAY/1610 µm
γ
Figura 7. Micrografía obtenida por MEB de la probeta tratada durante 8 h a 750 °C, apreciándose austenita secundaria con una morfología acicular (widmanstätten).
25kV
Fe
Fe
Ni
0 2 4 6 8 10 12
0Full Scale 4430 Cts Cursor 0.000
Full Scale 4430 Cts Cursor 0.000
2 4 6 8 10 12
Mo
Cr
CrCr Fe
Ni Ni
Ni
CrMo Cr
Cr
Fe
Fe
Fe
NiNi
X5,000 5µm 0003 25/MAY/16
χ
χ
γ2
γ2
γ
CrKElement
FeKNiKMoL
Weight% Atomic%23.9467.935.272.86
25.6367.715.001.66
CrKElement
FeKNiKMoL
Weight% Atomic%23.4466.566.073.93
21.5065.576.286.65
keV
keV
Full Scale 4430 Cts Cursor 0.0000 2 4 6 8 10 12
Fe
Fe
Fe
Ni
NiNi
Cr
Cr
CrMo
γ
CrKElement
FeKNiKMoL
Weight% Atomic%23.3269.365.941.38
21.7869.586.262.38
keV
Figura 8. Micrografía obtenida por MEB de la probeta tratada durante 8 h a 750 °C y su correspondiente análisis por EDS. Se observa austenita secundaria con una morfología acicular (widmanstätten).
10 • P. Trocoli-Montesino et al.
Revista de Metalurgia 55(1), Enero-Marzo 2019, e135, ISSN-L: 0034-8570. https://doi.org/10.3989/revmetalm.135
0
0,1
0,2
0,3
5700
5740
5780
5820
5860
5900
0 2 4 6 8 10
Co
efic
ien
te d
e A
ten
uac
ión
(d
B/m
m)
Vel
oci
dad
de
On
da
(m/s
)
Tiempo de Tratamiento (h)
3,5 MHz
Velocidad de Onda
Coeficiente de Atenuación
0
0,1
0,2
0,3
5700
5740
5780
5820
5860
5900
0 2 4 6 8 10
Co
efic
ien
te d
e A
ten
uac
ión
(d
B/m
m)
Vel
oci
dad
de
On
da
(m/s
)
Tiempo de Tratamiento (h)
22 MHz
Velocidad de Onda
Coeficiente de Atenuación
0
0,1
0,2
5700
5740
5780
5820
5860
5900
0 2 4 6 8 10
Co
efic
ien
te d
e A
ten
uac
ión
(d
B/m
m)
Vel
oci
dad
de
On
da
(m/s
)
Tiempo de Tratamiento (h)
10 MHz
Velocidad de Onda
Coeficiente de Atenuación0
0,1
0,2
0,3
5700
5740
5780
5820
5860
5900
0 2 4 6 8 10
Co
efic
ien
te d
e A
ten
uac
ión
(d
B/m
m)
Vel
oci
dad
de
On
da
(m/s
)
Tiempo de Tratamiento (h)
5 MHz
Velocidad de Onda
Coeficiente de Atenuación
0
0,05
0,1
0,15
0,2
5720
5760
5800
5840
5880
5920
5960
0 2 4 6 8 10
Co
efic
ien
te d
e A
ten
uac
ión
(d
B/m
m)
Vel
oci
dad
de
On
da
(m/s
)
Tiempo de tratamiento (h)
2,25 MHz
Velocidad de Onda
Coeficiente de Atenuación
Figura 9. Velocidad de la onda longitudinal y del coeficiente de atenuación durante el tratamiento a 750 ºC.
Evaluación ultrasónica de las fases formadas de un acero inoxidable dúplex 2205 tratado térmicamente a 750 °C • 11
Revista de Metalurgia 55(1), Enero-Marzo 2019, e135, ISSN-L: 0034-8570. https://doi.org/10.3989/revmetalm.135
transcurrir el tiempo suficiente de tratamiento, la fase σ precipita y consume los elementos estabili-zadores de la α (Cr y Mo) en las zonas adyacentes a la ferrita y austenita, reduciendo así la resisten-cia a la corrosión (Paulraj y Garg, 2015). Pohl et al. (2007), indicaron la formación de la fase σ mediante la reacción eutectoide, en el que la α se descompone en las fases σ y γ2. Es conocido que la fase γ2 posee bajos contenidos de Cr y Mo, por lo que promueve también la disminución de la resis-tencia a la corrosión.
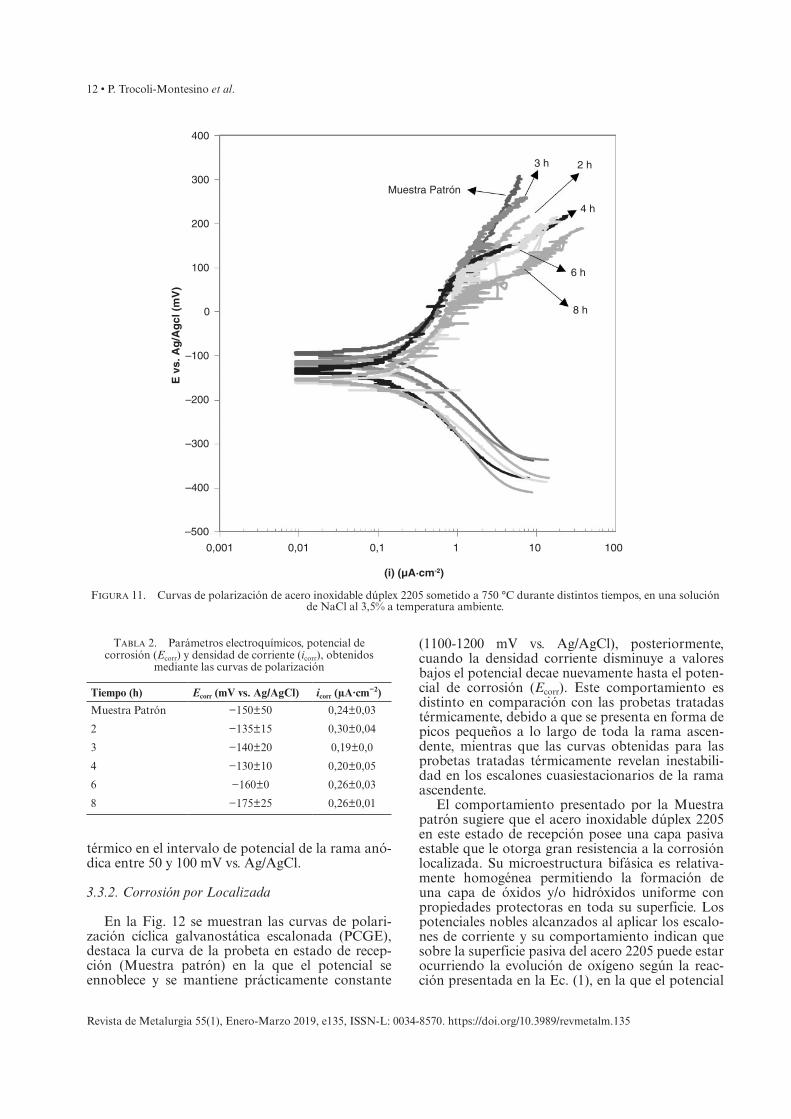
La Fig. 11 muestra las curvas de polarización, se observa que a pesar de que se realizó un tratamiento térmico durante distintos tiempos de ensayo, el comportamiento frente a la corrosión generalizada no mostró una variación significativa, debido a que todas las probetas presentan una baja densidad de corriente. Los resultados potenciodinámicos mos-traron que la resistencia a la corrosión de la pro-beta en estado de recepción es similar a aquellas sometidas a 750 ºC de temperatura. A partir de la
Fig. 11 se obtuvieron los parámetros electroquími-cos, Ecorr y densidad de corriente (icorr) mostrados en la Tabla 2. Al comparar los valores de icorr se puede observar que, a pesar de haber realizado un tratamiento térmico, el comportamiento frente a la corrosión uniforme se mantiene. Por otra parte, un potencial de corrosión (Ecorr) más negativo, es decir, más activo implica una mayor tendencia a corroerse (Mangonon, 1999). Esto se ve reflejado en los resultados indicados en la Tabla 2, debido a que la probeta en estado de recepción presenta un poten-cial levemente más positivo, es decir, más noble en comparación con aquellas tratadas durante tiempos prolongados (6 y 8 h).
Las fluctuaciones de la densidad de corriente observadas en la rama anódica de la curva de pola-rización (ver Fig. 11), sugieren que podría haber un comportamiento de corrosión selectiva en la microestructura del material (formación de pica-duras metaestables), lo cual coincide con diversos estudios, en donde la precipitación de las fases σ y χ podría promover corrosión localizada. Sin embargo, al no progresar esos picos de icorr la aleación tiene la capacidad de repasivarse.
Se debería destacar que las muestras de acero inoxidable dúplex 2205 se pasivan en solución de NaCl al 3,5% sin importar el tratamiento tér-mico aplicado. La inestabilidad en la densidad de corriente (icorr), como se explicó anteriormente, se debe a la ruptura y posterior reparación (repasiva-ción) local de la capa pasiva. Por otro lado, el ligero incremento de la densidad de corriente (icorr) en el intervalo de potencial estudiado pareciera indicar que está ocurriendo la disolución de alguna fase. Este efecto se observa con mayor claridad en las probetas sometidas durante 4, 6 y 8 h a tratamiento
0
200
E (
GP
a)
2,5 MHz
22 MHz
10 MHz
3,5 MHz
5 MHz199
198
197
196
195
194
193
192
1911 2 3 4 5 6 7 8 9
Tiempo (h)
Figura 10. Variación del módulo de elasticidad (E) del acero inoxidable dúplex 2205 después del tratamiento térmico a 750 °C.
Tabla 1. Resistencia de polarización lineal (Rp) del acero inoxidable dúplex 2205 tratado térmicamente a 750° C
durante distintos tiempos, en contacto con una solución de NaCl al 3,5% a temperatura ambiente
Tiempo (h) Rp (Ω cm2)
Muestra Patrón 138,61±1,73
2 88,98±6,05
3 93,49±6,05
4 61,68±3,19
6 77,78±4,44
8 72,63±2,22
12 • P. Trocoli-Montesino et al.
Revista de Metalurgia 55(1), Enero-Marzo 2019, e135, ISSN-L: 0034-8570. https://doi.org/10.3989/revmetalm.135
térmico en el intervalo de potencial de la rama anó-dica entre 50 y 100 mV vs. Ag/AgCl.
3.3.2. Corrosión por Localizada
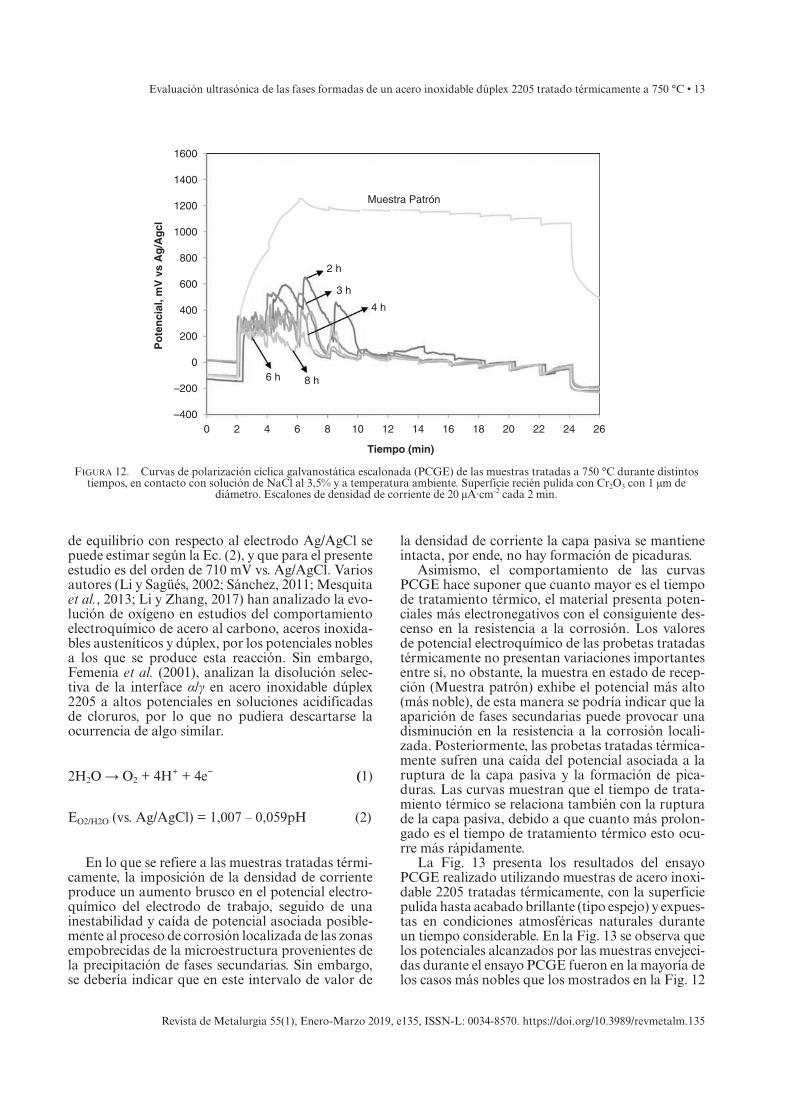
En la Fig. 12 se muestran las curvas de polari-zación cíclica galvanostática escalonada (PCGE), destaca la curva de la probeta en estado de recep-ción (Muestra patrón) en la que el potencial se ennoblece y se mantiene prácticamente constante
(1100-1200 mV vs. Ag/AgCl), posteriormente, cuando la densidad corriente disminuye a valores bajos el potencial decae nuevamente hasta el poten-cial de corrosión (Ecorr). Este comportamiento es distinto en comparación con las probetas tratadas térmicamente, debido a que se presenta en forma de picos pequeños a lo largo de toda la rama ascen-dente, mientras que las curvas obtenidas para las probetas tratadas térmicamente revelan inestabili-dad en los escalones cuasiestacionarios de la rama ascendente.
El comportamiento presentado por la Muestra patrón sugiere que el acero inoxidable dúplex 2205 en este estado de recepción posee una capa pasiva estable que le otorga gran resistencia a la corrosión localizada. Su microestructura bifásica es relativa-mente homogénea permitiendo la formación de una capa de óxidos y/o hidróxidos uniforme con propiedades protectoras en toda su superficie. Los potenciales nobles alcanzados al aplicar los escalo-nes de corriente y su comportamiento indican que sobre la superficie pasiva del acero 2205 puede estar ocurriendo la evolución de oxígeno según la reac-ción presentada en la Ec. (1), en la que el potencial
200
100
0
–100
–200
–300
–400
–500
0,001
(i) (µA·cm-2)
E v
s. A
g/A
gcl
(m
V)
0,01 0,1 1 10 100
400
300Muestra Patrón
3 h
6 h
2 h
8 h
4 h
Figura 11. Curvas de polarización de acero inoxidable dúplex 2205 sometido a 750 °C durante distintos tiempos, en una solución de NaCl al 3,5% a temperatura ambiente.
Tabla 2. Parámetros electroquímicos, potencial de corrosión (Ecorr) y densidad de corriente (icorr), obtenidos
mediante las curvas de polarización
Tiempo (h) Ecorr (mV vs. Ag/AgCl) icorr (μA·cm−2)
Muestra Patrón −150±50 0,24±0,03
2 −135±15 0,30±0,04
3 −140±20 0,19±0,0
4 −130±10 0,20±0,05
6 −160±0 0,26±0,03
8 −175±25 0,26±0,01
Evaluación ultrasónica de las fases formadas de un acero inoxidable dúplex 2205 tratado térmicamente a 750 °C • 13
Revista de Metalurgia 55(1), Enero-Marzo 2019, e135, ISSN-L: 0034-8570. https://doi.org/10.3989/revmetalm.135
de equilibrio con respecto al electrodo Ag/AgCl se puede estimar según la Ec. (2), y que para el presente estudio es del orden de 710 mV vs. Ag/AgCl. Varios autores (Li y Sagüés, 2002; Sánchez, 2011; Mesquita et al., 2013; Li y Zhang, 2017) han analizado la evo-lución de oxígeno en estudios del comportamiento electroquímico de acero al carbono, aceros inoxida-bles austeníticos y dúplex, por los potenciales nobles a los que se produce esta reacción. Sin embargo, Femenia et al. (2001), analizan la disolución selec-tiva de la interface α/γ en acero inoxidable dúplex 2205 a altos potenciales en soluciones acidificadas de cloruros, por lo que no pudiera descartarse la ocurrencia de algo similar.
2H2O → O2 + 4H+ + 4e− (1)
EO2/H2O (vs. Ag/AgCl) = 1,007 – 0,059pH (2)
En lo que se refiere a las muestras tratadas térmi-camente, la imposición de la densidad de corriente produce un aumento brusco en el potencial electro-químico del electrodo de trabajo, seguido de una inestabilidad y caída de potencial asociada posible-mente al proceso de corrosión localizada de las zonas empobrecidas de la microestructura provenientes de la precipitación de fases secundarias. Sin embargo, se debería indicar que en este intervalo de valor de
la densidad de corriente la capa pasiva se mantiene intacta, por ende, no hay formación de picaduras.
Asimismo, el comportamiento de las curvas PCGE hace suponer que cuanto mayor es el tiempo de tratamiento térmico, el material presenta poten-ciales más electronegativos con el consiguiente des-censo en la resistencia a la corrosión. Los valores de potencial electroquímico de las probetas tratadas térmicamente no presentan variaciones importantes entre sí, no obstante, la muestra en estado de recep-ción (Muestra patrón) exhibe el potencial más alto (más noble), de esta manera se podría indicar que la aparición de fases secundarias puede provocar una disminución en la resistencia a la corrosión locali-zada. Posteriormente, las probetas tratadas térmica-mente sufren una caída del potencial asociada a la ruptura de la capa pasiva y la formación de pica-duras. Las curvas muestran que el tiempo de trata-miento térmico se relaciona también con la ruptura de la capa pasiva, debido a que cuanto más prolon-gado es el tiempo de tratamiento térmico esto ocu-rre más rápidamente.
La Fig. 13 presenta los resultados del ensayo PCGE realizado utilizando muestras de acero inoxi-dable 2205 tratadas térmicamente, con la superficie pulida hasta acabado brillante (tipo espejo) y expues-tas en condiciones atmosféricas naturales durante un tiempo considerable. En la Fig. 13 se observa que los potenciales alcanzados por las muestras envejeci-das durante el ensayo PCGE fueron en la mayoría de los casos más nobles que los mostrados en la Fig. 12
1600
1400
1200
1000
800
600
400
200
0
–200
–4000
Muestra Patrón
Po
ten
cial
, mV
vs
Ag
/Ag
cl
2 4 6 8 10 12 14 16 18 20 22 24 26
Tiempo (min)
3 h
6 h
2 h
8 h
4 h
Figura 12. Curvas de polarización cíclica galvanostática escalonada (PCGE) de las muestras tratadas a 750 °C durante distintos tiempos, en contacto con solución de NaCl al 3,5% y a temperatura ambiente. Superficie recién pulida con Cr2O3 con 1 µm de
diámetro. Escalones de densidad de corriente de 20 μA·cm-2 cada 2 min.
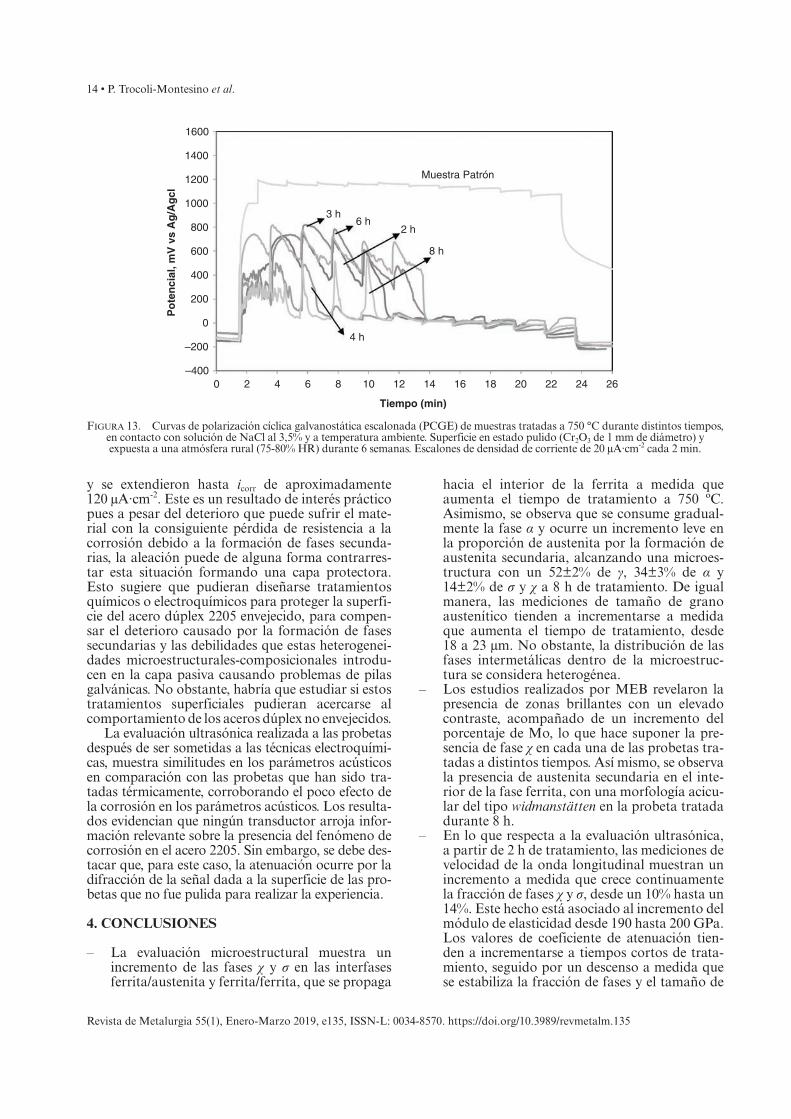
14 • P. Trocoli-Montesino et al.
Revista de Metalurgia 55(1), Enero-Marzo 2019, e135, ISSN-L: 0034-8570. https://doi.org/10.3989/revmetalm.135
y se extendieron hasta icorr de aproximadamente 120 µA·cm-2. Este es un resultado de interés práctico pues a pesar del deterioro que puede sufrir el mate-rial con la consiguiente pérdida de resistencia a la corrosión debido a la formación de fases secunda-rias, la aleación puede de alguna forma contrarres-tar esta situación formando una capa protectora. Esto sugiere que pudieran diseñarse tratamientos químicos o electroquímicos para proteger la superfi-cie del acero dúplex 2205 envejecido, para compen-sar el deterioro causado por la formación de fases secundarias y las debilidades que estas heterogenei-dades microestructurales-composicionales introdu-cen en la capa pasiva causando problemas de pilas galvánicas. No obstante, habría que estudiar si estos tratamientos superficiales pudieran acercarse al comportamiento de los aceros dúplex no envejecidos.
La evaluación ultrasónica realizada a las probetas después de ser sometidas a las técnicas electroquími-cas, muestra similitudes en los parámetros acústicos en comparación con las probetas que han sido tra-tadas térmicamente, corroborando el poco efecto de la corrosión en los parámetros acústicos. Los resulta-dos evidencian que ningún transductor arroja infor-mación relevante sobre la presencia del fenómeno de corrosión en el acero 2205. Sin embargo, se debe des-tacar que, para este caso, la atenuación ocurre por la difracción de la señal dada a la superficie de las pro-betas que no fue pulida para realizar la experiencia.
4. CONCLUSIONES
– La evaluación microestructural muestra un incremento de las fases χ y σ en las interfases ferrita/austenita y ferrita/ferrita, que se propaga
hacia el interior de la ferrita a medida que aumenta el tiempo de tratamiento a 750 ºC. Asimismo, se observa que se consume gradual-mente la fase α y ocurre un incremento leve en la proporción de austenita por la formación de austenita secundaria, alcanzando una microes-tructura con un 52±2% de γ, 34±3% de α y 14±2% de σ y χ a 8 h de tratamiento. De igual manera, las mediciones de tamaño de grano austenítico tienden a incrementarse a medida que aumenta el tiempo de tratamiento, desde 18 a 23 μm. No obstante, la distribución de las fases intermetálicas dentro de la microestruc-tura se considera heterogénea.
– Los estudios realizados por MEB revelaron la presencia de zonas brillantes con un elevado contraste, acompañado de un incremento del porcentaje de Mo, lo que hace suponer la pre-sencia de fase χ en cada una de las probetas tra-tadas a distintos tiempos. Así mismo, se observa la presencia de austenita secundaria en el inte-rior de la fase ferrita, con una morfología acicu-lar del tipo widmanstätten en la probeta tratada durante 8 h.
– En lo que respecta a la evaluación ultrasónica, a partir de 2 h de tratamiento, las mediciones de velocidad de la onda longitudinal muestran un incremento a medida que crece continuamente la fracción de fases χ y σ, desde un 10% hasta un 14%. Este hecho está asociado al incremento del módulo de elasticidad desde 190 hasta 200 GPa. Los valores de coeficiente de atenuación tien-den a incrementarse a tiempos cortos de trata-miento, seguido por un descenso a medida que se estabiliza la fracción de fases y el tamaño de
1600
1400
1200
1000
800
600
400
200
0
0–400
3 h6 h
2 h
8 h
4 h
Muestra Patrón
Tiempo (min)
Po
ten
cial
, mV
vs
Ag
/Ag
cl
2 4 8 10 12 14 16 18 20 22 24 266
–200
Figura 13. Curvas de polarización cíclica galvanostática escalonada (PCGE) de muestras tratadas a 750 °C durante distintos tiempos, en contacto con solución de NaCl al 3,5% y a temperatura ambiente. Superficie en estado pulido (Cr2O3 de 1 mm de diámetro) y expuesta a una atmósfera rural (75-80% HR) durante 6 semanas. Escalones de densidad de corriente de 20 μA·cm-2 cada 2 min.
Evaluación ultrasónica de las fases formadas de un acero inoxidable dúplex 2205 tratado térmicamente a 750 °C • 15
Revista de Metalurgia 55(1), Enero-Marzo 2019, e135, ISSN-L: 0034-8570. https://doi.org/10.3989/revmetalm.135
grano austenítico. La mayor parte de la atenua-ción proviene de la dispersión de la onda como consecuencia de la aparición de fases secunda-rias y el crecimiento del tamaño de grano auste-nítico en la microestructura del material.
– Los resultados electroquímicos revelan el decre-cimiento de la resistencia a la polarización lineal (Rp) a medida que aumenta el tiempo de trata-miento térmico por la precipitación de fases σ y χ. Sin embargo, las curvas de polarización demostraron que las muestras tratadas térmica-mente no presentaron una variación significativa respecto a la muestra sin tratar. La inestabilidad de la icorr observada en la rama anódica de las mismas se asocia a la corrosión selectiva de las heterogeneidades en la microestructura del material. Por otro lado, no se observó una zona de pasivación estable.
– La técnica PCGE mostró que un aumento en el tiempo de tratamiento térmico ocasiona una pérdida de la resistencia a la corrosión locali-zada, debido a que la curva de la Muestra patrón alcanza un estado de pasividad estable. Mientras que las probetas tratadas térmicamente presen-tan corrosión localizada posiblemente atribuida a las zonas empobrecidas de Cr y Mo y que está indicada por una caída del potencial electro-químico asociada a un daño microestructural. Finalmente, ningún transductor arroja informa-ción relevante sobre la presencia del fenómeno de corrosión en el acero inoxidable dúplex 2205.
AGRADECIMIENTOS
Los autores agradecen al Laboratorio E de la Universidad Simón Bolívar y a la Empresa SANDVIK de Venezuela por suministrar, en cali-dad de donación, el material estudiado.
REFERENCIAS
ASTM E3-01 (2007). Standard Guide for Preparation of Metal-lographic Specimens. ASTM International, West Con-shohocken, USA.
ASTM G100-89 (1999). Standard Test Method for Conduct-ing Cyclic Galvanostaircase Polarization. ASTM Interna-tional, West Conshohocken. USA.
Badji, R., Bouabdallah, M., Bacroix, B., Kahloun, C., Belkessa, B., Maza, H. (2008). Phase transformation and mechani-cal behavior in annealed 2205 duplex stainless steel welds. Mater. Charact. 59 (4), 447-453. https://doi.org/10.1016/j.matchar.2007.03.004.
Chen, T.H., Yang, J.R. (2001). Effects of solution treatment and continuous cooling on σ-phase precipitation in a 2205 duplex stainless steel. Mat. Sci. Eng A-Struct. 311 (1-2), 28-41. https://doi.org/10.1016/S0921-5093(01)00911-X.
Escriba, D., Materna-Morris, E., Plaut, R., Padilha, A. (2009). Chi-phase precipitation in a duplex stainless steel. Mater. Charact. 60 (11), 1214-1219. https://doi.org/10.1016/j.matchar.2009.04.013.
Fargas, G., Anglada, M., Mateo, A. (2009). Effect of the anneal-ing temperature on the mechanical properties, formability and corrosion resistance of hot-rolled duplex stainless Steel. J. Mater. Process. Tech. 209 (4), 1770-1782. https://doi.org/10.1016/j.jmatprotec.2008.04.026.
Femeina, M., Pan, J., Leygraf, C., Luukkonen, P. (2001). In situ study of selective dissolution of duplex stainless steel 2205 by electrochemical scanning tunneling microscopy. Corros. Sci. 43 (10), 1939-1951. https://doi.org/10.1016/S0010-938X(00)00180-3.
Gao, T., Wang, J., Sun, Q., Han, P. (2018). Corrosion behavior difference in initial period for hot-rolled and cold-rolled 2205 duplex stainless steels. Metals 8 (6), 407. https://doi.org/10.3390/met8060407.
Ghosh, S.K., Mondal, S. (2008). High temperature age-ing behaviour of a duplex stainless steel. Mater. Char-act. 59 (12), 1776–1783. https://doi.org/10.1016/j.matchar.2008.04.008.
Ginn, B., Gooch, T. (1998). Effect of intermetallic content on pitting resistance of ferritic/austenitic stainless steel. TWI report; 1995-1997 CRP. Programme 9403-6, TWI Cam-bridge, England.
Gironès, A., Anglada, M., Mateo, A. (2007). Chloride content effect on the corrosión fatigue properties of superduplex stainless steels. J. Eng. Mater. Technol. 129 (4), 588-593. https://doi.org/10.1115/1.2772325.
Gunn, R. (1997). Duplex stainless steels. Microstructure, proper-ties and applications. Woodhead Publishing Ltd., England.
Hakan, C., Orkun, B. (2005). Characterization of micro-structural phases of steels by sound velocity measure-ment. Materials Charact. 55 (2), 160-166. https://doi.org/10.1016/j.matchar.2005.05.002.
Jayakumar, T., Raj, B., Willems, H., Arnold, W. (1991). Influ-ence of microstructure on ultrasonic velocity in Nimonic alloy PE16. In: Review of Progress in Quantitative Non-destructive Evaluation, Thompson D.O., Chimenti D.E. (Eds.), Springer, Boston, MA, pp. 1693-1699. https://doi.org/10.1007/978-1-4615-3742-7_72.
Karlsson, L. (1999). Intermetallic phase precipitation in duplex stainless steels and weld metals: Metallurgy, influence on properties and welding aspects. Weld. Res. Counc. Bull. 43 (438), 1-23.
Kumar, A., Jayakumar, T., Raj, B. (2000). Ultrasonic spectral analysis for microstructural characterization of austen-itic and ferritic steels. Philos. Mag. A 80 (11), 2469-2487. https://doi.org/10.1080/01418610008216486.
Li, L., Sagüés, A. (2002). Chloride corrosion threshold of reinforcing steel in alkaline solutions – cyclic polariza-tion behavior. Corrosion 58 (4), 305-316. https://doi.org/10.5006/1.3287678.
Li, B., Zhang, W. (2017). Electrochemical and corrosion behav-ior of 2205 duplex stainless steel in simulated concrete pore solution. Int. J. Electrochem. Sci. 12, 8432-8446. https://doi.org/10.20964/2017.09.43.
Macedo, E. de, Costa, V, Pereira, J., Gomes, A., Pinho, E., Tava-res, J. (2009). Phase transformations evaluation on a UNS S331803 duplex stainless steel based on nondestructive testing. Mat. Sci. Eng. A-Struct. 516 (1-2), 126-130. https://doi.org/10.1016/j.msea.2009.03.004.
Mangonon, P.L. (1999). The Principles of Materials Selection for Engineering Design. Prentice Hall. Upper Saddle River, USA.
Mateo, A., Llanes, L. (1997). Characterization of the intermetallic G-phase in an AISI 329 duplex stain-less steel. J. Mater. Sci. 32 (17), 4533-4540. https://doi.org/10.1023/A:1018669217124.
Mesquita, T.J., Chauveau, E., Mantel, M., Kinsman, N., Nogueira, R.P. (2013). Influence of Mo alloying on pitting corrosion of stainless steels used as concrete reinforcement. Rev. Esc. Minas, 66 (2), 173-178. https://doi.org/10.1590/S0370-44672013000200006.
Michalska, J., Sozańska, M. (2006). Qualitative and quantitative analysis of σ and χ phases in 2205 duplex stainless steel. Mater. Charact. 56 (4-5), 355-362. https://doi.org/10.1016/j.matchar.2005.11.003.
Nayar, A. (2002). The Steel Handbook, McGraw Hill Education, England.
Paulraj, P., Garg, R. (2015). Effect of intermetallic phases on cor-rosion behavior and mechanical properties of duplex stain-less steel and super-duplex stainless steel. Adv. Sci. Technol. 9 (27), 87-105. https://doi.org/10.12913/22998624/59090.
16 • P. Trocoli-Montesino et al.
Revista de Metalurgia 55(1), Enero-Marzo 2019, e135, ISSN-L: 0034-8570. https://doi.org/10.3989/revmetalm.135
Pohl, M., Storz, O., Glogowski, T. (2007). Effect of intermetallic precipitations on the properties of duplex stainless steel. Mater. Charact. 58 (1), 65–71. https://doi.org/10.1016/j.matchar.2006.03.015.
Rajkumar, K.V., Kumar A., Jayakumar, T., Raj, B., Ray, K.K. (2007). Characterization of aging behavior in M250 grade managing steel using ultrasonic measurements. Metall. Mater. Trans. A 38 (2), 236-243. https://doi.org/10.1007/s11661-006-9060-y.
Rodríguez, E., Stella, J., Ruiz, A., Fargas, G., Mateo, A. (2011a). Characterization of microstructural changes in a duplex stainless steel using spectral analysis and conventional ultrasonic techniques. Mater. Test. 53 (9), 564–571. https://doi.org/10.3139/120.110264.
Rodríguez, E., Stella, J., Kryzanowskyj, A., Amorer, L., Mateo, A. (2011b). Caracterización de la respuesta ultrasónica de un acero dúplex 2205 durante la diso-lución de la fase sigma. Rev. LatinAm. Metal. Mat. 32 (1), 49-60. http://rlmm.org/ojs/index.php/rlmm/article/view/141.
Ruiz, A., Ortiz, N., Carreón, H., Rubio, C. (2009). Utilization of ultrasonic measurements for determining the variations in microstructure of thermally degraded 2205 duplex stain-less steel. J. Nondestruct. Eval. 28, 131-139. https://doi.org/10.1007/s10921-009-0055-7.
Sánchez, E.M. (2011). Pitting potential of high performance duplex stainless steels reinforcements. Master of Science Thesis, Florida Atlantic University, USA.
Revista de MetaluRgia Enero–Marzo 2019, 55(1), e136
ISSN-L: 0034-8570https://doi.org/10.3989/revmetalm.136
Estudio comparativo de la nitrocarburación de los aceros AISI 4340 y AISI 347 mediante el proceso Tenifer-QPQ®
Leornado Bellasa, Gemma Castrob, Laura Merab, José L. Mierc,*, Ana Garcíac, Angel Varelac
aGrupo Cetus, Polígono O Acevedo, Parcela, 15185 Cerceda, A Coruña, EspañabAsociación de Investigación Metalúrgica del Noroeste (AIMEN), Relva St. 27, 36410 Porriño, Pontevedra, España
cEscola Politécnica Superior de Ferrol, Universidade da Coruña, Rúa Mendizabal s/n, 15403 Ferrol, A Coruña, España
(*Autor para la correspondencia: [email protected])
Enviado: 26 Febrero 2018; Aceptado: 2 Octubre 2018; Publicado on-Line: 26 Marzo 2019
RESUMEN: Este trabajo estudia las diferencias microestructurales y tribológicas de las capas formadas durante la nitrocarburación ferrítica del acero aleado AISI 4340 y la nitrocarburación austenítica del acero inoxidable estabilizado AISI 347. Las muestras se sometieron a distintos tiempos de inmersión en un baño de nitrocar-buración (60, 75, 90, 105 y 120 min) a 580 ºC. Posteriormente se sometieron a un proceso de oxidación a 480 ºC para formar una capa de Fe3O4. Los estudios de la microestructura de la capa nitrocarburada se realizaron por microscopía electrónica de barrido (SEM), espectroscopía de dispersión de energías (EDS) y difracción de rayos X (XRD). Se estudió el desgaste y el coeficiente de fricción de las muestras nitrocarburadas y las muestras no tratadas mediante el ensayo pink-on disk. Los resultados muestran tres zonas bien diferenciadas en el acero AISI 4340: una capa de óxidos externa, una capa blanca o de combinación y zona de difusión. Sin embargo, no se detectó la presencia de la capa de combinación en el acero AISI 347. En ambos aceros, el coeficiente específico de desgaste (k) de las muestras nitrocarburadas fue aproximadamente treinta veces menor que el de las muestras de referencia.
PALABRAS–CLAVE: Desgaste; Microestructura; Nitrocarburación austenítica; Nitrocarburación ferrítica; Nitrocarburación líquida; Tennifer®QPQ
Citar como/Citation: Bellas, L.; Castro, G.; Mera, L.; Mier, J.L.; García, A.; Varela, A. (2019). “Estudio comparativo de la nitrocarburación de los aceros AISI 4340 y AISI 347 mediante el proceso Tenifer-QPQ®”. Rev. Metal. 55(1): e136. https://doi.org/10.3989/revmetalm.136
ABSTRACT: Comparative study of AISI 4340 and AISI 347 nitrocarburizing by Tenifer-QPQ® process. This paper studies the microstructural and tribological differences of layers formed during the ferritic nitrocarbu-rizing of AISI 4340 alloy steel and AISI 347 stabilized stainless steel. The samples were exposed to different times of immersion in a nitrocarburizing bath (60, 75, 90, 105 and 120 min) at 580 °C. Subsequently, they were subjected to an oxidation process at 480 °C in order to form a Fe3O4 layer. Surface microstructural studies were carried out by SEM-EDS and x-ray diffraction (XRD). Wear and friction coefficient of nitrocarburized samples and non-treated samples were studied by pin-on-disk test. The results show two well-differentiated zones in AISI 4340 steel: an outer oxides layer, a white layer or compound layer and a diffusion zone. However, the compound layer was not found in AISI 347 steel. In both steels, the specific wear coefficient (k) of nitrocarburated samples is about thirty times lower than the reference samples.
KEYWORDS: Austenitic nitrocarburizing; Ferritic nitrocarburizing; Liquid nitrocarburizing; Microestructure; Tennifer®QPQ process; Wear
ORCID: Leonardo Bellas (https://orcid.org/0000-0002-1366-7758); Gemma Castro (https://orcid.org/0000-0003-2637-5348); Laura Mera (https://orcid.org/0000-0002-5533-533X); José L. Mier (https://orcid.org/0000-0003-2539-7684); Ana García (https://orcid.org/0000-0003-2969-1901); Angel Varela (https://orcid.org/0000-0002-1211-115X)
Copyright: © 2019 CSIC. Este es un artículo de acceso abierto distribuido bajo los términos de la licencia de uso y distribución Creative Commons Reconocimiento 4.0 Internacional (CC BY 4.0).
2 • L. Bellas et al.
Revista de Metalurgia 55(1), Enero–Marzo 2019, e136, ISSN-L: 0034-8570. https://doi.org/10.3989/revmetalm.136
1. INTRODUCCIÓN
La nitrocarburación en baño de sales Tenifer-QPQ® se ha utilizado por una gran variedad de industrias durante las últimas décadas para mejorar la resistencia al desgaste, corrosión y fatiga de piezas de acero y fundición. El tratamiento se realiza a tem-peraturas comprendidas entre 480 y 620 °C en atmós-fera oxidante con inmersión de la pieza en un baño de sales fundidas cuyo componente activo son cianatos alcalinos. Las reacciones que tienen lugar son:
Oxidación de cianuros: 2 NaCN(s)+ O2(g) → 2 NaCNO(s) (1)
Descomposición del cianato: 4 NaCNO(s) → Na2CO3(s) + 2NaCN(s) + CO(g) + 2N(g) (2)
Se forma así nitrógeno atómico que se introduce en el metal por difusión. Mientras, el monóxido de carbono se disocia sobre la superficie del acero a través de la reacción:
2 CO(g) → C(s) + CO2 (g) (3)
generando carbono que también se difunde al inte-rior del acero.
Además este proceso incluye dos etapas de oxi-dación que tienen como objeto la creación de una capa de magnetita (Fe3O4) la cual aumenta la resis-tencia a la corrosión y al desgaste, aunque todavía no se conoce el mecanismo por el cual esto sucede (Marušić et al., 2006; Li et al., 2008a), y una etapa de pulido intercalada entre las anteriores para disminuir la rugosidad de las superficies nitrocarburadas.
En los aceros al carbono (AISI 10xx) y los ace-ros aleados Cr-Ni-Mo (AISI 4xxx) la nitrocarbura-ción ferrítica (FNC) se suele realizar a temperaturas entre 500 y 590 °C, mientras que la nitrocarbura-ción austenítica (ACN) se lleva a cabo entre 590 ºC y 700 °C (Fattah y Mahboubi, 2010; Schneider, 2014). En ambos casos se forma una capa externa, capa de compuestos, que da al material resistencia a la corrosión y al desgaste, y una zona interna de difusión que aumenta la resistencia a la fatiga del acero (Mittemeijer, 2013; Brühl et al., 2016). En la capa de compuestos tiene lugar la precipitación de nitruros y carbonitruros de hierro como la fase ε (Fe2-3(C,N)) y fase γ´ (Fe4(C,N)) y nitruros de ele-mentos de aleación. Las diferencias microestruc-turales más significativas entre un tipo de proceso y otro son dos: por una parte, en la nitrocarburación
austenítica tiene lugar la aparición de la subcapa γ o fase S enriquecida en nitrógeno y carbono entre la capa de compuestos y la capa de difusión en la cual la red cristalina de la austenita sufre una expansión, y, por otra, el menor espesor de la capa de difusión en la nitrocarburación ferrítica que en la austenítica (Dong, 2010; Fattah y Mahboubi, 2010).
La existencia de austenita a temperaturas mucho más bajas en los aceros inoxidables austeníticos que los aceros AISI 1xxx y AISI 4xxx posibilita la reali-zación del proceso de nitrocarburación austenítica a las mismas temperaturas que la nitrocarburación ferrítica (Li et al., 2008a; Wang et al., 2014). Hay que tener en cuenta que en los aceros inoxidables austeníticos existen dos causas que pueden dis-minuir la cinética de difusión del nitrógeno y car-bono en la matriz austenítica: en primer lugar, la existencia de la capa pasiva de Cr2O3 que hace de barrera difusional de dichos elementos intersticiales, y, en segundo lugar, la gran cantidad de elementos de aleación que contienen estos aceros (Funatani, 2004; Flodström, 2012).
El presente trabajo tiene como objetivo estable-cer las diferencias más significativas de compor-tamiento frente al desgaste y su relación con las características mecánicas y microestructurales de los aceros AISI 4340 y AISI 347 nitrocarburados en baño de sales. El primero de ellos es un acero de baja aleación que, normalmente, se le suele emplear en nitrocarburación ferrítica, y el segundo se trata de un acero inoxidable austenítico con altos contenidos de cromo y níquel y la presencia de niobio como ele-mento estabilizante frente al fenómeno de sensibili-zación. Por último, este trabajo trata de profundizar en el conocimiento del proceso nitrocarburación en baño de sales de aceros inoxidables estabilizados sobre los que apenas se han realizados estudios.
2. MATERIALES Y MÉTODOS
La primera etapa del proceso Tenifer-QPQ® consistió en un precalentamiento en aire a 420 °C de 20 a 40 min. En la segunda etapa las piezas se introdujeron en un baño que contenía una mezcla de cianuros y carbonatos alcalinos a 580 °C creán-dose, de esta manera, la capa nitrocarburada. Los tiempos de nitrocarburación empleados fueron 60, 75, 90, 105 y 120 min. En la siguiente, las probetas se metieron en un baño de nitritos y nitratos a 420 °C durante 15 min en el que se produce la oxidación superficial del acero que origina Fe3O4. En la cuarta etapa se realiza el pulido de las muestras a tempera-tura ambiente con chorreado de perlas de vidrio de 40–70 µm de diámetro a 3 bares de presión. En la última etapa se realiza un nuevo tratamiento de oxi-dación a 420 °C durante 25 min.
Para este estudio se emplearon el acero AISI 4340 (0,29%C, 0,31%Si, 0,75%Mn, 2,12%Cr, 0,42%Mo, 1,99%Ni, <0,025%P, <0,035%S, resto Fe)
Estudio comparativo de la nitrocarburación de los aceros AISI 4340 y AISI 347 mediante el proceso Tenifer-QPQ® • 3
Revista de Metalurgia 55(1), Enero–Marzo 2019, e136, ISSN-L: 0034-8570. https://doi.org/10.3989/revmetalm.136
templado en aceite desde 800 ºC y revenido a 600 ºC durante 2 h, y el acero inoxidable AISI 347 (0,05%C, 0,53%Si, 1,53%Mn, 17,41%Cr, 9,28%Ni, 0,42%Nb, 0,02%P, <0,009%S, resto Fe). Las composiciones se determinaron mediante un espectrómetro de chispa, modelo Spectromax LMF04 de Spectro. Tanto las muestras del acero AISI 4340 como las del AISI 347 se identificaron en función del tiempo de nitrocarburación: A-60, A-75, A-90, A-105 y A-120 para las muestras de acero AISI 4340 y S-60, S-75, S-90, S-105 y S-120 en el caso del acero AISI 347. La cifra indica el número de minutos en el baño de nitrocarburación.
Las secciones transversales de las capas nitro-carburadas se analizaron mediante microscopía óptica con un banco metalográfico Leica MEF4A y microscopía electrónica de barrido (SEM) con un equipo Hitachi S4800 equipado con un espe-ctrómetro de energías dispersivas (EDS) Bruker Quantax 400. Se determinó la estequiometría de los compuestos de la capa blanca y capa de óxi-dos superficiales mediante difracción de RX con un difractómetro Siemens D5000 que utilizó la radiación Kα del cobre. Para ello, se prepararon y analizaron las muestras indicadas con las siguien-tes condiciones: paso de 0,050º, tiempo por paso 5 segundos y potencia 30 mA y 40 KV.
La evolución de las microdurezas con la pro-fundidad en el acero AISI 4340 se determinó con un microdurómetro Shimadzu que empleó un indentador de diamante con geometría Vickers. En el caso del acero AISI 347, las medidas de micro-dureza se han realizado mediante un nanoindenta-dor NanoTest 600 de MicroMaterials Ltd debido al pequeño espesor de la capa de nitrocarburación obtenido, especialmente para un tiempo de perma-nencia de 60 min. Esta técnica permite hacer huellas de pequeño tamaño sin necesidad de realizar una inspección visual de las mismas. Sin embargo, hay que decir que, dadas las bajas cargas aplicadas en la nanoindentación (30 mN en el presente trabajo), existe una mayor dispersión de valores ya que son más sensibles a la presencia de heterogeneidades de la muestra. En el caso del acero AISI 4340 se realizó un barrido en cada muestra con 8 huellas, mientras que en el acero AISI 347 se realizó un barrido en cada muestra con un promedio de 7 a 11 huellas en la capa de nitrocarburación, y de 5 huellas en el material base. Para la determinación de la resisten-cia al desgaste se empleó un tribómetro MicroTest modelo MT2/60/SCM. Las capas superficiales objeto de estudio fueron sometidas a contacto deslizante mediante una configuración pin-on-disk, donde la contraparte estática (pin) se corresponde con una bola de alúmina (1500-1600 HV) con una carga nor-mal de 10 N en la determinación de la resistencia al desgaste con objeto de aumentar las características abrasivas del ensayo, y acero de calidad AISI 52100 (600-800 HV) con una carga normal de 1 N en la
determinación del coeficiente de fricción. La tem-peratura de ensayo fue 25 ºC y la distancia recorrida 250 m. Hay que señalar que cada uno de estos ensayos se ha realizado tres veces con cada contra-parte estática para asegurar la reproducibilidad de los resultados obtenidos. El volumen desgastado (ΔV) se ha calculado mediante perfilometría de con-tacto, y los valores de fuerza normal aplicada en el contacto y distancia de deslizamiento son 10 N y 500 m respectivamente.
3. RESULTADOS Y DISCUSIÓN
3.1. Caracterización microestructural
Como se puede ver en la Tabla 1, tanto el espesor de la capa de óxidos como el de la capa de nitru-ración aumentan con el tiempo de tratamiento de los dos tipos de aceros. En el acero AISI 4340 se alcanzan 4,7 µm en la capa de óxidos y 186,6 µm en la capa de nitrocarburación a los 120 min de tratamiento. Mientras, en el acero AISI 347 puede verse que el espesor de la capa de óxido alcanza en la probeta S-60 un espesor medio del orden de 1,2 µm y de 2,7 µm en la probeta S-120. En cuanto a los espesores de la capa nitrocarburada se sitúan entre 29 y 50 µm. Estos valores son mucho menores que los obtenidos en el caso del acero AISI 4340 con tiempos semejantes lo que se debe al alto contenido en cromo del AISI 347, que dificulta la difusión del nitrógeno y aumenta la cantidad de nitruros precipi-tados (Wu et al., 2015)
La microestructura obtenida en todas las muestras del acero AISI 4340 nitrocarburado (Fig. 1a) es muy similar: en la parte más externa, se observa una capa de óxidos de poco espesor y, por debajo de ésta, una capa de combinación o capa blanca formada por
Tabla 1. Espesores de las capas de óxidos y nitrocarburación de los aceros AISI 4340 y AISI 347
tras el tratamiento Tenifer-QPQ®
Espesor (±0,5 μm)
Muestra Capa de óxidosCapa de
nitrocarburación
a-60 2,4 137,0
a-75 1,9 152,2
a-90 4,5 171,8
a-105 3,5 175,0
a-120 4,7 186,6
S-60 1,2 29,5
S-75 1,6 31,6
S-90 1,8 33,7
S-105 2,5 42,1
S-120 2,7 50,5
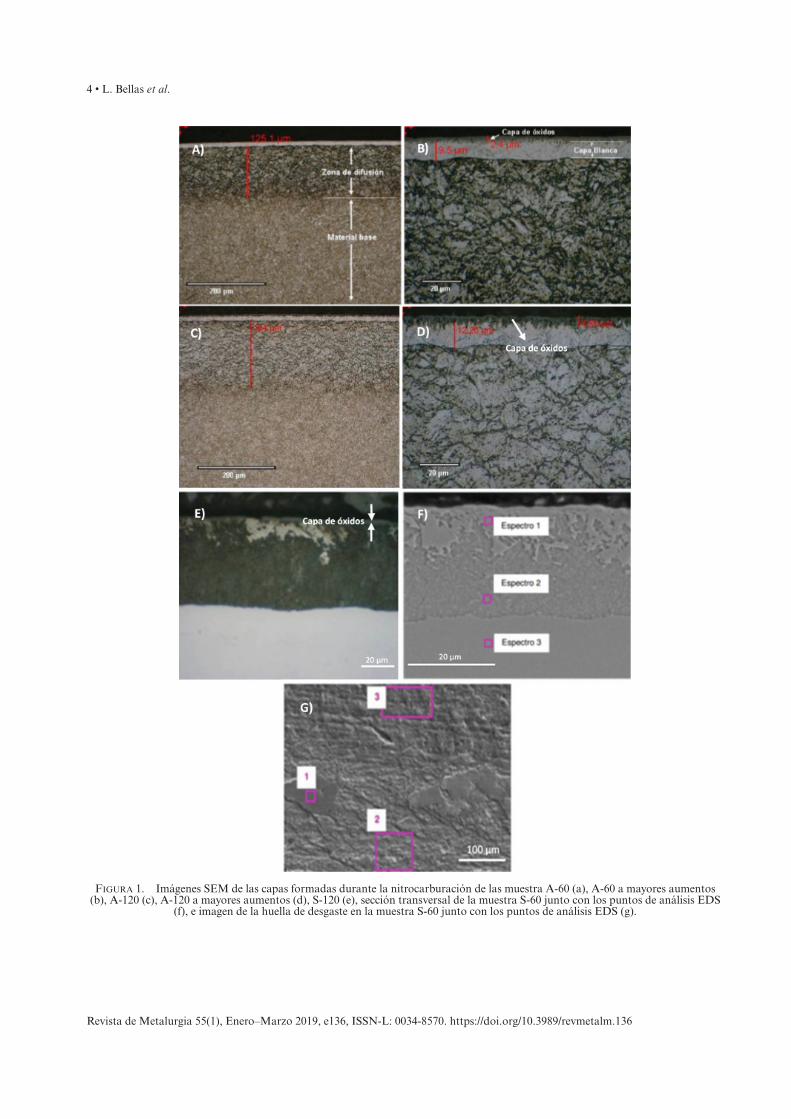
4 • L. Bellas et al.
Revista de Metalurgia 55(1), Enero–Marzo 2019, e136, ISSN-L: 0034-8570. https://doi.org/10.3989/revmetalm.136
Figura 1. Imágenes SEM de las capas formadas durante la nitrocarburación de las muestra A-60 (a), A-60 a mayores aumentos (b), A-120 (c), A-120 a mayores aumentos (d), S-120 (e), sección transversal de la muestra S-60 junto con los puntos de análisis EDS
(f), e imagen de la huella de desgaste en la muestra S-60 junto con los puntos de análisis EDS (g).
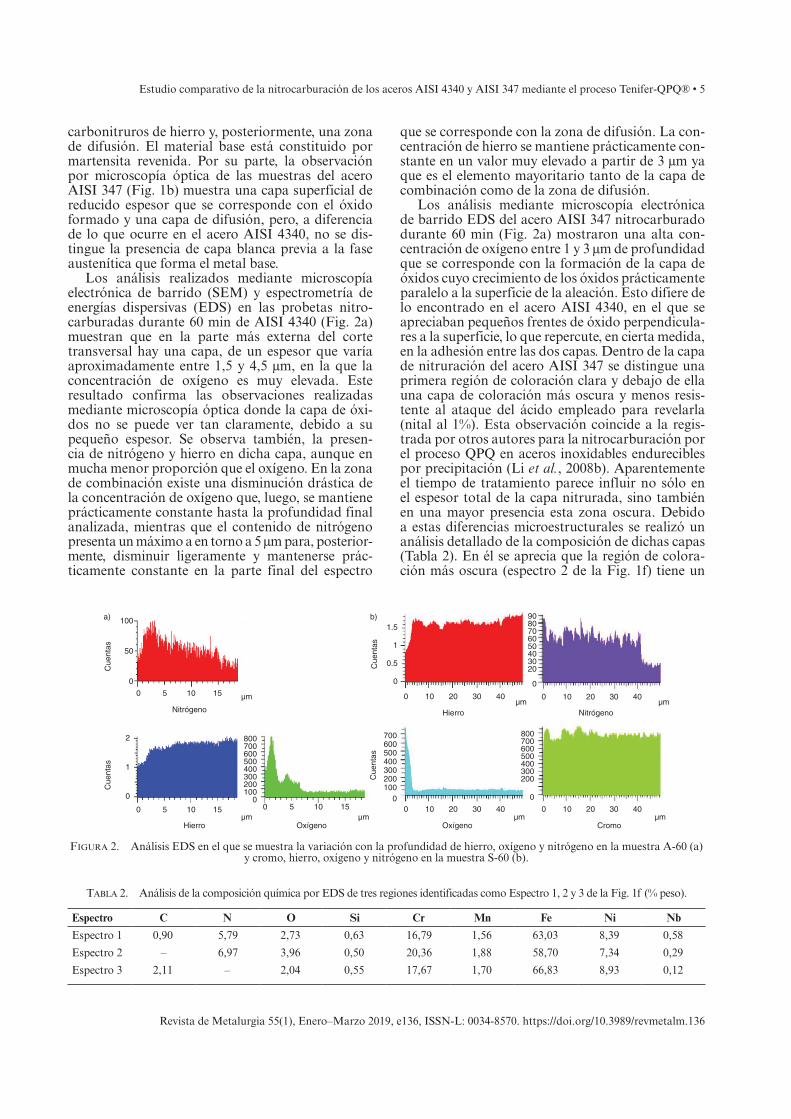
Estudio comparativo de la nitrocarburación de los aceros AISI 4340 y AISI 347 mediante el proceso Tenifer-QPQ® • 5
Revista de Metalurgia 55(1), Enero–Marzo 2019, e136, ISSN-L: 0034-8570. https://doi.org/10.3989/revmetalm.136
carbonitruros de hierro y, posteriormente, una zona de difusión. El material base está constituido por martensita revenida. Por su parte, la observación por microscopía óptica de las muestras del acero AISI 347 (Fig. 1b) muestra una capa superficial de reducido espesor que se corresponde con el óxido formado y una capa de difusión, pero, a diferencia de lo que ocurre en el acero AISI 4340, no se dis-tingue la presencia de capa blanca previa a la fase austenítica que forma el metal base.
Los análisis realizados mediante microscopía electrónica de barrido (SEM) y espectrometría de energías dispersivas (EDS) en las probetas nitro-carburadas durante 60 min de AISI 4340 (Fig. 2a) muestran que en la parte más externa del corte transversal hay una capa, de un espesor que varía aproximadamente entre 1,5 y 4,5 μm, en la que la concentración de oxígeno es muy elevada. Este resultado confirma las observaciones realizadas mediante microscopía óptica donde la capa de óxi-dos no se puede ver tan claramente, debido a su pequeño espesor. Se observa también, la presen-cia de nitrógeno y hierro en dicha capa, aunque en mucha menor proporción que el oxígeno. En la zona de combinación existe una disminución drástica de la concentración de oxígeno que, luego, se mantiene prácticamente constante hasta la profundidad final analizada, mientras que el contenido de nitrógeno presenta un máximo a en torno a 5 µm para, posterior-mente, disminuir ligeramente y mantenerse prác-ticamente constante en la parte final del espectro
que se corresponde con la zona de difusión. La con-centración de hierro se mantiene prácticamente con-stante en un valor muy elevado a partir de 3 μm ya que es el elemento mayoritario tanto de la capa de combinación como de la zona de difusión.
Los análisis mediante microscopía electrónica de barrido EDS del acero AISI 347 nitrocarburado durante 60 min (Fig. 2a) mostraron una alta con-centración de oxígeno entre 1 y 3 µm de profundidad que se corresponde con la formación de la capa de óxidos cuyo crecimiento de los óxidos prácticamente paralelo a la superficie de la aleación. Esto difiere de lo encontrado en el acero AISI 4340, en el que se apreciaban pequeños frentes de óxido perpendicula-res a la superficie, lo que repercute, en cierta medida, en la adhesión entre las dos capas. Dentro de la capa de nitruración del acero AISI 347 se distingue una primera región de coloración clara y debajo de ella una capa de coloración más oscura y menos resis-tente al ataque del ácido empleado para revelarla (nital al 1%). Esta observación coincide a la regis-trada por otros autores para la nitrocarburación por el proceso QPQ en aceros inoxidables endurecibles por precipitación (Li et al., 2008b). Aparentemente el tiempo de tratamiento parece influir no sólo en el espesor total de la capa nitrurada, sino también en una mayor presencia esta zona oscura. Debido a estas diferencias microestructurales se realizó un análisis detallado de la composición de dichas capas (Tabla 2). En él se aprecia que la región de colora-ción más oscura (espectro 2 de la Fig. 1f) tiene un
Tabla 2. Análisis de la composición química por EDS de tres regiones identificadas como Espectro 1, 2 y 3 de la Fig. 1f (% peso).
Espectro C N O Si Cr Mn Fe Ni Nb
Espectro 1 0,90 5,79 2,73 0,63 16,79 1,56 63,03 8,39 0,58
Espectro 2 – 6,97 3,96 0,50 20,36 1,88 58,70 7,34 0,29
Espectro 3 2,11 – 2,04 0,55 17,67 1,70 66,83 8,93 0,12
100a) b)
Cue
ntas
Cue
ntas
Cue
ntas
Cue
ntas
50
0
2 800700600500400300200100
0
800700600500400300200
0
700
0
0.52030405060708090
0
1
1.5
600500400300200100
0
1
0
0 5 10
Nitrógeno Nitrógeno
Hierro
Hierro
15
0 5 10 15 0 5
Oxígeno Oxígeno Cromo
10 15 0 10 20 30 40
0 10 20 30 40 0 10 20 30 40
0 10 20 30 40
µm
µm µm µm
µmµm
µm
Figura 2. Análisis EDS en el que se muestra la variación con la profundidad de hierro, oxígeno y nitrógeno en la muestra A-60 (a) y cromo, hierro, oxígeno y nitrógeno en la muestra S-60 (b).
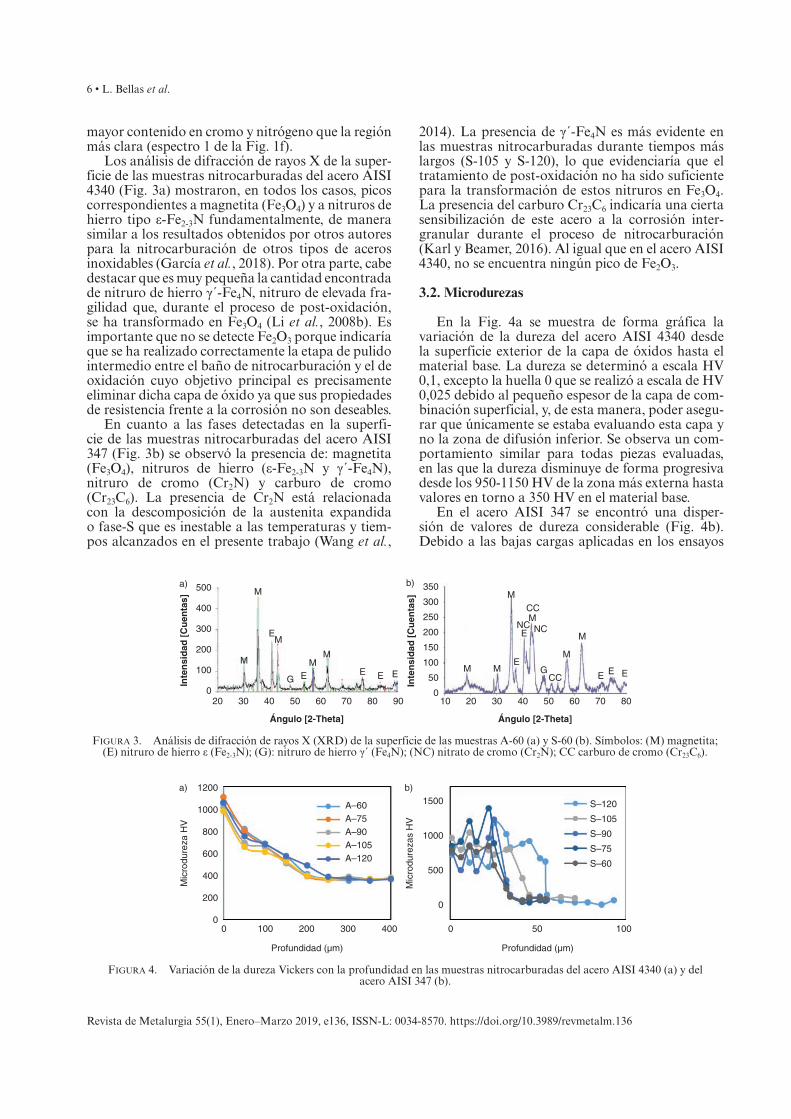
6 • L. Bellas et al.
Revista de Metalurgia 55(1), Enero–Marzo 2019, e136, ISSN-L: 0034-8570. https://doi.org/10.3989/revmetalm.136
mayor contenido en cromo y nitrógeno que la región más clara (espectro 1 de la Fig. 1f).
Los análisis de difracción de rayos X de la super-ficie de las muestras nitrocarburadas del acero AISI 4340 (Fig. 3a) mostraron, en todos los casos, picos correspondientes a magnetita (Fe3O4) y a nitruros de hierro tipo ε-Fe2-3N fundamentalmente, de manera similar a los resultados obtenidos por otros autores para la nitrocarburación de otros tipos de aceros inoxidables (García et al., 2018). Por otra parte, cabe destacar que es muy pequeña la cantidad encontrada de nitruro de hierro γ´-Fe4N, nitruro de elevada fra-gilidad que, durante el proceso de post-oxidación, se ha transformado en Fe3O4 (Li et al., 2008b). Es importante que no se detecte Fe2O3 porque indicaría que se ha realizado correctamente la etapa de pulido intermedio entre el baño de nitrocarburación y el de oxidación cuyo objetivo principal es precisamente eliminar dicha capa de óxido ya que sus propiedades de resistencia frente a la corrosión no son deseables.
En cuanto a las fases detectadas en la superfi-cie de las muestras nitrocarburadas del acero AISI 347 (Fig. 3b) se observó la presencia de: magnetita (Fe3O4), nitruros de hierro (ε-Fe2-3N y γ´-Fe4N), nitruro de cromo (Cr2N) y carburo de cromo (Cr23C6). La presencia de Cr2N está relacionada con la descomposición de la austenita expandida o fase-S que es inestable a las temperaturas y tiem-pos alcanzados en el presente trabajo (Wang et al.,
2014). La presencia de γ´-Fe4N es más evidente en las muestras nitrocarburadas durante tiempos más largos (S-105 y S-120), lo que evidenciaría que el tratamiento de post-oxidación no ha sido suficiente para la transformación de estos nitruros en Fe3O4. La presencia del carburo Cr23C6 indicaría una cierta sensibilización de este acero a la corrosión inter-granular durante el proceso de nitrocarburación (Karl y Beamer, 2016). Al igual que en el acero AISI 4340, no se encuentra ningún pico de Fe2O3.
3.2. Microdurezas
En la Fig. 4a se muestra de forma gráfica la variación de la dureza del acero AISI 4340 desde la superficie exterior de la capa de óxidos hasta el material base. La dureza se determinó a escala HV 0,1, excepto la huella 0 que se realizó a escala de HV 0,025 debido al pequeño espesor de la capa de com-binación superficial, y, de esta manera, poder asegu-rar que únicamente se estaba evaluando esta capa y no la zona de difusión inferior. Se observa un com-portamiento similar para todas piezas evaluadas, en las que la dureza disminuye de forma progresiva desde los 950-1150 HV de la zona más externa hasta valores en torno a 350 HV en el material base.
En el acero AISI 347 se encontró una disper-sión de valores de dureza considerable (Fig. 4b). Debido a las bajas cargas aplicadas en los ensayos
0 0
50
100
150
200
250
300
350a)
100
20 30
M
M
MM
M M
M
M
Mb)
M
M
E
E E E EE
G
E
E E E
NC NC
CC
CCG
40 50
Ángulo [2-Theta]
Inte
nsi
dad
[C
uen
tas]
Inte
nsi
dad
[C
uen
tas]
Ángulo [2-Theta]
60 70 80 90 2010 30 40 50 60 70 80
200
300
400
500
Figura 3. Análisis de difracción de rayos X (XRD) de la superficie de las muestras A-60 (a) y S-60 (b). Símbolos: (M) magnetita; (E) nitruro de hierro ε (Fe2-3N); (G): nitruro de hierro γ´ (Fe4N); (NC) nitrato de cromo (Cr2N); CC carburo de cromo (Cr23C6).
Figura 4. Variación de la dureza Vickers con la profundidad en las muestras nitrocarburadas del acero AISI 4340 (a) y del acero AISI 347 (b).
1200a) b)
A–60A–75A–90A–105A–120
1000
800
600
400
200
00 100 200
Profundidad (µm)
Mic
rodu
reza
HV
300 400
S–120
S–105
S–90
S–75
S–60
0
0
500
1000
1500
50 100
Profundidad (µm)
Mic
rodu
reza
s H
V
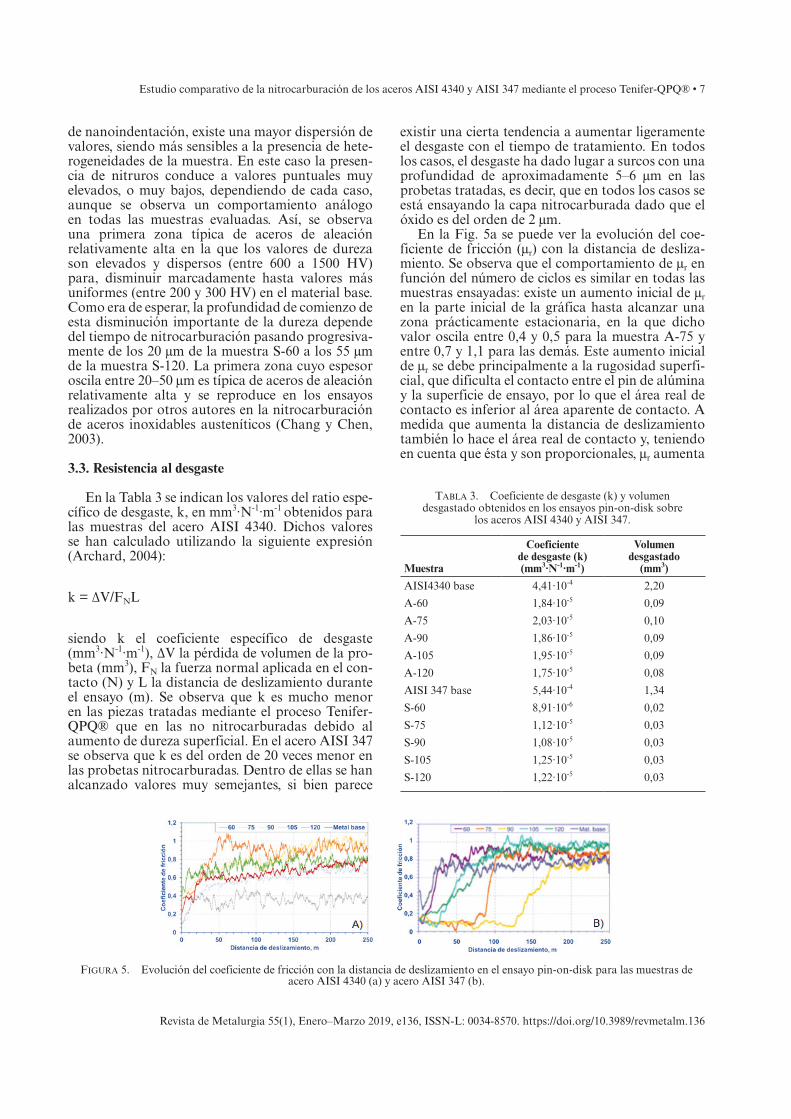
Estudio comparativo de la nitrocarburación de los aceros AISI 4340 y AISI 347 mediante el proceso Tenifer-QPQ® • 7
Revista de Metalurgia 55(1), Enero–Marzo 2019, e136, ISSN-L: 0034-8570. https://doi.org/10.3989/revmetalm.136
de nanoindentación, existe una mayor dispersión de valores, siendo más sensibles a la presencia de hete-rogeneidades de la muestra. En este caso la presen-cia de nitruros conduce a valores puntuales muy elevados, o muy bajos, dependiendo de cada caso, aunque se observa un comportamiento análogo en todas las muestras evaluadas. Así, se observa una primera zona típica de aceros de aleación relativamente alta en la que los valores de dureza son elevados y dispersos (entre 600 a 1500 HV) para, disminuir marcadamente hasta valores más uniformes (entre 200 y 300 HV) en el material base. Como era de esperar, la profundidad de comienzo de esta disminución importante de la dureza depende del tiempo de nitrocarburación pasando progresiva-mente de los 20 µm de la muestra S-60 a los 55 µm de la muestra S-120. La primera zona cuyo espesor oscila entre 20–50 µm es típica de aceros de aleación relativamente alta y se reproduce en los ensayos realizados por otros autores en la nitrocarburación de aceros inoxidables austeníticos (Chang y Chen, 2003).
3.3. Resistencia al desgaste
En la Tabla 3 se indican los valores del ratio espe-cífico de desgaste, k, en mm3·N-1·m-1 obtenidos para las muestras del acero AISI 4340. Dichos valores se han calculado utilizando la siguiente expresión (Archard, 2004):
k = ΔV/FNL
siendo k el coeficiente específico de desgaste (mm3·N-1·m-1), ΔV la pérdida de volumen de la pro-beta (mm3), FN la fuerza normal aplicada en el con-tacto (N) y L la distancia de deslizamiento durante el ensayo (m). Se observa que k es mucho menor en las piezas tratadas mediante el proceso Tenifer-QPQ® que en las no nitrocarburadas debido al aumento de dureza superficial. En el acero AISI 347 se observa que k es del orden de 20 veces menor en las probetas nitrocarburadas. Dentro de ellas se han alcanzado valores muy semejantes, si bien parece
existir una cierta tendencia a aumentar ligeramente el desgaste con el tiempo de tratamiento. En todos los casos, el desgaste ha dado lugar a surcos con una profundidad de aproximadamente 5–6 µm en las probetas tratadas, es decir, que en todos los casos se está ensayando la capa nitrocarburada dado que el óxido es del orden de 2 µm.
En la Fig. 5a se puede ver la evolución del coe-ficiente de fricción (µr) con la distancia de desliza-miento. Se observa que el comportamiento de µr en función del número de ciclos es similar en todas las muestras ensayadas: existe un aumento inicial de µr en la parte inicial de la gráfica hasta alcanzar una zona prácticamente estacionaria, en la que dicho valor oscila entre 0,4 y 0,5 para la muestra A-75 y entre 0,7 y 1,1 para las demás. Este aumento inicial de µr se debe principalmente a la rugosidad superfi-cial, que dificulta el contacto entre el pin de alúmina y la superficie de ensayo, por lo que el área real de contacto es inferior al área aparente de contacto. A medida que aumenta la distancia de deslizamiento también lo hace el área real de contacto y, teniendo en cuenta que ésta y son proporcionales, µr aumenta
Tabla 3. Coeficiente de desgaste (k) y volumen desgastado obtenidos en los ensayos pin-on-disk sobre
los aceros AISI 4340 y AISI 347.
Muestra
Coeficiente de desgaste (k)(mm3·N-1·m-1)
Volumen desgastado
(mm3)
aiSi4340 base 4,41·10-4 2,20
a-60 1,84·10-5 0,09
a-75 2,03·10-5 0,10
a-90 1,86·10-5 0,09
a-105 1,95·10-5 0,09
a-120 1,75·10-5 0,08
aiSi 347 base 5,44·10-4 1,34
S-60 8,91·10-6 0,02
S-75 1,12·10-5 0,03
S-90 1,08·10-5 0,03
S-105 1,25·10-5 0,03
S-120 1,22·10-5 0,03
Figura 5. Evolución del coeficiente de fricción con la distancia de deslizamiento en el ensayo pin-on-disk para las muestras de acero AISI 4340 (a) y acero AISI 347 (b).
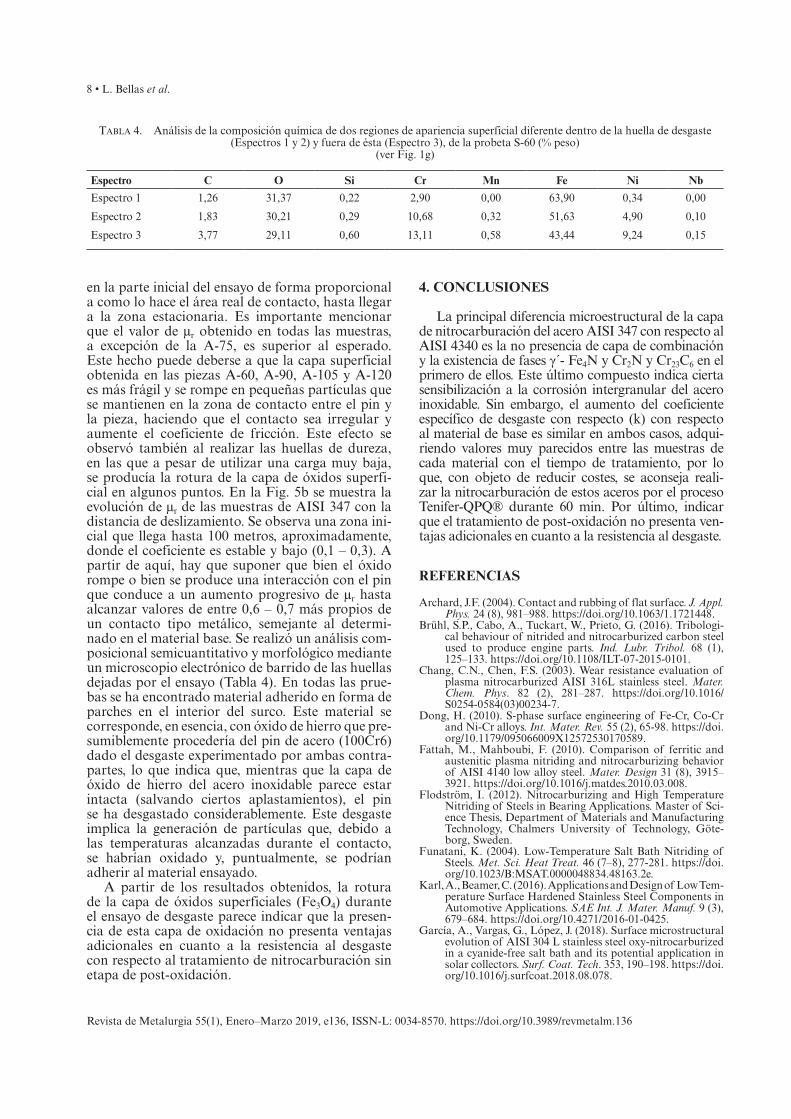
8 • L. Bellas et al.
Revista de Metalurgia 55(1), Enero–Marzo 2019, e136, ISSN-L: 0034-8570. https://doi.org/10.3989/revmetalm.136
en la parte inicial del ensayo de forma proporcional a como lo hace el área real de contacto, hasta llegar a la zona estacionaria. Es importante mencionar que el valor de µr obtenido en todas las muestras, a excepción de la A-75, es superior al esperado. Este hecho puede deberse a que la capa superficial obtenida en las piezas A-60, A-90, A-105 y A-120 es más frágil y se rompe en pequeñas partículas que se mantienen en la zona de contacto entre el pin y la pieza, haciendo que el contacto sea irregular y aumente el coeficiente de fricción. Este efecto se observó también al realizar las huellas de dureza, en las que a pesar de utilizar una carga muy baja, se producía la rotura de la capa de óxidos superfi-cial en algunos puntos. En la Fig. 5b se muestra la evolución de µr de las muestras de AISI 347 con la distancia de deslizamiento. Se observa una zona ini-cial que llega hasta 100 metros, aproximadamente, donde el coeficiente es estable y bajo (0,1 – 0,3). A partir de aquí, hay que suponer que bien el óxido rompe o bien se produce una interacción con el pin que conduce a un aumento progresivo de µr hasta alcanzar valores de entre 0,6 – 0,7 más propios de un contacto tipo metálico, semejante al determi-nado en el material base. Se realizó un análisis com-posicional semicuantitativo y morfológico mediante un microscopio electrónico de barrido de las huellas dejadas por el ensayo (Tabla 4). En todas las prue-bas se ha encontrado material adherido en forma de parches en el interior del surco. Este material se corres ponde, en esencia, con óxido de hierro que pre-sumiblemente procedería del pin de acero (100Cr6) dado el desgaste experimentado por ambas contra-partes, lo que indica que, mientras que la capa de óxido de hierro del acero inoxidable parece estar intacta (salvando ciertos aplastamientos), el pin se ha desgastado considerablemente. Este desgaste implica la generación de partículas que, debido a las temperaturas alcanzadas durante el contacto, se habrían oxidado y, puntualmente, se podrían adherir al material ensayado.
A partir de los resultados obtenidos, la rotura de la capa de óxidos superficiales (Fe3O4) durante el ensayo de desgaste parece indicar que la presen-cia de esta capa de oxidación no presenta ventajas adicionales en cuanto a la resistencia al desgaste con respecto al tratamiento de nitrocarburación sin etapa de post-oxidación.
4. CONCLUSIONES
La principal diferencia microestructural de la capa de nitrocarburación del acero AISI 347 con respecto al AISI 4340 es la no presencia de capa de combinación y la existencia de fases γ´- Fe4N y Cr2N y Cr23C6 en el primero de ellos. Este último compuesto indica cierta sensibilización a la corrosión intergranular del acero inoxidable. Sin embargo, el aumento del coeficiente específico de desgaste con respecto (k) con respecto al material de base es similar en ambos casos, adqui-riendo valores muy parecidos entre las muestras de cada material con el tiempo de tratamiento, por lo que, con objeto de reducir costes, se aconseja reali-zar la nitrocarburación de estos aceros por el proceso Tenifer-QPQ® durante 60 min. Por último, indicar que el tratamiento de post-oxidación no presenta ven-tajas adicionales en cuanto a la resistencia al desgaste.
REFERENCIAS
Archard, J.F. (2004). Contact and rubbing of flat surface. J. Appl. Phys. 24 (8), 981–988. https://doi.org/10.1063/1.1721448.
Brühl, S.P., Cabo, A., Tuckart, W., Prieto, G. (2016). Tribologi-cal behaviour of nitrided and nitrocarburized carbon steel used to produce engine parts. Ind. Lubr. Tribol. 68 (1), 125–133. https://doi.org/10.1108/ILT-07-2015-0101.
Chang, C.N., Chen, F.S. (2003). Wear resistance evaluation of plasma nitrocarburized AISI 316L stainless steel. Mater. Chem. Phys. 82 (2), 281–287. https://doi.org/10.1016/S0254-0584(03)00234-7.
Dong, H. (2010). S-phase surface engineering of Fe-Cr, Co-Cr and Ni-Cr alloys. Int. Mater. Rev. 55 (2), 65-98. https://doi.org/10.1179/095066009X12572530170589.
Fattah, M., Mahboubi, F. (2010). Comparison of ferritic and austenitic plasma nitriding and nitrocarburizing behavior of AISI 4140 low alloy steel. Mater. Design 31 (8), 3915–3921. https://doi.org/10.1016/j.matdes.2010.03.008.
Flodström, I. (2012). Nitrocarburizing and High Temperature Nitriding of Steels in Bearing Applications. Master of Sci-ence Thesis, Department of Materials and Manufacturing Technology, Chalmers University of Technology, Göte-borg, Sweden.
Funatani, K. (2004). Low-Temperature Salt Bath Nitriding of Steels. Met. Sci. Heat Treat. 46 (7–8), 277-281. https://doi.org/10.1023/B:MSAT.0000048834.48163.2e.
Karl, A., Beamer, C. (2016). Applications and Design of Low Tem-perature Surface Hardened Stainless Steel Components in Automotive Applications. SAE Int. J. Mater. Manuf. 9 (3), 679–684. https://doi.org/10.4271/2016-01-0425.
García, A., Vargas, G., López, J. (2018). Surface microstructural evolution of AISI 304 L stainless steel oxy-nitrocarburized in a cyanide-free salt bath and its potential application in solar collectors. Surf. Coat. Tech. 353, 190–198. https://doi.org/10.1016/j.surfcoat.2018.08.078.
Tabla 4. Análisis de la composición química de dos regiones de apariencia superficial diferente dentro de la huella de desgaste (Espectros 1 y 2) y fuera de ésta (Espectro 3), de la probeta S-60 (% peso)
(ver Fig. 1g)
Espectro C O Si Cr Mn Fe Ni Nb
Espectro 1 1,26 31,37 0,22 2,90 0,00 63,90 0,34 0,00
Espectro 2 1,83 30,21 0,29 10,68 0,32 51,63 4,90 0,10
Espectro 3 3,77 29,11 0,60 13,11 0,58 43,44 9,24 0,15
Estudio comparativo de la nitrocarburación de los aceros AISI 4340 y AISI 347 mediante el proceso Tenifer-QPQ® • 9
Revista de Metalurgia 55(1), Enero–Marzo 2019, e136, ISSN-L: 0034-8570. https://doi.org/10.3989/revmetalm.136
Li, G., Peng, Q., Li, C., Wang, Y., Gao, J., Chen, S., Wang, J., Shen, B. (2008a). Microstructure analysis of 304L aus-tenitic stainless steel by QPQ complex salt bath treat-ment. Mater. Charact. 59 (9), 1359–1363. https://doi.org/10.1016/j.matchar.2007.09.011.
Li, G., Wang, J., Peng, Q., Li, C., Wang, Y., Shen, B. (2008b). Influence of salt bath nitrocarburizing and post-oxidation process on surface microstructure evolution of 17-4PH stainless steel. J. Mater. Process. Tech. 207, 187–192. https://doi.org/10.1016/j.jmatprotec.2007.12.082.
Marušić, K., Otmačić, H., Landek, D., Cajner, F., Stupnišek-Lisac, E. (2006). Modification of carbon steel surface by the Tenifer® process of nitrocarburizing and post-oxi-dation. Surf. Coat. Tech. 201 (6), 3415–3421. https://doi.org/10.1016/j.surfcoat.2006.07.231.
Mittemeijer, E.J. (2013). Fundamentals of Nitriding and Nitro-carburizing. In Steel Heat Treating Fundamentals and
Processe. Dossett, J. and Totten, G.E (Editors), Volume 4A, ASM Handbook, ASM International, Materials Park (Ohio), pp. 619–646.
Schneider, R.S.E. (2014). Austenitic nitriding and nitrocarbu-rizing of steels. In Thermochemical Surface Engineering of Steels: Improving Materials Performance. Mittemei-jer, E.J., Somers, M.A.J (Eds.), Elsevier, Amsterdam, pp. 373-400.
Wang, J., Lin, Y., Zhang, Q, Zeng, D., Fan, H. (2014). Effect of treatment time on the microstructure of austenitic stain-less steel during low-temperature liquid nitrocarburizing. Metall. Mater. Trans. A 45 (10), 4525–4534. https://doi.org/10.1007/s11661-014-2418-7.
Wu, D., Ge, Y., Kahn, H., Ernst, F., Heuer, A.H. (2015). Diffu-sion profiles after nitrocarburizing austenitic stainless steel. Surf. Coat. Tech. 279, 180–185. https://doi.org/10.1016/j.surfcoat.2015.08.048.
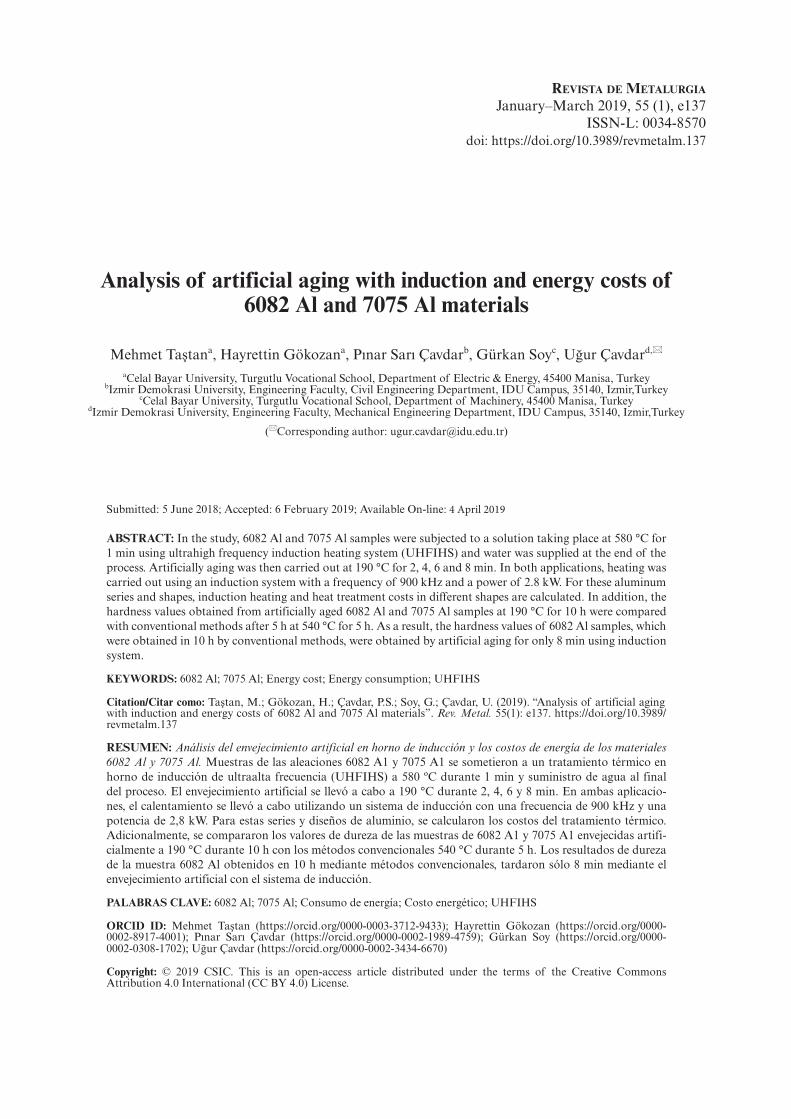
Revista de MetaluRgia January–March 2019, 55 (1), e137
ISSN-L: 0034-8570doi: https://doi.org/10.3989/revmetalm.137
Analysis of artificial aging with induction and energy costs of 6082 Al and 7075 Al materials
Mehmet Taştana, Hayrettin Gökozana, Pınar Sarı Çavdarb, Gürkan Soyc, Uğur Çavdard,*
aCelal Bayar University, Turgutlu Vocational School, Department of Electric & Energy, 45400 Manisa, TurkeybIzmir Demokrasi University, Engineering Faculty, Civil Engineering Department, IDU Campus, 35140, Izmir,Turkey
cCelal Bayar University, Turgutlu Vocational School, Department of Machinery, 45400 Manisa, TurkeydIzmir Demokrasi University, Engineering Faculty, Mechanical Engineering Department, IDU Campus, 35140, Izmir,Turkey
(*Corresponding author: [email protected])
Submitted: 5 June 2018; Accepted: 6 February 2019; Available On-line: 4 April 2019
ABSTRACT: In the study, 6082 Al and 7075 Al samples were subjected to a solution taking place at 580 °C for 1 min using ultrahigh frequency induction heating system (UHFIHS) and water was supplied at the end of the process. Artificially aging was then carried out at 190 °C for 2, 4, 6 and 8 min. In both applications, heating was carried out using an induction system with a frequency of 900 kHz and a power of 2.8 kW. For these aluminum series and shapes, induction heating and heat treatment costs in different shapes are calculated. In addition, the hardness values obtained from artificially aged 6082 Al and 7075 Al samples at 190 °C for 10 h were compared with conventional methods after 5 h at 540 °C for 5 h. As a result, the hardness values of 6082 Al samples, which were obtained in 10 h by conventional methods, were obtained by artificial aging for only 8 min using induction system.
KEYWORDS: 6082 Al; 7075 Al; Energy cost; Energy consumption; UHFIHS
Citation/Citar como: Taştan, M.; Gökozan, H.; Çavdar, P.S.; Soy, G.; Çavdar, U. (2019). “Analysis of artificial aging with induction and energy costs of 6082 Al and 7075 Al materials”. Rev. Metal. 55(1): e137. https://doi.org/10.3989/revmetalm.137
RESUMEN: Análisis del envejecimiento artificial en horno de inducción y los costos de energía de los materiales 6082 Al y 7075 Al. Muestras de las aleaciones 6082 A1 y 7075 A1 se sometieron a un tratamiento térmico en horno de inducción de ultraalta frecuencia (UHFIHS) a 580 ºC durante 1 min y suministro de agua al final del proceso. El envejecimiento artificial se llevó a cabo a 190 °C durante 2, 4, 6 y 8 min. En ambas aplicacio-nes, el calentamiento se llevó a cabo utilizando un sistema de inducción con una frecuencia de 900 kHz y una potencia de 2,8 kW. Para estas series y diseños de aluminio, se calcularon los costos del tratamiento térmico. Adicionalmente, se compararon los valores de dureza de las muestras de 6082 A1 y 7075 A1 envejecidas artifi-cialmente a 190 °C durante 10 h con los métodos convencionales 540 °C durante 5 h. Los resultados de dureza de la muestra 6082 Al obtenidos en 10 h mediante métodos convencionales, tardaron sólo 8 min mediante el envejecimiento artificial con el sistema de inducción.
PALABRAS CLAVE: 6082 Al; 7075 Al; Consumo de energía; Costo energético; UHFIHS
ORCID ID: Mehmet Taştan (https://orcid.org/0000-0003-3712-9433); Hayrettin Gökozan (https://orcid.org/0000-0002-8917-4001); Pınar Sarı Çavdar (https://orcid.org/0000-0002-1989-4759); Gürkan Soy (https://orcid.org/0000-0002-0308-1702); Uğur Çavdar (https://orcid.org/0000-0002-3434-6670)
Copyright: © 2019 CSIC. This is an open-access article distributed under the terms of the Creative Commons Attribution 4.0 International (CC BY 4.0) License.
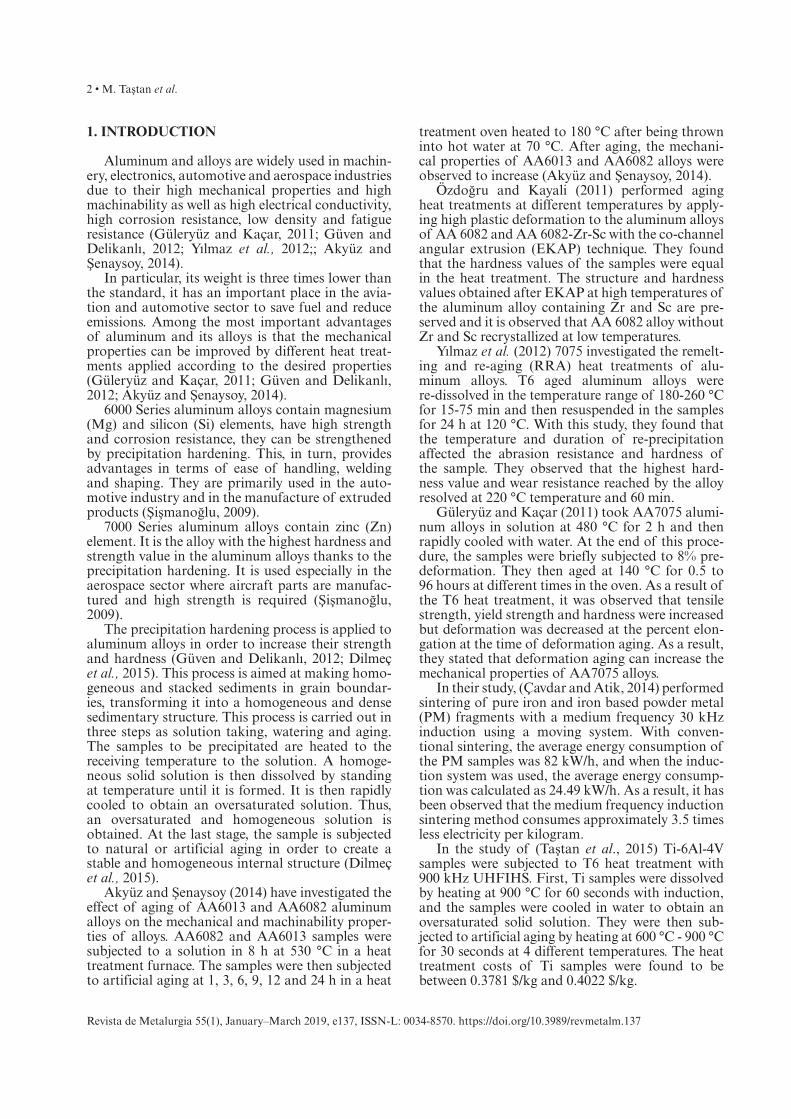
2 • M. Taştan et al.
Revista de Metalurgia 55(1), January–March 2019, e137, ISSN-L: 0034-8570. https://doi.org/10.3989/revmetalm.137
1. INTRODUCTION
Aluminum and alloys are widely used in machin-ery, electronics, automotive and aerospace industries due to their high mechanical properties and high machinability as well as high electrical conductivity, high corrosion resistance, low density and fatigue resistance (Güleryüz and Kaçar, 2011; Güven and Delikanlı, 2012; Yılmaz et al., 2012;; Akyüz and Şenaysoy, 2014).
In particular, its weight is three times lower than the standard, it has an important place in the avia-tion and automotive sector to save fuel and reduce emissions. Among the most important advantages of aluminum and its alloys is that the mechanical properties can be improved by different heat treat-ments applied according to the desired properties (Güleryüz and Kaçar, 2011; Güven and Delikanlı, 2012; Akyüz and Şenaysoy, 2014).
6000 Series aluminum alloys contain magnesium (Mg) and silicon (Si) elements, have high strength and corrosion resistance, they can be strengthened by precipitation hardening. This, in turn, provides advantages in terms of ease of handling, welding and shaping. They are primarily used in the auto-motive industry and in the manufacture of extruded products (Şişmanoğlu, 2009).
7000 Series aluminum alloys contain zinc (Zn) element. It is the alloy with the highest hardness and strength value in the aluminum alloys thanks to the precipitation hardening. It is used especially in the aerospace sector where aircraft parts are manufac-tured and high strength is required (Şişmanoğlu, 2009).
The precipitation hardening process is applied to aluminum alloys in order to increase their strength and hardness (Güven and Delikanlı, 2012; Dilmeç et al., 2015). This process is aimed at making homo-geneous and stacked sediments in grain boundar-ies, transforming it into a homogeneous and dense sedimentary structure. This process is carried out in three steps as solution taking, watering and aging. The samples to be precipitated are heated to the receiving temperature to the solution. A homoge-neous solid solution is then dissolved by standing at temperature until it is formed. It is then rapidly cooled to obtain an oversaturated solution. Thus, an oversaturated and homogeneous solution is obtained. At the last stage, the sample is subjected to natural or artificial aging in order to create a stable and homogeneous internal structure (Dilmeç et al., 2015).
Akyüz and Şenaysoy (2014) have investigated the effect of aging of AA6013 and AA6082 aluminum alloys on the mechanical and machinability proper-ties of alloys. AA6082 and AA6013 samples were subjected to a solution in 8 h at 530 °C in a heat treatment furnace. The samples were then subjected to artificial aging at 1, 3, 6, 9, 12 and 24 h in a heat
treatment oven heated to 180 °C after being thrown into hot water at 70 °C. After aging, the mechani-cal properties of AA6013 and AA6082 alloys were observed to increase (Akyüz and Şenaysoy, 2014).
Özdoğru and Kayali (2011) performed aging heat treatments at different temperatures by apply-ing high plastic deformation to the aluminum alloys of AA 6082 and AA 6082-Zr-Sc with the co-channel angular extrusion (EKAP) technique. They found that the hardness values of the samples were equal in the heat treatment. The structure and hardness values obtained after EKAP at high temperatures of the aluminum alloy containing Zr and Sc are pre-served and it is observed that AA 6082 alloy without Zr and Sc recrystallized at low temperatures.
Yılmaz et al. (2012) 7075 investigated the remelt-ing and re-aging (RRA) heat treatments of alu-minum alloys. T6 aged aluminum alloys were re-dissolved in the temperature range of 180-260 °C for 15-75 min and then resuspended in the samples for 24 h at 120 °C. With this study, they found that the temperature and duration of re-precipitation affected the abrasion resistance and hardness of the sample. They observed that the highest hard-ness value and wear resistance reached by the alloy resolved at 220 °C temperature and 60 min.
Güleryüz and Kaçar (2011) took AA7075 alumi-num alloys in solution at 480 °C for 2 h and then rapidly cooled with water. At the end of this proce-dure, the samples were briefly subjected to 8% pre-deformation. They then aged at 140 °C for 0.5 to 96 hours at different times in the oven. As a result of the T6 heat treatment, it was observed that tensile strength, yield strength and hardness were increased but deformation was decreased at the percent elon-gation at the time of deformation aging. As a result, they stated that deformation aging can increase the mechanical properties of AA7075 alloys.
In their study, (Çavdar and Atik, 2014) performed sintering of pure iron and iron based powder metal (PM) fragments with a medium frequency 30 kHz induction using a moving system. With conven-tional sintering, the average energy consumption of the PM samples was 82 kW/h, and when the induc-tion system was used, the average energy consump-tion was calculated as 24.49 kW/h. As a result, it has been observed that the medium frequency induction sintering method consumes approximately 3.5 times less electricity per kilogram.
In the study of (Taştan et al., 2015) Ti-6Al-4V samples were subjected to T6 heat treatment with 900 kHz UHFIHS. First, Ti samples were dissolved by heating at 900 °C for 60 seconds with induction, and the samples were cooled in water to obtain an oversaturated solid solution. They were then sub-jected to artificial aging by heating at 600 °C - 900 °C for 30 seconds at 4 different temperatures. The heat treatment costs of Ti samples were found to be between 0.3781 $/kg and 0.4022 $/kg.
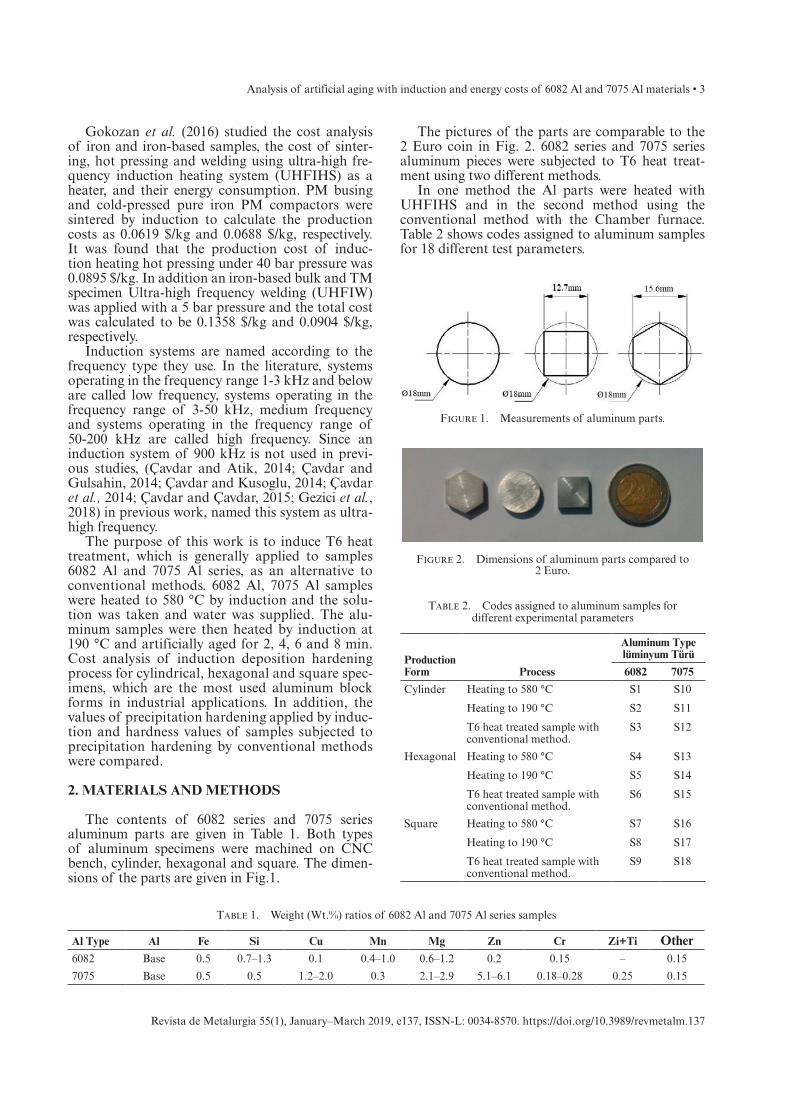
Analysis of artificial aging with induction and energy costs of 6082 Al and 7075 Al materials • 3
Revista de Metalurgia 55(1), January–March 2019, e137, ISSN-L: 0034-8570. https://doi.org/10.3989/revmetalm.137
Gokozan et al. (2016) studied the cost analysis of iron and iron-based samples, the cost of sinter-ing, hot pressing and welding using ultra-high fre-quency induction heating system (UHFIHS) as a heater, and their energy consumption. PM busing and cold-pressed pure iron PM compactors were sintered by induction to calculate the production costs as 0.0619 $/kg and 0.0688 $/kg, respectively. It was found that the production cost of induc-tion heating hot pressing under 40 bar pressure was 0.0895 $/kg. In addition an iron-based bulk and TM specimen Ultra-high frequency welding (UHFIW) was applied with a 5 bar pressure and the total cost was calculated to be 0.1358 $/kg and 0.0904 $/kg, respectively.
Induction systems are named according to the frequency type they use. In the literature, systems operating in the frequency range 1-3 kHz and below are called low frequency, systems operating in the frequency range of 3-50 kHz, medium frequency and systems operating in the frequency range of 50-200 kHz are called high frequency. Since an induction system of 900 kHz is not used in previ-ous studies, (Çavdar and Atik, 2014; Çavdar and Gulsahin, 2014; Çavdar and Kusoglu, 2014; Çavdar et al., 2014; Çavdar and Çavdar, 2015; Gezici et al., 2018) in previous work, named this system as ultra-high frequency.
The purpose of this work is to induce T6 heat treatment, which is generally applied to samples 6082 Al and 7075 Al series, as an alternative to conventional methods. 6082 Al, 7075 Al samples were heated to 580 °C by induction and the solu-tion was taken and water was supplied. The alu-minum samples were then heated by induction at 190 °C and artificially aged for 2, 4, 6 and 8 min. Cost analysis of induction deposition hardening process for cylindrical, hexagonal and square spec-imens, which are the most used aluminum block forms in industrial applications. In addition, the values of precipitation hardening applied by induc-tion and hardness values of samples subjected to precipitation hardening by conventional methods were compared.
2. MATERIALS AND METHODS
The contents of 6082 series and 7075 series aluminum parts are given in Table 1. Both types of aluminum specimens were machined on CNC bench, cylinder, hexagonal and square. The dimen-sions of the parts are given in Fig.1.
The pictures of the parts are comparable to the 2 Euro coin in Fig. 2. 6082 series and 7075 series aluminum pieces were subjected to T6 heat treat-ment using two different methods.
In one method the Al parts were heated with UHFIHS and in the second method using the conventional method with the Chamber furnace. Table 2 shows codes assigned to aluminum samples for 18 different test parameters.
Table 1. Weight (Wt.%) ratios of 6082 Al and 7075 Al series samples
Al Type Al Fe Si Cu Mn Mg Zn Cr Zi+Ti Other6082 Base 0.5 0.7–1.3 0.1 0.4–1.0 0.6–1.2 0.2 0.15 – 0.15
7075 Base 0.5 0.5 1.2–2.0 0.3 2.1–2.9 5.1–6.1 0.18–0.28 0.25 0.15
Figure 1. Measurements of aluminum parts.
Figure 2. Dimensions of aluminum parts compared to 2 Euro.
Table 2. Codes assigned to aluminum samples for different experimental parameters
Production Form Process
Aluminum Type lüminyum Türü
6082 7075
Cylinder Heating to 580 °C S1 S10
Heating to 190 °C S2 S11
T6 heat treated sample with conventional method.
S3 S12
Hexagonal Heating to 580 °C S4 S13
Heating to 190 °C S5 S14
T6 heat treated sample with conventional method.
S6 S15
Square Heating to 580 °C S7 S16
Heating to 190 °C S8 S17
T6 heat treated sample with conventional method.
S9 S18
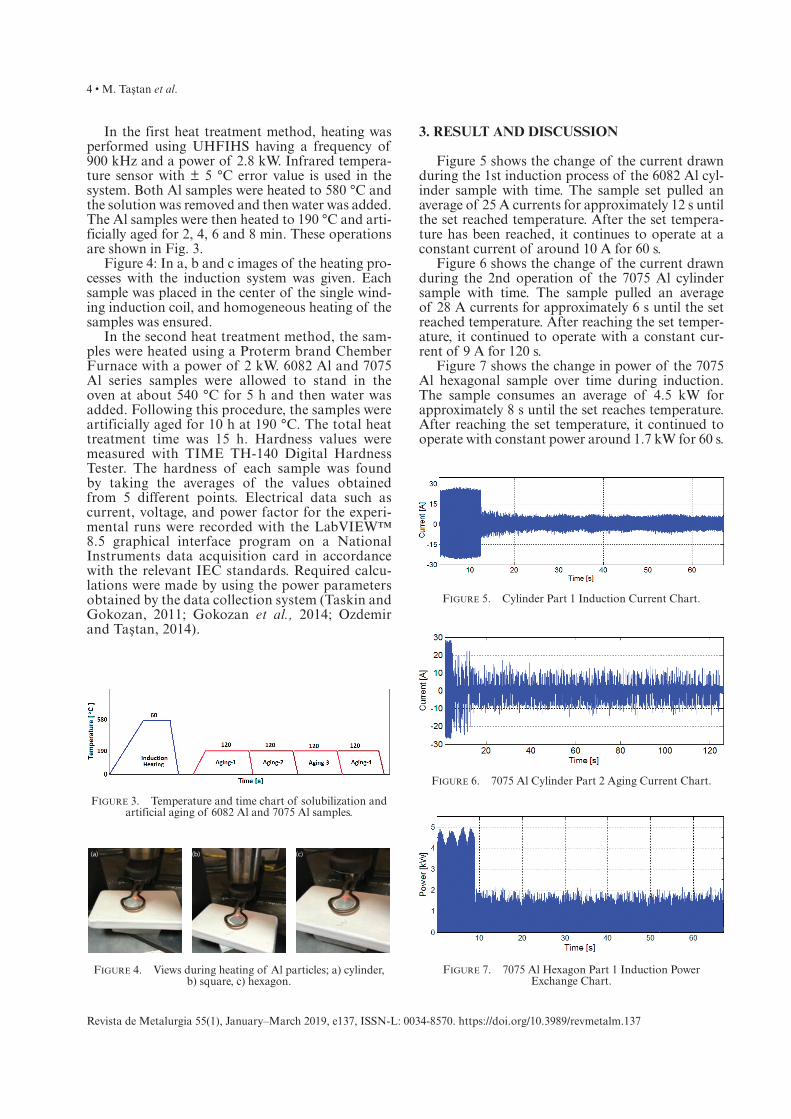
4 • M. Taştan et al.
Revista de Metalurgia 55(1), January–March 2019, e137, ISSN-L: 0034-8570. https://doi.org/10.3989/revmetalm.137
In the first heat treatment method, heating was performed using UHFIHS having a frequency of 900 kHz and a power of 2.8 kW. Infrared tempera-ture sensor with ± 5 °C error value is used in the system. Both Al samples were heated to 580 °C and the solution was removed and then water was added. The Al samples were then heated to 190 °C and arti-ficially aged for 2, 4, 6 and 8 min. These operations are shown in Fig. 3.
Figure 4: In a, b and c images of the heating pro-cesses with the induction system was given. Each sample was placed in the center of the single wind-ing induction coil, and homogeneous heating of the samples was ensured.
In the second heat treatment method, the sam-ples were heated using a Proterm brand Chember Furnace with a power of 2 kW. 6082 Al and 7075 Al series samples were allowed to stand in the oven at about 540 °C for 5 h and then water was added. Following this procedure, the samples were artificially aged for 10 h at 190 °C. The total heat treatment time was 15 h. Hardness values were measured with TIME TH-140 Digital Hardness Tester. The hardness of each sample was found by taking the averages of the values obtained from 5 different points. Electrical data such as current, voltage, and power factor for the experi-mental runs were recorded with the LabVIEW™
8.5 graphical interface program on a National Instruments data acquisition card in accordance with the relevant IEC standards. Required calcu-lations were made by using the power parameters obtained by the data collection system (Taskin and Gokozan, 2011; Gokozan et al., 2014; Ozdemir and Taştan, 2014).
3. RESULT AND DISCUSSION
Figure 5 shows the change of the current drawn during the 1st induction process of the 6082 Al cyl-inder sample with time. The sample set pulled an average of 25 A currents for approximately 12 s until the set reached temperature. After the set tempera-ture has been reached, it continues to operate at a constant current of around 10 A for 60 s.
Figure 6 shows the change of the current drawn during the 2nd operation of the 7075 Al cylinder sample with time. The sample pulled an average of 28 A currents for approximately 6 s until the set reached temperature. After reaching the set temper-ature, it continued to operate with a constant cur-rent of 9 A for 120 s.
Figure 7 shows the change in power of the 7075 Al hexagonal sample over time during induction. The sample consumes an average of 4.5 kW for approximately 8 s until the set reaches temperature. After reaching the set temperature, it continued to operate with constant power around 1.7 kW for 60 s.
Figure 3. Temperature and time chart of solubilization and artificial aging of 6082 Al and 7075 Al samples.
Figure 4. Views during heating of Al particles; a) cylinder, b) square, c) hexagon.
(a) (b) (c)
Figure 5. Cylinder Part 1 Induction Current Chart.
Figure 7. 7075 Al Hexagon Part 1 Induction Power Exchange Chart.
Figure 6. 7075 Al Cylinder Part 2 Aging Current Chart.
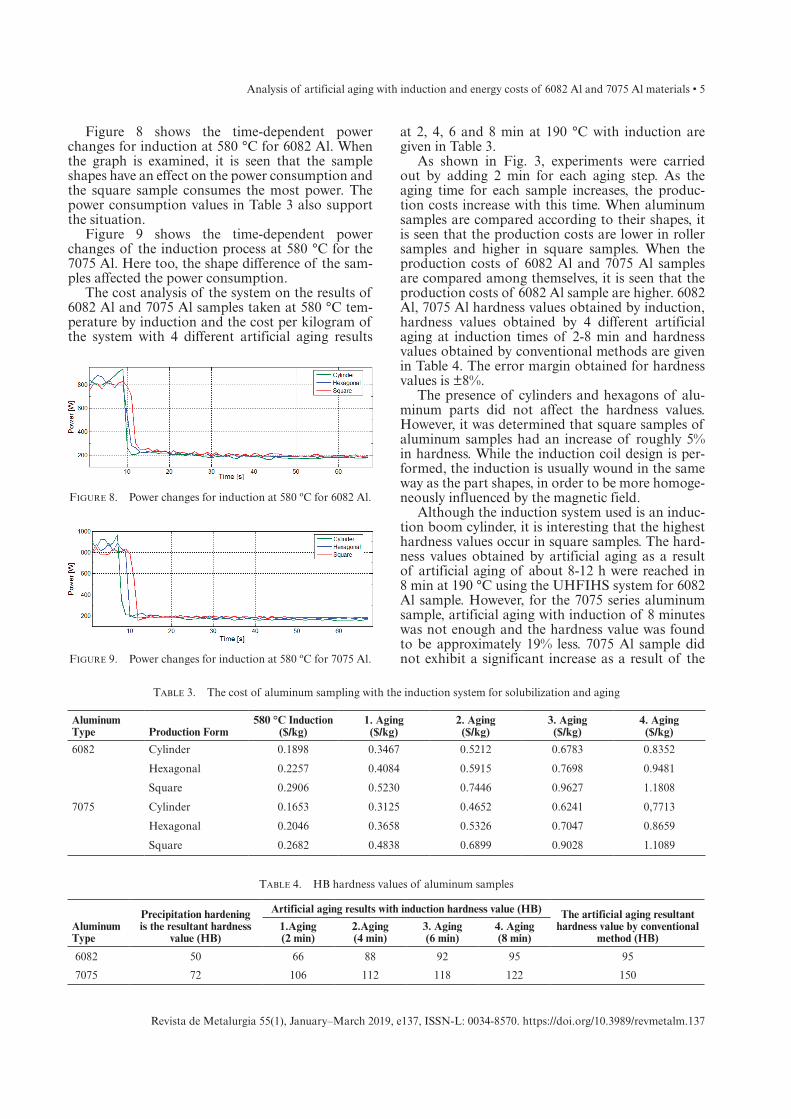
Analysis of artificial aging with induction and energy costs of 6082 Al and 7075 Al materials • 5
Revista de Metalurgia 55(1), January–March 2019, e137, ISSN-L: 0034-8570. https://doi.org/10.3989/revmetalm.137
Figure 8 shows the time-dependent power changes for induction at 580 °C for 6082 Al. When the graph is examined, it is seen that the sample shapes have an effect on the power consumption and the square sample consumes the most power. The power consumption values in Table 3 also support the situation.
Figure 9 shows the time-dependent power changes of the induction process at 580 °C for the 7075 Al. Here too, the shape difference of the sam-ples affected the power consumption.
The cost analysis of the system on the results of 6082 Al and 7075 Al samples taken at 580 °C tem-perature by induction and the cost per kilogram of the system with 4 different artificial aging results
at 2, 4, 6 and 8 min at 190 °C with induction are given in Table 3.
As shown in Fig. 3, experiments were carried out by adding 2 min for each aging step. As the aging time for each sample increases, the produc-tion costs increase with this time. When aluminum samples are compared according to their shapes, it is seen that the production costs are lower in roller samples and higher in square samples. When the production costs of 6082 Al and 7075 Al samples are compared among themselves, it is seen that the production costs of 6082 Al sample are higher. 6082 Al, 7075 Al hardness values obtained by induction, hardness values obtained by 4 different artificial aging at induction times of 2-8 min and hardness values obtained by conventional methods are given in Table 4. The error margin obtained for hardness values is ±8%.
The presence of cylinders and hexagons of alu-minum parts did not affect the hardness values. However, it was determined that square samples of aluminum samples had an increase of roughly 5% in hardness. While the induction coil design is per-formed, the induction is usually wound in the same way as the part shapes, in order to be more homoge-neously influenced by the magnetic field.
Although the induction system used is an induc-tion boom cylinder, it is interesting that the highest hardness values occur in square samples. The hard-ness values obtained by artificial aging as a result of artificial aging of about 8-12 h were reached in 8 min at 190 °C using the UHFIHS system for 6082 Al sample. However, for the 7075 series aluminum sample, artificial aging with induction of 8 minutes was not enough and the hardness value was found to be approximately 19% less. 7075 Al sample did not exhibit a significant increase as a result of the
Figure 8. Power changes for induction at 580 ºC for 6082 Al.
Figure 9. Power changes for induction at 580 ºC for 7075 Al.
Table 3. The cost of aluminum sampling with the induction system for solubilization and aging
Aluminum Type Production Form
580 °C Induction ($/kg)
1. Aging ($/kg)
2. Aging($/kg)
3. Aging($/kg)
4. Aging($/kg)
6082 Cylinder 0.1898 0.3467 0.5212 0.6783 0.8352
Hexagonal 0.2257 0.4084 0.5915 0.7698 0.9481
Square 0.2906 0.5230 0.7446 0.9627 1.1808
7075 Cylinder 0.1653 0.3125 0.4652 0.6241 0,7713
Hexagonal 0.2046 0.3658 0.5326 0.7047 0.8659
Square 0.2682 0.4838 0.6899 0.9028 1.1089
Table 4. HB hardness values of aluminum samples
Aluminum Type
Precipitation hardening is the resultant hardness
value (HB)
Artificial aging results with induction hardness value (HB) The artificial aging resultant hardness value by conventional
method (HB)1.Aging(2 min)
2.Aging(4 min)
3. Aging(6 min)
4. Aging(8 min)
6082 50 66 88 92 95 95
7075 72 106 112 118 122 150
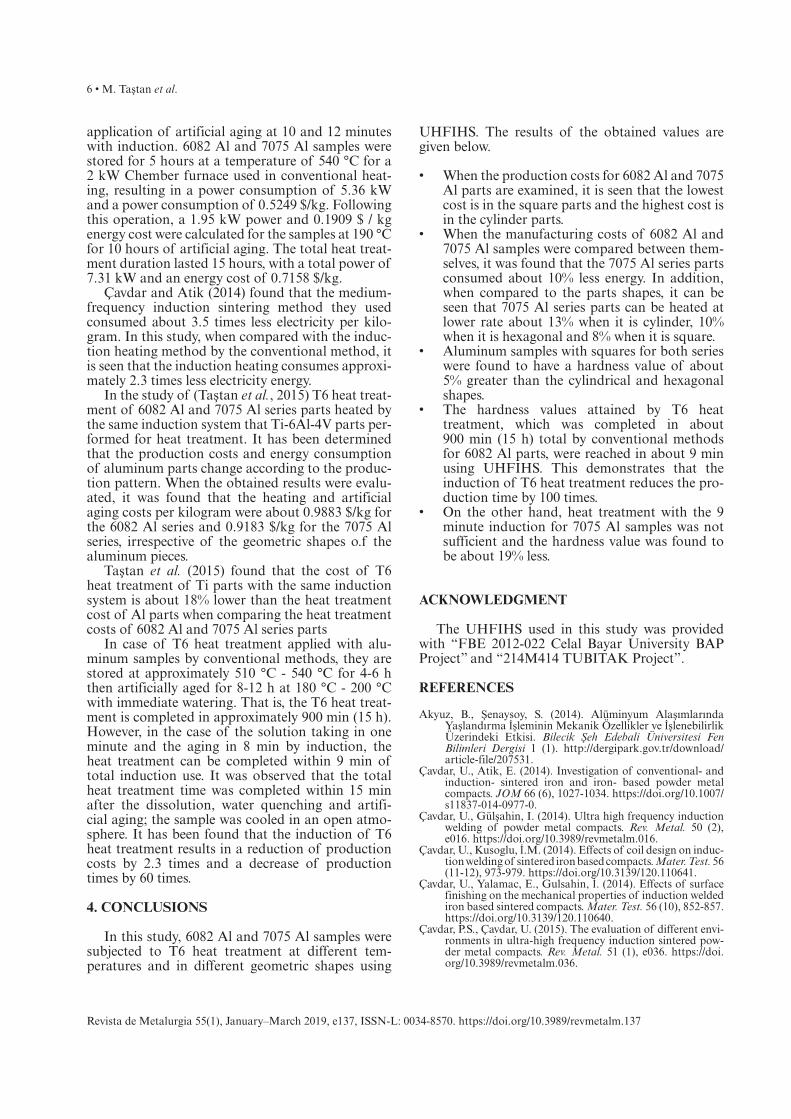
6 • M. Taştan et al.
Revista de Metalurgia 55(1), January–March 2019, e137, ISSN-L: 0034-8570. https://doi.org/10.3989/revmetalm.137
application of artificial aging at 10 and 12 minutes with induction. 6082 Al and 7075 Al samples were stored for 5 hours at a temperature of 540 °C for a 2 kW Chember furnace used in conventional heat-ing, resulting in a power consumption of 5.36 kW and a power consumption of 0.5249 $/kg. Following this operation, a 1.95 kW power and 0.1909 $ / kg energy cost were calculated for the samples at 190 °C for 10 hours of artificial aging. The total heat treat-ment duration lasted 15 hours, with a total power of 7.31 kW and an energy cost of 0.7158 $/kg.
Çavdar and Atik (2014) found that the medium-frequency induction sintering method they used consumed about 3.5 times less electricity per kilo-gram. In this study, when compared with the induc-tion heating method by the conventional method, it is seen that the induction heating consumes approxi-mately 2.3 times less electricity energy.
In the study of (Taştan et al., 2015) T6 heat treat-ment of 6082 Al and 7075 Al series parts heated by the same induction system that Ti-6Al-4V parts per-formed for heat treatment. It has been determined that the production costs and energy consumption of aluminum parts change according to the produc-tion pattern. When the obtained results were evalu-ated, it was found that the heating and artificial aging costs per kilogram were about 0.9883 $/kg for the 6082 Al series and 0.9183 $/kg for the 7075 Al series, irrespective of the geometric shapes o.f the aluminum pieces.
Taştan et al. (2015) found that the cost of T6 heat treatment of Ti parts with the same induction system is about 18% lower than the heat treatment cost of Al parts when comparing the heat treatment costs of 6082 Al and 7075 Al series parts
In case of T6 heat treatment applied with alu-minum samples by conventional methods, they are stored at approximately 510 °C - 540 °C for 4-6 h then artificially aged for 8-12 h at 180 °C - 200 °C with immediate watering. That is, the T6 heat treat-ment is completed in approximately 900 min (15 h). However, in the case of the solution taking in one minute and the aging in 8 min by induction, the heat treatment can be completed within 9 min of total induction use. It was observed that the total heat treatment time was completed within 15 min after the dissolution, water quenching and artifi-cial aging; the sample was cooled in an open atmo-sphere. It has been found that the induction of T6 heat treatment results in a reduction of production costs by 2.3 times and a decrease of production times by 60 times.
4. CONCLUSIONS
In this study, 6082 Al and 7075 Al samples were subjected to T6 heat treatment at different tem-peratures and in different geometric shapes using
UHFIHS. The results of the obtained values are given below.
• When the production costs for 6082 Al and 7075 Al parts are examined, it is seen that the lowest cost is in the square parts and the highest cost is in the cylinder parts.
• When the manufacturing costs of 6082 Al and 7075 Al samples were compared between them-selves, it was found that the 7075 Al series parts consumed about 10% less energy. In addition, when compared to the parts shapes, it can be seen that 7075 Al series parts can be heated at lower rate about 13% when it is cylinder, 10% when it is hexagonal and 8% when it is square.
• Aluminum samples with squares for both series were found to have a hardness value of about 5% greater than the cylindrical and hexagonal shapes.
• The hardness values attained by T6 heat treatment, which was completed in about 900 min (15 h) total by conventional methods for 6082 Al parts, were reached in about 9 min using UHFIHS. This demonstrates that the induction of T6 heat treatment reduces the pro-duction time by 100 times.
• On the other hand, heat treatment with the 9 minute induction for 7075 Al samples was not sufficient and the hardness value was found to be about 19% less.
ACKNOWLEDGMENT
The UHFIHS used in this study was provided with “FBE 2012-022 Celal Bayar University BAP Project” and “214M414 TUBITAK Project”.
REFERENCES
Akyuz, B., Şenaysoy, S. (2014). Alüminyum Alaşımlarında Yaşlandırma İşleminin Mekanik Özellikler ve İşlenebilirlik Üzerindeki Etkisi. Bilecik Şeh Edebali Üniversitesi Fen Bilimleri Dergisi 1 (1). http://dergipark.gov.tr/download/article-file/207531.
Çavdar, U., Atik, E. (2014). Investigation of conventional- and induction- sintered iron and iron- based powder metal compacts. JOM 66 (6), 1027-1034. https://doi.org/10.1007/s11837-014-0977-0.
Çavdar, U., Gülşahin, I. (2014). Ultra high frequency induction welding of powder metal compacts. Rev. Metal. 50 (2), e016. https://doi.org/10.3989/revmetalm.016.
Çavdar, U., Kusoglu, İ.M. (2014). Effects of coil design on induc-tion welding of sintered iron based compacts. Mater. Test. 56 (11-12), 973-979. https://doi.org/10.3139/120.110641.
Çavdar, U., Yalamac, E., Gulsahin, İ. (2014). Effects of surface finishing on the mechanical properties of induction welded iron based sintered compacts. Mater. Test. 56 (10), 852-857. https://doi.org/10.3139/120.110640.
Çavdar, P.S., Çavdar, U. (2015). The evaluation of different envi-ronments in ultra-high frequency induction sintered pow-der metal compacts. Rev. Metal. 51 (1), e036. https://doi.org/10.3989/revmetalm.036.
Analysis of artificial aging with induction and energy costs of 6082 Al and 7075 Al materials • 7
Revista de Metalurgia 55(1), January–March 2019, e137, ISSN-L: 0034-8570. https://doi.org/10.3989/revmetalm.137
Dilmeç, M., Tinkir, M., Arikan, H. (2015). Al 2024 Alaşımının Çökelme Sertleşmesi İşlemi Koşullarının Şekillendirilebilirliğe Etkisinin İncelenmesi. Çukurova Üni-versitesi Mühendislik-Mimarlık Fakültesi Dergisi 30 (1), 231-248. https://doi.org/10.21605/cukurovaummfd.242796.
Gezici, L.U., Gül, B., Çavdar, U. (2018). The mechanical and tribological characteristic of Aluminium-Titanium diox-ide composites. Rev. Metal. 54 (2), e119. https://doi.org/10.3989/revmetalm.119.
Gokozan, H., Taskin, S., Seker, S., Ekiz, H. (2014). A neu-ral network based approach to estimate of power system harmonics for an induction furnace under the different load conditions. Electr. Eng. 97 (2), 111-117. https://doi.org/10.1007/s00202-014-0320-3.
Gokozan, H., Tastan, M., Taskin, S., Cavdar, P.S., Cavdar, U. (2016). Comparison of electrical energy consumption for different material processing procedures Mater. Test. 58 (11-12), 1009-1013. https://doi.org/10.3139/120.110954.
Güleryüz, K., Kaçar, R. (2011). Deformasyon Yaşlanmasının AA7075 Alüminyum Alaşımının Mekanik Özelliklerine Etkisinin İncelenmesi. 6th International Advanced Tech-nologies Symposium (IATS’11). 16-18 May, Elazığ, Turkey.
Güven, Ş.Y., Delikanli, Y.E. (2012). The Effect of Precipitation Hardening on Mechanical Properties of Aluminium Alloy AA2024. SDU Teknik Bilimler Dergisi 2 (2). http://der-gipark.gov.tr/download/article-file/196120.
Özdemir, A., Taştan, M. (2014). PLL based digital adaptive filter for detecting interharmonics. Math. Probl. Eng. Article ID 501781, 10 pages. https://doi.org/10.1155/2014/ 501781.
Özdoğru, E.F., Kayali, E.S. (2011). Eş kanallı açısal pres yön-temiyle üretilen Zr ve Sc ile modifiye edilmiş AA 6082 alüminyum alaşımının karakterizasyonu. Itüdergisi/d müh-endislik 10 (2), 99-106.
Şişmanoğlu, T. (2009). Anodik Oksidasyon Yöntemiyle 2024, 6082 Ve 7075 Kalite Aluminyum Alaşımlarının Yüzey Özel-liklerinin Geliştirilmesi. Doctoral dissertation, İstanbul Teknik University, Institute of Science and Technology.
Taskin, S., Gokozan, H. (2011). Determination of the spectral properties and harmonic levels for driving an induction motor by an inverter driver under the different load condi-tions. Elektronika ir Elektrotechnika 108 (2), 75-80. https://doi.org/10.5755/j01.eee.108.2.149.
Taştan, M., Gokozan, H., Taskin, S., Çavdar, U. (2015). Com-parative energy consumption analyses of an ultra high frequency induction heating system for material process-ing applications. Rev. Metal. 51 (3), e046. https://doi.org/10.3989/revmetalm.046.
Yilmaz, R., Özyürek, D., Kibar, E. (2012). Yeniden çözeltiye alma parametrelerinin 7075 Alüminyum alaşımlarının sert-lik ve aşınma davranışlarına etkisi. J. Fac. Eng. Archit. Gaz. 27 (2), 429-438.
Revista de MetaluRgia January–March 2019, 55 (1), e138
ISSN-L: 0034-8570https://doi.org/10.3989/revmetalm.138
The removal of toxic metals from liquid effluents by ion exchange resins. Part IX: Lead(II)/H+/Amberlite IR-120
Francisco José Alguacil*
Centro Nacional de Investigaciones Metalúrgicas (CENIM, CSIC), Avda. Gregorio del Amo 8, 28040 Madrid, España (*Corresponding author: [email protected])
Submitted: 10 July 2018; Accepted: 6 February 2019; Available On-line: 26 March 2019
ABSTRACT: Lead is recognized as a highly harmful metal for humans, thus its removal from any source con-taining it is a primary target. In average conditions, lead is present in aqueous solutions of pH lower than 5-6 as the cation Pb2+, thus in this work, the removal of such cation from aqueous solutions by the resin Amberlite IR-120 was investigated. Experimental variables than may influence to the removal of the metal were consid-ered: stirring speed of the solution-resin system, temperature, resin dosage and resin particle size, and aqueous pH values. The metal uptake equilibrium responded well to the Freundlich isotherm, being endothermic and non-spontaneous, whereas lead uptake onto the resin responded to the pseudo-first order kinetic model; more-over, the uptake mechanism is non-dependent of the resin particle size and fits well to the aqueous diffusion model. The removal of lead(II) within the resin compared favourable to that obtained with multiwalled carbon nanotubes, and also with respect to the loading of several base metals from binary solutions loading experi-ments. Lead loaded onto the resin can be eluted, generally in almost quantitative form, by HCl solutions, under different experimental conditions
KEYWORDS: Amberlite IR-120; Lead(II); Liquid effluents; Multiwalled carbon nanotubes; Removal
Citation/Citar como: Alguacil, F.J. (2019). “The removal of toxic metals from liquid effluents by ion exchange resins. Part IX: Lead(II)/H+/Amberlite IR-120”. Rev. Metal. 55(1): e138. https://doi.org/10.3989/revmetalm.138
RESUMEN: La eliminación de metales tóxicos presentes en efluentes líquidos mediante resinas de cambio iónico. Parte IX: Plomo(II))/H+/Amberlite IR-120. El plomo está considerado como un metal altamente peligroso para los seres humano, por lo que su eliminación, de cualquier medio que lo contenga, suele ser de la máxima importancia. Comúnmente y a valores de pH inferiores a 5-6, este elemento esta presente en los medios acuo-sos como catión Pb2+. En el presente trabajo se investiga la eliminación de este catión de disoluciones acuosas empleando la tecnología de cambio iónico con la resina Amberlite IR-120. Se consideran una serie de variables que pueden afectar al proceso de carga del metal en la resina: velocidad de agitación del sistema, temperatura, dosificación de la resina y tamaño de partícula de la misma y pH del medio acuoso. La carga del metal responde a la isoterma de Freundlich, siendo el proceso endotérmico y no espontáneo, el mecanismo de carga no depende del tamaño de partícula de la resina y responde a un mecanismo por difusión en el medio acuoso. La eliminación del plomo(II) de disoluciones acuosas mediante la resina compite de forma favorable con respecto a los resulta-dos obtenidos cuando se emplean nanotubos de carbono de pared múltiple como adsorbentes del Pb2+. En ensa-yos llevado a cabo con disoluciones binarias, la carga del Pb2+ en la resina también compite favorablemente con respecto a la de otros metales base en forma catiónica. La elución del plomo(II) se puede llevar a cabo de forma casi cuantitativa con disoluciones de HCl y distintas condiciones experimentales.
PALABRAS CLAVE: Amberlite IR-120; Efluentes líquidos; Eliminación; Nanotubos de carbono de pared múltiple; Plomo(II)
ORCID ID: Francisco José Alguacil (https://orcid.org/0000-0002-0247-3384)
Copyright: © 2019 CSIC. This is an open-access article distributed under the terms of the Creative Commons Attribution 4.0 International (CC BY 4.0) License.
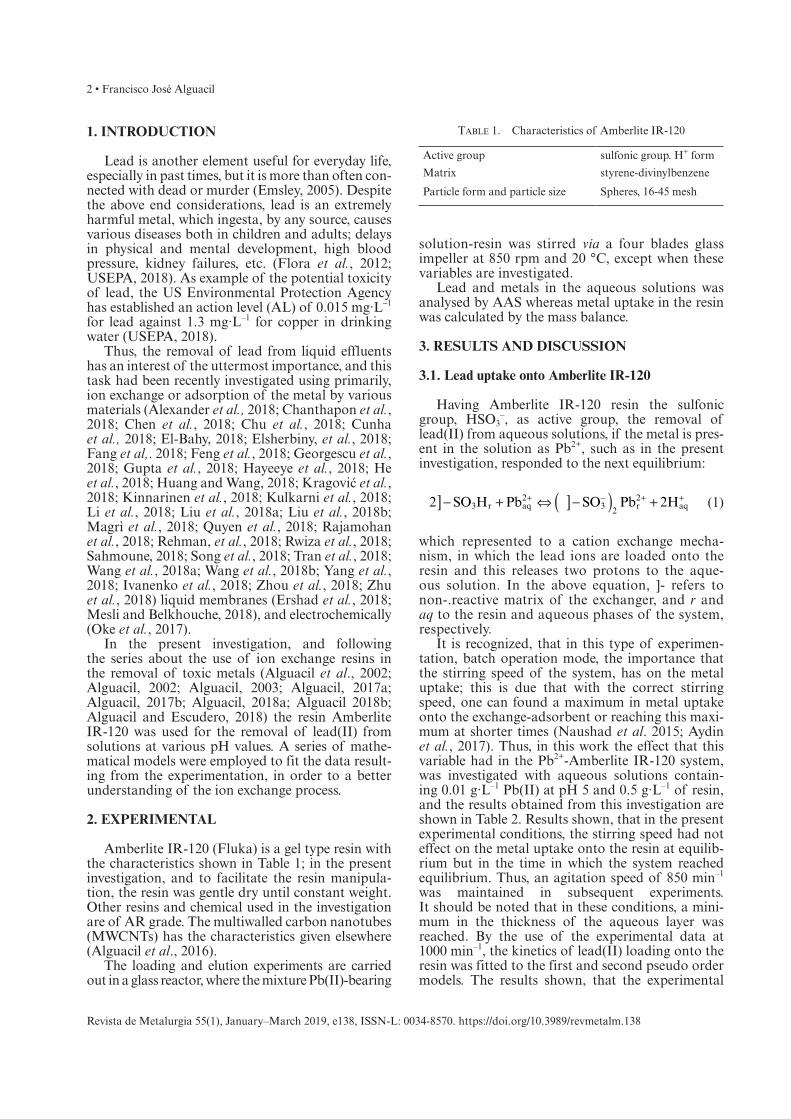
2 • Francisco José Alguacil
Revista de Metalurgia 55(1), January–March 2019, e138, ISSN-L: 0034-8570. https://doi.org/10.3989/revmetalm.138
1. INTRODUCTION
Lead is another element useful for everyday life, especially in past times, but it is more than often con-nected with dead or murder (Emsley, 2005). Despite the above end considerations, lead is an extremely harmful metal, which ingesta, by any source, causes various diseases both in children and adults; delays in physical and mental development, high blood pressure, kidney failures, etc. (Flora et al., 2012; USEPA, 2018). As example of the potential toxicity of lead, the US Environmental Protection Agency has established an action level (AL) of 0.015 mg·L–1 for lead against 1.3 mg·L–1 for copper in drinking water (USEPA, 2018).
Thus, the removal of lead from liquid effluents has an interest of the uttermost importance, and this task had been recently investigated using primarily, ion exchange or adsorption of the metal by various materials (Alexander et al., 2018; Chanthapon et al., 2018; Chen et al., 2018; Chu et al., 2018; Cunha et al., 2018; El-Bahy, 2018; Elsherbiny, et al., 2018; Fang et al,. 2018; Feng et al., 2018; Georgescu et al., 2018; Gupta et al., 2018; Hayeeye et al., 2018; He et al., 2018; Huang and Wang, 2018; Kragović et al., 2018; Kinnarinen et al., 2018; Kulkarni et al., 2018; Li et al., 2018; Liu et al., 2018a; Liu et al., 2018b; Magrì et al., 2018; Quyen et al., 2018; Rajamohan et al., 2018; Rehman, et al., 2018; Rwiza et al., 2018; Sahmoune, 2018; Song et al., 2018; Tran et al., 2018; Wang et al., 2018a; Wang et al., 2018b; Yang et al., 2018; Ivanenko et al., 2018; Zhou et al., 2018; Zhu et al., 2018) liquid membranes (Ershad et al., 2018; Mesli and Belkhouche, 2018), and electrochemically (Oke et al., 2017).
In the present investigation, and following the series about the use of ion exchange resins in the removal of toxic metals (Alguacil et al., 2002; Alguacil, 2002; Alguacil, 2003; Alguacil, 2017a; Alguacil, 2017b; Alguacil, 2018a; Alguacil 2018b; Alguacil and Escudero, 2018) the resin Amberlite IR-120 was used for the removal of lead(II) from solutions at various pH values. A series of mathe-matical models were employed to fit the data result-ing from the experimentation, in order to a better understanding of the ion exchange process.
2. EXPERIMENTAL
Amberlite IR-120 (Fluka) is a gel type resin with the characteristics shown in Table 1; in the present investigation, and to facilitate the resin manipula-tion, the resin was gentle dry until constant weight. Other resins and chemical used in the investigation are of AR grade. The multiwalled carbon nanotubes (MWCNTs) has the characteristics given elsewhere (Alguacil et al., 2016).
The loading and elution experiments are carried out in a glass reactor, where the mixture Pb(II)-bearing
solution-resin was stirred via a four blades glass impeller at 850 rpm and 20 °C, except when these variables are investigated.
Lead and metals in the aqueous solutions was analysed by AAS whereas metal uptake in the resin was calculated by the mass balance.
3. RESULTS AND DISCUSSION
3.1. Lead uptake onto Amberlite IR-120
Having Amberlite IR-120 resin the sulfonic group, HSO3
–, as active group, the removal of lead(II) from aqueous solutions, if the metal is pres-ent in the solution as Pb2+, such as in the present investigation, responded to the next equilibrium:
( )] ]− + ⇔ − ++ − + +2 SO H Pb SO Pb 2H3 r aq2
3 2 r2
aq (1)
which represented to a cation exchange mecha-nism, in which the lead ions are loaded onto the resin and this releases two protons to the aque-ous solution. In the above equation, ]- refers to non-.reactive matrix of the exchanger, and r and aq to the resin and aqueous phases of the system, respectively.
It is recognized, that in this type of experimen-tation, batch operation mode, the importance that the stirring speed of the system, has on the metal uptake; this is due that with the correct stirring speed, one can found a maximum in metal uptake onto the exchange-adsorbent or reaching this maxi-mum at shorter times (Naushad et al. 2015; Aydin et al., 2017). Thus, in this work the effect that this variable had in the Pb2+-Amberlite IR-120 system, was investigated with aqueous solutions contain-ing 0.01 g·L–1 Pb(II) at pH 5 and 0.5 g·L–1 of resin, and the results obtained from this investigation are shown in Table 2. Results shown, that in the present experimental conditions, the stirring speed had not effect on the metal uptake onto the resin at equilib-rium but in the time in which the system reached equilibrium. Thus, an agitation speed of 850 min–1 was maintained in subsequent experiments. It should be noted that in these conditions, a mini-mum in the thickness of the aqueous layer was reached. By the use of the experimental data at 1000 min–1, the kinetics of lead(II) loading onto the resin was fitted to the first and second pseudo order models. The results shown, that the experimental
Table 1. Characteristics of Amberlite IR-120
Active group sulfonic group. H+ form
Matrix styrene-divinylbenzene
Particle form and particle size Spheres, 16-45 mesh
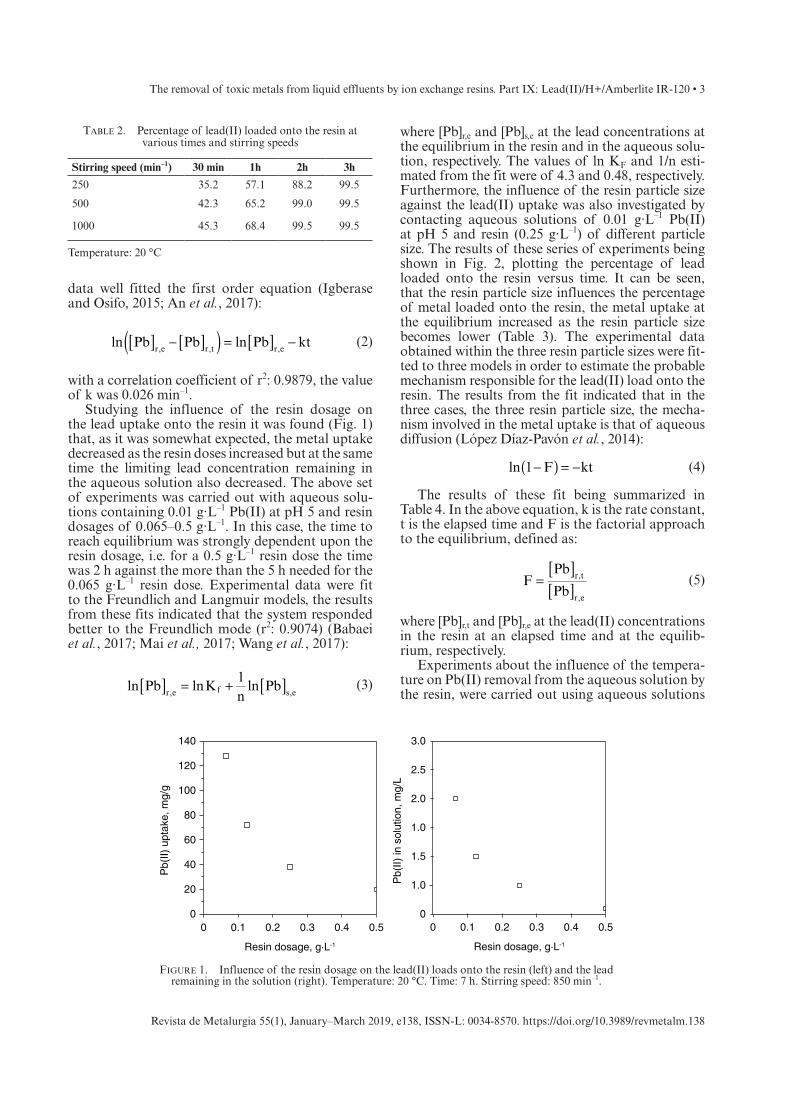
The removal of toxic metals from liquid effluents by ion exchange resins. Part IX: Lead(II)/H+/Amberlite IR-120 • 3
Revista de Metalurgia 55(1), January–March 2019, e138, ISSN-L: 0034-8570. https://doi.org/10.3989/revmetalm.138
data well fitted the first order equation (Igberase and Osifo, 2015; An et al., 2017):
( )[ ] [ ] [ ]− = −ln Pb Pb ln Pb ktr,e r,t r,e
(2)
with a correlation coefficient of r2: 0.9879, the value of k was 0.026 min–1.
Studying the influence of the resin dosage on the lead uptake onto the resin it was found (Fig. 1) that, as it was somewhat expected, the metal uptake decreased as the resin doses increased but at the same time the limiting lead concentration remaining in the aqueous solution also decreased. The above set of experiments was carried out with aqueous solu-tions containing 0.01 g·L–1 Pb(II) at pH 5 and resin dosages of 0.065–0.5 g·L–1. In this case, the time to reach equilibrium was strongly dependent upon the resin dosage, i.e. for a 0.5 g·L–1 resin dose the time was 2 h against the more than the 5 h needed for the 0.065 g·L–1 resin dose. Experimental data were fit to the Freundlich and Langmuir models, the results from these fits indicated that the system responded better to the Freundlich mode (r2: 0.9074) (Babaei et al., 2017; Mai et al., 2017; Wang et al., 2017):
[ ] [ ]= +ln Pb lnK1n
ln Pbr,e f s,e
(3)
where [Pb]r,e and [Pb]s,e at the lead concentrations at the equilibrium in the resin and in the aqueous solu-tion, respectively. The values of ln KF and 1/n esti-mated from the fit were of 4.3 and 0.48, respectively. Furthermore, the influence of the resin particle size against the lead(II) uptake was also investigated by contacting aqueous solutions of 0.01 g·L–1 Pb(II) at pH 5 and resin (0.25 g·L–1) of different particle size. The results of these series of experiments being shown in Fig. 2, plotting the percentage of lead loaded onto the resin versus time. It can be seen, that the resin particle size influences the percentage of metal loaded onto the resin, the metal uptake at the equilibrium increased as the resin particle size becomes lower (Table 3). The experimental data obtained within the three resin particle sizes were fit-ted to three models in order to estimate the probable mechanism responsible for the lead(II) load onto the resin. The results from the fit indicated that in the three cases, the three resin particle size, the mecha-nism involved in the metal uptake is that of aqueous diffusion (López Díaz-Pavón et al., 2014):
( )− = −ln 1 F kt (4)
The results of these fit being summarized in Table 4. In the above equation, k is the rate constant, t is the elapsed time and F is the factorial approach to the equilibrium, defined as:
[ ][ ]=FPb
Pbr,t
r,e
(5)
where [Pb]r,t and [Pb]r,e at the lead(II) concentrations in the resin at an elapsed time and at the equilib-rium, respectively.
Experiments about the influence of the tempera-ture on Pb(II) removal from the aqueous solution by the resin, were carried out using aqueous solutions
Table 2. Percentage of lead(II) loaded onto the resin at various times and stirring speeds
Stirring speed (min–1) 30 min 1h 2h 3h
250 35.2 57.1 88.2 99.5
500 42.3 65.2 99.0 99.5
1000 45.3 68.4 99.5 99.5
Temperature: 20 °C
Figure 1. Influence of the resin dosage on the lead(II) loads onto the resin (left) and the lead remaining in the solution (right). Temperature: 20 °C. Time: 7 h. Stirring speed: 850 min–1.
140
Pb(
II) u
ptak
e, m
g/g
120
100
80
60
40
20
00
Resin dosage, g·L-1
0.1 0.2 0.3 0.4 0.5
Pb(
II) in
sol
utio
n, m
g/L
2.0
1.0
0
1.5
1.0
2.5
3.0
Resin dosage, g·L-1
0 0.1 0.2 0.3 0.4 0.5
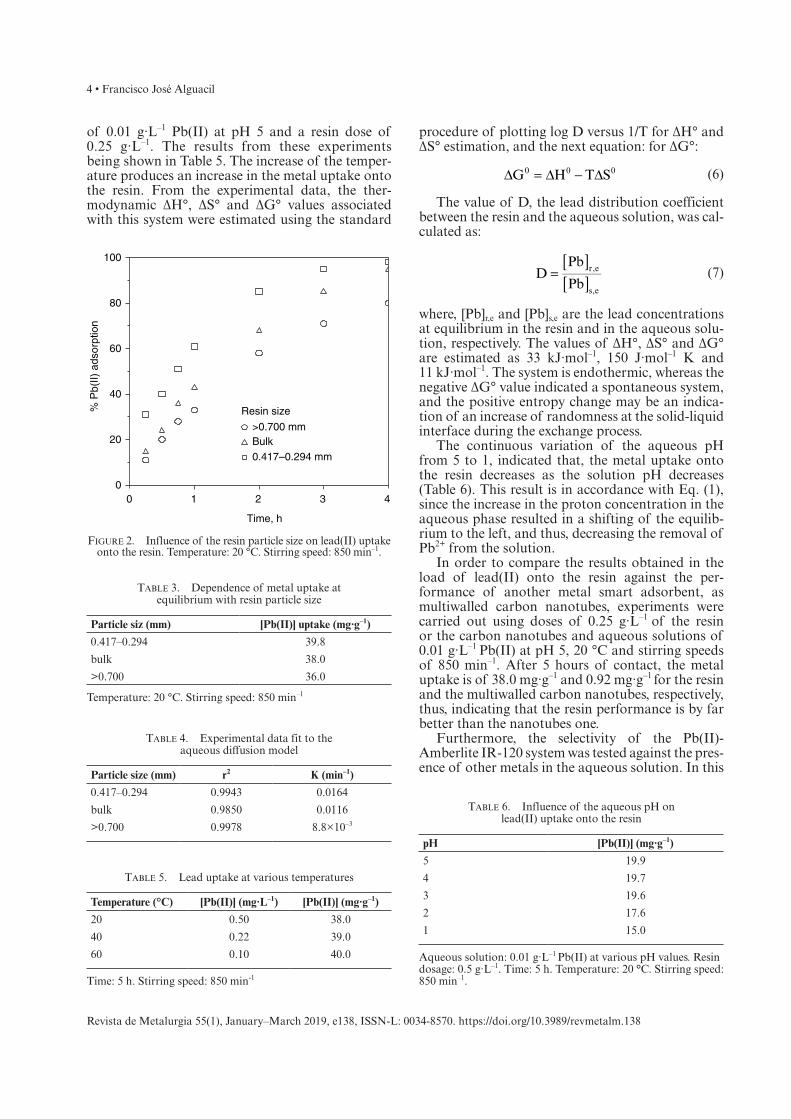
4 • Francisco José Alguacil
Revista de Metalurgia 55(1), January–March 2019, e138, ISSN-L: 0034-8570. https://doi.org/10.3989/revmetalm.138
of 0.01 g·L–1 Pb(II) at pH 5 and a resin dose of 0.25 g·L–1. The results from these experiments being shown in Table 5. The increase of the temper-ature produces an increase in the metal uptake onto the resin. From the experimental data, the ther-modynamic ΔH°, ΔS° and ΔG° values associated with this system were estimated using the standard
procedure of plotting log D versus 1/T for ΔH° and ΔS° estimation, and the next equation: for ΔG°:
∆ = ∆ − ∆G H T S0 0 0 (6)
The value of D, the lead distribution coefficient between the resin and the aqueous solution, was cal-culated as:
[ ][ ]=DPb
Pbr,e
s,e
(7)
where, [Pb]r,e and [Pb]s,e are the lead concentrations at equilibrium in the resin and in the aqueous solu-tion, respectively. The values of ΔH°, ΔS° and ΔG° are estimated as 33 kJ·mol–1, 150 J·mol–1 K and 11 kJ·mol–1. The system is endothermic, whereas the negative ΔG° value indicated a spontaneous system, and the positive entropy change may be an indica-tion of an increase of randomness at the solid-liquid interface during the exchange process.
The continuous variation of the aqueous pH from 5 to 1, indicated that, the metal uptake onto the resin decreases as the solution pH decreases (Table 6). This result is in accordance with Eq. (1), since the increase in the proton concentration in the aqueous phase resulted in a shifting of the equilib-rium to the left, and thus, decreasing the removal of Pb2+ from the solution.
In order to compare the results obtained in the load of lead(II) onto the resin against the per-formance of another metal smart adsorbent, as multiwalled carbon nanotubes, experiments were carried out using doses of 0.25 g·L–1 of the resin or the carbon nanotubes and aqueous solutions of 0.01 g·L–1 Pb(II) at pH 5, 20 °C and stirring speeds of 850 min–1. After 5 hours of contact, the metal uptake is of 38.0 mg·g–1 and 0.92 mg·g–1 for the resin and the multiwalled carbon nanotubes, respectively, thus, indicating that the resin performance is by far better than the nanotubes one.
Furthermore, the selectivity of the Pb(II)-Amberlite IR-120 system was tested against the pres-ence of other metals in the aqueous solution. In this
Figure 2. Influence of the resin particle size on lead(II) uptake onto the resin. Temperature: 20 °C. Stirring speed: 850 min–1.
00 1 2 3 4
Time, h
% P
b(II)
ads
orpt
ion
20
40
100
>0.700 mm
Resin size
Bulk0.417–0.294 mm
80
60
Table 3. Dependence of metal uptake at equilibrium with resin particle size
Particle siz (mm) [Pb(II)] uptake (mg·g–1)
0.417–0.294 39.8
bulk 38.0
>0.700 36.0
Temperature: 20 °C. Stirring speed: 850 min–1
Table 4. Experimental data fit to the aqueous diffusion model
Particle size (mm) r2 K (min–1)
0.417–0.294 0.9943 0.0164
bulk 0.9850 0.0116
>0.700 0.9978 8.8×10⁻³
Table 5. Lead uptake at various temperatures
Temperature (°C) [Pb(II)] (mg·L–1) [Pb(II)] (mg·g–1)
20 0.50 38.0
40 0.22 39.0
60 0.10 40.0
Time: 5 h. Stirring speed: 850 min-1
Table 6. Influence of the aqueous pH on lead(II) uptake onto the resin
pH [Pb(II)] (mg·g–1)
5 19.9
4 19.7
3 19.6
2 17.6
1 15.0
Aqueous solution: 0.01 g·L–1 Pb(II) at various pH values. Resin dosage: 0.5 g·L–1. Time: 5 h. Temperature: 20 °C. Stirring speed: 850 min–1.
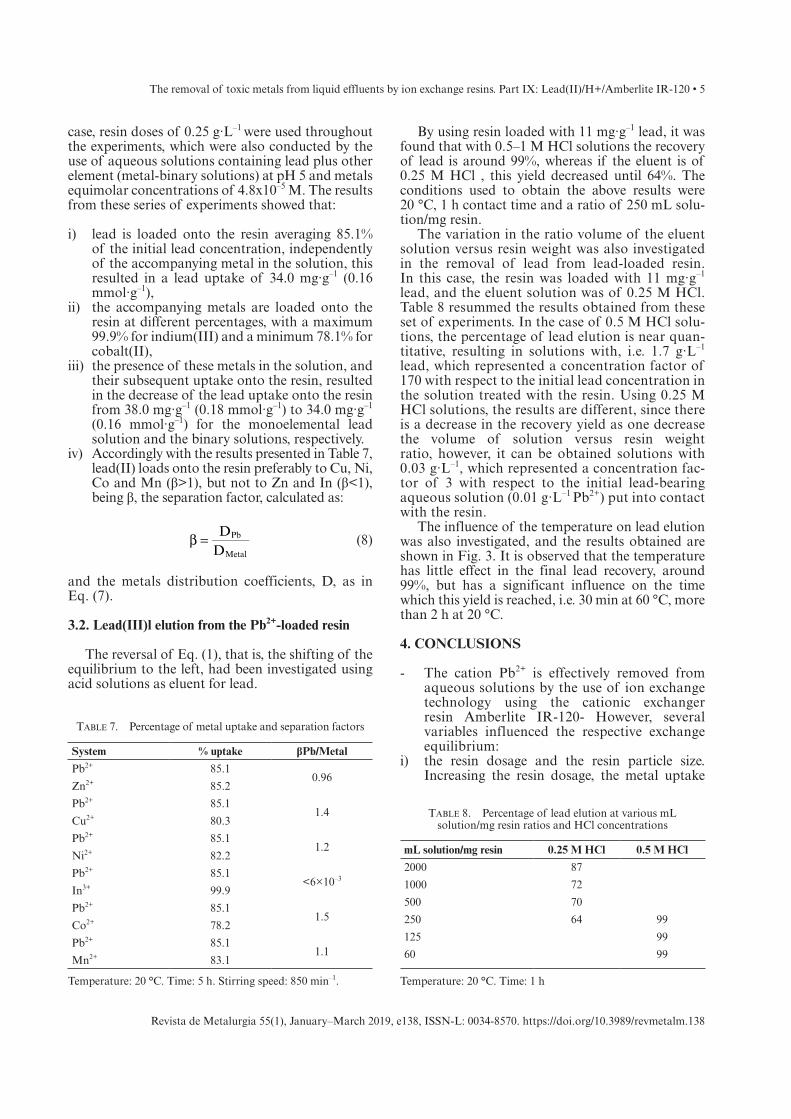
The removal of toxic metals from liquid effluents by ion exchange resins. Part IX: Lead(II)/H+/Amberlite IR-120 • 5
Revista de Metalurgia 55(1), January–March 2019, e138, ISSN-L: 0034-8570. https://doi.org/10.3989/revmetalm.138
case, resin doses of 0.25 g·L–1 were used throughout the experiments, which were also conducted by the use of aqueous solutions containing lead plus other element (metal-binary solutions) at pH 5 and metals equimolar concentrations of 4.8x10⁻⁵ M. The results from these series of experiments showed that:
i) lead is loaded onto the resin averaging 85.1% of the initial lead concentration, independently of the accompanying metal in the solution, this resulted in a lead uptake of 34.0 mg·g–1 (0.16 mmol·g–1),
ii) the accompanying metals are loaded onto the resin at different percentages, with a maximum 99.9% for indium(III) and a minimum 78.1% for cobalt(II),
iii) the presence of these metals in the solution, and their subsequent uptake onto the resin, resulted in the decrease of the lead uptake onto the resin from 38.0 mg·g–1 (0.18 mmol·g–1) to 34.0 mg·g–1 (0.16 mmol·g–1) for the monoelemental lead solution and the binary solutions, respectively.
iv) Accordingly with the results presented in Table 7, lead(II) loads onto the resin preferably to Cu, Ni, Co and Mn (β>1), but not to Zn and In (β<1), being β, the separation factor, calculated as:
β = DD
Pb
Metal
(8)
and the metals distribution coefficients, D, as in Eq. (7).
3.2. Lead(III)l elution from the Pb2+-loaded resin
The reversal of Eq. (1), that is, the shifting of the equilibrium to the left, had been investigated using acid solutions as eluent for lead.
By using resin loaded with 11 mg·g–1 lead, it was found that with 0.5–1 M HCl solutions the recovery of lead is around 99%, whereas if the eluent is of 0.25 M HCl , this yield decreased until 64%. The conditions used to obtain the above results were 20 °C, 1 h contact time and a ratio of 250 mL solu-tion/mg resin.
The variation in the ratio volume of the eluent solution versus resin weight was also investigated in the removal of lead from lead-loaded resin. In this case, the resin was loaded with 11 mg·g–1 lead, and the eluent solution was of 0.25 M HCl. Table 8 resummed the results obtained from these set of experiments. In the case of 0.5 M HCl solu-tions, the percentage of lead elution is near quan-titative, resulting in solutions with, i.e. 1.7 g·L–1
lead, which represented a concentration factor of 170 with respect to the initial lead concentration in the solution treated with the resin. Using 0.25 M HCl solutions, the results are different, since there is a decrease in the recovery yield as one decrease the volume of solution versus resin weight ratio, however, it can be obtained solutions with 0.03 g·L–1, which represented a concentration fac-tor of 3 with respect to the initial lead-bearing aqueous solution (0.01 g·L–1 Pb2+) put into contact with the resin.
The influence of the temperature on lead elution was also investigated, and the results obtained are shown in Fig. 3. It is observed that the temperature has little effect in the final lead recovery, around 99%, but has a significant influence on the time which this yield is reached, i.e. 30 min at 60 °C, more than 2 h at 20 °C.
4. CONCLUSIONS
- The cation Pb2+ is effectively removed from aqueous solutions by the use of ion exchange technology using the cationic exchanger resin Amberlite IR-120- However, several variables influenced the respective exchange equilibrium:
i) the resin dosage and the resin particle size. Increasing the resin dosage, the metal uptake
Table 7. Percentage of metal uptake and separation factors
System % uptake βPb/Metal
Pb2+ 85.10.96
Zn2+ 85.2
Pb2+ 85.11.4
Cu2+ 80.3
Pb2+ 85.11.2
Ni2+ 82.2
Pb2+ 85.1<6×10⁻³
In3+ 99.9
Pb2+ 85.11.5
Co2+ 78.2
Pb2+ 85.11.1
Mn2+ 83.1
Temperature: 20 °C. Time: 5 h. Stirring speed: 850 min–1.
Table 8. Percentage of lead elution at various mL solution/mg resin ratios and HCl concentrations
mL solution/mg resin 0.25 M HCl 0.5 M HCl
2000 87
1000 72
500 70
250 64 99
125 99
60 99
Temperature: 20 °C. Time: 1 h
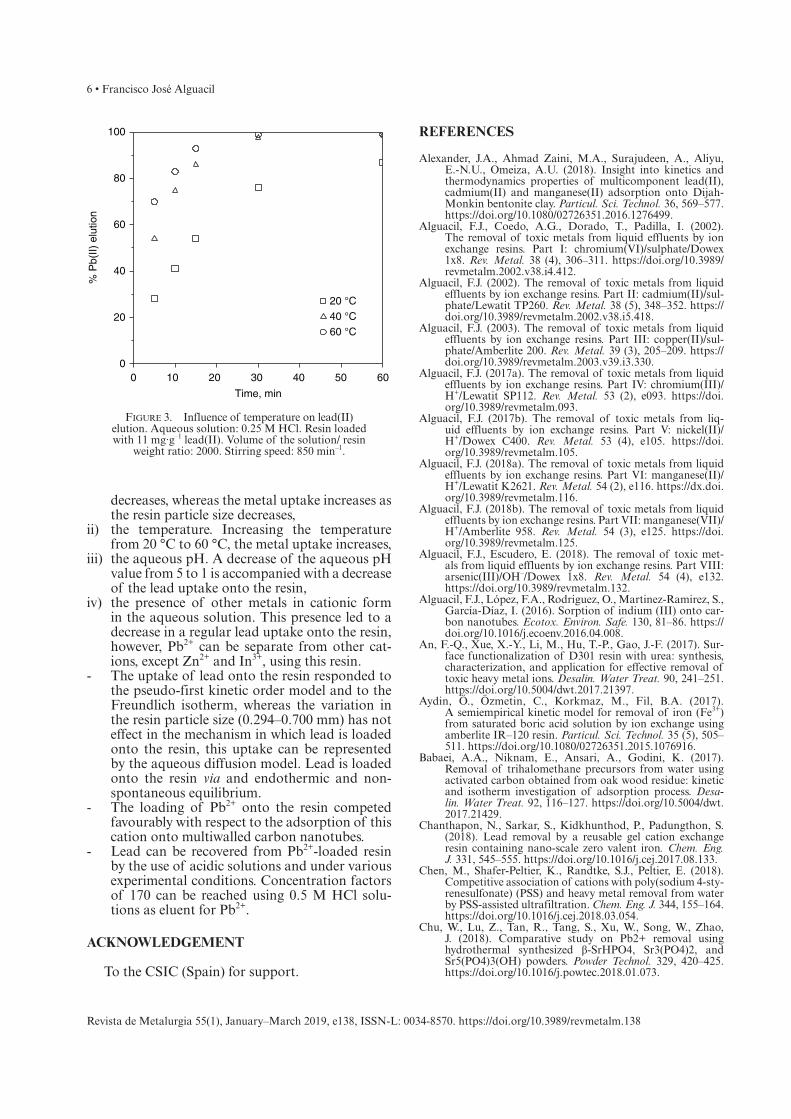
6 • Francisco José Alguacil
Revista de Metalurgia 55(1), January–March 2019, e138, ISSN-L: 0034-8570. https://doi.org/10.3989/revmetalm.138
decreases, whereas the metal uptake increases as the resin particle size decreases,
ii) the temperature. Increasing the temperature from 20 °C to 60 °C, the metal uptake increases,
iii) the aqueous pH. A decrease of the aqueous pH value from 5 to 1 is accompanied with a decrease of the lead uptake onto the resin,
iv) the presence of other metals in cationic form in the aqueous solution. This presence led to a decrease in a regular lead uptake onto the resin, however, Pb2+ can be separate from other cat-ions, except Zn2+ and In3+, using this resin.
- The uptake of lead onto the resin responded to the pseudo-first kinetic order model and to the Freundlich isotherm, whereas the variation in the resin particle size (0.294–0.700 mm) has not effect in the mechanism in which lead is loaded onto the resin, this uptake can be represented by the aqueous diffusion model. Lead is loaded onto the resin via and endothermic and non-spontaneous equilibrium.
- The loading of Pb2+ onto the resin competed favourably with respect to the adsorption of this cation onto multiwalled carbon nanotubes.
- Lead can be recovered from Pb2+-loaded resin by the use of acidic solutions and under various experimental conditions. Concentration factors of 170 can be reached using 0.5 M HCl solu-tions as eluent for Pb2+.
ACKNOWLEDGEMENT
To the CSIC (Spain) for support.
REFERENCES
Alexander, J.A., Ahmad Zaini, M.A., Surajudeen, A., Aliyu, E.-N.U., Omeiza, A.U. (2018). Insight into kinetics and thermodynamics properties of multicomponent lead(II), cadmium(II) and manganese(II) adsorption onto Dijah-Monkin bentonite clay. Particul. Sci. Technol. 36, 569–577. https://doi.org/10.1080/02726351.2016.1276499.
Alguacil, F.J., Coedo, A.G., Dorado, T., Padilla, I. (2002). The removal of toxic metals from liquid effluents by ion exchange resins. Part I: chromium(VI)/sulphate/Dowex 1x8. Rev. Metal. 38 (4), 306–311. https://doi.org/10.3989/revmetalm.2002.v38.i4.412.
Alguacil, F.J. (2002). The removal of toxic metals from liquid effluents by ion exchange resins. Part II: cadmium(II)/sul-phate/Lewatit TP260. Rev. Metal. 38 (5), 348–352. https://doi.org/10.3989/revmetalm.2002.v38.i5.418.
Alguacil, F.J. (2003). The removal of toxic metals from liquid effluents by ion exchange resins. Part III: copper(II)/sul-phate/Amberlite 200. Rev. Metal. 39 (3), 205–209. https://doi.org/10.3989/revmetalm.2003.v39.i3.330.
Alguacil, F.J. (2017a). The removal of toxic metals from liquid effluents by ion exchange resins. Part IV: chromium(III)/H+/Lewatit SP112. Rev. Metal. 53 (2), e093. https://doi.org/10.3989/revmetalm.093.
Alguacil, F.J. (2017b). The removal of toxic metals from liq-uid effluents by ion exchange resins. Part V: nickel(II)/H+/Dowex C400. Rev. Metal. 53 (4), e105. https://doi.org/10.3989/revmetalm.105.
Alguacil, F.J. (2018a). The removal of toxic metals from liquid effluents by ion exchange resins. Part VI: manganese(II)/H+/Lewatit K2621. Rev. Metal. 54 (2), e116. https://dx.doi.org/10.3989/revmetalm.116.
Alguacil, F.J. (2018b). The removal of toxic metals from liquid effluents by ion exchange resins. Part VII: manganese(VII)/H+/Amberlite 958. Rev. Metal. 54 (3), e125. https://doi.org/10.3989/revmetalm.125.
Alguacil, F.J., Escudero, E. (2018). The removal of toxic met-als from liquid effluents by ion exchange resins. Part VIII: arsenic(III)/OH–/Dowex 1x8. Rev. Metal. 54 (4), e132. https://doi.org/10.3989/revmetalm.132.
Alguacil, F.J., López, F.A., Rodriguez, O., Martinez-Ramirez, S., García-Díaz, I. (2016). Sorption of indium (III) onto car-bon nanotubes. Ecotox. Environ. Safe. 130, 81–86. https://doi.org/10.1016/j.ecoenv.2016.04.008.
An, F.-Q., Xue, X.-Y., Li, M., Hu, T.-P., Gao, J.-F. (2017). Sur-face functionalization of D301 resin with urea: synthesis, characterization, and application for effective removal of toxic heavy metal ions. Desalin. Water Treat. 90, 241–251. https://doi.org/10.5004/dwt.2017.21397.
Aydin, Ö., Özmetin, C., Korkmaz, M., Fil, B.A. (2017). A semiempirical kinetic model for removal of iron (Fe3+) from saturated boric acid solution by ion exchange using amberlite IR–120 resin. Particul. Sci. Technol. 35 (5), 505–511. https://doi.org/10.1080/02726351.2015.1076916.
Babaei, A.A., Niknam, E., Ansari, A., Godini, K. (2017). Removal of trihalomethane precursors from water using activated carbon obtained from oak wood residue: kinetic and isotherm investigation of adsorption process. Desa-lin. Water Treat. 92, 116–127. https://doi.org/10.5004/dwt. 2017.21429.
Chanthapon, N., Sarkar, S., Kidkhunthod, P., Padungthon, S. (2018). Lead removal by a reusable gel cation exchange resin containing nano-scale zero valent iron. Chem. Eng. J. 331, 545–555. https://doi.org/10.1016/j.cej.2017.08.133.
Chen, M., Shafer-Peltier, K., Randtke, S.J., Peltier, E. (2018). Competitive association of cations with poly(sodium 4-sty-renesulfonate) (PSS) and heavy metal removal from water by PSS-assisted ultrafiltration. Chem. Eng. J. 344, 155–164. https://doi.org/10.1016/j.cej.2018.03.054.
Chu, W., Lu, Z., Tan, R., Tang, S., Xu, W., Song, W., Zhao, J. (2018). Comparative study on Pb2+ removal using hydrothermal synthesized β-SrHPO4, Sr3(PO4)2, and Sr5(PO4)3(OH) powders. Powder Technol. 329, 420–425. https://doi.org/10.1016/j.powtec.2018.01.073.
Figure 3. Influence of temperature on lead(II) elution. Aqueous solution: 0.25 M HCl. Resin loaded with 11 mg·g–1 lead(II). Volume of the solution/ resin
weight ratio: 2000. Stirring speed: 850 min–1.
0
20 °C
40 °C
60 °C
0 10 20 30 40 50 60
% P
b(II)
elu
tion
Time, min
20
40
100
80
60
The removal of toxic metals from liquid effluents by ion exchange resins. Part IX: Lead(II)/H+/Amberlite IR-120 • 7
Revista de Metalurgia 55(1), January–March 2019, e138, ISSN-L: 0034-8570. https://doi.org/10.3989/revmetalm.138
Cunha, G.D.C., Santos B.T. dos, Alves, J.R., Alves Silva, I.A., Souza Cruz, D.R. de, Romao, L.P.C. (2018). Applications of magnetic hybrid adsorbent derived from waste biomass for the removal of metal ions and reduction of 4-nitrophenol. J. Environ. Manage. 213, 236–246. https://doi.org/10.1016/j.jenvman.2018.02.031.
El-Bahy, S.M. (2018). New iminodiacetate chelating resin-functionalized Fe3O4 nanoparticles: synthesis, character-ization, and application for the removal of some noxious metal ions from wastewater. J. Chem. Eng. Data 63 (6), 2299–2313. https://doi.org/10.1021/acs.jced.8b00241.
Elsherbiny, A.S., El-Hefnawy, M.E., Gemeay, A.H. (2018). Adsorption efficiency of polyaspartate-montmorillonite composite towards the removal of Pb (II) and Cd (II) from aqueous solution. J. Polym. Environ. 26 (2), 411–422. https://doi.org/10.1007/s10924-017-0958-9.
Emsley, J. (2005). The elements of murder. Oxford University Press. Oxford, Great Britain.
Ershad, M., Almeida, M.I.G.S., Spassov, T.G., Cattrall, R.W., Kolev, S.D. (2018). Polymer inclusion membranes (PIMs) containing purified dinonylnaphthalene sulfonic acid (DNNS): performance and selectivity. Sep. Purif. Technol. 195, 446–452. https://doi.org/10.1016/j.seppur.2017.12.037.
Fang, L., Li, L., Qu, Z., Xu, H., Xu, J., Yan, N. (2018). A novel method for the sequential removal and separation of mul-tiple heavy metals from wastewater. J. Hazard. Mater. 342, 617–624. https://doi.org/10.1016/j.jhazmat.2017.08.072.
Feng, C., Zhang, S., Li, L., Wang, G., Xu, X., Li, T., Zhong, Q. (2018). Feasibility of four wastes to remove heavy metals from contaminated soils. J. Environ. Manage. 212, 258–265. https://doi.org/10.1016/j.jenvman.2018.01.030.
Flora, G., Gupta, D., Tiwari, A. (2012). Toxicity of lead: A review with recent updates. Interdiscip. Toxicol. 5 (2), 47–58. https://doi.org/10.2478/v10102-012-0009-2
Georgescu, A.-M., Nardou, F., Zichil, V., Nistor, I.D. (2018). Adsorption of lead(II) ions from aqueous solutions onto Cr-pillared clays. Appl. Clay Sci. 152, 44–50. https://doi.org/10.1016/j.clay.2017.10.031.
Gupta, K.M., Zhang, K., Jiang, J. (2018). Efficient removal of Pb2+ from aqueous solution by an ionic covalent−organic framework: Molecular simulation study. Ind. Eng. Chem. Res. 57 (18), 6477–6482. https://doi.org/10.1021/acs.iecr.8b00625.
Hayeeye, F., Yu, Q.J., Sattar, M., Chinpa, W., Sirichote, O. (2018). Adsorption of Pb2+ ions from aqueous solu-tions by gelatin/activated carbon composite bead form. Adsorption Sci. Technol. 36 (1–2), 355–371. https://doi.org/10.1177/0263617417693006.
He, S., Li, Y., Weng, L., Wang, J., He, J., Liu, Y. Zhang, K, Wu, Q., Zhang, Y., Zhang, Z. (2018). Competitive adsorption of Cd2+, Pb2+ and Ni2+ onto Fe3+-modified argilla-ceous limestone: Influence of pH, ionic strength and nat-ural organic matters. Sci. Total Environ. 637–638, 69–78. https://doi.org/10.1016/j.scitotenv.2018.04.300.
Huang, Y., Wang, Z. (2018). Preparation of composite aerogels based on sodium alginate, and its application in removal of Pb2+and Cu2+from water. Int. J. Biol. Macromol. 107 (A), 741–747. https://doi.org/10.1016/j.ijbiomac.2017.09.057.
Igberase, E., Osifo, P. (2015). Equilibrium, kinetic, thermody-namic and desorption studies of cadmium and lead by polyaniline grafted crossed-link chitosan beads from aque-ous solution. J. Ind. Eng. Chem. 26, 340–347. https://doi.org/10.1016/j.jiec.2014.12.007.
Ivanenko V.I., Korneykov R.I., Kesarev K.A., Zharov N.V. (2018). Puryfying the process effluents from heavy met-als and arsenic cations by deposition and ion exchange. Tsvetnye Metally 1, 33–38. https://doi.org/10.17580/tsm.2018.01.04.
Kragović, M., Pašalić, S., Marković, M., Petrović, M., Nedeljković, B., Momčilović, M., Stojmenović, M. (2018). Natural and modified zeolite-alginate composites. Applica-tion for removal of heavy metal cations from contaminated water solutions. Minerals 8 (1), 11. https://doi.org/10.3390/min8010011.
Kinnarinen, T., Golmaei, M., Jernström, E., Häkkinen, A. (2018). Effective removal of hazardous trace metals from
recovery boiler fly ashes. J. Hazard. Mater. 344, 770–777. https://doi.org/10.1016/j.jhazmat.2017.11.030.
Kulkarni, V.V., Golder, A.K., Ghosh, P.K. (2018). Synthesis and characterization of carboxylic cation exchange bio-resin for heavy metal remediation. J. Hazard. Mater. 341, 207–217. https://doi.org/10.1016/j.jhazmat.2017.07.043.
Li, Z., Wang, L., Meng, J., Liu, X., Xu, J., Wang, F., Brookes, P. (2018). Zeolite-supported nanoscale zero-valent iron: New findings on simultaneous adsorption of Cd (II), Pb (II), and As (III) in aqueous solution and soil. J. Hazard. Mater. 344, 1–11. https://doi.org/10.1016/j.jhazmat.2017.09.036.
Liu, S., Duan, Z., He, C., Xu, X., Li, T., Li, Y., Li, X., Wang, Y., Xu, L. (2018a). Rapid removal of Pb2+ from aqueous solution by phosphate-modified baker’s yeast. RSC Adv. 8, 8026–8038. https://doi.org/10.1039/c7ra13545a.
Liu, Y., Yan, Y., Seshadri, B., Qi, F., Xu, Y., Bolan, N., Zheng, F., Sun, X., Han, W., Wang, L. (2018b). Immobilization of lead and copper in aqueous solution and soil using hydroxyapatite derived from flue gas desulphurization gypsum. J. Geochem. Explor. 184, 239–246. https://doi.org/10.1016/j.gexplo.2016.08.006.
López Díaz-Pavón, A., Cerpa, A., Alguacil, F.J. (2014). Pro-cessing of indium (III) solutions via ion exchange with Lewatit K-2621 resin. Rev. Metal. 50 (2), e010. https://doi.org/10.3989/revmetalm.010.
Magrì, D., Caputo, G., Perotto, G., Scarpellini, A., Colusso, E., Drago, F., Martucci, A., Athanassiou, A., Fragouli, D, (2018). Titanate fibroin nanocomposites: a novel approach for the removal of heavy-metal ions from water. ACS Appl. Mater. Inter. 10 (1), 651–659. https://doi.org/10.1021/acsami.7b15440.
Mai, T.T.T., Mai, X.T., Pham, T.V., Nguyen, A.T.V., Le, T.C., Phan, B.T. (2017). Effect of polyaniline maize tree-trunk composite on adsorption of lead (II) and cadmium (II) ions from solution. Desalin. Water Treat. 88, 179–188. https://doi.org/10.5004/dwt.2017.21430.
Mesli, M., Belkhouche, N.-E. (2018). Emulsion ionic liquid membrane for recovery process of lead. Comparative study of experimental and response surface design. Chem. Eng. Res. Des. 129, 160–169. https://doi.org/10.1016/j.cherd. 2017.11.011.
Naushad, M., ALOthman, Z.A., Sharma, G., Inamuddin (2015). Kinetics, isotherm and thermodynamic investiga-tions for the adsorption of Co (II) ion onto crystal violet modified amberlite IR-120 resin. Ionics 21 (5), 1453–1459. https://doi.org/10.1007/s11581-014-1292-z.
Oke, I.A., Lukman, S., Ismail, A., Fehiniola, E.O., Amoko, J.S. (2017). Removal of lead ions from water and waste-waters electrochemically. In Water Purification. Grumez-escu, A.M. (Ed.), Elsevier, The Netherlands, pp. 643–691. https://doi.org/10.1016/B978-0-12-804300-4.00019-8.
Quyen, N.D.V., Tuyen, T.N., Khieu, D.Q., Hai, H.M., Tin, D.X., Lan, P.T.N., Kiyoshi, I. (2018). Lead ions removal from aqueous solution using modified carbon nanotubes. Bull. Mater. Sci. 41 (6), pages 11. https://doi.org/10.1007/s12034-017-1541-7.
Rajamohan, N., Al Gharibi, A., Rajasimman, M. (2018). Kinetic modeling of lead removal in a resin column–parameters evaluation. Water Pract. Technol. 13 (2), 439–445. https://doi.org/10.2166/wpt.2018.056.
Rehman, M., Rehman, W., Waseem, M., Haq, S., Shah, K.H., Kang, P. (2018). Adsorption of Pb2+ ions on novel ter-nary nanocomposite of tin, iron and titania. Mater. Res. Express 5 (2), 025512. https://doi.org/10.1088/2053-1591/aaabd8.
Rwiza, M.J., Oh, S.-Y., Kim, K.-W., Kim, S.D. (2018). Compara-tive sorption isotherms and removal studies for Pb(II) by physical and thermochemical modification of low-cost agro-wastes from Tanzania. Chemosphere 195, 135–145. https://doi.org/10.1016/j.chemosphere.2017.12.043.
Sahmoune, M.N. (2018). Performance of Streptomyces rimosus biomass in biosorption of heavy metals from aqueous solu-tions. Microchem. J. 141, 87–95 https://doi.org/10.1016/j.microc.2018.05.009.
Song, M., Wei, Y., Cai, S., Yu, L., Zhong, Z., Jin, B. (2018). Study on adsorption properties and mechanism of Pb2 + with
8 • Francisco José Alguacil
Revista de Metalurgia 55(1), January–March 2019, e138, ISSN-L: 0034-8570. https://doi.org/10.3989/revmetalm.138
different carbon based adsorbents. Sci. Total Environ. 618, 1416–1422. https://doi.org/10.1016/j.scitotenv.2017.09.268.
Tran, H.N., Viet, P.V., Chao, H.-P. (2018). Surfactant modified zeolite as amphiphilic and dual-electronic adsorbent for removal of cationic and oxyanionic metal ions and organic compounds. Ecotox. Environ. Safe. 147, 55–63. https://doi.org/10.1016/j.ecoenv.2017.08.027.
USEPA (2018). National drinking water regulations. https://www.epa.gov. https://www.epa.gov/ground-water-and-drinking-water/national-primary-drinking-water- regulations. Checked July 2018.
Wang, S., Li, P., Zhang, X., Zheng, S., Zhang, Y. (2017). Selec-tive adsorption of lithium from high Mg-containing brines using HxTiO3 ion sieve. Hydrometallurgy 174, 21–28. https://doi.org/10.1016/j.hydromet.2017.09.009.
Wang, G., Zhang, S., Yao, P., Chen, Y., Xu, X., Li, T., Gong, G. (2018a). Removal of Pb(II) from aqueous solutions by Phytolacca americana L. biomass as a low cost biosorbent. Arab. J. Chem. 11 (1), 99–110. https://doi.org/10.1016/j.arabjc. 2015.06.011.
Wang, S., Guo, W., Gao, F., Wang, Y., Gao, Y. (2018b). Lead and uranium sorptive removal from aqueous solution using magnetic and nonmagnetic fast pyrolysis rice husk bio-chars. RSC Adv. 8, 13205–13217. https://doi.org/10.1039/c7ra13540h.
Yang, X., Igalavithana, A.D., Oh, S.-E., Nam, H., Zhang, M., Wang, C.-H., Kwon, E.E., Tsang, D.C.W., Ok, Y.S. (2018). Characterization of bioenergy biochar and its utiliza-tion for metal/metalloid immobilization in contaminated soil. Sci. Total Environ. 640–641, 704–713. https://doi.org/ 10.1016/j.scitotenv.2018.05.298.
Zhou, H., Jiang, Z., Wei, S. (2018). A new hydrotalcite-like absorbent FeMnMg-LDH and its adsorption capacity for Pb2+ ions in water. Appl. Clay Sci. 153, 29–37. https://doi.org/10.1016/j.clay.2017.11.033.
Zhu, Y., Jiang, Y., Zhu, Z., Deng, H., Ding, H., Li, Y., Zhang, L., Lin, J (2018). Preparation of a porous hydroxyapatite-carbon composite with the bio-template of sugarcane top stems and its use for the Pb(II) removal. J. Clean. Prod. 187, 650–661. https://doi.org/10.1016/j.jclepro.2018.03.275.
Revista de MetaluRgia Enero–Marzo 2019, 55 (1) e139
ISSN-L: 0034-8570https://doi.org/10.3989/revmetalm.139
Efecto del cobalto sobre nano-partículas de óxido de zinc en el desempeño anticorrosivo de un imprimante alquídico
Santiago Floresa,*, Oscar Chumpitaza
aInstituto de Corrosión y Protección, Pontificia Universidad Católica del Perú, Av. Universitaria 1801, San Miguel, Lima 32, Perú
(*Autor para la correspondencia: [email protected])
Enviado: 4 Julio 2018; Aceptado: 13 Febrero 2019; Publicado on-Line: 03 Abril 2019
RESUMEN: El objetivo de esta investigación ha sido estudiar el efecto inhibidor del CoO en ZnO obtenidos por síntesis por combustión de solución (SCS) cuando son incorporados a formulaciones alquídicas. ZnO y óxidos mixtos del tipo Zn1-xCoxO (donde x = 0,05-0,10-0,15-0,20) fueron obtenidos por SCS y caracterizados por XRD, ICP-OES, SEM y TEM. Los pigmentos fueron incorporados a imprimantes alquídicos medios en aceite en tres proporciones de 5%, 10% y 20% en peso pigmentos/resina. Probetas de acero protegidas con las formulaciones alquídicas fueron ensayadas en cámaras de niebla salina y dióxido de azufre. Asimismo, la eficiencia inhibidora de los pigmentos fue estimada mediante ensayos electroquímicos (método de Tafel) en solución 0,1 M de NaCl. Los resultados mostraron que el CoO mejora las propiedades inhibidoras de los nano-pigmentos base ZnO obtenidos por SCS.
PALABRAS CLAVE: Corrosión; Nanopartículas; Óxido de cobalto; Óxido de zinc; Protección anticorrosiva; Síntesis por combustión de solución
Citar como/Citation: Flores, S.; Chumpitaz, O. (2019). “Efecto del cobalto sobre nano-partículas de óxido de zinc en el desempeño anticorrosivo de un imprimante alquídico”. Rev. Metal. 55(1): e139. https://doi.org/10.3989/revmetalm.139.
ABSTRACT: Effect of cobalt on zinc oxide nanoparticles in the anticorrosive performance of an alkyd primer. The objective of this research was to study the inhibitory effect of CoO in ZnO obtained by solution combus-tion synthesis (SCS) when they are incorporated into alkyd formulations. ZnO and mixed oxides of the type Zn1-xCoxO (where x = 0.05-0.10-0.15-0.20) were obtained by SCS and characterized by XRD, ICP-OES, SEM and TEM. The pigments were incorporated into alkyd primers in three proportions, 5%, 10% and 20% by weight pigments / resin. Steel probes protected with the alkyd formulations were tested in salt spray and sulfur dioxide chambers. Likewise, the inhibiting efficiency of the pigments was estimated by electrochemical tests (Tafel method) in 0.1 M NaCl solution. The results showed that CoO improves the inhibitory properties of the ZnO based nano-pigments obtained by SCS.
KEYWORDS: Cobalt oxide; Corrosion; Corrosion protection; Nanoparticles; Solution combustion synthesis, Zinc oxide
ORCID: Santiago Flores (https://orcid.org/0000-0001-5683-7182); Oscar Chumpitaz (https://orcid.org/0000-0003- 3268-2854)
Copyright: © 2019 CSIC. Este es un artículo de acceso abierto distribuido bajo los términos de la licencia de uso y distribución Creative Commons Reconocimiento 4.0 Internacional (CC BY 4.0).
2 • S. Flores y O. Chumpitaz
Revista de Metalurgia 55(1), Enero–Marzo 2019, e139, ISSN-L: 0034-8570. https://doi.org/10.3989/revmetalm.139
1. INTRODUCCIÓN
La protección anticorrosiva mediante recubri-mientos orgánicos (pinturas anticorrosivas) actúa por diferentes mecanismos: efecto de sacrificio (pin-turas ricas en Zn), efecto barrera y efecto inhibidor.
El óxido de Zinc (ZnO) es un pigmento blanco convencional al cual se le atribuye diferentes pro-piedades, tales como su capacidad de absorción de radiación UV (protegiendo la resina) y sus mecanismos de inhibición catódica y pasivante (Koleske, 1995). Asimismo, es utilizado junto con pigmentos inhibidores activos convencionales como cromato de zinc o borosilicato de calcio aumen-tando la densidad de entrecruzamiento y dureza de películas de pintura (Koleske, 1995).
Por otro lado, los pigmentos de tamaño con-vencional para pinturas pueden generar problemas tales como pobre adhesión, flexibilidad reducida, reducción de la resistencia al impacto, a la abra-sión o al rayado, y deslaminación prematura. Para superar tales inconvenientes y mejorar su compor-tamiento el uso de nanopigmentos se ha convertido en una práctica reciente. Debido a su tamaño inhe-rentemente pequeño y a su morfología de partícula muchos de los problemas arriba mencionados pue-den ser superados (Cayton y Sawitowski, 2005).
Las nanopartículas más comúnmente usadas en recubrimientos de protección son el SiO2, TiO2, ZnO, Al2O3, Fe2O3, CaCO3, etc.
De acuerdo con Dhoke et al. (2009) se incorporó, a diferentes niveles de carga, nanopartículas de ZnO en pinturas alquídicas base agua. Los investigado-res evaluaron el comportamiento anticorrosivo de los sistemas alquídicos aplicados sobre acero en ensayos de corrosión acelerada en cámara de hume-dad, niebla salina y exposición a la radiación UV. Asimismo, evaluaron el efecto de las nanopartículas en las propiedades físicas de la película de pintura (dureza, flexibilidad, adhesión e impacto). Dhoke et al. (2009) encontraron que una extremadamente pequeña concentración de nanopartículas de ZnO puede mejorar la resistencia a la corrosión, al rayado y a la abrasión de la película de pintura. Cabe señalar que en este estudio se utilizaron nanopartículas de ZnO (< 50 nm) obtenidas comercialmente. Un estu-dio paralelo del mismo grupo de investigación con nanopartículas de Fe2O3 reportó resultados similares (Dhoke y Kanna, 2009a; Dhoke y Kanna, 2009b).
El efecto de nanopartículas de ZnO sobre la protección anticorrosivas de otros tipos genéricos de pinturas, diferentes a los sistemas alquídicos ha sido estudiado recientemente. Ramenzazadeh et al. (2011) estudiaron el efecto de diferentes cargas (2; 3,5; 5 y 6,5 %) de nanopartículas de ZnO sobre la protección anticorrosiva brindada por una película de pintura epoxi-poliamida. Probetas de acero pro-tegidas con el sistema epóxico fueron sumergidas en solución NaCl 3,5% en peso, durante 1344 h.
El comportamiento anticorrosivo fue monitoreado aplicando espectroscopía de impedancia electroquí-mica (IES). Los resultados indicaron que, a pesar de la reducción del entrecruzamiento del sistema epó-xico debido a la presencia de las nanopartículas de ZnO, las propiedades anticorrosivas de la película epóxica fue considerablemente mejorada. Esto fue atribuido a dos razones. Primero, el tamaño de las partículas de ZnO mejora la protección por efecto barrera contra la difusión de los agentes agresi-vos hacia el sustrato. Segundo, las nanopartículas pueden aumentar la resistencia contra la degrada-ción hidrolítica (Ramenzanzadeh et al., 2011) y la hidrofobicidad (Ammar et al., 2016a). Rashvand y Ranjbar (2013) realizaron un estudio similar en pin-turas de poliuretano base agua. Las nanopartículas de ZnO, obtenidas comercialmente e incorporadas al 3% en peso en el recubrimiento de poliuretano, mejoraron la resistencia a la corrosión en 2 órdenes de magnitud en condiciones de inmersión en NaCl 3,5% cuando es evaluado mediante EIS. Finalmente, (Ammar et al., 2016b) estudiaron la incorporación de nanopartículas de ZnO en un recubrimiento a base de resinas acrílica y de silicona, para lo cual fue comprobado su muy destacado efecto barrera y superior habilidad anticorrosiva.
Sin embargo, el efecto beneficioso del ZnO puede ser mejorado mediante su modificación con otros óxidos, como el óxido de cobalto. Rasouli y Danaee (2011) prepararon un óxido mixto de Zn y Co, Zn0,9Co0,10, mediante un procedimiento de síntesis cerámico y otro método de síntesis por combustión en solución (SCS). Los pigmentos, caracterizados por XRD y FTIR, fueron incorpo-rados a un recubrimiento alquídico en un porcen-taje del 2% empleando agitación mecánica seguido de ultrasonificación. Los sistemas alquídicos fueron aplicados sobre sustratos de acero, y evaluados en condiciones de inmersión en NaCl 3,5% mediante técnicas de polarización electroquímica e impe-dancia electroquímica. Concluyeron que la combi-nación de los óxidos de cobalto y zinc mejoran las propiedades anticorrosivas del pigmento obtenido. Los investigadores encontraron que el método de preparación de los pigmentos de ZnO-CoO pue-den influenciar las características de las partículas obtenidas tales como el tamaño de partícula y la forma. Así, el nanopigmento preparado mediante síntesis por combustión en solución (SCS) logro una mejor resistencia a la corrosión respecto al pig-mento sintetizado mediante reacciones de estado sólido (métodos cerámicos).
Los óxidos de color verde obtenidos fueron considerados interesantes por ser más respetuo-sos del medio ambiente que los pigmentos a base de cromo (Rasouli y Danaee, 2011). La USEPA (United States Environmental Protection Agency) ha elaborado una lista de contaminantes del aire (USEPA, 2018), entre ellos el cobalto (USEPA, 2000a)
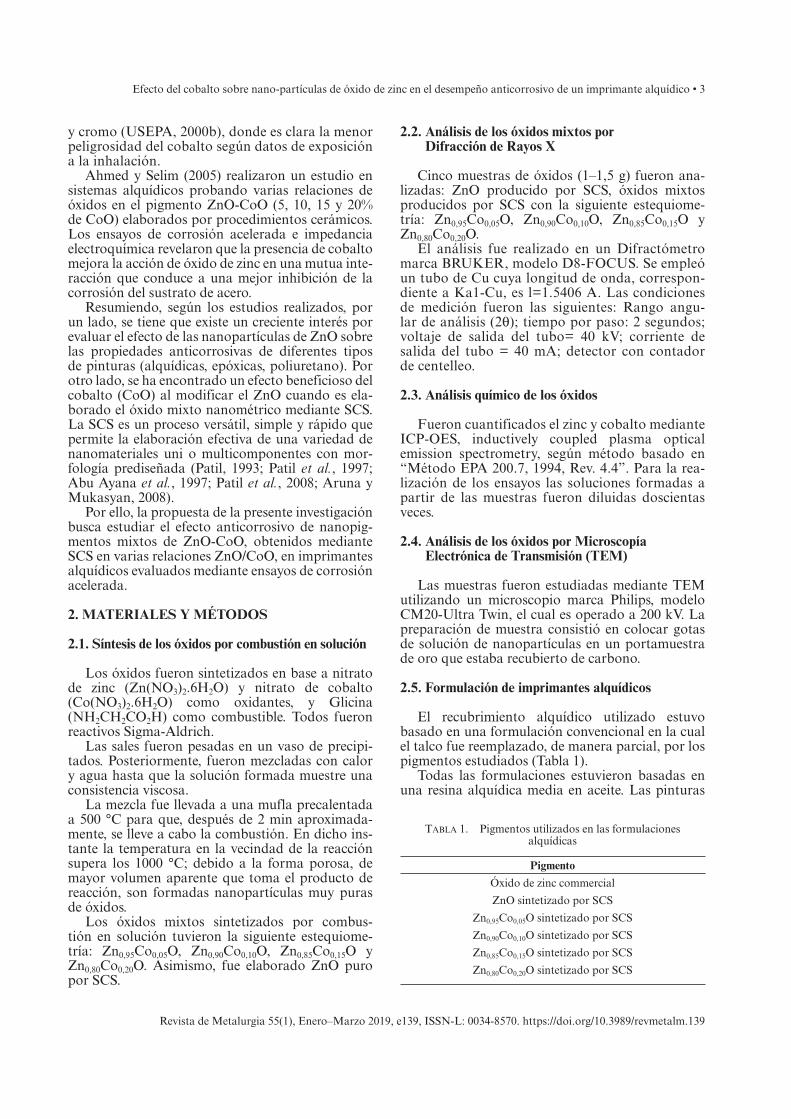
Efecto del cobalto sobre nano-partículas de óxido de zinc en el desempeño anticorrosivo de un imprimante alquídico • 3
Revista de Metalurgia 55(1), Enero–Marzo 2019, e139, ISSN-L: 0034-8570. https://doi.org/10.3989/revmetalm.139
y cromo (USEPA, 2000b), donde es clara la menor peligrosidad del cobalto según datos de exposición a la inhalación.
Ahmed y Selim (2005) realizaron un estudio en sistemas alquídicos probando varias relaciones de óxidos en el pigmento ZnO-CoO (5, 10, 15 y 20% de CoO) elaborados por procedimientos cerámicos. Los ensayos de corrosión acelerada e impedancia electroquímica revelaron que la presencia de cobalto mejora la acción de óxido de zinc en una mutua inte-racción que conduce a una mejor inhibición de la corrosión del sustrato de acero.
Resumiendo, según los estudios realizados, por un lado, se tiene que existe un creciente interés por evaluar el efecto de las nanopartículas de ZnO sobre las propiedades anticorrosivas de diferentes tipos de pinturas (alquídicas, epóxicas, poliuretano). Por otro lado, se ha encontrado un efecto beneficioso del cobalto (CoO) al modificar el ZnO cuando es ela-borado el óxido mixto nanométrico mediante SCS. La SCS es un proceso versátil, simple y rápido que permite la elaboración efectiva de una variedad de nanomateriales uni o multicomponentes con mor-fología prediseñada (Patil, 1993; Patil et al., 1997; Abu Ayana et al., 1997; Patil et al., 2008; Aruna y Mukasyan, 2008).
Por ello, la propuesta de la presente investigación busca estudiar el efecto anticorrosivo de nanopig-mentos mixtos de ZnO-CoO, obtenidos mediante SCS en varias relaciones ZnO/CoO, en imprimantes alquídicos evaluados mediante ensayos de corrosión acelerada.
2. MATERIALES Y MÉTODOS
2.1. Síntesis de los óxidos por combustión en solución
Los óxidos fueron sintetizados en base a nitrato de zinc (Zn(NO3)2.6H2O) y nitrato de cobalto (Co(NO3)2.6H2O) como oxidantes, y Glicina (NH2CH2CO2H) como combustible. Todos fueron reactivos Sigma-Aldrich.
Las sales fueron pesadas en un vaso de precipi-tados. Posteriormente, fueron mezcladas con calor y agua hasta que la solución formada muestre una consistencia viscosa.
La mezcla fue llevada a una mufla precalentada a 500 °C para que, después de 2 min aproximada-mente, se lleve a cabo la combustión. En dicho ins-tante la temperatura en la vecindad de la reacción supera los 1000 °C; debido a la forma porosa, de mayor volumen aparente que toma el producto de reacción, son formadas nanopartículas muy puras de óxidos.
Los óxidos mixtos sintetizados por combus-tión en solución tuvieron la siguiente estequiome-tría: Zn0,95Co0,05O, Zn0,90Co0,10O, Zn0,85Co0,15O y Zn0,80Co0,20O. Asimismo, fue elaborado ZnO puro por SCS.
2.2. Análisis de los óxidos mixtos por Difracción de Rayos X
Cinco muestras de óxidos (1–1,5 g) fueron ana-lizadas: ZnO producido por SCS, óxidos mixtos producidos por SCS con la siguiente estequiome-tría: Zn0,95Co0,05O, Zn0,90Co0,10O, Zn0,85Co0,15O y Zn0,80Co0,20O.
El análisis fue realizado en un Difractómetro marca BRUKER, modelo D8-FOCUS. Se empleó un tubo de Cu cuya longitud de onda, correspon-diente a Ka1-Cu, es l=1.5406 A. Las condiciones de medición fueron las siguientes: Rango angu-lar de análisis (2θ); tiempo por paso: 2 segundos; voltaje de salida del tubo= 40 kV; corriente de salida del tubo = 40 mA; detector con contador de centelleo.
2.3. Análisis químico de los óxidos
Fueron cuantificados el zinc y cobalto mediante ICP-OES, inductively coupled plasma optical emission spectrometry, según método basado en “Método EPA 200.7, 1994, Rev. 4.4”. Para la rea-lización de los ensayos las soluciones formadas a partir de las muestras fueron diluidas doscientas veces.
2.4. Análisis de los óxidos por Microscopía Electrónica de Transmisión (TEM)
Las muestras fueron estudiadas mediante TEM utilizando un microscopio marca Philips, modelo CM20-Ultra Twin, el cual es operado a 200 kV. La preparación de muestra consistió en colocar gotas de solución de nanopartículas en un portamuestra de oro que estaba recubierto de carbono.
2.5. Formulación de imprimantes alquídicos
El recubrimiento alquídico utilizado estuvo basado en una formulación convencional en la cual el talco fue reemplazado, de manera parcial, por los pigmentos estudiados (Tabla 1).
Todas las formulaciones estuvieron basadas en una resina alquídica media en aceite. Las pinturas
Tabla 1. Pigmentos utilizados en las formulaciones alquídicas
Pigmento
Óxido de zinc commercial
ZnO sintetizado por SCS
Zn0,95Co0,05O sintetizado por SCS
Zn0,90Co0,10O sintetizado por SCS
Zn0,85Co0,15O sintetizado por SCS
Zn0,80Co0,20O sintetizado por SCS
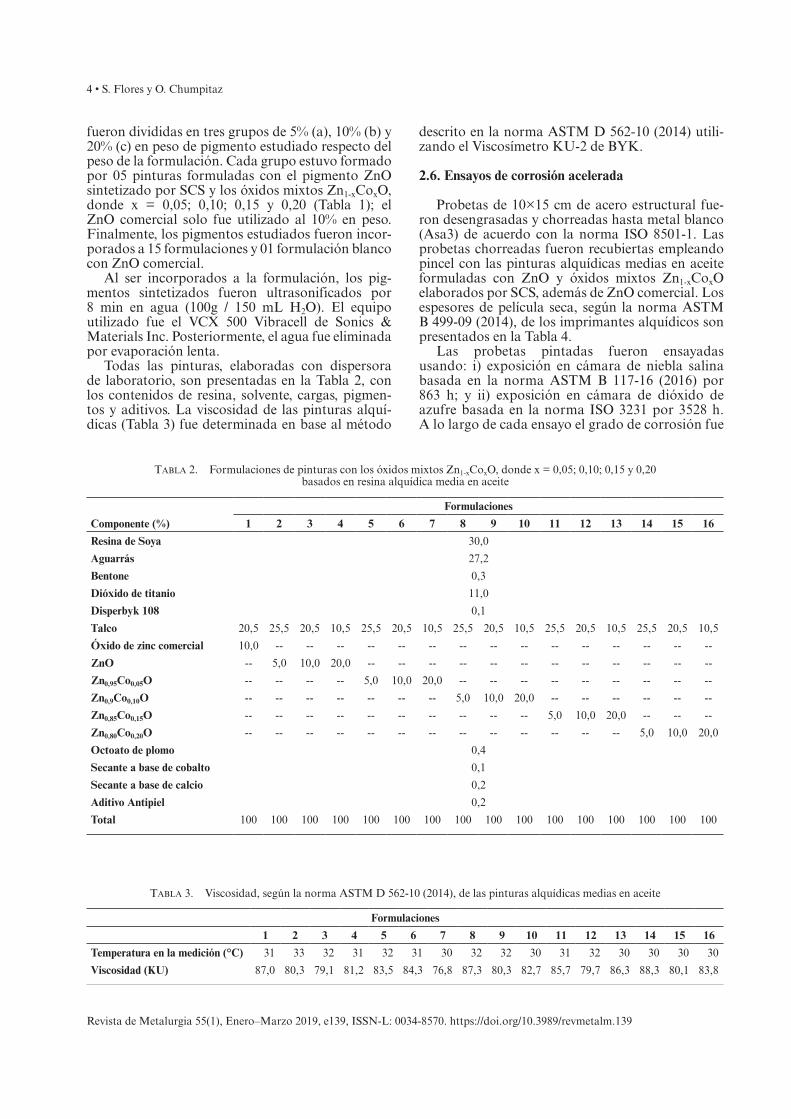
4 • S. Flores y O. Chumpitaz
Revista de Metalurgia 55(1), Enero–Marzo 2019, e139, ISSN-L: 0034-8570. https://doi.org/10.3989/revmetalm.139
fueron divididas en tres grupos de 5% (a), 10% (b) y 20% (c) en peso de pigmento estudiado respecto del peso de la formulación. Cada grupo estuvo formado por 05 pinturas formuladas con el pigmento ZnO sintetizado por SCS y los óxidos mixtos Zn1-xCoxO, donde x = 0,05; 0,10; 0,15 y 0,20 (Tabla 1); el ZnO comercial solo fue utilizado al 10% en peso. Finalmente, los pigmentos estudiados fueron incor-porados a 15 formulaciones y 01 formulación blanco con ZnO comercial.
Al ser incorporados a la formulación, los pig-mentos sintetizados fueron ultrasonificados por 8 min en agua (100g / 150 mL H2O). El equipo utilizado fue el VCX 500 Vibracell de Sonics & Materials Inc. Posteriormente, el agua fue eliminada por evaporación lenta.
Todas las pinturas, elaboradas con dispersora de laboratorio, son presentadas en la Tabla 2, con los contenidos de resina, solvente, cargas, pigmen-tos y aditivos. La viscosidad de las pinturas alquí-dicas (Tabla 3) fue determinada en base al método
descrito en la norma ASTM D 562-10 (2014) utili-zando el Viscosímetro KU-2 de BYK.
2.6. Ensayos de corrosión acelerada
Probetas de 10×15 cm de acero estructural fue-ron desengrasadas y chorreadas hasta metal blanco (Asa3) de acuerdo con la norma ISO 8501-1. Las probetas chorreadas fueron recubiertas empleando pincel con las pinturas alquídicas medias en aceite formuladas con ZnO y óxidos mixtos Zn1-xCoxO elaborados por SCS, además de ZnO comercial. Los espesores de película seca, según la norma ASTM B 499-09 (2014), de los imprimantes alquídicos son presentados en la Tabla 4.
Las probetas pintadas fueron ensayadas usando: i) exposición en cámara de niebla salina basada en la norma ASTM B 117-16 (2016) por 863 h; y ii) exposición en cámara de dióxido de azufre basada en la norma ISO 3231 por 3528 h. A lo largo de cada ensayo el grado de corrosión fue
Tabla 2. Formulaciones de pinturas con los óxidos mixtos Zn1-xCoxO, donde x = 0,05; 0,10; 0,15 y 0,20 basados en resina alquídica media en aceite
Componente (%)
Formulaciones
1 2 3 4 5 6 7 8 9 10 11 12 13 14 15 16
Resina de Soya 30,0
Aguarrás 27,2
Bentone 0,3
Dióxido de titanio 11,0
Disperbyk 108 0,1
Talco 20,5 25,5 20,5 10,5 25,5 20,5 10,5 25,5 20,5 10,5 25,5 20,5 10,5 25,5 20,5 10,5
Óxido de zinc comercial 10,0 -- -- -- -- -- -- -- -- -- -- -- -- -- -- --
ZnO -- 5,0 10,0 20,0 -- -- -- -- -- -- -- -- -- -- -- --
Zn0,95Co0,05O -- -- -- -- 5,0 10,0 20,0 -- -- -- -- -- -- -- -- --
Zn0,9Co0,10O -- -- -- -- -- -- -- 5,0 10,0 20,0 -- -- -- -- -- --
Zn0,85Co0,15O -- -- -- -- -- -- -- -- -- -- 5,0 10,0 20,0 -- -- --
Zn0,80Co0,20O -- -- -- -- -- -- -- -- -- -- -- -- -- 5,0 10,0 20,0
Octoato de plomo 0,4
Secante a base de cobalto 0,1
Secante a base de calcio 0,2
Aditivo Antipiel 0,2
Total 100 100 100 100 100 100 100 100 100 100 100 100 100 100 100 100
Tabla 3. Viscosidad, según la norma ASTM D 562-10 (2014), de las pinturas alquídicas medias en aceite
Formulaciones
1 2 3 4 5 6 7 8 9 10 11 12 13 14 15 16
Temperatura en la medición (°C) 31 33 32 31 32 31 30 32 32 30 31 32 30 30 30 30
Viscosidad (KU) 87,0 80,3 79,1 81,2 83,5 84,3 76,8 87,3 80,3 82,7 85,7 79,7 86,3 88,3 80,1 83,8
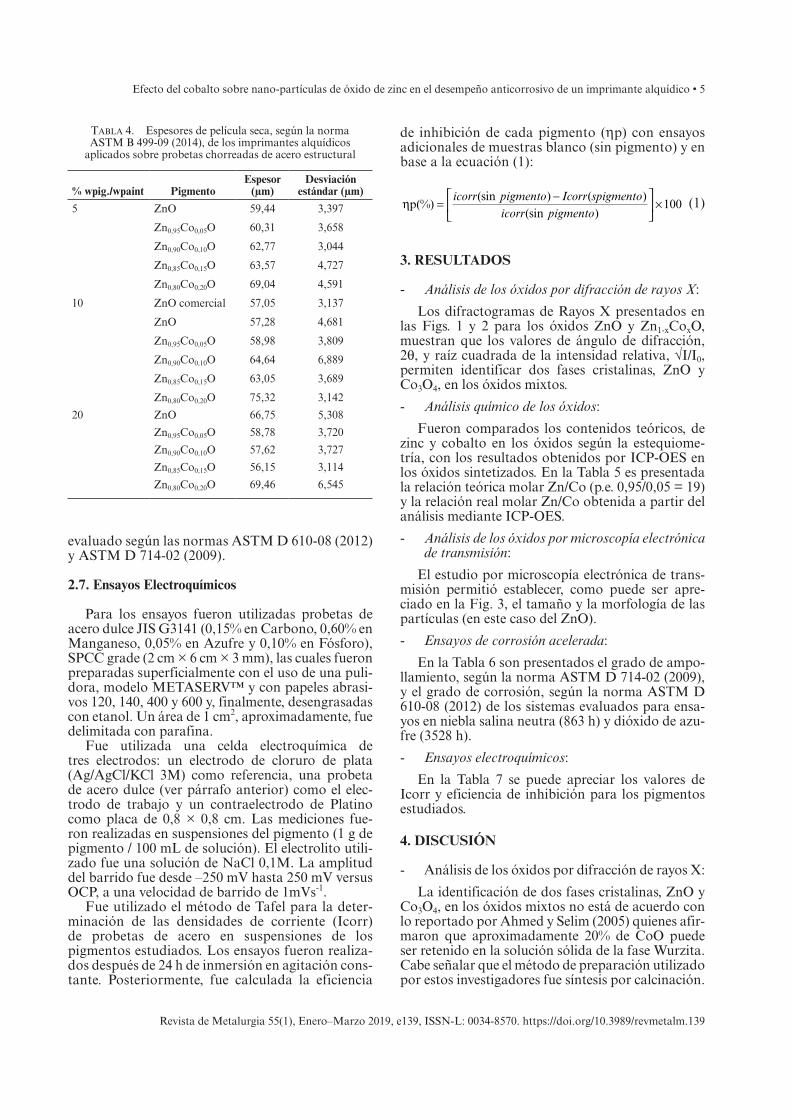
Efecto del cobalto sobre nano-partículas de óxido de zinc en el desempeño anticorrosivo de un imprimante alquídico • 5
Revista de Metalurgia 55(1), Enero–Marzo 2019, e139, ISSN-L: 0034-8570. https://doi.org/10.3989/revmetalm.139
evaluado según las normas ASTM D 610-08 (2012) y ASTM D 714-02 (2009).
2.7. Ensayos Electroquímicos
Para los ensayos fueron utilizadas probetas de acero dulce JIS G3141 (0,15% en Carbono, 0,60% en Manganeso, 0,05% en Azufre y 0,10% en Fósforo), SPCC grade (2 cm × 6 cm × 3 mm), las cuales fueron preparadas superficialmente con el uso de una puli-dora, modelo METASERV™ y con papeles abrasi-vos 120, 140, 400 y 600 y, finalmente, desengrasadas con etanol. Un área de 1 cm2, aproximadamente, fue delimitada con parafina.
Fue utilizada una celda electroquímica de tres electrodos: un electrodo de cloruro de plata (Ag/AgCl/KCl 3M) como referencia, una probeta de acero dulce (ver párrafo anterior) como el elec-trodo de trabajo y un contraelectrodo de Platino como placa de 0,8 × 0,8 cm. Las mediciones fue-ron realizadas en suspensiones del pigmento (1 g de pigmento / 100 mL de solución). El electrolito utili-zado fue una solución de NaCl 0,1M. La amplitud del barrido fue desde –250 mV hasta 250 mV versus OCP, a una velocidad de barrido de 1mVs-1.
Fue utilizado el método de Tafel para la deter-minación de las densidades de corriente (Icorr) de probetas de acero en suspensiones de los pigmentos estudiados. Los ensayos fueron realiza-dos después de 24 h de inmersión en agitación cons-tante. Posteriormente, fue calculada la eficiencia
de inhibición de cada pigmento (ηp) con ensayos adicionales de muestras blanco (sin pigmento) y en base a la ecuación (1):
η =−
×
icorr pigmento Icorr spigmentoicorr pigmento
p(%)(sin ) ( )
(sin )100 (1)
3. RESULTADOS
- Análisis de los óxidos por difracción de rayos X:
Los difractogramas de Rayos X presentados en las Figs. 1 y 2 para los óxidos ZnO y Zn1-xCoxO, muestran que los valores de ángulo de difracción, 2θ, y raíz cuadrada de la intensidad relativa, √I/I0, permiten identificar dos fases cristalinas, ZnO y Co3O4, en los óxidos mixtos.
- Análisis químico de los óxidos:
Fueron comparados los contenidos teóricos, de zinc y cobalto en los óxidos según la estequiome-tría, con los resultados obtenidos por ICP-OES en los óxidos sintetizados. En la Tabla 5 es presentada la relación teórica molar Zn/Co (p.e. 0,95/0,05 = 19) y la relación real molar Zn/Co obtenida a partir del análisis mediante ICP-OES.
- Análisis de los óxidos por microscopía electrónica de transmisión:
El estudio por microscopía electrónica de trans-misión permitió establecer, como puede ser apre-ciado en la Fig. 3, el tamaño y la morfología de las partículas (en este caso del ZnO).
- Ensayos de corrosión acelerada:
En la Tabla 6 son presentados el grado de ampo-llamiento, según la norma ASTM D 714-02 (2009), y el grado de corrosión, según la norma ASTM D 610-08 (2012) de los sistemas evaluados para ensa-yos en niebla salina neutra (863 h) y dióxido de azu-fre (3528 h).
- Ensayos electroquímicos:
En la Tabla 7 se puede apreciar los valores de Icorr y eficiencia de inhibición para los pigmentos estudiados.
4. DISCUSIÓN
- Análisis de los óxidos por difracción de rayos X:
La identificación de dos fases cristalinas, ZnO y Co3O4, en los óxidos mixtos no está de acuerdo con lo reportado por Ahmed y Selim (2005) quienes afir-maron que aproximadamente 20% de CoO puede ser retenido en la solución sólida de la fase Wurzita. Cabe señalar que el método de preparación utilizado por estos investigadores fue síntesis por calcinación.
Tabla 4. Espesores de película seca, según la norma ASTM B 499-09 (2014), de los imprimantes alquídicos
aplicados sobre probetas chorreadas de acero estructural
% wpig./wpaint PigmentoEspesor
(µm)Desviación
estándar (µm)
5 ZnO 59,44 3,397
Zn0,95Co0,05O 60,31 3,658
Zn0,90Co0,10O 62,77 3,044
Zn0,85Co0,15O 63,57 4,727
Zn0,80Co0,20O 69,04 4,591
10 ZnO comercial 57,05 3,137
ZnO 57,28 4,681
Zn0,95Co0,05O 58,98 3,809
Zn0,90Co0,10O 64,64 6,889
Zn0,85Co0,15O 63,05 3,689
Zn0,80Co0,20O 75,32 3,142
20 ZnO 66,75 5,308
Zn0,95Co0,05O 58,78 3,720
Zn0,90Co0,10O 57,62 3,727
Zn0,85Co0,15O 56,15 3,114
Zn0,80Co0,20O 69,46 6,545
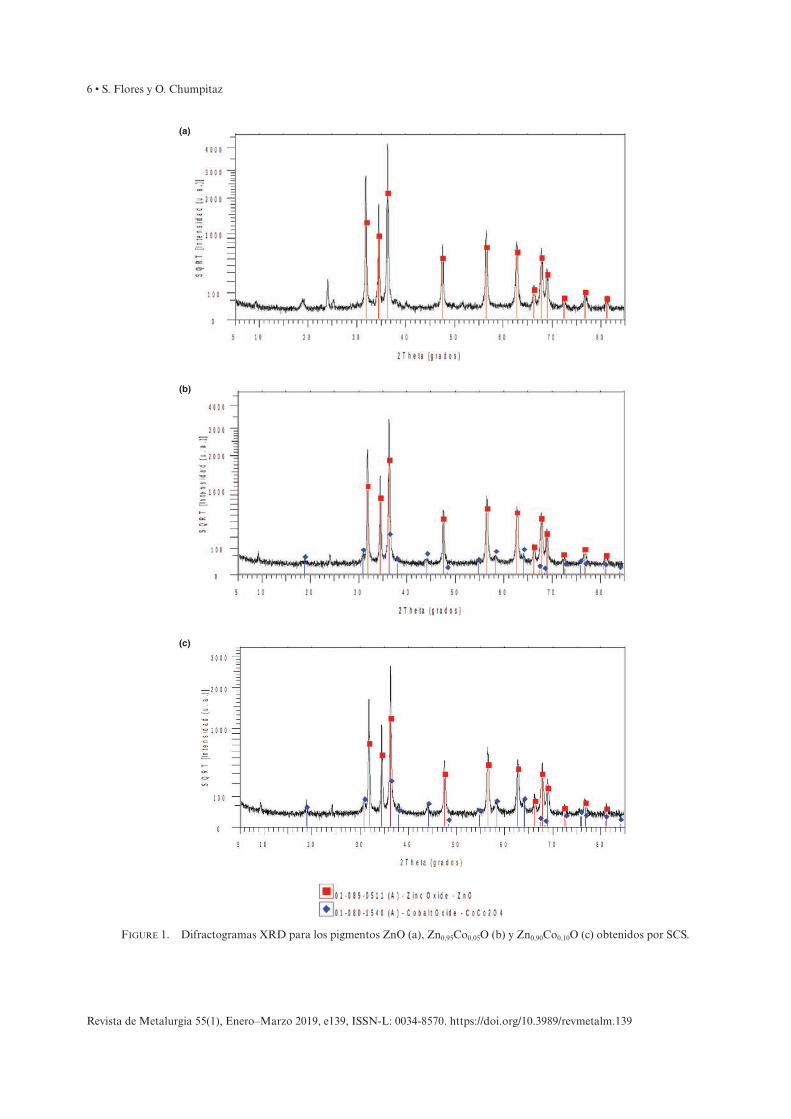
6 • S. Flores y O. Chumpitaz
Revista de Metalurgia 55(1), Enero–Marzo 2019, e139, ISSN-L: 0034-8570. https://doi.org/10.3989/revmetalm.139
Figure 1. Difractogramas XRD para los pigmentos ZnO (a), Zn0,95Co0,05O (b) y Zn0,90Co0,10O (c) obtenidos por SCS.
(b)
(c)
(a)
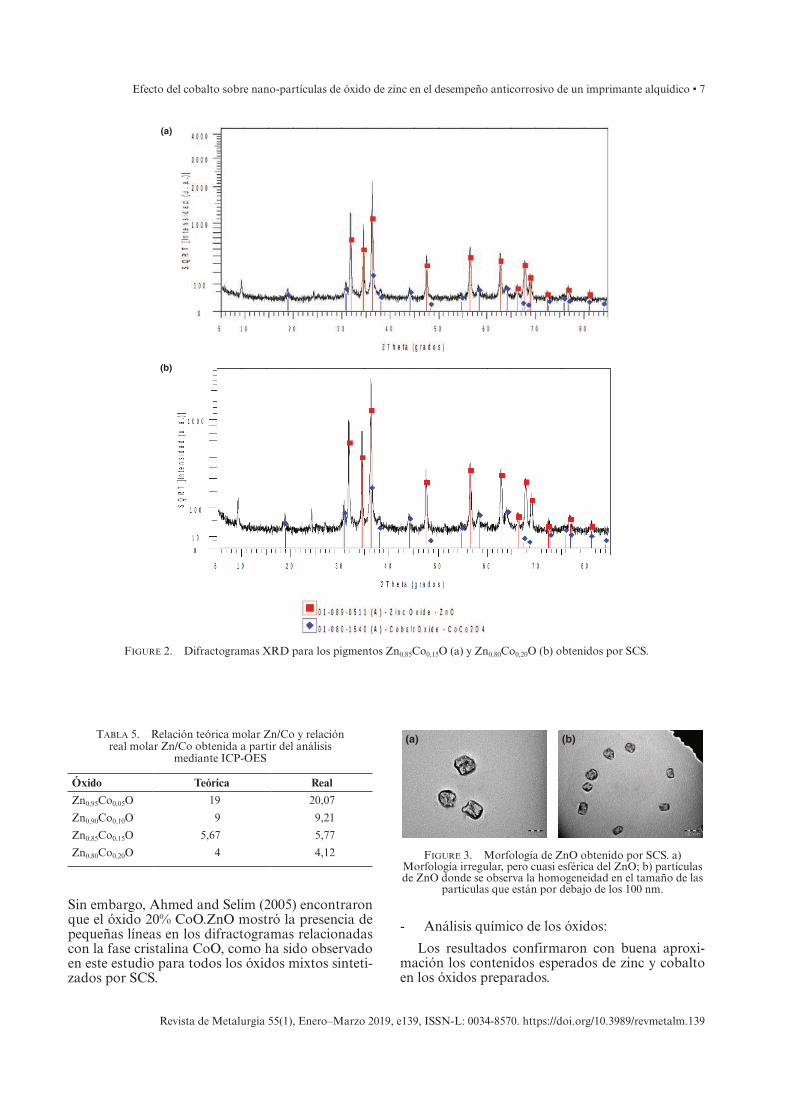
Efecto del cobalto sobre nano-partículas de óxido de zinc en el desempeño anticorrosivo de un imprimante alquídico • 7
Revista de Metalurgia 55(1), Enero–Marzo 2019, e139, ISSN-L: 0034-8570. https://doi.org/10.3989/revmetalm.139
Sin embargo, Ahmed and Selim (2005) encontraron que el óxido 20% CoO.ZnO mostró la presencia de pequeñas líneas en los difractogramas relacionadas con la fase cristalina CoO, como ha sido observado en este estudio para todos los óxidos mixtos sinteti-zados por SCS.
- Análisis químico de los óxidos:
Los resultados confirmaron con buena aproxi-mación los contenidos esperados de zinc y cobalto en los óxidos preparados.
Figure 2. Difractogramas XRD para los pigmentos Zn0,85Co0,15O (a) y Zn0,80Co0,20O (b) obtenidos por SCS.
(b)
(a)
Tabla 5. Relación teórica molar Zn/Co y relación real molar Zn/Co obtenida a partir del análisis
mediante ICP-OES
Óxido Teórica Real
Zn0,95Co0,05O 19 20,07
Zn0,90Co0,10O 9 9,21
Zn0,85Co0,15O 5,67 5,77
Zn0,80Co0,20O 4 4,12
(a) (b)
Figure 3. Morfología de ZnO obtenido por SCS. a) Morfología irregular, pero cuasi esférica del ZnO; b) partículas de ZnO donde se observa la homogeneidad en el tamaño de las
partículas que están por debajo de los 100 nm.
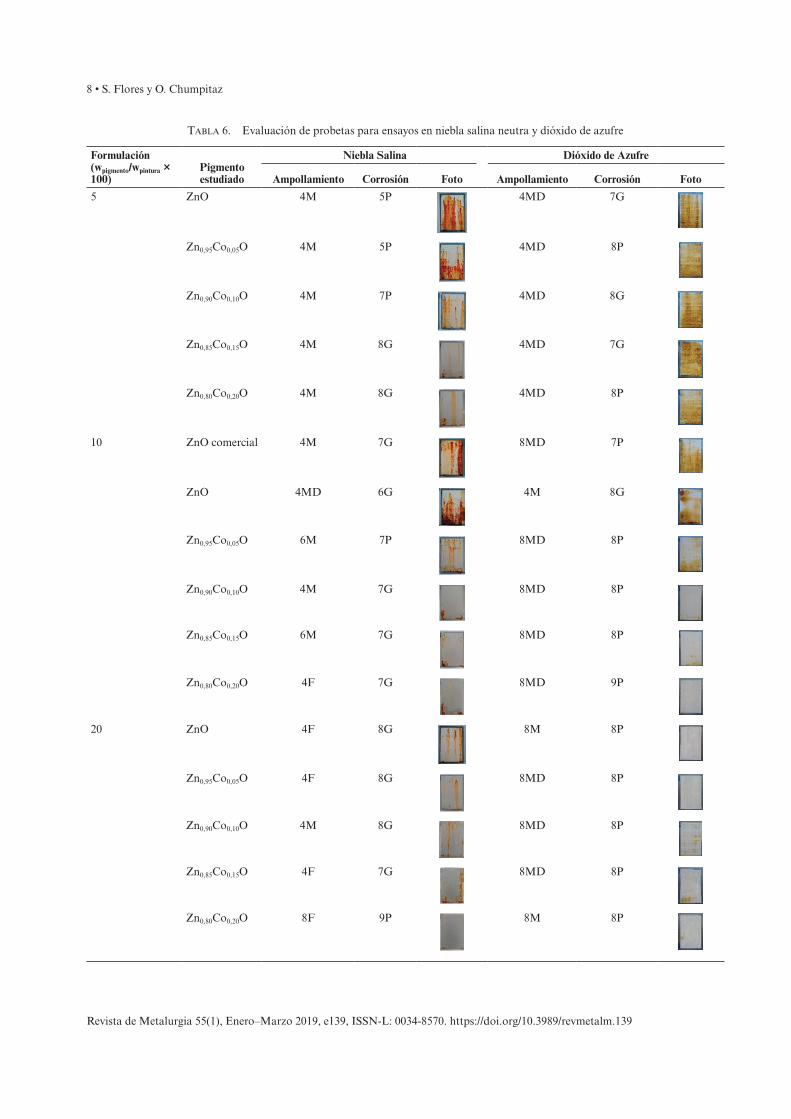
8 • S. Flores y O. Chumpitaz
Revista de Metalurgia 55(1), Enero–Marzo 2019, e139, ISSN-L: 0034-8570. https://doi.org/10.3989/revmetalm.139
Tabla 6. Evaluación de probetas para ensayos en niebla salina neutra y dióxido de azufre
Formulación (wpigmento/wpintura × 100)
Pigmento estudiado
Niebla Salina Dióxido de Azufre
Ampollamiento Corrosión Foto Ampollamiento Corrosión Foto
5 ZnO 4M 5P 4MD 7G
Zn0,95Co0,05O 4M 5P 4MD 8P
Zn0,90Co0,10O 4M 7P 4MD 8G
Zn0,85Co0,15O 4M 8G 4MD 7G
Zn0,80Co0,20O 4M 8G 4MD 8P
10 ZnO comercial 4M 7G 8MD 7P
ZnO 4MD 6G 4M 8G
Zn0,95Co0,05O 6M 7P 8MD 8P
Zn0,90Co0,10O 4M 7G 8MD 8P
Zn0,85Co0,15O 6M 7G 8MD 8P
Zn0,80Co0,20O 4F 7G 8MD 9P
20 ZnO 4F 8G 8M 8P
Zn0,95Co0,05O 4F 8G 8MD 8P
Zn0,90Co0,10O 4M 8G 8MD 8P
Zn0,85Co0,15O 4F 7G 8MD 8P
Zn0,80Co0,20O 8F 9P 8M 8P
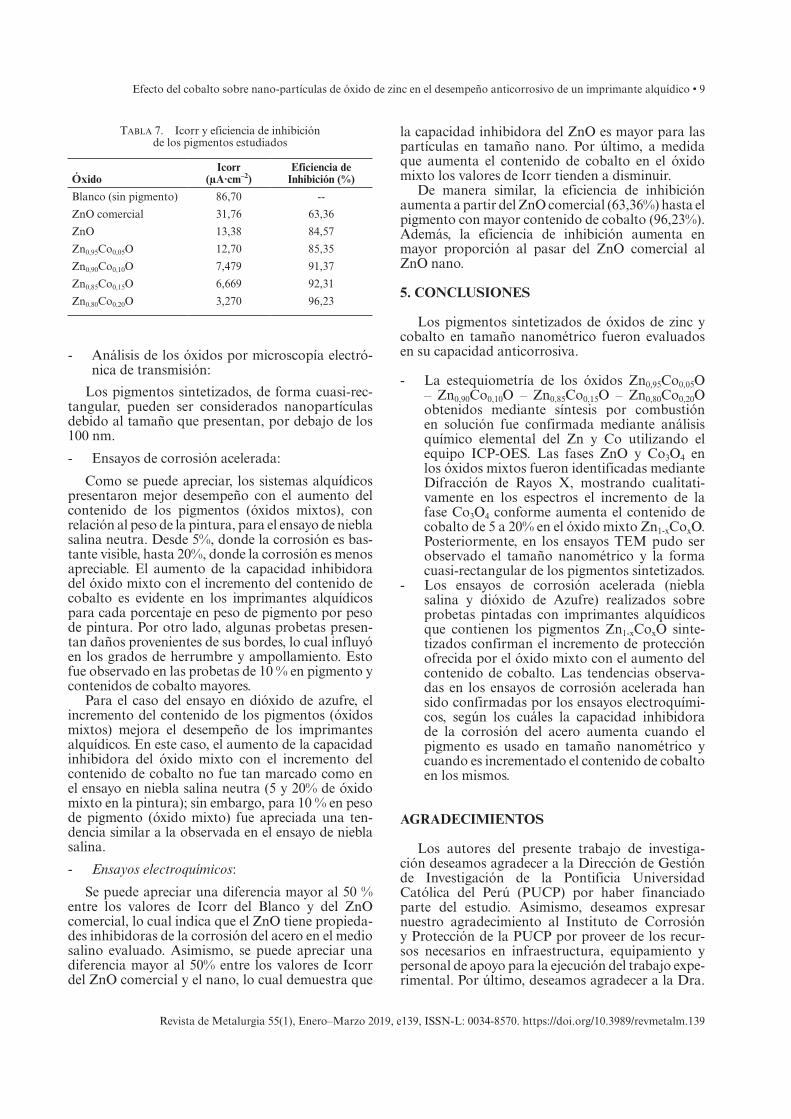
Efecto del cobalto sobre nano-partículas de óxido de zinc en el desempeño anticorrosivo de un imprimante alquídico • 9
Revista de Metalurgia 55(1), Enero–Marzo 2019, e139, ISSN-L: 0034-8570. https://doi.org/10.3989/revmetalm.139
- Análisis de los óxidos por microscopía electró-nica de transmisión:
Los pigmentos sintetizados, de forma cuasi-rec-tangular, pueden ser considerados nanopartículas debido al tamaño que presentan, por debajo de los 100 nm.
- Ensayos de corrosión acelerada:
Como se puede apreciar, los sistemas alquídicos presentaron mejor desempeño con el aumento del contenido de los pigmentos (óxidos mixtos), con relación al peso de la pintura, para el ensayo de niebla salina neutra. Desde 5%, donde la corrosión es bas-tante visible, hasta 20%, donde la corrosión es menos apreciable. El aumento de la capacidad inhibidora del óxido mixto con el incremento del contenido de cobalto es evidente en los imprimantes alquídicos para cada porcentaje en peso de pigmento por peso de pintura. Por otro lado, algunas probetas presen-tan daños provenientes de sus bordes, lo cual influyó en los grados de herrumbre y ampollamiento. Esto fue observado en las probetas de 10 % en pigmento y contenidos de cobalto mayores.
Para el caso del ensayo en dióxido de azufre, el incremento del contenido de los pigmentos (óxidos mixtos) mejora el desempeño de los imprimantes alquídicos. En este caso, el aumento de la capacidad inhibidora del óxido mixto con el incremento del contenido de cobalto no fue tan marcado como en el ensayo en niebla salina neutra (5 y 20% de óxido mixto en la pintura); sin embargo, para 10 % en peso de pigmento (óxido mixto) fue apreciada una ten-dencia similar a la observada en el ensayo de niebla salina.
- Ensayos electroquímicos:
Se puede apreciar una diferencia mayor al 50 % entre los valores de Icorr del Blanco y del ZnO comercial, lo cual indica que el ZnO tiene propieda-des inhibidoras de la corrosión del acero en el medio salino evaluado. Asimismo, se puede apreciar una diferencia mayor al 50% entre los valores de Icorr del ZnO comercial y el nano, lo cual demuestra que
la capacidad inhibidora del ZnO es mayor para las partículas en tamaño nano. Por último, a medida que aumenta el contenido de cobalto en el óxido mixto los valores de Icorr tienden a disminuir.
De manera similar, la eficiencia de inhibición aumenta a partir del ZnO comercial (63,36%) hasta el pigmento con mayor contenido de cobalto (96,23%). Además, la eficiencia de inhibición aumenta en mayor proporción al pasar del ZnO comercial al ZnO nano.
5. CONCLUSIONES
Los pigmentos sintetizados de óxidos de zinc y cobalto en tamaño nanométrico fueron evaluados en su capacidad anticorrosiva.
- La estequiometría de los óxidos Zn0,95Co0,05O – Zn0,90Co0,10O – Zn0,85Co0,15O – Zn0,80Co0,20O obtenidos mediante síntesis por combustión en solución fue confirmada mediante análisis químico elemental del Zn y Co utilizando el equipo ICP-OES. Las fases ZnO y Co3O4 en los óxidos mixtos fueron identificadas mediante Difracción de Rayos X, mostrando cualitati-vamente en los espectros el incremento de la fase Co3O4 conforme aumenta el contenido de cobalto de 5 a 20% en el óxido mixto Zn1-xCoxO. Posteriormente, en los ensayos TEM pudo ser observado el tamaño nanométrico y la forma cuasi-rectangular de los pigmentos sintetizados.
- Los ensayos de corrosión acelerada (niebla salina y dióxido de Azufre) realizados sobre probetas pintadas con imprimantes alquídicos que contienen los pigmentos Zn1-xCoxO sinte-tizados confirman el incremento de protección ofrecida por el óxido mixto con el aumento del contenido de cobalto. Las tendencias observa-das en los ensayos de corrosión acelerada han sido confirmadas por los ensayos electroquími-cos, según los cuáles la capacidad inhibidora de la corrosión del acero aumenta cuando el pigmento es usado en tamaño nanométrico y cuando es incrementado el contenido de cobalto en los mismos.
AGRADECIMIENTOS
Los autores del presente trabajo de investiga-ción deseamos agradecer a la Dirección de Gestión de Investigación de la Pontificia Universidad Católica del Perú (PUCP) por haber financiado parte del estudio. Asimismo, deseamos expresar nuestro agradecimiento al Instituto de Corrosión y Protección de la PUCP por proveer de los recur-sos necesarios en infraestructura, equipamiento y personal de apoyo para la ejecución del trabajo expe-rimental. Por último, deseamos agradecer a la Dra.
Tabla 7. Icorr y eficiencia de inhibición de los pigmentos estudiados
ÓxidoIcorr
(µA·cm–2)Eficiencia de
Inhibición (%)
Blanco (sin pigmento) 86,70 --
ZnO comercial 31,76 63,36
ZnO 13,38 84,57
Zn0,95Co0,05O 12,70 85,35
Zn0,90Co0,10O 7,479 91,37
Zn0,85Co0,15O 6,669 92,31
Zn0,80Co0,20O 3,270 96,23
10 • S. Flores y O. Chumpitaz
Revista de Metalurgia 55(1), Enero–Marzo 2019, e139, ISSN-L: 0034-8570. https://doi.org/10.3989/revmetalm.139
Maribel Guzmán (PUCP) y a la Universidad de Lovaina por los análisis de Microscopía Electrónica de Transmisión.
REFERENCIAS
Abu Ayana, Y.M., El-Sawy, S.M., Salah, S.H. (1997). Zinc-ferrite pigment for corrosion protection. Anti-Corrosion Methods and Materials 44 (6), 381–388. https://doi.org/10.1108/00035599710367681.
Ahmed, N.M., Selim, M.M. (2005). The effect of cobalt oxide on zinc oxide in a new anticorrosive green pigment. Anti-Corrosion Methods and Materials 52 (6), 353–364. https://doi.org/10.1108/00035590510624695.
Ammar. Sh., Ramesh, K., Vengadaesvaran, B., Ramesh, A.K., Arof, A.K. (2016a). Amelioration of anticorrosion and hydrophobic properties of epoxy/PDMS composite coatings containing nano ZnO particles. Prog. Org. Coat. 92, 54–65. https://doi.org/10.1016/j.porgcoat.2015.12.007.
Ammar, Sh., Ramesh, K, Vengadaesvaran, B., Ramesh, S., Arof, A.K. (2016b). Formulation and characterization of hybrid polymeric/ZnO nanocomposite coatings with remarkable anti-corrosion and hydrophobic characteris-tics. J. Coat. Technol. Res. 13 (5), 921–930. https://doi.org/10.1007/s11998-016-9799-z.
Aruna, S.T., Mukasyan, A.S. (2008). Combustion synthesis and nanomaterials. Curr. Opin. Solid St. Mat. Sci. 12 (3–4), 44–50. https://doi.org/10.1016/j.cossms.2008.12.002.
ASTM D 714-02 (2009). Standard Test Method for Evaluating Degree of Blistering of Paints. ASTM International, West Conshohocken, PA, USA.
ASTM D 610-08 (2012). Standard Practice for Evaluating Degree of Rusting on Painted Steel Surfaces. ASTM Inter-national, West Conshohocken, PA, USA.
ASTM B 499-09 (2014). Standard Test Method for Measure-ment of Coating Thicknesses by the Magnetic Method: Nonmagnetic Coatings on Magnetic Basis Metals. ASTM International, West Conshohocken, PA, USA.
ASTM D 562-10 (2014). Standard Test Method for Consistency of Paints Measuring Krebs Unit (KU) Viscosity Using a Stormer-Type Viscometer. ASTM International, West Conshohocken, PA, USA.
ASTM B 117-16 (2016). Standard Practice for Operating Salt Spray (Fog) Apparatus. ASTM International, West Conshohocken, PA, USA.
Cayton, R.H., Sawitowski, T. (2005). The Impact of Nano-Materials on Coatings Technologies. Technical Proce-edings NSTI-Nanotech 2005. Vol. 2, Chapter 2, Nano Composites. https://www.nsti.org/publications/Nanotech/ 2005/pdf/829.pdf.
Dhoke, S.K., Khanna, A.S., Mangal Sinha, T.J. (2009). Effect of nano-ZnO particles on the corrosion behavior of alkyd-based waterborne coatings. Prog. Org. Coat. 64 (4), 371–382. https://doi.org/10.1016/j.porgcoat.2008. 07.023.
Dhoke, S.K., Khanna, A.S. (2009a). Effect of nano-Fe2O3 parti-cles on the corrosion behavior of alkyd-based waterborne coatings. Corros. Sci. 51 (1), 6–20. https://doi.org/10.1016/j.corsci.2008.09.028.
Dhoke, S.K., Khanna, A.S. (2009b). Electrochemical behavior of nano-iron oxide modified alkyd based waterborne coa-tings. Mater. Chem. Phys. 117 (2–3), 550–556. https://doi.org/10.1016/j.matchemphys.2009.07.010.
Koleske, J.V. (1995). Paint and Coating Testing Manual. ASTM, 14th Edition, Philadelphia.
Patil, K.C. (1993). Advanced ceramics: Combustion synthesis and properties. Bull. Mater. Sci. 16 (6), 533–541. https://doi.org/10.1007/BF02757654.
Patil, K.C., Aruna, S.T., Ekambaram, S. (1997). Combus-tion synthesis. Curr. Opin. Solid St. Mat. Sci. 2 (2), 158–165. https://ac.els-cdn.com/S1359028697800605/1-s2.0-S1359028697800605-main.pdf ?_tid=82757472-ff56-449b-9b44-27e5ee7a5ca9&acdnat=1550661066_5b882c3caa43912be2f21454b4a9bf29.
Patil, K.C., Hedge, M.S., Tanu Rattan, Aruna, S.T. (2008). Che-mistry of Nanocrystalline Oxide Materials. Combustion Synthesis, Properties and Applications. World Scientific, New Jersey.
Ramezanzadeh, B., Attar, M.M., Farzam, M. (2011). A study on the anticorrosion performance of the epoxy–polyamide nanocomposites containing ZnO nanoparticles. Prog. Org. Coat. 72 (3), 410–422. https://doi.org/10.1016/j.porgcoat. 2011.05.014.
Rashvand, M., Ranjbar, Z. (2013). Effect of nano-ZnO particles on the corrosion resistance of polyurethane-based water-borne coatings immersed in sodium chloride solution via EIS technique. Prog. Org. Coat. 76 (10), 1413–1417. https://doi.org/10.1016/j.porgcoat.2013.04.013.
Rasouli, S., Danaee, I. (2011). Effect of preparation method on the anti-corrosive properties of nanocrystalline Zn-CoO ceramic pigments. Mater. Corros. 62 (5), 405–410. https://doi.org/10.1002/maco.201005758.
USEPA (2000a). Cobalt Compounds. United States Environmen-tal Protection Agency. Consulta: 20 de febrero de 2019.
USEPA (2000b). Chromium Compounds. United States Environ-mental Protection Agency. Consulta: 20 de febrero de 2019. https://www.epa.gov/sites/production/files/2016-09/docu-ments/chromium-compounds.pdf.
USEPA (2018). Health Effects Notebook for Hazardous Air Pollu-tants. United States Environmental Protection Agency. Consulta: 20 de febrero de 2019.https://www.epa.gov/haps/health-effects-notebook- hazardous-air-pollutants.
Revista de MetaluRgia January–March 2019, 55 (1), e140
ISSN-L: 0034-8570https://doi.org/10.3989/revmetalm.140
Effect of the welding environment and storage time of electrodes on the diffusible hydrogen content in deposited metal
Jacek Tomkówa,*, Dariusz Fydrycha , Grzegorz Rogalskia, Jerzy Łabanowskia
aGdańsk University of Technology (GUT), Narutowicza 11/12, 80-233 Gdańsk, Poland(*Corresponding author: [email protected])
Submitted: 13 February 2018; Accepted: 14 February 2019; Available On-line: 04 April 2019
ABSTRACT: In the study the glycerin displacement method was used for determination of diffusible hydrogen content in deposited metal. Specimens were welded in the air and in the water with covered rutile electrodes. The first part of the specimens was made immediately after opening the package of the electrodes. The electrodes were then stored in opened packages in laboratory conditions that allowed for contact with the air for three years. After that time, the second part of the samples was made. The results of the measurements of the diffus-ible hydrogen amount in deposited metal ranged from 32.61 to 39.95 ml/100 g for specimens welded in the air and from 51.50 to 61.34 ml/100 g for specimens made in the water. The statistical analyses were performed in a Statistical software package using the ANOVA module (one-way analysis of variance) with an assumed signifi-cance level α = 0.05. The assumption of normality was verified by the Shapiro-Wilk test. The homogeneity of variance was verified by the Levene test. In the next step, post-hoc analyzes were made. The aim was to deter-mine which averages are significantly different. Scheffe, Tukey, NIR Fisher, Newman-Keuls and Duncan tests were used. Possible changes in the diffusible hydrogen content in deposited metal resulting from storage time of electrodes (3 years) were verified by Student’s t-test. All of the statistical analysis shows that the storage time of the electrodes has no significant influence on the diffusible hydrogen content in deposited metal regardless of the welding environment.
KEYWORDS: Covered electrodes; Diffusible hydrogen; Glycerin method; Underwater welding; Weldability; Wet welding
Citation/Citar como: Tomków, J., Fydrych, D., Rogalski, G., Łabanowski, J. (2019). “Effect of the welding environment and storage time of electrodes on the diffusible hydrogen content in deposited metal”. Rev. Metal. 55(1): e140. https://doi.org/10.3989/revmetalm.140
RESUMEN: Efecto del sistema de apantallamiento de la soldadura y el tiempo de almacenaje de los electrodos en el contenido de hidrógeno difundido en el metal depositado. El método de desplazamiento de la glicerina se utilizó para determinar el contenido de hidrógeno difundido en el metal depositado. Las muestras se soldaron en aire y en agua con electrodos recubiertos de rutilo. En la primera parte, las se soldaron inmediatamente después de abrir el paquete con los electrodos. Posteriormente, los electrodos se almacenaron en paquetes abiertos en el ambiente de laboratorio durante 3 años. Pasado este tiempo, se realizó la segunda parte de las muestras. Los resultados de las mediciones de la cantidad de hidrógeno difundido en el metal depositado varió de 32,61 a 39,95 ml/100 g para muestras soldadas al aire y de 51,50 a 61,34 ml/100 g para muestras soldadas en agua. Los análisis estadísticos se realizaron utilizando el software Statistica, módulo ANOVA (análisis de varianza de una vía) con un supuesto nivel de validez α=0,05. La normalidad fue verificada por el ensayo Shapiro-Wilk. La homogeneidad de la varianza se verificó mediante el ensayo Levene. En la etapa siguiente, se realizaron análisis post-hoc. El objetivo fue determinar si los promedios son significativamente diferentes. Se utilizaron los ensayos Scheffe, Tukey, NIR Fisher, Newman-Keuls y Duncan. Los posibles cambios en el contenido de hidrógeno difundido en el metal depositado, resultante del tiempo de almacenamiento de los electrodos, se determinaron mediante el ensayo “t” de Student. Los resultados del análisis estadístico muestran que el tiempo de almace-namiento de los electrodos no tiene una influencia significativa en el contenido de hidrógeno difundido en el metal depositado, independientemente del sistema de apantallamiento utilizado en la soldadura.
PALABRAS CLAVE: Electrodos recubiertos; Hidrógeno difundido; Método de la glicerina; Soldabilidad; Soldadura en húmedo; Soldadura sumergida en agua;
ORCID ID: Jacek Tomków (https://orcid.org/0000-0003-1096-7779); Dariusz Fydrych (https://orcid.org/0000-0002-2557-8568); Grzegorz Rogalski (https://orcid.org/0000-0003-3033-8048); Jerzy Łabanowski (https://orcid. org/0000-0003-3094-4101)
Copyright: © 2019 CSIC. This is an open-access article distributed under the terms of the Creative Commons Attribution 4.0 International (CC BY 4.0) License.
2 • J. Tomków et al.
Revista de Metalurgia 55(1), January–March 2019, 55 (1), e140. ISSN-L: 0034-8570. https://doi.org/10.3989/revmetalm.140
1. INTRODUCTION
Welding in underwater environment is most often applied as a method of repairs water constructions. The process is most often carried out with direct contact with water (wet welding) with the use of covered electrodes (Fydrych et al., 2015; Wang et al., 2018). Water environment intensifies some problems that have a negative impact on weldabil-ity of steel, such as a rapid cooling rate (Guo et al., 2017; Tomków et al., 2018a; Sajek, 2019) and the presence of residual stresses (Aloraier et al., 2004; Hu et al., 2017; Han et al., 2019; Wang et al., 2019a; Wang et al., 2019b). The environment also has an impact by increasing the diffusible hydrogen con-tent (Fydrych and Łabanowski, 2015; Chen et al., 2018). The water is a source of potential hydro-gen and diffusible hydrogen content in deposited metal depends on this amount. Hydrogen could be a source of corrosion (Świerczyńska et al., 2017a), and it is also a factor that is responsible for crack-ing (Yadav et al., 2017; Pascual-Guillamón et al., 2018), especially cold cracking, which is the big-gest problem in underwater welding (Guo et al., 2015; Tomków et al., 2018b). Also, the hydrogen has a big influence on the mechanical properties of welded joints (Pandey et al., 2017a; Pandey et al., 2017b).
The diffusible hydrogen content in deposited metal depends on welding conditions such as the filler and the base material surface condition. It also depends on other parameters including the arc volt-age, travel speed, welding current and polarity and stick out length (Fydrych and Łabanowski, 2015; Schaupp et al., 2017; Schaupp et al., 2018).
Hydrogen measurements are standardized (ISO 3690 (2012)). Literature recommended the use of the mercury method for hydrogen measurements (Padhy et al., 2015a; Padhy et al., 2015b). The most impor-tant disadvantage of the mercury method is the tox-icity of mercury (López et al., 2014; López et al., 2015). The measurement error resulting from the solubility of hydrogen in glycerine is less important in the case of testing of high-hydrogen processes, for example: welding with rutile or cellulose electrodes, or welding in water environment (Świerczyńska et al., 2017b). As usage of the mercury is prohibited, one of the most prospective methods of low-tem-perature measurement of hydrogen content is glyc-erine method. Disadvantages of the results glycerin method in comparison with the mercury method are more difficulty in repeating the results and lower measurement accuracy. To compare results between these two methods, it is necessary to use of relat-able data points (Fydrych and Łabanowski, 2015). However, the capability of recalculating the results is limited to 35 ml/100 g of diffusible hydrogen in deposited metal, so it cannot be used in underwater welding. Recent research showed that results up to
80 ml/100 g can be recalculated according to the fol-lowing formula (Fydrych and Łabanowski, 2015):
HDme = 1.21 × HDgl + 2.60 (1)Where HDme-hydrogen content in deposited
metal determined with mercury method (ml/100 g) and HDgl-hydrogen content in deposited metal determined with glycerin method (ml/100 g).
The aim of the undertaken studies was to deter-mine a relationship between the storage time of the electrodes and the amount of diffusible hydrogen content in deposited metal in different welding envi-ronments (air and water).
2. MATERIALS AND METHODS
The diffusible hydrogen content was measured in the deposited metal by general purpose OMNIA (E42 0 RC11) rutile electrodes that are 4.0 mm in diameter. The welding polarity was assumed to be in accordance with the electrode manufacturer rec-ommendations (DC-), at a test stand 0.15 m deep under the water with the use Aristo 4000i as a weld-ing power source. These electrodes were chosen because they provide good plastic properties of the weld metal, which minimizes the possibility of cold cracking in a water environment. The test stand is presented in Fig. 1. The weld beads were made on 4×20×120 mm specimens from S235JR steel. The chemical composition of the materials are presented in Table 1 and Table 2.
Determination of the diffusible hydrogen content with the glycerin method was carried out in accor-dance with standard procedure BN-64/4130-01 (1971). The test stand is presented in Fig. 2.
At first the specimen was weighed with an accu-racy of 0.01 g before welding. The specimen was then placed in a copper fixture and the weld bead was deposited with a short arc. When the welding has been finished, the slag has been removed and the specimen was quenched in water at 20 °C. After 30 seconds, the specimen was cleaned, dried and placed in an apparatus. The time between finish-ing welding the sample and beginning the hydrogen content measurements did not exceed 2 min. The pressure, temperature and during extraction the temperature were measured. After being removed from the measurement vessel the specimen was cleaned, dried and weighed to determine the mass of deposited metal. Adjusting the results to normal operating conditions was completed according to the formula from BN-64/4130-01 (1971) standard. The glycerin solution was changed every two weeks as recommended (Fydrych and Łabanowski, 2015).
3. RESULTS
The tests were carried out on 10 specimens welded in the air (series 1 and 2) and 10 specimens made in the water environment (series 3 and 4). The first

Effect of the welding environment and storage time of electrodes on the diffusible hydrogen content in deposited metal • 3
Revista de Metalurgia 55(1), January–March 2019, 55 (1), e140. ISSN-L: 0034-8570. https://doi.org/10.3989/revmetalm.140
part of the specimens was welded immediately after opening the package of the electrodes (series 1 and 3). Then the electrodes were stored in an open pack-ages in laboratory conditions (temperature in range 18-21 °C, and humidity 50-60%), and they had direct contact with the air. After 3 years, the second part of the samples (series 2 and 4) was made to verify the effect of the storage time of electrodes on the diffusible hydrogen content in deposited metal in different welding environments. Additionally, the visual testing of electrode covering surfaces showed no changes in their appearance. The results of the determination of the diffusible hydrogen content are presented in Table 3. The exemplary specimens are presented in Fig. 3.
The results showed in Table 3 were subjected to statistical analysis. The first aim of the analysis was to verify is there was any statistically impor-tant difference in the diffusible hydrogen content for the specimens made in two environments. The second aim was to verify the effect of the stor-age time of electrodes on the diffusible hydrogen content in deposited metal in different welding environments.
Figure 1. The experimental setup: 1) welding power source, 2) control panel, 3) table, 4) tank, and 5) welding extractor fan.
Table 1. Chemical composition of S235JR steel (wt,%)
C* Mn* P* S* N* Cu*0.17 1.4 0.035 0.045 0.012 0.55
*max
Table 2. Chemical composition of Omnia electrodes (wt,%)
C* Mn* P* Si* Cr* Cu*
0.07 0.55 0.01 0.44 0.04 0.05
*max
Figure 2. The schema of the glycerin measurement stand: 1) cylindrical vessel, 2) measurement vessel, 3) compensatory tank, 4) rubber washers, 5) sample, 6) upper valve, 7) lower
valve, and 8) rubber hose.
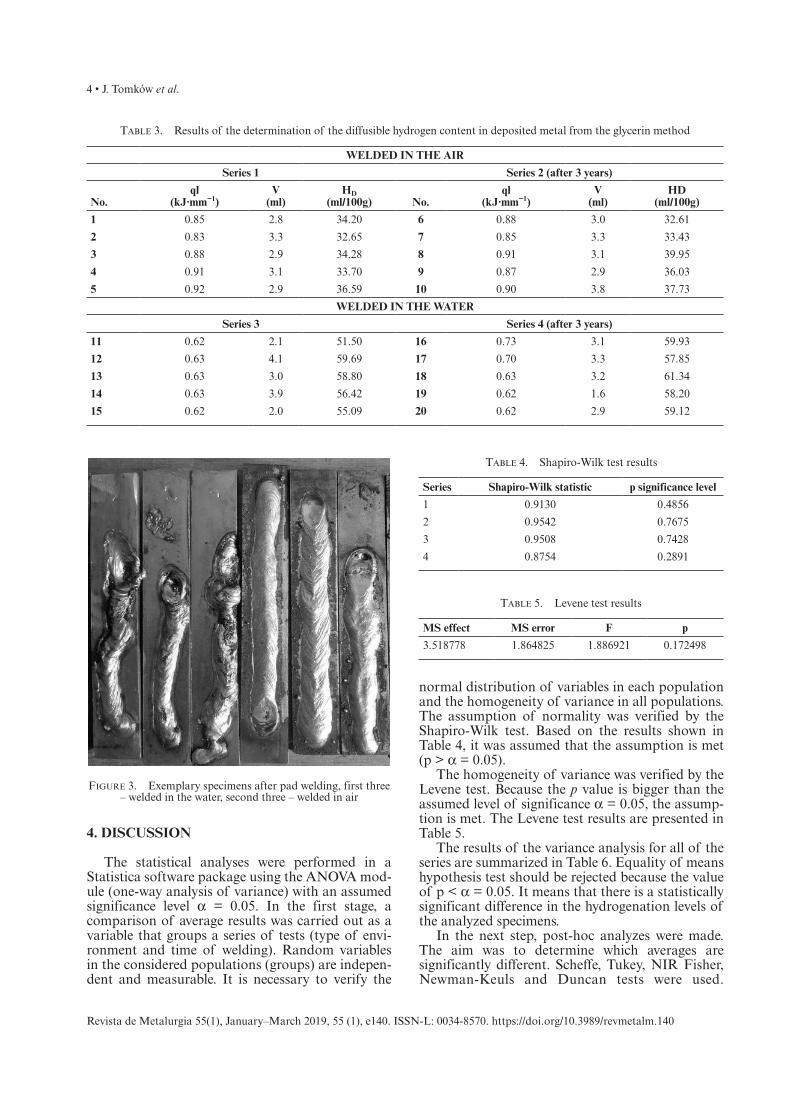
4 • J. Tomków et al.
Revista de Metalurgia 55(1), January–March 2019, 55 (1), e140. ISSN-L: 0034-8570. https://doi.org/10.3989/revmetalm.140
4. DISCUSSION
The statistical analyses were performed in a Statistica software package using the ANOVA mod-ule (one-way analysis of variance) with an assumed significance level α = 0.05. In the first stage, a comparison of average results was carried out as a variable that groups a series of tests (type of envi-ronment and time of welding). Random variables in the considered populations (groups) are indepen-dent and measurable. It is necessary to verify the
normal distribution of variables in each population and the homogeneity of variance in all populations. The assumption of normality was verified by the Shapiro-Wilk test. Based on the results shown in Table 4, it was assumed that the assumption is met (p > α = 0.05).
The homogeneity of variance was verified by the Levene test. Because the p value is bigger than the assumed level of significance α = 0.05, the assump-tion is met. The Levene test results are presented in Table 5.
The results of the variance analysis for all of the series are summarized in Table 6. Equality of means hypothesis test should be rejected because the value of p < α = 0.05. It means that there is a statistically significant difference in the hydrogenation levels of the analyzed specimens.
In the next step, post-hoc analyzes were made. The aim was to determine which averages are significantly different. Scheffe, Tukey, NIR Fisher, Newman-Keuls and Duncan tests were used.
Table 3. Results of the determination of the diffusible hydrogen content in deposited metal from the glycerin method
WELDED IN THE AIR
Series 1 Series 2 (after 3 years)
No.ql
(kJ·mm−1)V
(ml)HD
(ml/100g) No.ql
(kJ·mm−1)V
(ml)HD
(ml/100g)
1 0.85 2.8 34.20 6 0.88 3.0 32.61
2 0.83 3.3 32.65 7 0.85 3.3 33.43
3 0.88 2.9 34.28 8 0.91 3.1 39.95
4 0.91 3.1 33.70 9 0.87 2.9 36.03
5 0.92 2.9 36.59 10 0.90 3.8 37.73
WELDED IN THE WATER
Series 3 Series 4 (after 3 years)
11 0.62 2.1 51.50 16 0.73 3.1 59.93
12 0.63 4.1 59.69 17 0.70 3.3 57.85
13 0.63 3.0 58.80 18 0.63 3.2 61.34
14 0.63 3.9 56.42 19 0.62 1.6 58.20
15 0.62 2.0 55.09 20 0.62 2.9 59.12
Table 4. Shapiro-Wilk test results
Series Shapiro-Wilk statistic p significance level
1 0.9130 0.4856
2 0.9542 0.7675
3 0.9508 0.7428
4 0.8754 0.2891
Table 5. Levene test results
MS effect MS error F p
3.518778 1.864825 1.886921 0.172498
Figure 3. Exemplary specimens after pad welding, first three – welded in the water, second three – welded in air
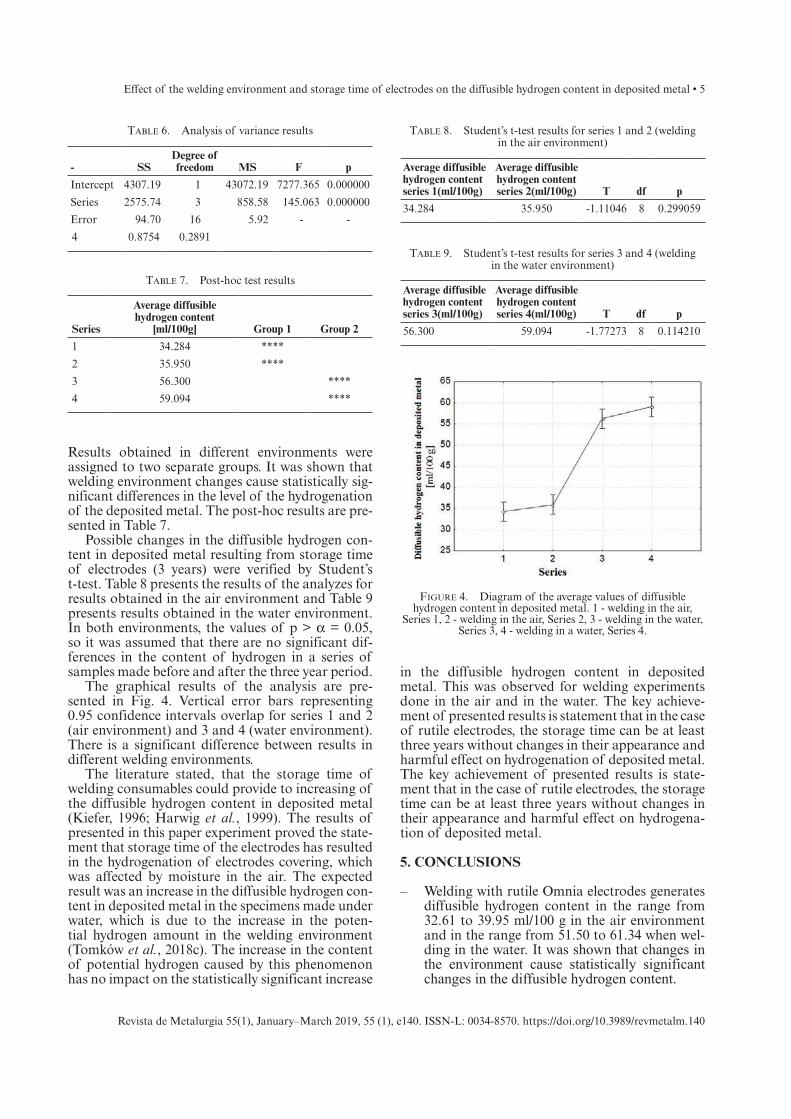
Effect of the welding environment and storage time of electrodes on the diffusible hydrogen content in deposited metal • 5
Revista de Metalurgia 55(1), January–March 2019, 55 (1), e140. ISSN-L: 0034-8570. https://doi.org/10.3989/revmetalm.140
Results obtained in different environments were assigned to two separate groups. It was shown that welding environment changes cause statistically sig-nificant differences in the level of the hydrogenation of the deposited metal. The post-hoc results are pre-sented in Table 7.
Possible changes in the diffusible hydrogen con-tent in deposited metal resulting from storage time of electrodes (3 years) were verified by Student’s t-test. Table 8 presents the results of the analyzes for results obtained in the air environment and Table 9 presents results obtained in the water environment. In both environments, the values of p > α = 0.05, so it was assumed that there are no significant dif-ferences in the content of hydrogen in a series of samples made before and after the three year period.
The graphical results of the analysis are pre-sented in Fig. 4. Vertical error bars representing 0.95 confidence intervals overlap for series 1 and 2 (air environment) and 3 and 4 (water environment). There is a significant difference between results in different welding environments.
The literature stated, that the storage time of welding consumables could provide to increasing of the diffusible hydrogen content in deposited metal (Kiefer, 1996; Harwig et al., 1999). The results of presented in this paper experiment proved the state-ment that storage time of the electrodes has resulted in the hydrogenation of electrodes covering, which was affected by moisture in the air. The expected result was an increase in the diffusible hydrogen con-tent in deposited metal in the specimens made under water, which is due to the increase in the poten-tial hydrogen amount in the welding environment (Tomków et al., 2018c). The increase in the content of potential hydrogen caused by this phenomenon has no impact on the statistically significant increase
in the diffusible hydrogen content in deposited metal. This was observed for welding experiments done in the air and in the water. The key achieve-ment of presented results is statement that in the case of rutile electrodes, the storage time can be at least three years without changes in their appearance and harmful effect on hydrogenation of deposited metal. The key achievement of presented results is state-ment that in the case of rutile electrodes, the storage time can be at least three years without changes in their appearance and harmful effect on hydrogena-tion of deposited metal.
5. CONCLUSIONS
– Welding with rutile Omnia electrodes generates diffusible hydrogen content in the range from 32.61 to 39.95 ml/100 g in the air environment and in the range from 51.50 to 61.34 when wel-ding in the water. It was shown that changes in the environment cause statistically significant changes in the diffusible hydrogen content.
Table 6. Analysis of variance results
- SSDegree of freedom MS F p
Intercept 4307.19 1 43072.19 7277.365 0.000000
Series 2575.74 3 858.58 145.063 0.000000
Error 94.70 16 5.92 - -
4 0.8754 0.2891
Table 7. Post-hoc test results
Series
Average diffusible hydrogen content
[ml/100g] Group 1 Group 2
1 34.284 ****
2 35.950 ****
3 56.300 ****
4 59.094 ****
Figure 4. Diagram of the average values of diffusible hydrogen content in deposited metal. 1 - welding in the air,
Series 1, 2 - welding in the air, Series 2, 3 - welding in the water, Series 3, 4 - welding in a water, Series 4.
Table 8. Student’s t-test results for series 1 and 2 (welding in the air environment)
Average diffusible hydrogen content series 1(ml/100g)
Average diffusible hydrogen content series 2(ml/100g) T df p
34.284 35.950 -1.11046 8 0.299059
Table 9. Student’s t-test results for series 3 and 4 (welding in the water environment)
Average diffusible hydrogen content series 3(ml/100g)
Average diffusible hydrogen content series 4(ml/100g) T df p
56.300 59.094 -1.77273 8 0.114210
6 • J. Tomków et al.
Revista de Metalurgia 55(1), January–March 2019, 55 (1), e140. ISSN-L: 0034-8570. https://doi.org/10.3989/revmetalm.140
– Three years of storing the electrodes in an opened package in laboratory conditions with contact with the air has no statistically signifi-cant influence on the diffusible hydrogen con-tent in deposited metal regardless of the welding environment.
REFERENCES
Aloraier, A., Ibrahim, R.N., Ghojel, J. (2004). Eliminating post-weld heat treatment in repair welding by temper bead technique: role bead sequence in metallurgical changes. J. Mater. Process Tech. 153-154, 292-400. https://doi.org/10.1016/j.jmatprotec.2004.04.383.
BN-64/4130-01. (1971). Oznaczanie całkowitej zawartości wodoru w stopiwie stalowych elektrod z otulina˛ kwaśną, rutylowa lub zasadowq. Norma Branzowa.
Chen, H., Guo, N., Shi, X., Du, Y., Feng, J., Wang, G. (2018). Effect of water flow on the arc stability and metal transfer in underwater flux-cored wet welding. J. Manuf. Process 31, 103-115. https://doi.org/10.1016/j.jmapro.2017.11.010.
Fydrych, D., Łabanowski, J., Tomków, J., Rogalski, G. (2015). Cold cracking of underwater wet welded S355G10+N high strength steel. Adv. Mater. Sci. 15(3), 48-56. https://doi.org/10.1515/adms-2015-0015.
Fydrych, D., Łabanowski, J. (2015). An experimental study of high-hydrogen welding processes. Rev. Metal. 51 (4), e055. https://dx.doi.org/10.3989/revmetalm.055.
Guo, N., Liu, D., Guo, W., Li, X., Feng, J. (2015). Effect of Ni on microstructure and mechanical properties of underwa-ter wet welding joint. Mater. Design 77, 25-31. https://doi.org/10.1016/j.matdes.2015.04.007.
Guo, N., Du, Y., Maksimov, S., Feng, J., Yin, Z., Krazha-novskyi, D., Fu, D. (2017). Stydy of metal transfer con-trol in underwater wet FCAW using pulsed wire feed method. Weld. World 62 (1), 87-94. https://doi.org/10.1007/s40194-017-0497-y.
Han, L., Wu, X., Chen, G., Wang, Z., Fan, W. (2019). Local dry underwater welding of 304 stainless steel based on a micro-drain cover. J. Mater. Process Tech. 268, 47-53. https://doi.org/10.1016/j.jmatprotec.2018.12.029.
Harwig, D.D., Longenecker, D.P., Cruz, J.H. (1999). Effects of welding parameters and electrode atmospheric exposure on the diffusible hydrogen content of gas shielded flux cored arc welds. Weld. J. 78 (9), 314s-321s. https://app.aws.org/wj/supplement/sept99/HARWIG.pdf.
Hu, Y., Shi, Y.-H., Shen, X.-Q., Wang, Z.-M. (2017). Micro-structure, pitting corrosion resistance and impact tough-ness of duplex stainless steel underwater dry hyperbaric flux-cored arc welds. Materials 10 (12), 1443. https://doi.org/10.3390/ma10121443.
ISO 3690. (2012). Welding and allied processes. Determina-tion of hydrogen content in arc weld metal. International Standard.
Kiefer, J.H. (1996). Effects of moisture contamination and weld-ing parameters on diffusible hydrogen. Weld. J. 75 (5), 155-161.
López, F.A., Sierra, M.J., Rodríguez, O., Millán, R., Alguacil, F.J. (2014). Non-isothermal kinetics of the thermal desorp-tion of mercury from a contaminated soil. Rev. Metal. 50 (1), e001. https://doi.org/10.3989/revmetalm.001.
López, F.A., Alguacil, F.J., Rodríguez, O., Sierra, M.J., Mil-lán, R. (2015). Mercury leaching from hazardous indus-trial wastes stabilized by sulfur polymer encapsulation. Waste Manage. 35, 301–306. https://doi.org/10.1016/j.wasman.2014.10.009.
Padhy, G.K., Ramasubbu, V., Parvathavarthini, N., Wu, C.S., Albert, S.K. (2015a). Influence of temperature and alloy-ing on the apparent diffusivity of hydrogen in high strength
steel. Int. J. Hydrogen Energ. 40 (20), 6714–6725. https://doi.org/10.1016/j.ijhydene.2015.03.153.
Padhy, G.K., Ramasubbu, V., Albert, S.K. (2015b). Rapid deter-mination of diffusible hydrogen in steel welds using a modified gas chromatography facility. J. Test. Eval. 43 (1), 69–79. https://doi.org/10.1520/JTE20130077.
Pandey, C., Mahapatra, M.M., Kumar, P., Saini, N. (2017a). Diffusible hydrogen level in deposited metal and their effect on tensile properties and flexural strength of P91 steel. J. Eng. Mater. Technol. 139 (3), 031004. https://doi.org/10.1115/1.4035764.
Pandey, C., Mahapatra, M.M., Kumar, P., Saini, N., Srivastava, A. (2017b). Microstructure and mechanical property rela-tionship for different heat treatment and hydrogen level in multi-pass welded P91 steel joint. J. Manuf. Process 28, 220-234. https://doi.org/10.1016/j.jmapro.2017.06.009.
Pascual-Guillamón, M., Cárcel-Carrasco, J., Pérez-Puig, M., Salas-Vicente, F. (2018). Influence of an ERNiCrMo-3 root pass on the properties of cast iron weld joints. Rev. Metal. 54 (3), e122. https://doi.org/10.3989/revmetalm.122.
Sajek A. (2019). Application of FEM simulation method in area of the dynamics of cooling AHSS steel with a complex hybrid welding process. Weld. World. 718, in press.
Schaupp, T., Rhode, M., Kannengiesser, T. (2017). Influence of welding parameters on diffusible hydrogen content in high-strength steel welds using modified spray arc pro-cess. Weld. World 62 (1), 9-18. https://doi.org/10.1007/s40194-017-0535-9.
Schaupp, T., Rhode, M., Yahyaoui H., Kannengiesser, T. (2018). Influence of heat control on hydrogen distribution in high-strength multi-layer welds with narrow groove. Weld. World. 1-10. https://doi.org/10.1007/s40194-018- 00682-0.
Świerczyńska, A., Łabanowski, J., Michalska, J., Fydrych, D. (2017a). Corrosion behavior of hydrogen charged super duplex stainless steel welded joints. Mater. Corros. 68 (10), 1037-1045. https://doi.org/10.1002/maco.201709418.
Świerczyńska, A., Fydrych, D., Rogalski, G. (2017b). Diffusible hydrogen management in underwater wet self-shielded flux cored arc welding. Int. J. Hydrogen Energ. 42 (38), 24532-24540. https://doi.org/10.1016/j.ijhydene.2017.07.225.
Tomków, J., Fydrych, D., Rogalski, G., Łabanowski, J. (2018a). Temper bead welding os S460N steel in wet welding condi-tions. Adv. Mater. Sci. 18 (3), 5-14. https://doi.org/10.1515/adms-2017-0036.
Tomków, J., Łabanowski, J., Fydrych, D., Rogalski, G. (2018b). Cold cracking of S460N steel in water environment. Pol. Marit. Res. 25 (3), 131-136. https://doi.org/10.2478/pomr-2018-0104.
Tomków, J., Rogalski, G., Fydrych, D., Łabanowski, J. (2018c). Improvement of S355G10+N steel weldability in water environment by Temper Bead Welding. J. Mater. Pro-cess Tech. 262, 372-381. https://doi.org/10.1016/j.jmatprotec.2018.06.034.
Wang, J., Sun, Q., Zhang, S., Wang, C., Wu, L., Feng, J. (2018). Characterization of the underwater welding arc bubble through a visual sensing method. J. Mater. Process Tech. 251, 95-108. https://doi.org/10.1016/j.jmatprotec.2017.08.019.
Wang, J., Sun, Q., Ma, J., Teng, J., Jin, P., Feng, J. (2019a). Investigation of acoustic radiator affecting bubble-acous-tic interaction in ultrasonic wave-assisted UWW at shal-low water. J. Manuf. Process 37, 563-577. https://doi.org/10.1016/j.jmapro.2018.12.020.
Wang, J., Sun, Q., Pan, Z., Yang, J., Feng, J. (2019b). Effects of welding speed on bubble dynamics and process stability in mechanical constraint-assisted underwater wet welding of steel sheets. J. Mater. Process Tech. 264, 389-401. https://doi.org/10.1016/j.jmatprotec.2018.09.022.
Yadav, U., Pandey, C., Saini, N., Thakre, J.G., Mahapatra, M.M. (2017). Study on Hydrogen-Assisted Cracking in High-Strength Steels by Using the Granjon Implant Test. Metall. Microstr. Anal. 6 (3), 247-257. https://doi.org/10.1007/s13632-017-0351-z.