Anexos
Luz Marina Troya Pérez 167
Clorpirifós (16/05/2011).
Informe de validación de datos de entrada (Validating Input Data)
Date: 07/22/11
Time: 13:45:03
Design Case: CLORPIRIFOS 17.00h
Site Name:
Prepared By:
Project Notes:
VALIDATING INPUT DATA ...
Checking Pages for invalid or missing inputs...
Effluent Page has been validated.
Ambient Page has been validated.
Discharge Page has been validated.
Mixing Zone Page has been validated.
Finished checking Pages for invalid or missing inputs.
Loading Correct RuleBases
Validating RuleBases ...
AMBIENT DATA:
The RATE OF REVERSAL is dUa/dt = 0.596 (m/s)/hour.
Equivalent Darcy-Weisbach friction factor = 0.038
Ambient Rule Base has been validated.
DISCHARGE DATA:
CORMIX1: Single Port Discharges
Port cross-sectional area A0 = 0.283 m^2.
Discharge velocity U0= 0.315 m/s.
This is a Deeply Submerged Discharge, where the height of the discharge
port (H0 = 0.7 m), above the bottom, does NOT Exceed one-third of the local
ambient water depth (HD = 2.15 m)
Note: For special advice on this limitation please consult Section 7.4
of the CORMIX1 technical report (Doneker and Jirka, 1990).
The submergence of the port below the water surface is SUB0 = 1.45 m.
Discharge Rules for CORMIX1 have been validated
MIXING ZONE SPECIFICATION:
TOXIC DILUTION ZONE (TDZ) Specifications:
Since the discharge is specified as toxic, the analysis will include
a TDZ.
The pollutant concentration at the edge of the TDZ is subject to THREE
(3) CRITERIA based on the Criterion Maximum Concentration (CMC) value:
Criterion 1: The CMC must be met within a distance of 50 times the
discharge length scale in any spatial direction.
Criterion 2: The CMC must be met within a distance of 5 times the local
water depth in any horizontal direction from the outfall.
Criterion 3: The CMC must be met within 10% of the distance from the
edge of the outfall structure to the edge of the regulatory mixing zone if
a regulatory mixing zone is specified.
Also, it is RECOMMENDED that the discharge exit velocity exceed 3 m/s.
5.4- ANEXO 4. RESULTADOS DE CORMIX PARA LAS SIMULACIONES DEL NIVEL 2.
Anexos
Luz Marina Troya Pérez 168
In addition, the Criterion Continuous Concentration (CCC) value
specified must be met at the edge of the Regulatory Mixing Zone if such
is specified.
Reference: Technical Support Document for Water Quality-Based
Toxics Control, USEPA, 1991 (EPA/505/2-90-001).
Mixing Zones Rule Base has been validated.
Finished validating RuleBases.
Calculating Parameters.
FLOW PARAMETERS AND LENGTH SCALES:
Relative density differences between discharge and ambient:
Ambient density at the discharge level RHOAH0 = 1027 kg/m^3.
Vertical mean ambient density RHOAM = 1027 kg/m^3.
The effluent density (1001 kg/m^3) is less than the surrounding
ambient water density at the discharge level (1027 kg/m^3).
Therefore, the effluent is POSITIVELY BUOYANT and will tend to rise
towards the surface.
Flow bulk parameters:
Discharge volume flux Q0 = 0.0892 m^3/s.
Discharge momentum flux M0 = 0.02814 m^4/s^2.
Discharge buoyancy flux J0 = 0.022146 m^4/s^3.
Flow length scales:
Jet-to-crossflow length scale Lm = 0.56 m.
Plume-to-crossflow length scale Lb = 0.84 m.
Discharge length scale LQ = 0.5317 m.
Jet-to-plume transition length scale LM = 0.46 m.
Length scale of tidal reversal Lu = 5.54 m
Time scale of tidal reversal Tu = 0.05 hours
Minimum jet to crossflow length scale Lmin = 0.48 m
Build-up paramater f(t) = 1
Non-dimensional parameters:
Densimetric Froude number FR0 = 0.82
Jet/crossflow velocity ratio R = 1.06
Parameters for CORMIX1 have been calculated
Classifying Flows.
FLOW CLASSIFICATION:
CORMIX1 includes SIX MAJOR CLASSES of possible flow configurations:
Classes S,IS: Flows trapped in a layer within linear stratification.
Classes V,H: Near Bottom, Positively buoyant flows in a uniform density
layer.
Classes IV,IH: Near Surface, Negatively buoyant flows in a uniform
density layer.
Classes NV,NH: Near Bottom, Negatively buoyant flows in uniform density
layer.
Classes IPV,IPH: Near Surface, Positively buoyant flows in uniform
density layer.
Classes A,AI: Flows affected by dynamic bottom or surface attachment.
The NEAR FIELD FLOW will have the following features:
The discharge near-field behavior is dominated by either the positive
buoyancy of the discharge or the upward vertical orientation of the discharge
port.
There is the possibility of dynamic bottom attachment.
The following conclusion on the NEAR-FIELD FLOW CONFIGURATION applies
to a layer corresponding to the FULL WATER DEPTH at the discharge site:
*** FLOW CLASS = H2 ***
Applicable layer depth HS = 2.15 m.
Flow has been classified.
Executing the simulation... FORTRAN simulation complete.
Generating Session Report... Session Report complete.
Anexos
Luz Marina Troya Pérez 169
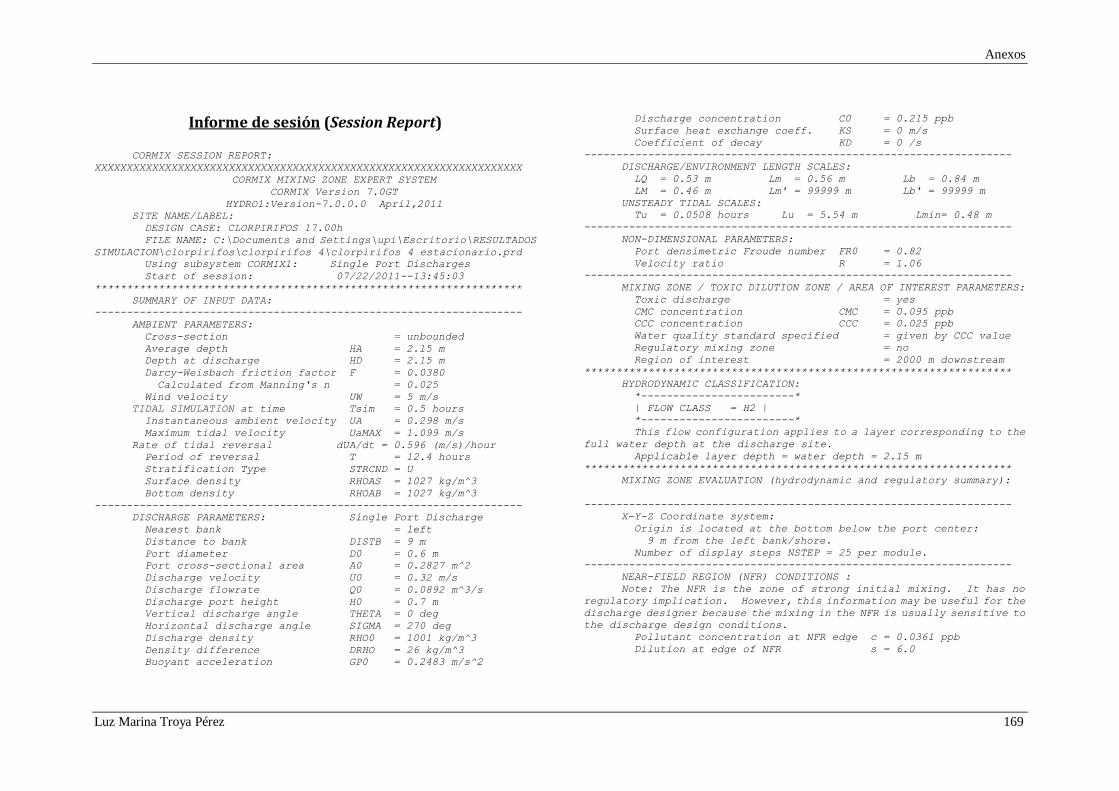
Informe de sesión (Session Report)
CORMIX SESSION REPORT:
XXXXXXXXXXXXXXXXXXXXXXXXXXXXXXXXXXXXXXXXXXXXXXXXXXXXXXXXXXXXXXXXXXX
CORMIX MIXING ZONE EXPERT SYSTEM
CORMIX Version 7.0GT
HYDRO1:Version-7.0.0.0 April,2011
SITE NAME/LABEL:
DESIGN CASE: CLORPIRIFOS 17.00h
FILE NAME: C:\Documents and Settings\upi\Escritorio\RESULTADOS
SIMULACION\clorpirifos\clorpirifos 4\clorpirifos 4 estacionario.prd
Using subsystem CORMIX1: Single Port Discharges
Start of session: 07/22/2011--13:45:03
*******************************************************************
SUMMARY OF INPUT DATA:
-------------------------------------------------------------------
AMBIENT PARAMETERS:
Cross-section = unbounded
Average depth HA = 2.15 m
Depth at discharge HD = 2.15 m
Darcy-Weisbach friction factor F = 0.0380
Calculated from Manning's n = 0.025
Wind velocity UW = 5 m/s
TIDAL SIMULATION at time Tsim = 0.5 hours
Instantaneous ambient velocity UA = 0.298 m/s
Maximum tidal velocity UaMAX = 1.099 m/s
Rate of tidal reversal dUA/dt = 0.596 (m/s)/hour
Period of reversal T = 12.4 hours
Stratification Type STRCND = U
Surface density RHOAS = 1027 kg/m^3
Bottom density RHOAB = 1027 kg/m^3
-------------------------------------------------------------------
DISCHARGE PARAMETERS: Single Port Discharge
Nearest bank = left
Distance to bank DISTB = 9 m
Port diameter D0 = 0.6 m
Port cross-sectional area A0 = 0.2827 m^2
Discharge velocity U0 = 0.32 m/s
Discharge flowrate Q0 = 0.0892 m^3/s
Discharge port height H0 = 0.7 m
Vertical discharge angle THETA = 0 deg
Horizontal discharge angle SIGMA = 270 deg
Discharge density RHO0 = 1001 kg/m^3
Density difference DRHO = 26 kg/m^3
Buoyant acceleration GP0 = 0.2483 m/s^2
Discharge concentration C0 = 0.215 ppb
Surface heat exchange coeff. KS = 0 m/s
Coefficient of decay KD = 0 /s
-------------------------------------------------------------------
DISCHARGE/ENVIRONMENT LENGTH SCALES:
LQ = 0.53 m Lm = 0.56 m Lb = 0.84 m
LM = 0.46 m Lm' = 99999 m Lb' = 99999 m
UNSTEADY TIDAL SCALES:
Tu = 0.0508 hours Lu = 5.54 m Lmin= 0.48 m
-------------------------------------------------------------------
NON-DIMENSIONAL PARAMETERS:
Port densimetric Froude number FR0 = 0.82
Velocity ratio R = 1.06
-------------------------------------------------------------------
MIXING ZONE / TOXIC DILUTION ZONE / AREA OF INTEREST PARAMETERS:
Toxic discharge = yes
CMC concentration CMC = 0.095 ppb
CCC concentration CCC = 0.025 ppb
Water quality standard specified = given by CCC value
Regulatory mixing zone = no
Region of interest = 2000 m downstream
*******************************************************************
HYDRODYNAMIC CLASSIFICATION:
*------------------------*
| FLOW CLASS = H2 |
*------------------------*
This flow configuration applies to a layer corresponding to the
full water depth at the discharge site.
Applicable layer depth = water depth = 2.15 m
*******************************************************************
MIXING ZONE EVALUATION (hydrodynamic and regulatory summary):
-------------------------------------------------------------------
X-Y-Z Coordinate system:
Origin is located at the bottom below the port center:
9 m from the left bank/shore.
Number of display steps NSTEP = 25 per module.
-------------------------------------------------------------------
NEAR-FIELD REGION (NFR) CONDITIONS :
Note: The NFR is the zone of strong initial mixing. It has no
regulatory implication. However, this information may be useful for the
discharge designer because the mixing in the NFR is usually sensitive to
the discharge design conditions.
Pollutant concentration at NFR edge c = 0.0361 ppb
Dilution at edge of NFR s = 6.0
Anexos
Luz Marina Troya Pérez 170
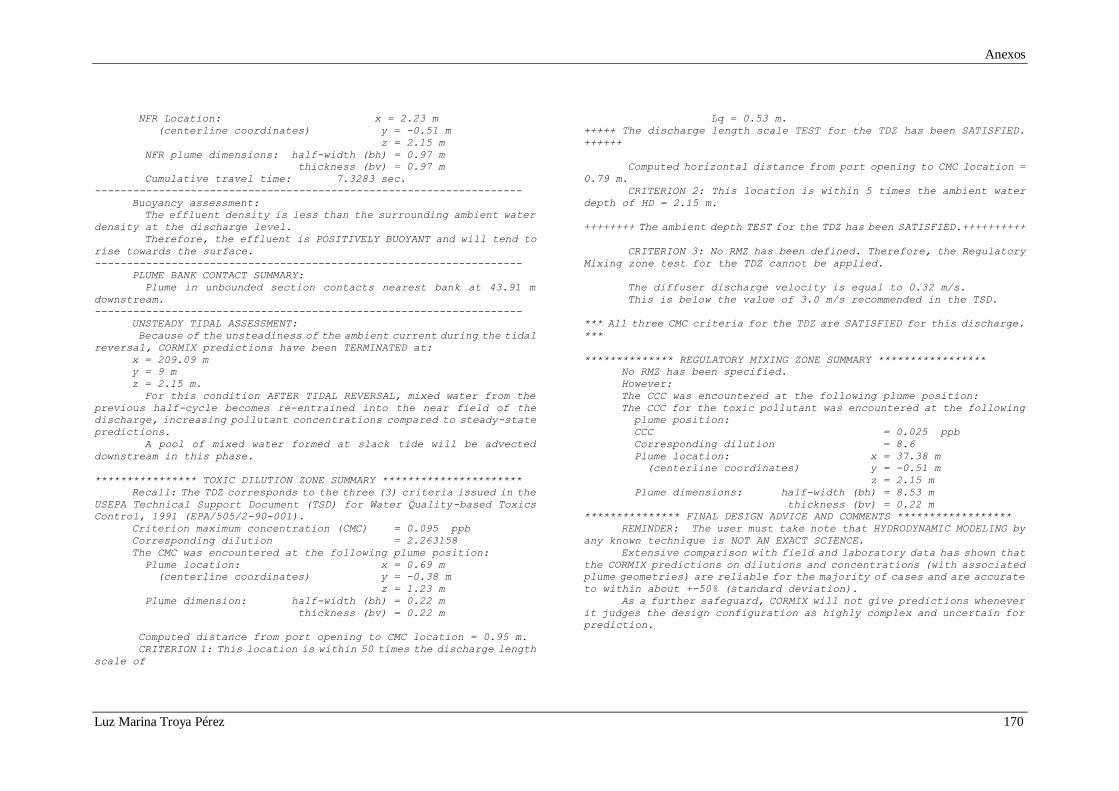
NFR Location: x = 2.23 m
(centerline coordinates) y = -0.51 m
z = 2.15 m
NFR plume dimensions: half-width (bh) = 0.97 m
thickness (bv) = 0.97 m
Cumulative travel time: 7.3283 sec.
-------------------------------------------------------------------
Buoyancy assessment:
The effluent density is less than the surrounding ambient water
density at the discharge level.
Therefore, the effluent is POSITIVELY BUOYANT and will tend to
rise towards the surface.
-------------------------------------------------------------------
PLUME BANK CONTACT SUMMARY:
Plume in unbounded section contacts nearest bank at 43.91 m
downstream.
-------------------------------------------------------------------
UNSTEADY TIDAL ASSESSMENT:
Because of the unsteadiness of the ambient current during the tidal
reversal, CORMIX predictions have been TERMINATED at:
x = 209.09 m
y = 9 m
z = 2.15 m.
For this condition AFTER TIDAL REVERSAL, mixed water from the
previous half-cycle becomes re-entrained into the near field of the
discharge, increasing pollutant concentrations compared to steady-state
predictions.
A pool of mixed water formed at slack tide will be advected
downstream in this phase.
**************** TOXIC DILUTION ZONE SUMMARY **********************
Recall: The TDZ corresponds to the three (3) criteria issued in the
USEPA Technical Support Document (TSD) for Water Quality-based Toxics
Control, 1991 (EPA/505/2-90-001).
Criterion maximum concentration (CMC) = 0.095 ppb
Corresponding dilution = 2.263158
The CMC was encountered at the following plume position:
Plume location: x = 0.69 m
(centerline coordinates) y = -0.38 m
z = 1.23 m
Plume dimension: half-width (bh) = 0.22 m
thickness (bv) = 0.22 m
Computed distance from port opening to CMC location = 0.95 m.
CRITERION 1: This location is within 50 times the discharge length
scale of
Lq = 0.53 m.
+++++ The discharge length scale TEST for the TDZ has been SATISFIED.
++++++
Computed horizontal distance from port opening to CMC location =
0.79 m.
CRITERION 2: This location is within 5 times the ambient water
depth of HD = 2.15 m.
++++++++ The ambient depth TEST for the TDZ has been SATISFIED.++++++++++
CRITERION 3: No RMZ has been defined. Therefore, the Regulatory
Mixing zone test for the TDZ cannot be applied.
The diffuser discharge velocity is equal to 0.32 m/s.
This is below the value of 3.0 m/s recommended in the TSD.
*** All three CMC criteria for the TDZ are SATISFIED for this discharge.
***
************** REGULATORY MIXING ZONE SUMMARY *****************
No RMZ has been specified.
However:
The CCC was encountered at the following plume position:
The CCC for the toxic pollutant was encountered at the following
plume position:
CCC = 0.025 ppb
Corresponding dilution = 8.6
Plume location: x = 37.38 m
(centerline coordinates) y = -0.51 m
z = 2.15 m
Plume dimensions: half-width (bh) = 8.53 m
thickness (bv) = 0.22 m
*************** FINAL DESIGN ADVICE AND COMMENTS ******************
REMINDER: The user must take note that HYDRODYNAMIC MODELING by
any known technique is NOT AN EXACT SCIENCE.
Extensive comparison with field and laboratory data has shown that
the CORMIX predictions on dilutions and concentrations (with associated
plume geometries) are reliable for the majority of cases and are accurate
to within about +-50% (standard deviation).
As a further safeguard, CORMIX will not give predictions whenever
it judges the design configuration as highly complex and uncertain for
prediction.
Anexos
Luz Marina Troya Pérez 171
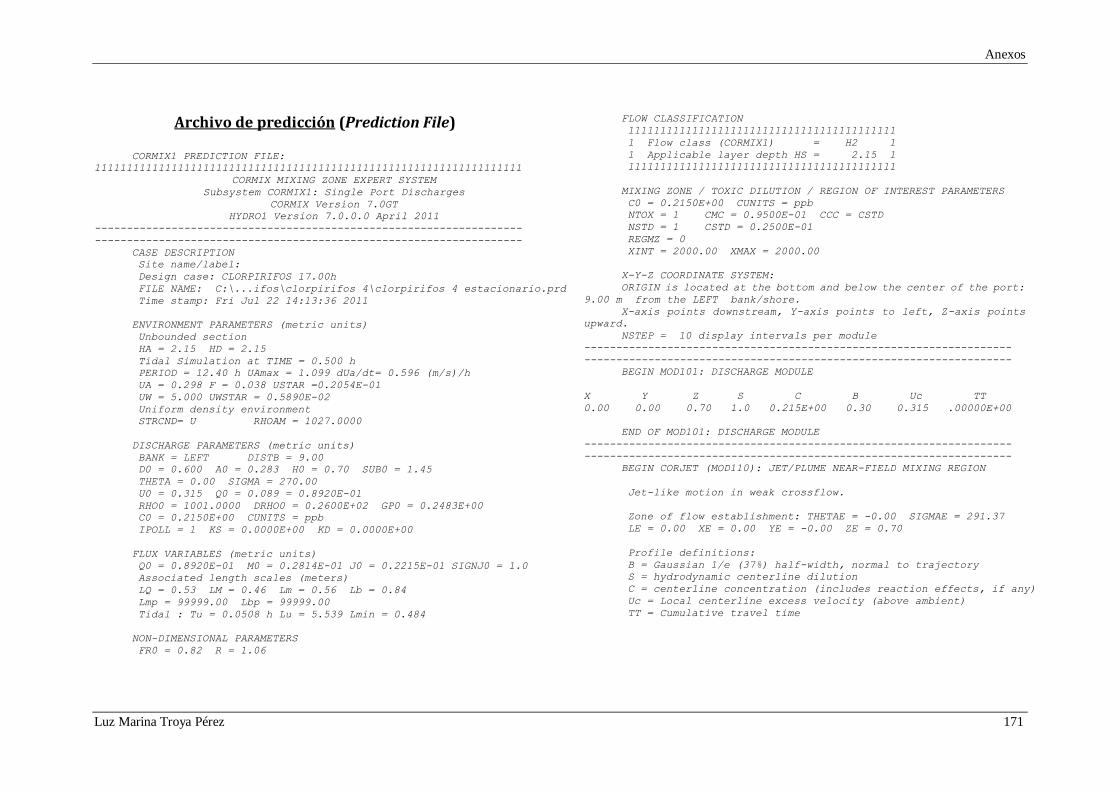
Archivo de predicción (Prediction File)
CORMIX1 PREDICTION FILE:
1111111111111111111111111111111111111111111111111111111111111111111
CORMIX MIXING ZONE EXPERT SYSTEM
Subsystem CORMIX1: Single Port Discharges
CORMIX Version 7.0GT
HYDRO1 Version 7.0.0.0 April 2011
-------------------------------------------------------------------
-------------------------------------------------------------------
CASE DESCRIPTION
Site name/label:
Design case: CLORPIRIFOS 17.00h
FILE NAME: C:\...ifos\clorpirifos 4\clorpirifos 4 estacionario.prd
Time stamp: Fri Jul 22 14:13:36 2011
ENVIRONMENT PARAMETERS (metric units)
Unbounded section
HA = 2.15 HD = 2.15
Tidal Simulation at TIME = 0.500 h
PERIOD = 12.40 h UAmax = 1.099 dUa/dt= 0.596 (m/s)/h
UA = 0.298 F = 0.038 USTAR =0.2054E-01
UW = 5.000 UWSTAR = 0.5890E-02
Uniform density environment
STRCND= U RHOAM = 1027.0000
DISCHARGE PARAMETERS (metric units)
BANK = LEFT DISTB = 9.00
D0 = 0.600 A0 = 0.283 H0 = 0.70 SUB0 = 1.45
THETA = 0.00 SIGMA = 270.00
U0 = 0.315 Q0 = 0.089 = 0.8920E-01
RHO0 = 1001.0000 DRHO0 = 0.2600E+02 GP0 = 0.2483E+00
C0 = 0.2150E+00 CUNITS = ppb
IPOLL = 1 KS = 0.0000E+00 KD = 0.0000E+00
FLUX VARIABLES (metric units)
Q0 = 0.8920E-01 M0 = 0.2814E-01 J0 = 0.2215E-01 SIGNJ0 = 1.0
Associated length scales (meters)
LQ = 0.53 LM = 0.46 Lm = 0.56 Lb = 0.84
Lmp = 99999.00 Lbp = 99999.00
Tidal : Tu = 0.0508 h Lu = 5.539 Lmin = 0.484
NON-DIMENSIONAL PARAMETERS
FR0 = 0.82 R = 1.06
FLOW CLASSIFICATION
111111111111111111111111111111111111111111
1 Flow class (CORMIX1) = H2 1
1 Applicable layer depth HS = 2.15 1
111111111111111111111111111111111111111111
MIXING ZONE / TOXIC DILUTION / REGION OF INTEREST PARAMETERS
C0 = 0.2150E+00 CUNITS = ppb
NTOX = 1 CMC = 0.9500E-01 CCC = CSTD
NSTD = 1 CSTD = 0.2500E-01
REGMZ = 0
XINT = 2000.00 XMAX = 2000.00
X-Y-Z COORDINATE SYSTEM:
ORIGIN is located at the bottom and below the center of the port:
9.00 m from the LEFT bank/shore.
X-axis points downstream, Y-axis points to left, Z-axis points
upward.
NSTEP = 10 display intervals per module
-------------------------------------------------------------------
-------------------------------------------------------------------
BEGIN MOD101: DISCHARGE MODULE
X Y Z S C B Uc TT
0.00 0.00 0.70 1.0 0.215E+00 0.30 0.315 .00000E+00
END OF MOD101: DISCHARGE MODULE
-------------------------------------------------------------------
-------------------------------------------------------------------
BEGIN CORJET (MOD110): JET/PLUME NEAR-FIELD MIXING REGION
Jet-like motion in weak crossflow.
Zone of flow establishment: THETAE = -0.00 SIGMAE = 291.37
LE = 0.00 XE = 0.00 YE = -0.00 ZE = 0.70
Profile definitions:
B = Gaussian 1/e (37%) half-width, normal to trajectory
S = hydrodynamic centerline dilution
C = centerline concentration (includes reaction effects, if any)
Uc = Local centerline excess velocity (above ambient)
TT = Cumulative travel time
Anexos
Luz Marina Troya Pérez 172
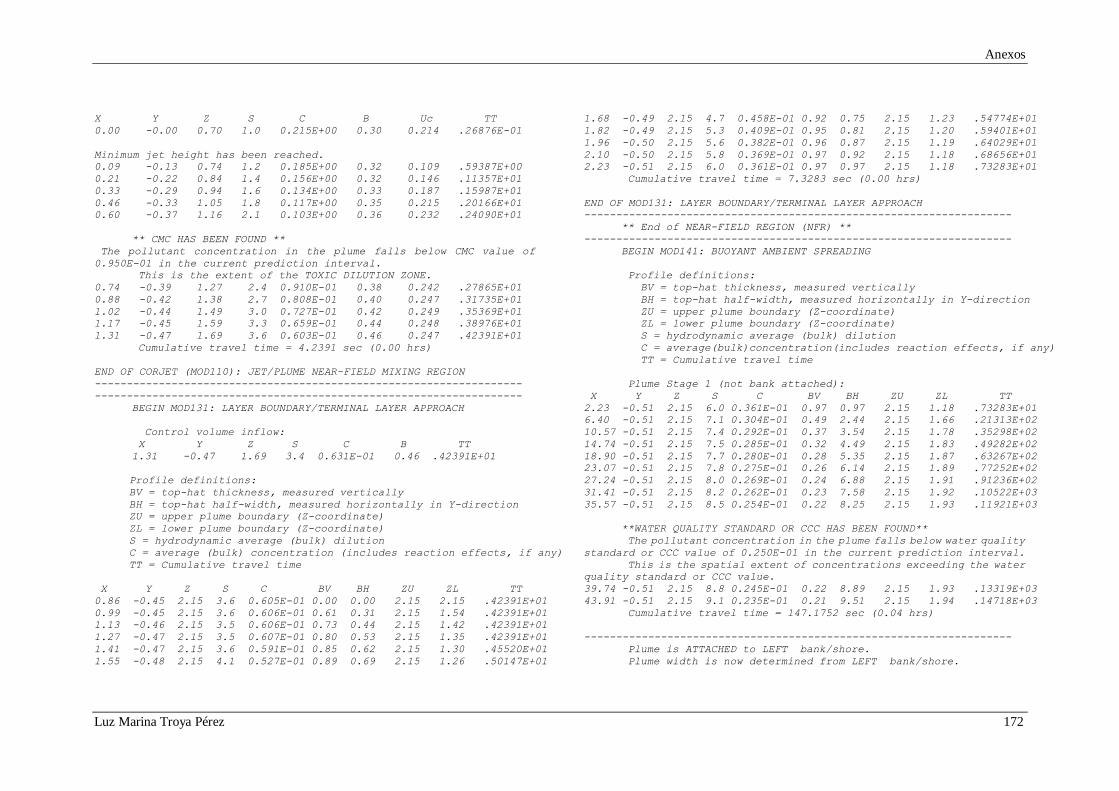
X Y Z S C B Uc TT
0.00 -0.00 0.70 1.0 0.215E+00 0.30 0.214 .26876E-01
Minimum jet height has been reached.
0.09 -0.13 0.74 1.2 0.185E+00 0.32 0.109 .59387E+00
0.21 -0.22 0.84 1.4 0.156E+00 0.32 0.146 .11357E+01
0.33 -0.29 0.94 1.6 0.134E+00 0.33 0.187 .15987E+01
0.46 -0.33 1.05 1.8 0.117E+00 0.35 0.215 .20166E+01
0.60 -0.37 1.16 2.1 0.103E+00 0.36 0.232 .24090E+01
** CMC HAS BEEN FOUND **
The pollutant concentration in the plume falls below CMC value of
0.950E-01 in the current prediction interval.
This is the extent of the TOXIC DILUTION ZONE.
0.74 -0.39 1.27 2.4 0.910E-01 0.38 0.242 .27865E+01
0.88 -0.42 1.38 2.7 0.808E-01 0.40 0.247 .31735E+01
1.02 -0.44 1.49 3.0 0.727E-01 0.42 0.249 .35369E+01
1.17 -0.45 1.59 3.3 0.659E-01 0.44 0.248 .38976E+01
1.31 -0.47 1.69 3.6 0.603E-01 0.46 0.247 .42391E+01
Cumulative travel time = 4.2391 sec (0.00 hrs)
END OF CORJET (MOD110): JET/PLUME NEAR-FIELD MIXING REGION
-------------------------------------------------------------------
-------------------------------------------------------------------
BEGIN MOD131: LAYER BOUNDARY/TERMINAL LAYER APPROACH
Control volume inflow:
X Y Z S C B TT
1.31 -0.47 1.69 3.4 0.631E-01 0.46 .42391E+01
Profile definitions:
BV = top-hat thickness, measured vertically
BH = top-hat half-width, measured horizontally in Y-direction
ZU = upper plume boundary (Z-coordinate)
ZL = lower plume boundary (Z-coordinate)
S = hydrodynamic average (bulk) dilution
C = average (bulk) concentration (includes reaction effects, if any)
TT = Cumulative travel time
X Y Z S C BV BH ZU ZL TT
0.86 -0.45 2.15 3.6 0.605E-01 0.00 0.00 2.15 2.15 .42391E+01
0.99 -0.45 2.15 3.6 0.606E-01 0.61 0.31 2.15 1.54 .42391E+01
1.13 -0.46 2.15 3.5 0.606E-01 0.73 0.44 2.15 1.42 .42391E+01
1.27 -0.47 2.15 3.5 0.607E-01 0.80 0.53 2.15 1.35 .42391E+01
1.41 -0.47 2.15 3.6 0.591E-01 0.85 0.62 2.15 1.30 .45520E+01
1.55 -0.48 2.15 4.1 0.527E-01 0.89 0.69 2.15 1.26 .50147E+01
1.68 -0.49 2.15 4.7 0.458E-01 0.92 0.75 2.15 1.23 .54774E+01
1.82 -0.49 2.15 5.3 0.409E-01 0.95 0.81 2.15 1.20 .59401E+01
1.96 -0.50 2.15 5.6 0.382E-01 0.96 0.87 2.15 1.19 .64029E+01
2.10 -0.50 2.15 5.8 0.369E-01 0.97 0.92 2.15 1.18 .68656E+01
2.23 -0.51 2.15 6.0 0.361E-01 0.97 0.97 2.15 1.18 .73283E+01
Cumulative travel time = 7.3283 sec (0.00 hrs)
END OF MOD131: LAYER BOUNDARY/TERMINAL LAYER APPROACH
-------------------------------------------------------------------
** End of NEAR-FIELD REGION (NFR) **
-------------------------------------------------------------------
BEGIN MOD141: BUOYANT AMBIENT SPREADING
Profile definitions:
BV = top-hat thickness, measured vertically
BH = top-hat half-width, measured horizontally in Y-direction
ZU = upper plume boundary (Z-coordinate)
ZL = lower plume boundary (Z-coordinate)
S = hydrodynamic average (bulk) dilution
C = average(bulk)concentration(includes reaction effects, if any)
TT = Cumulative travel time
Plume Stage 1 (not bank attached):
X Y Z S C BV BH ZU ZL TT
2.23 -0.51 2.15 6.0 0.361E-01 0.97 0.97 2.15 1.18 .73283E+01
6.40 -0.51 2.15 7.1 0.304E-01 0.49 2.44 2.15 1.66 .21313E+02
10.57 -0.51 2.15 7.4 0.292E-01 0.37 3.54 2.15 1.78 .35298E+02
14.74 -0.51 2.15 7.5 0.285E-01 0.32 4.49 2.15 1.83 .49282E+02
18.90 -0.51 2.15 7.7 0.280E-01 0.28 5.35 2.15 1.87 .63267E+02
23.07 -0.51 2.15 7.8 0.275E-01 0.26 6.14 2.15 1.89 .77252E+02
27.24 -0.51 2.15 8.0 0.269E-01 0.24 6.88 2.15 1.91 .91236E+02
31.41 -0.51 2.15 8.2 0.262E-01 0.23 7.58 2.15 1.92 .10522E+03
35.57 -0.51 2.15 8.5 0.254E-01 0.22 8.25 2.15 1.93 .11921E+03
**WATER QUALITY STANDARD OR CCC HAS BEEN FOUND**
The pollutant concentration in the plume falls below water quality
standard or CCC value of 0.250E-01 in the current prediction interval.
This is the spatial extent of concentrations exceeding the water
quality standard or CCC value.
39.74 -0.51 2.15 8.8 0.245E-01 0.22 8.89 2.15 1.93 .13319E+03
43.91 -0.51 2.15 9.1 0.235E-01 0.21 9.51 2.15 1.94 .14718E+03
Cumulative travel time = 147.1752 sec (0.04 hrs)
-------------------------------------------------------------------
Plume is ATTACHED to LEFT bank/shore.
Plume width is now determined from LEFT bank/shore.
Anexos
Luz Marina Troya Pérez 173
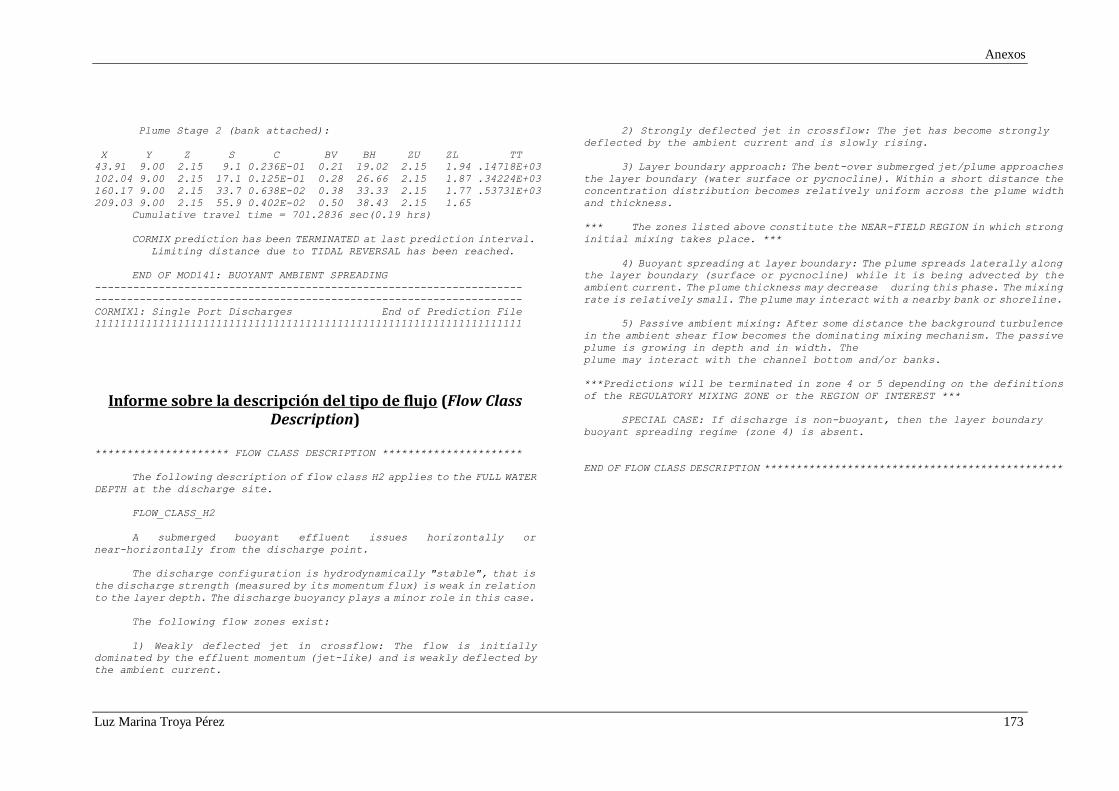
Plume Stage 2 (bank attached):
X Y Z S C BV BH ZU ZL TT
43.91 9.00 2.15 9.1 0.236E-01 0.21 19.02 2.15 1.94 .14718E+03
102.04 9.00 2.15 17.1 0.125E-01 0.28 26.66 2.15 1.87 .34224E+03
160.17 9.00 2.15 33.7 0.638E-02 0.38 33.33 2.15 1.77 .53731E+03
209.03 9.00 2.15 55.9 0.402E-02 0.50 38.43 2.15 1.65
Cumulative travel time = 701.2836 sec(0.19 hrs)
CORMIX prediction has been TERMINATED at last prediction interval.
Limiting distance due to TIDAL REVERSAL has been reached.
END OF MOD141: BUOYANT AMBIENT SPREADING
-------------------------------------------------------------------
-------------------------------------------------------------------
CORMIX1: Single Port Discharges End of Prediction File
1111111111111111111111111111111111111111111111111111111111111111111
Informe sobre la descripción del tipo de flujo (Flow Class Description)
********************* FLOW CLASS DESCRIPTION **********************
The following description of flow class H2 applies to the FULL WATER
DEPTH at the discharge site.
FLOW_CLASS_H2
A submerged buoyant effluent issues horizontally or
near-horizontally from the discharge point.
The discharge configuration is hydrodynamically "stable", that is
the discharge strength (measured by its momentum flux) is weak in relation
to the layer depth. The discharge buoyancy plays a minor role in this case.
The following flow zones exist:
1) Weakly deflected jet in crossflow: The flow is initially
dominated by the effluent momentum (jet-like) and is weakly deflected by
the ambient current.
2) Strongly deflected jet in crossflow: The jet has become strongly
deflected by the ambient current and is slowly rising.
3) Layer boundary approach: The bent-over submerged jet/plume approaches
the layer boundary (water surface or pycnocline). Within a short distance the
concentration distribution becomes relatively uniform across the plume width
and thickness.
*** The zones listed above constitute the NEAR-FIELD REGION in which strong
initial mixing takes place. ***
4) Buoyant spreading at layer boundary: The plume spreads laterally along
the layer boundary (surface or pycnocline) while it is being advected by the
ambient current. The plume thickness may decrease during this phase. The mixing
rate is relatively small. The plume may interact with a nearby bank or shoreline.
5) Passive ambient mixing: After some distance the background turbulence
in the ambient shear flow becomes the dominating mixing mechanism. The passive
plume is growing in depth and in width. The
plume may interact with the channel bottom and/or banks.
***Predictions will be terminated in zone 4 or 5 depending on the definitions
of the REGULATORY MIXING ZONE or the REGION OF INTEREST ***
SPECIAL CASE: If discharge is non-buoyant, then the layer boundary
buoyant spreading regime (zone 4) is absent.
END OF FLOW CLASS DESCRIPTION ***********************************************
Anexos
Luz Marina Troya Pérez 174
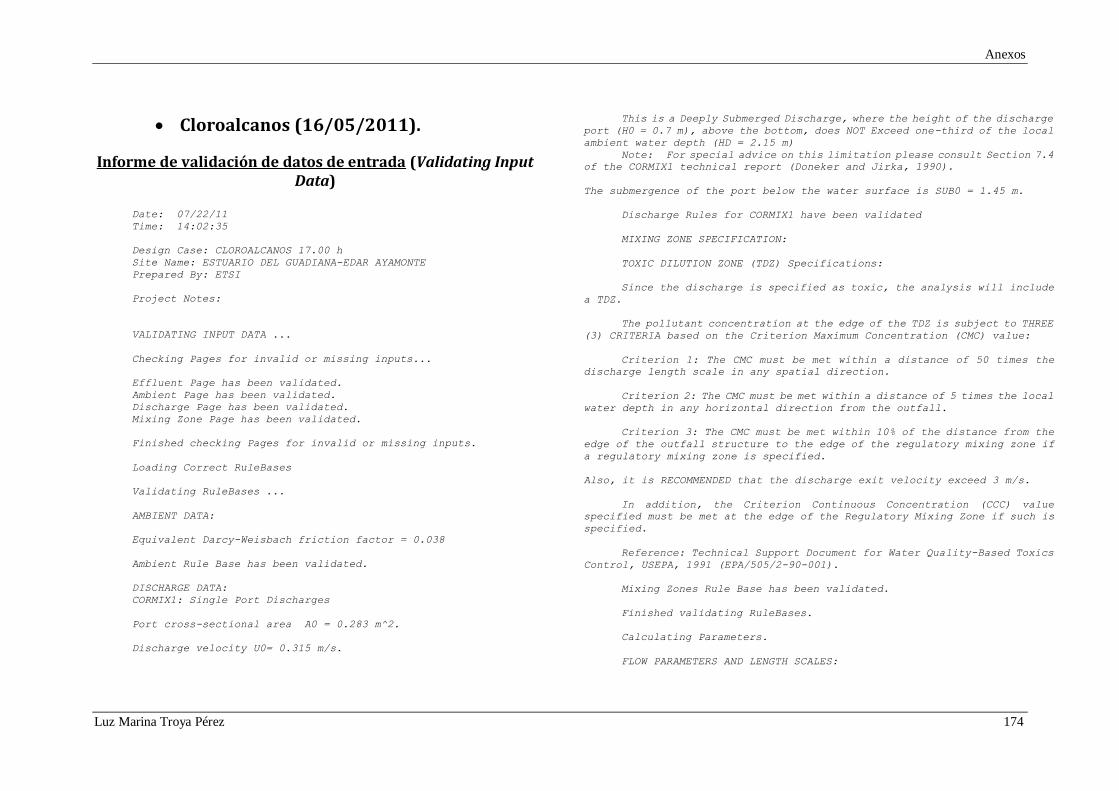
Cloroalcanos (16/05/2011).
Informe de validación de datos de entrada (Validating Input Data)
Date: 07/22/11
Time: 14:02:35
Design Case: CLOROALCANOS 17.00 h
Site Name: ESTUARIO DEL GUADIANA-EDAR AYAMONTE
Prepared By: ETSI
Project Notes:
VALIDATING INPUT DATA ...
Checking Pages for invalid or missing inputs...
Effluent Page has been validated.
Ambient Page has been validated.
Discharge Page has been validated.
Mixing Zone Page has been validated.
Finished checking Pages for invalid or missing inputs.
Loading Correct RuleBases
Validating RuleBases ...
AMBIENT DATA:
Equivalent Darcy-Weisbach friction factor = 0.038
Ambient Rule Base has been validated.
DISCHARGE DATA:
CORMIX1: Single Port Discharges
Port cross-sectional area A0 = 0.283 m^2.
Discharge velocity U0= 0.315 m/s.
This is a Deeply Submerged Discharge, where the height of the discharge
port (H0 = 0.7 m), above the bottom, does NOT Exceed one-third of the local
ambient water depth (HD = 2.15 m)
Note: For special advice on this limitation please consult Section 7.4
of the CORMIX1 technical report (Doneker and Jirka, 1990).
The submergence of the port below the water surface is SUB0 = 1.45 m.
Discharge Rules for CORMIX1 have been validated
MIXING ZONE SPECIFICATION:
TOXIC DILUTION ZONE (TDZ) Specifications:
Since the discharge is specified as toxic, the analysis will include
a TDZ.
The pollutant concentration at the edge of the TDZ is subject to THREE
(3) CRITERIA based on the Criterion Maximum Concentration (CMC) value:
Criterion 1: The CMC must be met within a distance of 50 times the
discharge length scale in any spatial direction.
Criterion 2: The CMC must be met within a distance of 5 times the local
water depth in any horizontal direction from the outfall.
Criterion 3: The CMC must be met within 10% of the distance from the
edge of the outfall structure to the edge of the regulatory mixing zone if
a regulatory mixing zone is specified.
Also, it is RECOMMENDED that the discharge exit velocity exceed 3 m/s.
In addition, the Criterion Continuous Concentration (CCC) value
specified must be met at the edge of the Regulatory Mixing Zone if such is
specified.
Reference: Technical Support Document for Water Quality-Based Toxics
Control, USEPA, 1991 (EPA/505/2-90-001).
Mixing Zones Rule Base has been validated.
Finished validating RuleBases.
Calculating Parameters.
FLOW PARAMETERS AND LENGTH SCALES:
Anexos
Luz Marina Troya Pérez 175
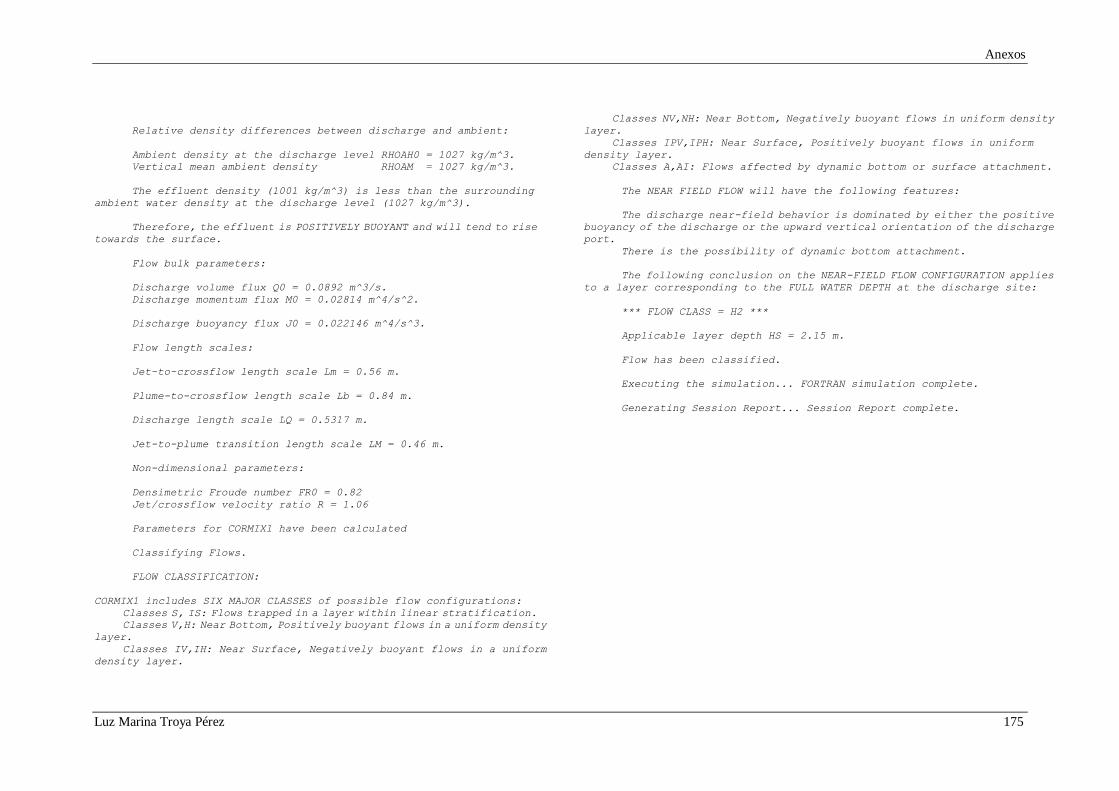
Relative density differences between discharge and ambient:
Ambient density at the discharge level RHOAH0 = 1027 kg/m^3.
Vertical mean ambient density RHOAM = 1027 kg/m^3.
The effluent density (1001 kg/m^3) is less than the surrounding
ambient water density at the discharge level (1027 kg/m^3).
Therefore, the effluent is POSITIVELY BUOYANT and will tend to rise
towards the surface.
Flow bulk parameters:
Discharge volume flux Q0 = 0.0892 m^3/s.
Discharge momentum flux M0 = 0.02814 m^4/s^2.
Discharge buoyancy flux J0 = 0.022146 m^4/s^3.
Flow length scales:
Jet-to-crossflow length scale Lm = 0.56 m.
Plume-to-crossflow length scale Lb = 0.84 m.
Discharge length scale LQ = 0.5317 m.
Jet-to-plume transition length scale LM = 0.46 m.
Non-dimensional parameters:
Densimetric Froude number FR0 = 0.82
Jet/crossflow velocity ratio R = 1.06
Parameters for CORMIX1 have been calculated
Classifying Flows.
FLOW CLASSIFICATION:
CORMIX1 includes SIX MAJOR CLASSES of possible flow configurations:
Classes S, IS: Flows trapped in a layer within linear stratification.
Classes V,H: Near Bottom, Positively buoyant flows in a uniform density
layer.
Classes IV,IH: Near Surface, Negatively buoyant flows in a uniform
density layer.
Classes NV,NH: Near Bottom, Negatively buoyant flows in uniform density
layer.
Classes IPV,IPH: Near Surface, Positively buoyant flows in uniform
density layer.
Classes A,AI: Flows affected by dynamic bottom or surface attachment.
The NEAR FIELD FLOW will have the following features:
The discharge near-field behavior is dominated by either the positive
buoyancy of the discharge or the upward vertical orientation of the discharge
port.
There is the possibility of dynamic bottom attachment.
The following conclusion on the NEAR-FIELD FLOW CONFIGURATION applies
to a layer corresponding to the FULL WATER DEPTH at the discharge site:
*** FLOW CLASS = H2 ***
Applicable layer depth HS = 2.15 m.
Flow has been classified.
Executing the simulation... FORTRAN simulation complete.
Generating Session Report... Session Report complete.
Anexos
Luz Marina Troya Pérez 176
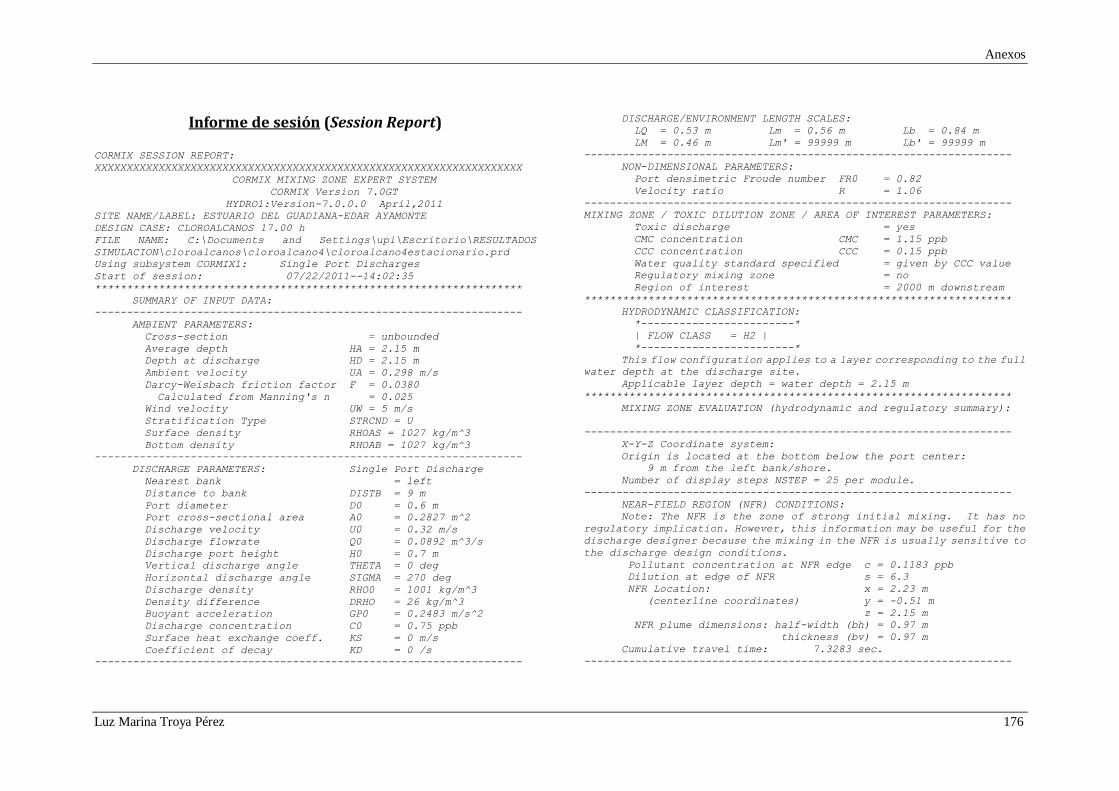
Informe de sesión (Session Report)
CORMIX SESSION REPORT:
XXXXXXXXXXXXXXXXXXXXXXXXXXXXXXXXXXXXXXXXXXXXXXXXXXXXXXXXXXXXXXXXXXX
CORMIX MIXING ZONE EXPERT SYSTEM
CORMIX Version 7.0GT
HYDRO1:Version-7.0.0.0 April,2011
SITE NAME/LABEL: ESTUARIO DEL GUADIANA-EDAR AYAMONTE
DESIGN CASE: CLOROALCANOS 17.00 h
FILE NAME: C:\Documents and Settings\upi\Escritorio\RESULTADOS
SIMULACION\cloroalcanos\cloroalcano4\cloroalcano4estacionario.prd
Using subsystem CORMIX1: Single Port Discharges
Start of session: 07/22/2011--14:02:35
*******************************************************************
SUMMARY OF INPUT DATA:
-------------------------------------------------------------------
AMBIENT PARAMETERS:
Cross-section = unbounded
Average depth HA = 2.15 m
Depth at discharge HD = 2.15 m
Ambient velocity UA = 0.298 m/s
Darcy-Weisbach friction factor F = 0.0380
Calculated from Manning's n = 0.025
Wind velocity UW = 5 m/s
Stratification Type STRCND = U
Surface density RHOAS = 1027 kg/m^3
Bottom density RHOAB = 1027 kg/m^3
-------------------------------------------------------------------
DISCHARGE PARAMETERS: Single Port Discharge
Nearest bank = left
Distance to bank DISTB = 9 m
Port diameter D0 = 0.6 m
Port cross-sectional area A0 = 0.2827 m^2
Discharge velocity U0 = 0.32 m/s
Discharge flowrate Q0 = 0.0892 m^3/s
Discharge port height H0 = 0.7 m
Vertical discharge angle THETA = 0 deg
Horizontal discharge angle SIGMA = 270 deg
Discharge density RHO0 = 1001 kg/m^3
Density difference DRHO = 26 kg/m^3
Buoyant acceleration GP0 = 0.2483 m/s^2
Discharge concentration C0 = 0.75 ppb
Surface heat exchange coeff. KS = 0 m/s
Coefficient of decay KD = 0 /s
-------------------------------------------------------------------
DISCHARGE/ENVIRONMENT LENGTH SCALES:
LQ = 0.53 m Lm = 0.56 m Lb = 0.84 m
LM = 0.46 m Lm' = 99999 m Lb' = 99999 m
-------------------------------------------------------------------
NON-DIMENSIONAL PARAMETERS:
Port densimetric Froude number FR0 = 0.82
Velocity ratio R = 1.06
-------------------------------------------------------------------
MIXING ZONE / TOXIC DILUTION ZONE / AREA OF INTEREST PARAMETERS:
Toxic discharge = yes
CMC concentration CMC = 1.15 ppb
CCC concentration CCC = 0.15 ppb
Water quality standard specified = given by CCC value
Regulatory mixing zone = no
Region of interest = 2000 m downstream
*******************************************************************
HYDRODYNAMIC CLASSIFICATION:
*------------------------*
| FLOW CLASS = H2 |
*------------------------*
This flow configuration applies to a layer corresponding to the full
water depth at the discharge site.
Applicable layer depth = water depth = 2.15 m
*******************************************************************
MIXING ZONE EVALUATION (hydrodynamic and regulatory summary):
-------------------------------------------------------------------
X-Y-Z Coordinate system:
Origin is located at the bottom below the port center:
9 m from the left bank/shore.
Number of display steps NSTEP = 25 per module.
-------------------------------------------------------------------
NEAR-FIELD REGION (NFR) CONDITIONS:
Note: The NFR is the zone of strong initial mixing. It has no
regulatory implication. However, this information may be useful for the
discharge designer because the mixing in the NFR is usually sensitive to
the discharge design conditions.
Pollutant concentration at NFR edge c = 0.1183 ppb
Dilution at edge of NFR s = 6.3
NFR Location: x = 2.23 m
(centerline coordinates) y = -0.51 m
z = 2.15 m
NFR plume dimensions: half-width (bh) = 0.97 m
thickness (bv) = 0.97 m
Cumulative travel time: 7.3283 sec.
-------------------------------------------------------------------
Anexos
Luz Marina Troya Pérez 177
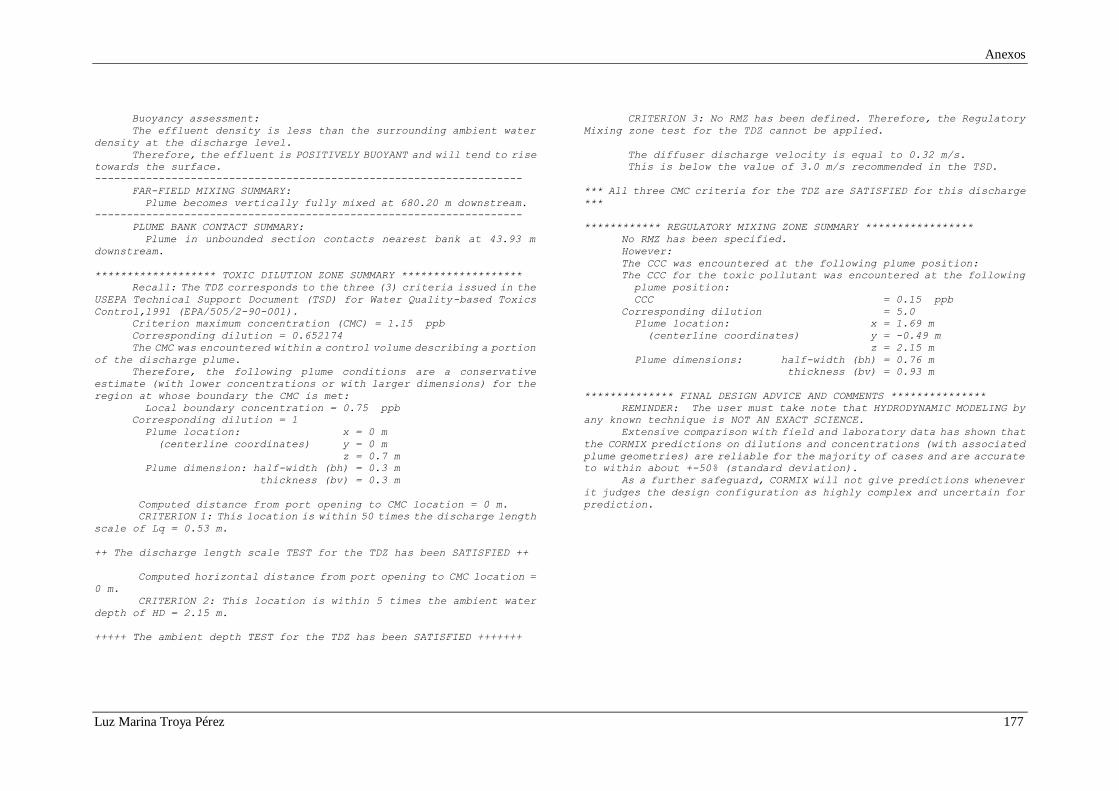
Buoyancy assessment:
The effluent density is less than the surrounding ambient water
density at the discharge level.
Therefore, the effluent is POSITIVELY BUOYANT and will tend to rise
towards the surface.
-------------------------------------------------------------------
FAR-FIELD MIXING SUMMARY:
Plume becomes vertically fully mixed at 680.20 m downstream.
-------------------------------------------------------------------
PLUME BANK CONTACT SUMMARY:
Plume in unbounded section contacts nearest bank at 43.93 m
downstream.
******************* TOXIC DILUTION ZONE SUMMARY *******************
Recall: The TDZ corresponds to the three (3) criteria issued in the
USEPA Technical Support Document (TSD) for Water Quality-based Toxics
Control,1991 (EPA/505/2-90-001).
Criterion maximum concentration (CMC) = 1.15 ppb
Corresponding dilution = 0.652174
The CMC was encountered within a control volume describing a portion
of the discharge plume.
Therefore, the following plume conditions are a conservative
estimate (with lower concentrations or with larger dimensions) for the
region at whose boundary the CMC is met:
Local boundary concentration = 0.75 ppb
Corresponding dilution = 1
Plume location: x = 0 m
(centerline coordinates) y = 0 m
z = 0.7 m
Plume dimension: half-width (bh) = 0.3 m
thickness (bv) = 0.3 m
Computed distance from port opening to CMC location = 0 m.
CRITERION 1: This location is within 50 times the discharge length
scale of Lq = 0.53 m.
++ The discharge length scale TEST for the TDZ has been SATISFIED ++
Computed horizontal distance from port opening to CMC location =
0 m.
CRITERION 2: This location is within 5 times the ambient water
depth of HD = 2.15 m.
+++++ The ambient depth TEST for the TDZ has been SATISFIED +++++++
CRITERION 3: No RMZ has been defined. Therefore, the Regulatory
Mixing zone test for the TDZ cannot be applied.
The diffuser discharge velocity is equal to 0.32 m/s.
This is below the value of 3.0 m/s recommended in the TSD.
*** All three CMC criteria for the TDZ are SATISFIED for this discharge
***
************ REGULATORY MIXING ZONE SUMMARY *****************
No RMZ has been specified.
However:
The CCC was encountered at the following plume position:
The CCC for the toxic pollutant was encountered at the following
plume position:
CCC = 0.15 ppb
Corresponding dilution = 5.0
Plume location: x = 1.69 m
(centerline coordinates) y = -0.49 m
z = 2.15 m
Plume dimensions: half-width (bh) = 0.76 m
thickness (bv) = 0.93 m
************** FINAL DESIGN ADVICE AND COMMENTS ***************
REMINDER: The user must take note that HYDRODYNAMIC MODELING by
any known technique is NOT AN EXACT SCIENCE.
Extensive comparison with field and laboratory data has shown that
the CORMIX predictions on dilutions and concentrations (with associated
plume geometries) are reliable for the majority of cases and are accurate
to within about +-50% (standard deviation).
As a further safeguard, CORMIX will not give predictions whenever
it judges the design configuration as highly complex and uncertain for
prediction.
Anexos
Luz Marina Troya Pérez 178
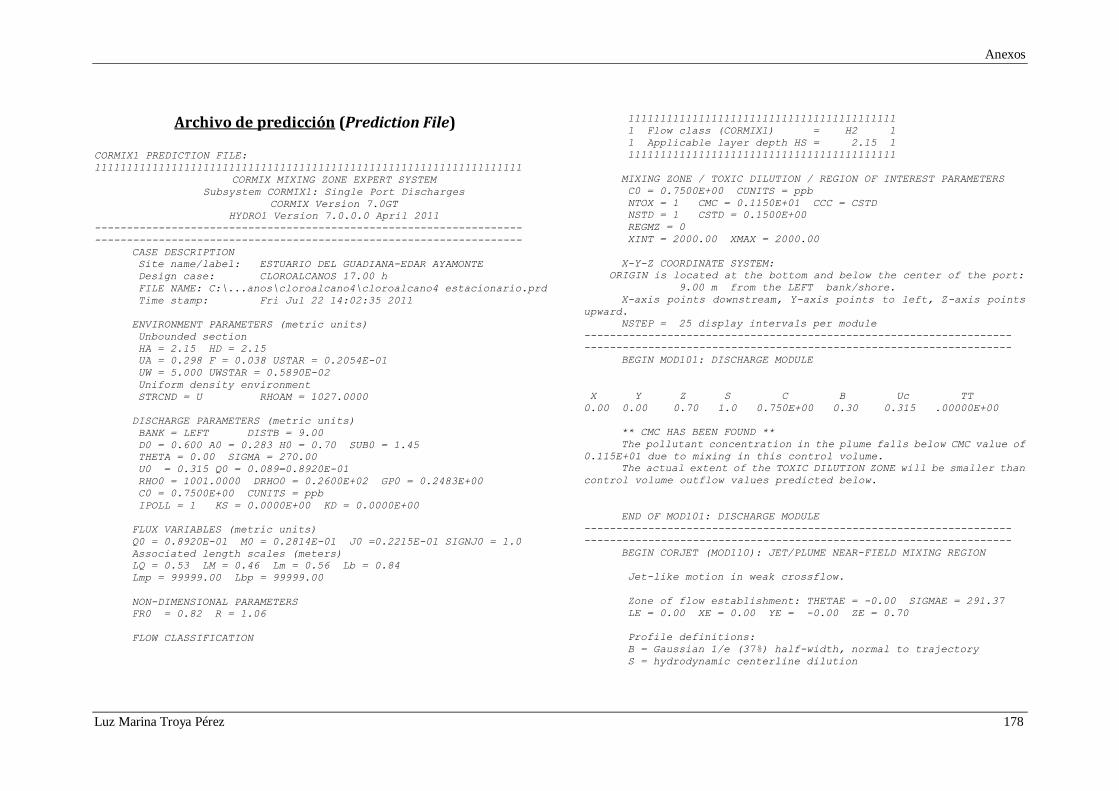
Archivo de predicción (Prediction File)
CORMIX1 PREDICTION FILE:
1111111111111111111111111111111111111111111111111111111111111111111
CORMIX MIXING ZONE EXPERT SYSTEM
Subsystem CORMIX1: Single Port Discharges
CORMIX Version 7.0GT
HYDRO1 Version 7.0.0.0 April 2011
-------------------------------------------------------------------
-------------------------------------------------------------------
CASE DESCRIPTION
Site name/label: ESTUARIO DEL GUADIANA-EDAR AYAMONTE
Design case: CLOROALCANOS 17.00 h
FILE NAME: C:\...anos\cloroalcano4\cloroalcano4 estacionario.prd
Time stamp: Fri Jul 22 14:02:35 2011
ENVIRONMENT PARAMETERS (metric units)
Unbounded section
HA = 2.15 HD = 2.15
UA = 0.298 F = 0.038 USTAR = 0.2054E-01
UW = 5.000 UWSTAR = 0.5890E-02
Uniform density environment
STRCND = U RHOAM = 1027.0000
DISCHARGE PARAMETERS (metric units)
BANK = LEFT DISTB = 9.00
D0 = 0.600 A0 = 0.283 H0 = 0.70 SUB0 = 1.45
THETA = 0.00 SIGMA = 270.00
U0 = 0.315 Q0 = 0.089=0.8920E-01
RHO0 = 1001.0000 DRHO0 = 0.2600E+02 GP0 = 0.2483E+00
C0 = 0.7500E+00 CUNITS = ppb
IPOLL = 1 KS = 0.0000E+00 KD = 0.0000E+00
FLUX VARIABLES (metric units)
Q0 = 0.8920E-01 M0 = 0.2814E-01 J0 =0.2215E-01 SIGNJ0 = 1.0
Associated length scales (meters)
LQ = 0.53 LM = 0.46 Lm = 0.56 Lb = 0.84
Lmp = 99999.00 Lbp = 99999.00
NON-DIMENSIONAL PARAMETERS
FR0 = 0.82 R = 1.06
FLOW CLASSIFICATION
111111111111111111111111111111111111111111
1 Flow class (CORMIX1) = H2 1
1 Applicable layer depth HS = 2.15 1
111111111111111111111111111111111111111111
MIXING ZONE / TOXIC DILUTION / REGION OF INTEREST PARAMETERS
C0 = 0.7500E+00 CUNITS = ppb
NTOX = 1 CMC = 0.1150E+01 CCC = CSTD
NSTD = 1 CSTD = 0.1500E+00
REGMZ = 0
XINT = 2000.00 XMAX = 2000.00
X-Y-Z COORDINATE SYSTEM:
ORIGIN is located at the bottom and below the center of the port:
9.00 m from the LEFT bank/shore.
X-axis points downstream, Y-axis points to left, Z-axis points
upward.
NSTEP = 25 display intervals per module
-------------------------------------------------------------------
-------------------------------------------------------------------
BEGIN MOD101: DISCHARGE MODULE
X Y Z S C B Uc TT
0.00 0.00 0.70 1.0 0.750E+00 0.30 0.315 .00000E+00
** CMC HAS BEEN FOUND **
The pollutant concentration in the plume falls below CMC value of
0.115E+01 due to mixing in this control volume.
The actual extent of the TOXIC DILUTION ZONE will be smaller than
control volume outflow values predicted below.
END OF MOD101: DISCHARGE MODULE
-------------------------------------------------------------------
-------------------------------------------------------------------
BEGIN CORJET (MOD110): JET/PLUME NEAR-FIELD MIXING REGION
Jet-like motion in weak crossflow.
Zone of flow establishment: THETAE = -0.00 SIGMAE = 291.37
LE = 0.00 XE = 0.00 YE = -0.00 ZE = 0.70
Profile definitions:
B = Gaussian 1/e (37%) half-width, normal to trajectory
S = hydrodynamic centerline dilution
Anexos
Luz Marina Troya Pérez 179
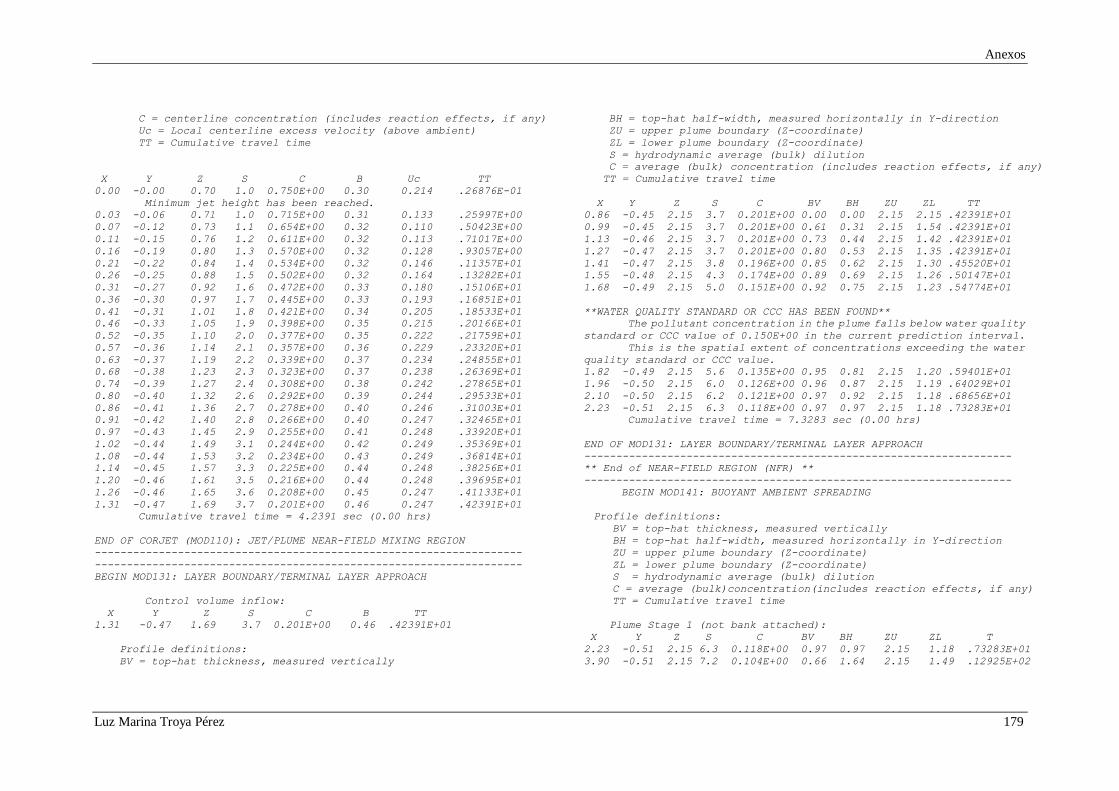
C = centerline concentration (includes reaction effects, if any)
Uc = Local centerline excess velocity (above ambient)
TT = Cumulative travel time
X Y Z S C B Uc TT
0.00 -0.00 0.70 1.0 0.750E+00 0.30 0.214 .26876E-01
Minimum jet height has been reached.
0.03 -0.06 0.71 1.0 0.715E+00 0.31 0.133 .25997E+00
0.07 -0.12 0.73 1.1 0.654E+00 0.32 0.110 .50423E+00
0.11 -0.15 0.76 1.2 0.611E+00 0.32 0.113 .71017E+00
0.16 -0.19 0.80 1.3 0.570E+00 0.32 0.128 .93057E+00
0.21 -0.22 0.84 1.4 0.534E+00 0.32 0.146 .11357E+01
0.26 -0.25 0.88 1.5 0.502E+00 0.32 0.164 .13282E+01
0.31 -0.27 0.92 1.6 0.472E+00 0.33 0.180 .15106E+01
0.36 -0.30 0.97 1.7 0.445E+00 0.33 0.193 .16851E+01
0.41 -0.31 1.01 1.8 0.421E+00 0.34 0.205 .18533E+01
0.46 -0.33 1.05 1.9 0.398E+00 0.35 0.215 .20166E+01
0.52 -0.35 1.10 2.0 0.377E+00 0.35 0.222 .21759E+01
0.57 -0.36 1.14 2.1 0.357E+00 0.36 0.229 .23320E+01
0.63 -0.37 1.19 2.2 0.339E+00 0.37 0.234 .24855E+01
0.68 -0.38 1.23 2.3 0.323E+00 0.37 0.238 .26369E+01
0.74 -0.39 1.27 2.4 0.308E+00 0.38 0.242 .27865E+01
0.80 -0.40 1.32 2.6 0.292E+00 0.39 0.244 .29533E+01
0.86 -0.41 1.36 2.7 0.278E+00 0.40 0.246 .31003E+01
0.91 -0.42 1.40 2.8 0.266E+00 0.40 0.247 .32465E+01
0.97 -0.43 1.45 2.9 0.255E+00 0.41 0.248 .33920E+01
1.02 -0.44 1.49 3.1 0.244E+00 0.42 0.249 .35369E+01
1.08 -0.44 1.53 3.2 0.234E+00 0.43 0.249 .36814E+01
1.14 -0.45 1.57 3.3 0.225E+00 0.44 0.248 .38256E+01
1.20 -0.46 1.61 3.5 0.216E+00 0.44 0.248 .39695E+01
1.26 -0.46 1.65 3.6 0.208E+00 0.45 0.247 .41133E+01
1.31 -0.47 1.69 3.7 0.201E+00 0.46 0.247 .42391E+01
Cumulative travel time = 4.2391 sec (0.00 hrs)
END OF CORJET (MOD110): JET/PLUME NEAR-FIELD MIXING REGION
-------------------------------------------------------------------
-------------------------------------------------------------------
BEGIN MOD131: LAYER BOUNDARY/TERMINAL LAYER APPROACH
Control volume inflow:
X Y Z S C B TT
1.31 -0.47 1.69 3.7 0.201E+00 0.46 .42391E+01
Profile definitions:
BV = top-hat thickness, measured vertically
BH = top-hat half-width, measured horizontally in Y-direction
ZU = upper plume boundary (Z-coordinate)
ZL = lower plume boundary (Z-coordinate)
S = hydrodynamic average (bulk) dilution
C = average (bulk) concentration (includes reaction effects, if any)
TT = Cumulative travel time
X Y Z S C BV BH ZU ZL TT
0.86 -0.45 2.15 3.7 0.201E+00 0.00 0.00 2.15 2.15 .42391E+01
0.99 -0.45 2.15 3.7 0.201E+00 0.61 0.31 2.15 1.54 .42391E+01
1.13 -0.46 2.15 3.7 0.201E+00 0.73 0.44 2.15 1.42 .42391E+01
1.27 -0.47 2.15 3.7 0.201E+00 0.80 0.53 2.15 1.35 .42391E+01
1.41 -0.47 2.15 3.8 0.196E+00 0.85 0.62 2.15 1.30 .45520E+01
1.55 -0.48 2.15 4.3 0.174E+00 0.89 0.69 2.15 1.26 .50147E+01
1.68 -0.49 2.15 5.0 0.151E+00 0.92 0.75 2.15 1.23 .54774E+01
**WATER QUALITY STANDARD OR CCC HAS BEEN FOUND**
The pollutant concentration in the plume falls below water quality
standard or CCC value of 0.150E+00 in the current prediction interval.
This is the spatial extent of concentrations exceeding the water
quality standard or CCC value.
1.82 -0.49 2.15 5.6 0.135E+00 0.95 0.81 2.15 1.20 .59401E+01
1.96 -0.50 2.15 6.0 0.126E+00 0.96 0.87 2.15 1.19 .64029E+01
2.10 -0.50 2.15 6.2 0.121E+00 0.97 0.92 2.15 1.18 .68656E+01
2.23 -0.51 2.15 6.3 0.118E+00 0.97 0.97 2.15 1.18 .73283E+01
Cumulative travel time = 7.3283 sec (0.00 hrs)
END OF MOD131: LAYER BOUNDARY/TERMINAL LAYER APPROACH
-------------------------------------------------------------------
** End of NEAR-FIELD REGION (NFR) **
-------------------------------------------------------------------
BEGIN MOD141: BUOYANT AMBIENT SPREADING
Profile definitions:
BV = top-hat thickness, measured vertically
BH = top-hat half-width, measured horizontally in Y-direction
ZU = upper plume boundary (Z-coordinate)
ZL = lower plume boundary (Z-coordinate)
S = hydrodynamic average (bulk) dilution
C = average (bulk)concentration(includes reaction effects, if any)
TT = Cumulative travel time
Plume Stage 1 (not bank attached):
X Y Z S C BV BH ZU ZL T
2.23 -0.51 2.15 6.3 0.118E+00 0.97 0.97 2.15 1.18 .73283E+01
3.90 -0.51 2.15 7.2 0.104E+00 0.66 1.64 2.15 1.49 .12925E+02
Anexos
Luz Marina Troya Pérez 180
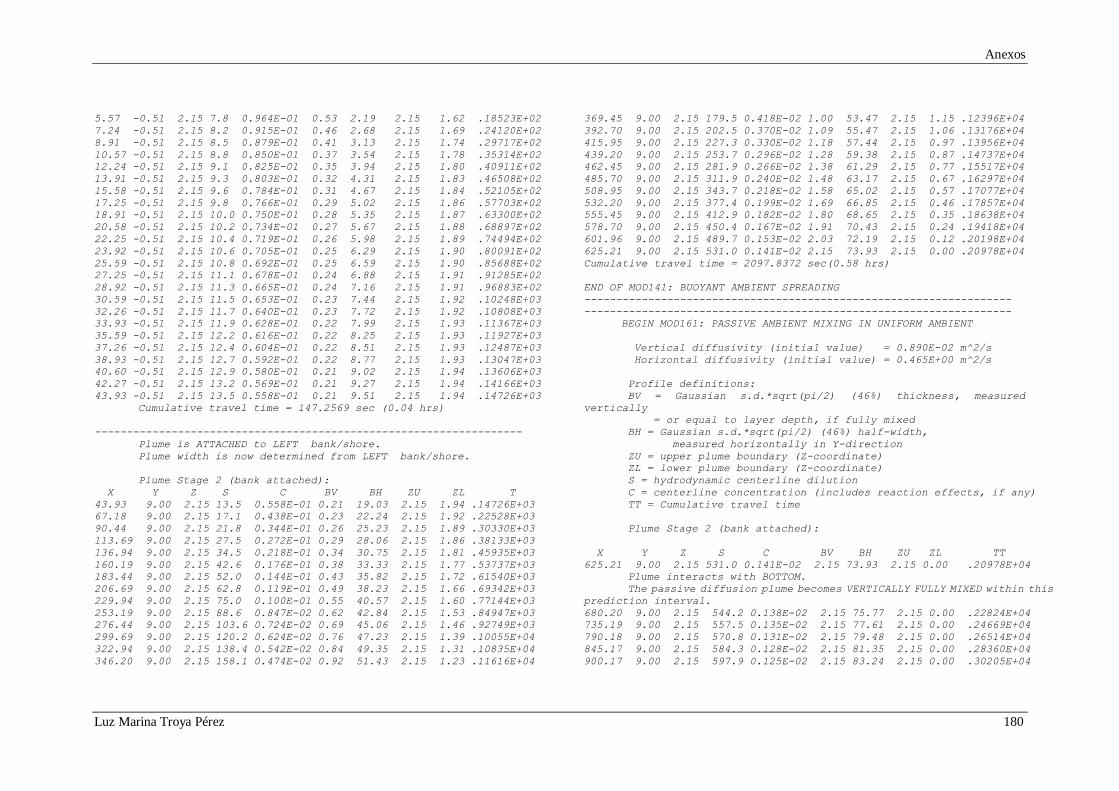
5.57 -0.51 2.15 7.8 0.964E-01 0.53 2.19 2.15 1.62 .18523E+02
7.24 -0.51 2.15 8.2 0.915E-01 0.46 2.68 2.15 1.69 .24120E+02
8.91 -0.51 2.15 8.5 0.879E-01 0.41 3.13 2.15 1.74 .29717E+02
10.57 -0.51 2.15 8.8 0.850E-01 0.37 3.54 2.15 1.78 .35314E+02
12.24 -0.51 2.15 9.1 0.825E-01 0.35 3.94 2.15 1.80 .40911E+02
13.91 -0.51 2.15 9.3 0.803E-01 0.32 4.31 2.15 1.83 .46508E+02
15.58 -0.51 2.15 9.6 0.784E-01 0.31 4.67 2.15 1.84 .52105E+02
17.25 -0.51 2.15 9.8 0.766E-01 0.29 5.02 2.15 1.86 .57703E+02
18.91 -0.51 2.15 10.0 0.750E-01 0.28 5.35 2.15 1.87 .63300E+02
20.58 -0.51 2.15 10.2 0.734E-01 0.27 5.67 2.15 1.88 .68897E+02
22.25 -0.51 2.15 10.4 0.719E-01 0.26 5.98 2.15 1.89 .74494E+02
23.92 -0.51 2.15 10.6 0.705E-01 0.25 6.29 2.15 1.90 .80091E+02
25.59 -0.51 2.15 10.8 0.692E-01 0.25 6.59 2.15 1.90 .85688E+02
27.25 -0.51 2.15 11.1 0.678E-01 0.24 6.88 2.15 1.91 .91285E+02
28.92 -0.51 2.15 11.3 0.665E-01 0.24 7.16 2.15 1.91 .96883E+02
30.59 -0.51 2.15 11.5 0.653E-01 0.23 7.44 2.15 1.92 .10248E+03
32.26 -0.51 2.15 11.7 0.640E-01 0.23 7.72 2.15 1.92 .10808E+03
33.93 -0.51 2.15 11.9 0.628E-01 0.22 7.99 2.15 1.93 .11367E+03
35.59 -0.51 2.15 12.2 0.616E-01 0.22 8.25 2.15 1.93 .11927E+03
37.26 -0.51 2.15 12.4 0.604E-01 0.22 8.51 2.15 1.93 .12487E+03
38.93 -0.51 2.15 12.7 0.592E-01 0.22 8.77 2.15 1.93 .13047E+03
40.60 -0.51 2.15 12.9 0.580E-01 0.21 9.02 2.15 1.94 .13606E+03
42.27 -0.51 2.15 13.2 0.569E-01 0.21 9.27 2.15 1.94 .14166E+03
43.93 -0.51 2.15 13.5 0.558E-01 0.21 9.51 2.15 1.94 .14726E+03
Cumulative travel time = 147.2569 sec (0.04 hrs)
-------------------------------------------------------------------
Plume is ATTACHED to LEFT bank/shore.
Plume width is now determined from LEFT bank/shore.
Plume Stage 2 (bank attached):
X Y Z S C BV BH ZU ZL T
43.93 9.00 2.15 13.5 0.558E-01 0.21 19.03 2.15 1.94 .14726E+03
67.18 9.00 2.15 17.1 0.438E-01 0.23 22.24 2.15 1.92 .22528E+03
90.44 9.00 2.15 21.8 0.344E-01 0.26 25.23 2.15 1.89 .30330E+03
113.69 9.00 2.15 27.5 0.272E-01 0.29 28.06 2.15 1.86 .38133E+03
136.94 9.00 2.15 34.5 0.218E-01 0.34 30.75 2.15 1.81 .45935E+03
160.19 9.00 2.15 42.6 0.176E-01 0.38 33.33 2.15 1.77 .53737E+03
183.44 9.00 2.15 52.0 0.144E-01 0.43 35.82 2.15 1.72 .61540E+03
206.69 9.00 2.15 62.8 0.119E-01 0.49 38.23 2.15 1.66 .69342E+03
229.94 9.00 2.15 75.0 0.100E-01 0.55 40.57 2.15 1.60 .77144E+03
253.19 9.00 2.15 88.6 0.847E-02 0.62 42.84 2.15 1.53 .84947E+03
276.44 9.00 2.15 103.6 0.724E-02 0.69 45.06 2.15 1.46 .92749E+03
299.69 9.00 2.15 120.2 0.624E-02 0.76 47.23 2.15 1.39 .10055E+04
322.94 9.00 2.15 138.4 0.542E-02 0.84 49.35 2.15 1.31 .10835E+04
346.20 9.00 2.15 158.1 0.474E-02 0.92 51.43 2.15 1.23 .11616E+04
369.45 9.00 2.15 179.5 0.418E-02 1.00 53.47 2.15 1.15 .12396E+04
392.70 9.00 2.15 202.5 0.370E-02 1.09 55.47 2.15 1.06 .13176E+04
415.95 9.00 2.15 227.3 0.330E-02 1.18 57.44 2.15 0.97 .13956E+04
439.20 9.00 2.15 253.7 0.296E-02 1.28 59.38 2.15 0.87 .14737E+04
462.45 9.00 2.15 281.9 0.266E-02 1.38 61.29 2.15 0.77 .15517E+04
485.70 9.00 2.15 311.9 0.240E-02 1.48 63.17 2.15 0.67 .16297E+04
508.95 9.00 2.15 343.7 0.218E-02 1.58 65.02 2.15 0.57 .17077E+04
532.20 9.00 2.15 377.4 0.199E-02 1.69 66.85 2.15 0.46 .17857E+04
555.45 9.00 2.15 412.9 0.182E-02 1.80 68.65 2.15 0.35 .18638E+04
578.70 9.00 2.15 450.4 0.167E-02 1.91 70.43 2.15 0.24 .19418E+04
601.96 9.00 2.15 489.7 0.153E-02 2.03 72.19 2.15 0.12 .20198E+04
625.21 9.00 2.15 531.0 0.141E-02 2.15 73.93 2.15 0.00 .20978E+04
Cumulative travel time = 2097.8372 sec(0.58 hrs)
END OF MOD141: BUOYANT AMBIENT SPREADING
-------------------------------------------------------------------
-------------------------------------------------------------------
BEGIN MOD161: PASSIVE AMBIENT MIXING IN UNIFORM AMBIENT
Vertical diffusivity (initial value) = 0.890E-02 m^2/s
Horizontal diffusivity (initial value) = 0.465E+00 m^2/s
Profile definitions:
BV = Gaussian s.d.*sqrt(pi/2) (46%) thickness, measured
vertically
= or equal to layer depth, if fully mixed
BH = Gaussian s.d.*sqrt(pi/2) (46%) half-width,
measured horizontally in Y-direction
ZU = upper plume boundary (Z-coordinate)
ZL = lower plume boundary (Z-coordinate)
S = hydrodynamic centerline dilution
C = centerline concentration (includes reaction effects, if any)
TT = Cumulative travel time
Plume Stage 2 (bank attached):
X Y Z S C BV BH ZU ZL TT
625.21 9.00 2.15 531.0 0.141E-02 2.15 73.93 2.15 0.00 .20978E+04
Plume interacts with BOTTOM.
The passive diffusion plume becomes VERTICALLY FULLY MIXED within this
prediction interval.
680.20 9.00 2.15 544.2 0.138E-02 2.15 75.77 2.15 0.00 .22824E+04
735.19 9.00 2.15 557.5 0.135E-02 2.15 77.61 2.15 0.00 .24669E+04
790.18 9.00 2.15 570.8 0.131E-02 2.15 79.48 2.15 0.00 .26514E+04
845.17 9.00 2.15 584.3 0.128E-02 2.15 81.35 2.15 0.00 .28360E+04
900.17 9.00 2.15 597.9 0.125E-02 2.15 83.24 2.15 0.00 .30205E+04
Anexos
Luz Marina Troya Pérez 181
955.16 9.00 2.15 611.6 0.123E-02 2.15 85.15 2.15 0.00 .32051E+04
1010.15 9.00 2.15 625.4 0.120E-02 2.15 87.07 2.15 0.00 .33896E+04
1065.14 9.00 2.15 639.3 0.117E-02 2.15 89.00 2.15 0.00 .35741E+04
1120.13 9.00 2.15 653.3 0.115E-02 2.15 90.95 2.15 0.00 .37587E+04
1175.12 9.00 2.15 667.4 0.112E-02 2.15 92.91 2.15 0.00 .39432E+04
1230.12 9.00 2.15 681.6 0.110E-02 2.15 94.89 2.15 0.00 .41277E+04
1285.11 9.00 2.15 695.9 0.108E-02 2.15 96.88 2.15 0.00 .43123E+04
1340.10 9.00 2.15 710.3 0.106E-02 2.15 98.88 2.15 0.00 .44968E+04
1395.09 9.00 2.15 724.7 0.103E-02 2.15 100.90 2.15 0.00 .46813E+04
1450.08 9.00 2.15 739.3 0.101E-02 2.15 102.93 2.15 0.00 .48659E+04
1505.07 9.00 2.15 754.0 0.995E-03 2.15 104.98 2.15 0.00 .50504E+04
1560.07 9.00 2.15 768.8 0.976E-03 2.15 107.03 2.15 0.00 .52349E+04
1615.06 9.00 2.15 783.7 0.957E-03 2.15 109.11 2.15 0.00 .54195E+04
1670.05 9.00 2.15 798.6 0.939E-03 2.15 111.19 2.15 0.00 .56040E+04
1725.04 9.00 2.15 813.7 0.922E-03 2.15 113.29 2.15 0.00 .57886E+04
1780.03 9.00 2.15 828.9 0.905E-03 2.15 115.40 2.15 0.00 .59731E+04
1835.02 9.00 2.15 844.1 0.888E-03 2.15 117.52 2.15 0.00 .61576E+04
1890.02 9.00 2.15 859.5 0.873E-03 2.15 119.66 2.15 0.00 .63422E+04
1945.01 9.00 2.15 874.9 0.857E-03 2.15 121.81 2.15 0.00 .65267E+04
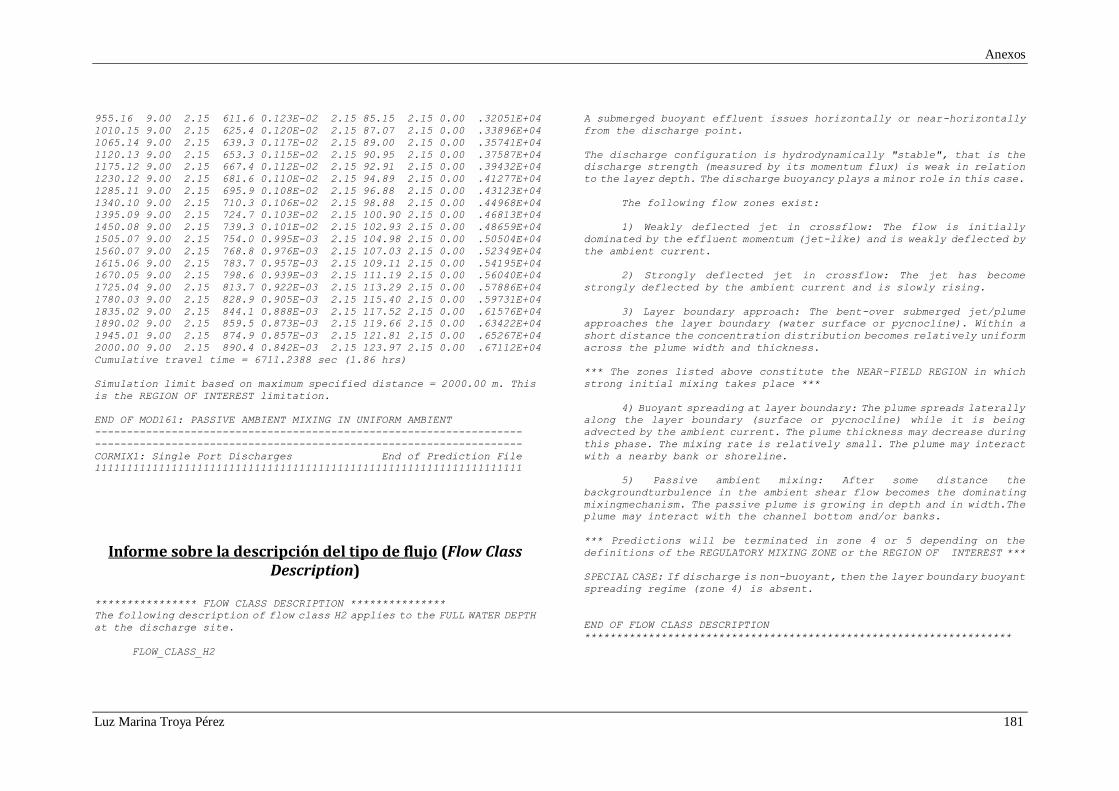
2000.00 9.00 2.15 890.4 0.842E-03 2.15 123.97 2.15 0.00 .67112E+04
Cumulative travel time = 6711.2388 sec (1.86 hrs)
Simulation limit based on maximum specified distance = 2000.00 m. This
is the REGION OF INTEREST limitation.
END OF MOD161: PASSIVE AMBIENT MIXING IN UNIFORM AMBIENT
-------------------------------------------------------------------
-------------------------------------------------------------------
CORMIX1: Single Port Discharges End of Prediction File
1111111111111111111111111111111111111111111111111111111111111111111
Informe sobre la descripción del tipo de flujo (Flow Class Description)
**************** FLOW CLASS DESCRIPTION ***************
The following description of flow class H2 applies to the FULL WATER DEPTH
at the discharge site.
FLOW_CLASS_H2
A submerged buoyant effluent issues horizontally or near-horizontally
from the discharge point.
The discharge configuration is hydrodynamically "stable", that is the
discharge strength (measured by its momentum flux) is weak in relation
to the layer depth. The discharge buoyancy plays a minor role in this case.
The following flow zones exist:
1) Weakly deflected jet in crossflow: The flow is initially
dominated by the effluent momentum (jet-like) and is weakly deflected by
the ambient current.
2) Strongly deflected jet in crossflow: The jet has become
strongly deflected by the ambient current and is slowly rising.
3) Layer boundary approach: The bent-over submerged jet/plume
approaches the layer boundary (water surface or pycnocline). Within a
short distance the concentration distribution becomes relatively uniform
across the plume width and thickness.
*** The zones listed above constitute the NEAR-FIELD REGION in which
strong initial mixing takes place ***
4) Buoyant spreading at layer boundary: The plume spreads laterally
along the layer boundary (surface or pycnocline) while it is being
advected by the ambient current. The plume thickness may decrease during
this phase. The mixing rate is relatively small. The plume may interact
with a nearby bank or shoreline.
5) Passive ambient mixing: After some distance the
backgroundturbulence in the ambient shear flow becomes the dominating
mixingmechanism. The passive plume is growing in depth and in width.The
plume may interact with the channel bottom and/or banks.
*** Predictions will be terminated in zone 4 or 5 depending on the
definitions of the REGULATORY MIXING ZONE or the REGION OF INTEREST ***
SPECIAL CASE: If discharge is non-buoyant, then the layer boundary buoyant
spreading regime (zone 4) is absent.
END OF FLOW CLASS DESCRIPTION
*******************************************************************
Anexos
Luz Marina Troya Pérez 182
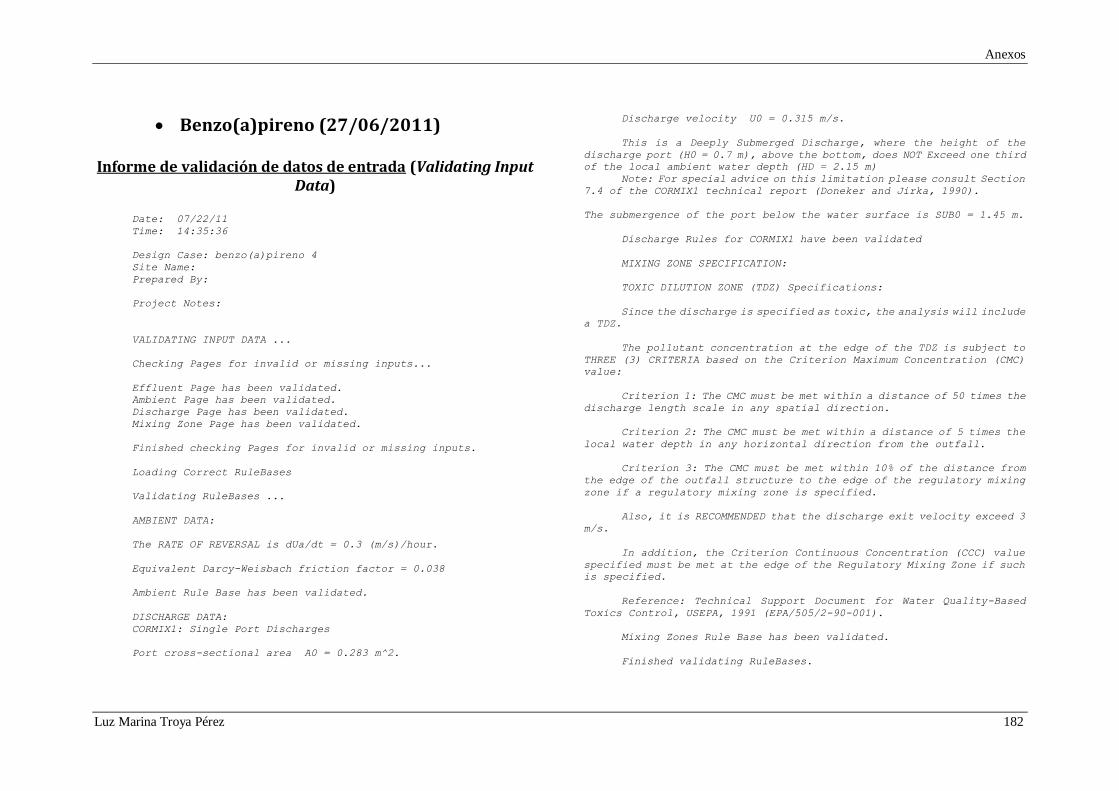
Benzo(a)pireno (27/06/2011) Informe de validación de datos de entrada (Validating Input
Data)
Date: 07/22/11
Time: 14:35:36
Design Case: benzo(a)pireno 4
Site Name:
Prepared By:
Project Notes:
VALIDATING INPUT DATA ...
Checking Pages for invalid or missing inputs...
Effluent Page has been validated.
Ambient Page has been validated.
Discharge Page has been validated.
Mixing Zone Page has been validated.
Finished checking Pages for invalid or missing inputs.
Loading Correct RuleBases
Validating RuleBases ...
AMBIENT DATA:
The RATE OF REVERSAL is dUa/dt = 0.3 (m/s)/hour.
Equivalent Darcy-Weisbach friction factor = 0.038
Ambient Rule Base has been validated.
DISCHARGE DATA:
CORMIX1: Single Port Discharges
Port cross-sectional area A0 = 0.283 m^2.
Discharge velocity U0 = 0.315 m/s.
This is a Deeply Submerged Discharge, where the height of the
discharge port (H0 = 0.7 m), above the bottom, does NOT Exceed one third
of the local ambient water depth (HD = 2.15 m)
Note: For special advice on this limitation please consult Section
7.4 of the CORMIX1 technical report (Doneker and Jirka, 1990).
The submergence of the port below the water surface is SUB0 = 1.45 m.
Discharge Rules for CORMIX1 have been validated
MIXING ZONE SPECIFICATION:
TOXIC DILUTION ZONE (TDZ) Specifications:
Since the discharge is specified as toxic, the analysis will include
a TDZ.
The pollutant concentration at the edge of the TDZ is subject to
THREE (3) CRITERIA based on the Criterion Maximum Concentration (CMC)
value:
Criterion 1: The CMC must be met within a distance of 50 times the
discharge length scale in any spatial direction.
Criterion 2: The CMC must be met within a distance of 5 times the
local water depth in any horizontal direction from the outfall.
Criterion 3: The CMC must be met within 10% of the distance from
the edge of the outfall structure to the edge of the regulatory mixing
zone if a regulatory mixing zone is specified.
Also, it is RECOMMENDED that the discharge exit velocity exceed 3
m/s.
In addition, the Criterion Continuous Concentration (CCC) value
specified must be met at the edge of the Regulatory Mixing Zone if such
is specified.
Reference: Technical Support Document for Water Quality-Based
Toxics Control, USEPA, 1991 (EPA/505/2-90-001).
Mixing Zones Rule Base has been validated.
Finished validating RuleBases.
Anexos
Luz Marina Troya Pérez 183
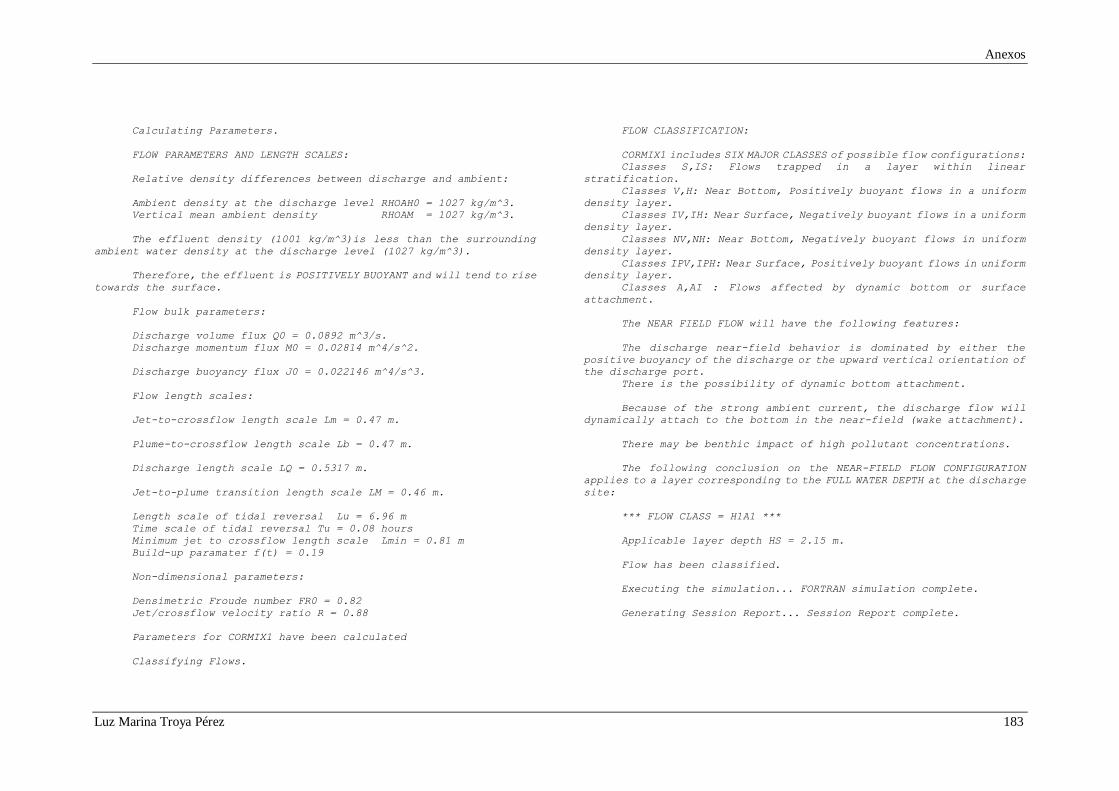
Calculating Parameters.
FLOW PARAMETERS AND LENGTH SCALES:
Relative density differences between discharge and ambient:
Ambient density at the discharge level RHOAH0 = 1027 kg/m^3.
Vertical mean ambient density RHOAM = 1027 kg/m^3.
The effluent density (1001 kg/m^3)is less than the surrounding
ambient water density at the discharge level (1027 kg/m^3).
Therefore, the effluent is POSITIVELY BUOYANT and will tend to rise
towards the surface.
Flow bulk parameters:
Discharge volume flux Q0 = 0.0892 m^3/s.
Discharge momentum flux M0 = 0.02814 m^4/s^2.
Discharge buoyancy flux J0 = 0.022146 m^4/s^3.
Flow length scales:
Jet-to-crossflow length scale Lm = 0.47 m.
Plume-to-crossflow length scale Lb = 0.47 m.
Discharge length scale LQ = 0.5317 m.
Jet-to-plume transition length scale LM = 0.46 m.
Length scale of tidal reversal Lu = 6.96 m
Time scale of tidal reversal Tu = 0.08 hours
Minimum jet to crossflow length scale Lmin = 0.81 m
Build-up paramater f(t) = 0.19
Non-dimensional parameters:
Densimetric Froude number FR0 = 0.82
Jet/crossflow velocity ratio R = 0.88
Parameters for CORMIX1 have been calculated
Classifying Flows.
FLOW CLASSIFICATION:
CORMIX1 includes SIX MAJOR CLASSES of possible flow configurations:
Classes S,IS: Flows trapped in a layer within linear
stratification.
Classes V,H: Near Bottom, Positively buoyant flows in a uniform
density layer.
Classes IV,IH: Near Surface, Negatively buoyant flows in a uniform
density layer.
Classes NV,NH: Near Bottom, Negatively buoyant flows in uniform
density layer.
Classes IPV,IPH: Near Surface, Positively buoyant flows in uniform
density layer.
Classes A,AI : Flows affected by dynamic bottom or surface
attachment.
The NEAR FIELD FLOW will have the following features:
The discharge near-field behavior is dominated by either the
positive buoyancy of the discharge or the upward vertical orientation of
the discharge port.
There is the possibility of dynamic bottom attachment.
Because of the strong ambient current, the discharge flow will
dynamically attach to the bottom in the near-field (wake attachment).
There may be benthic impact of high pollutant concentrations.
The following conclusion on the NEAR-FIELD FLOW CONFIGURATION
applies to a layer corresponding to the FULL WATER DEPTH at the discharge
site:
*** FLOW CLASS = H1A1 ***
Applicable layer depth HS = 2.15 m.
Flow has been classified.
Executing the simulation... FORTRAN simulation complete.
Generating Session Report... Session Report complete.
Anexos
Luz Marina Troya Pérez 184
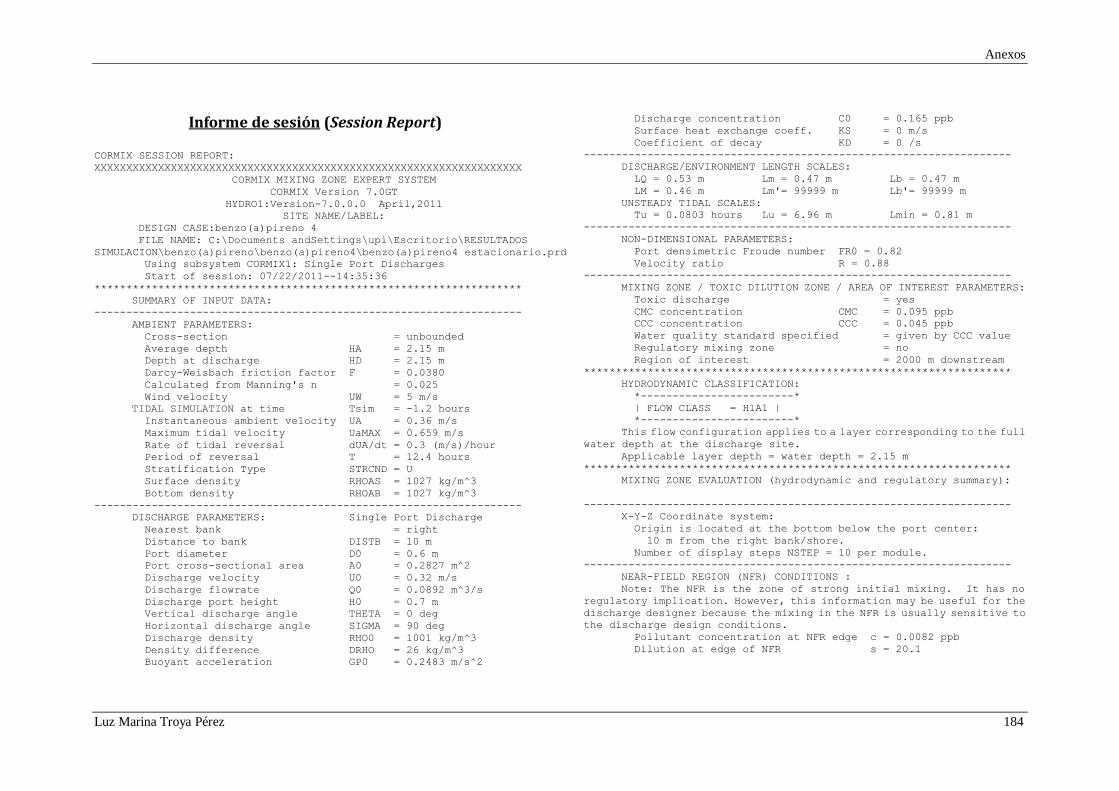
Informe de sesión (Session Report)
CORMIX SESSION REPORT:
XXXXXXXXXXXXXXXXXXXXXXXXXXXXXXXXXXXXXXXXXXXXXXXXXXXXXXXXXXXXXXXXXXX
CORMIX MIXING ZONE EXPERT SYSTEM
CORMIX Version 7.0GT
HYDRO1:Version-7.0.0.0 April,2011
SITE NAME/LABEL:
DESIGN CASE:benzo(a)pireno 4
FILE NAME: C:\Documents andSettings\upi\Escritorio\RESULTADOS
SIMULACION\benzo(a)pireno\benzo(a)pireno4\benzo(a)pireno4 estacionario.prd
Using subsystem CORMIX1: Single Port Discharges
Start of session: 07/22/2011--14:35:36
*******************************************************************
SUMMARY OF INPUT DATA:
-------------------------------------------------------------------
AMBIENT PARAMETERS:
Cross-section = unbounded
Average depth HA = 2.15 m
Depth at discharge HD = 2.15 m
Darcy-Weisbach friction factor F = 0.0380
Calculated from Manning's n = 0.025
Wind velocity UW = 5 m/s
TIDAL SIMULATION at time Tsim = -1.2 hours
Instantaneous ambient velocity UA = 0.36 m/s
Maximum tidal velocity UaMAX = 0.659 m/s
Rate of tidal reversal dUA/dt = 0.3 (m/s)/hour
Period of reversal T = 12.4 hours
Stratification Type STRCND = U
Surface density RHOAS = 1027 kg/m^3
Bottom density RHOAB = 1027 kg/m^3
-------------------------------------------------------------------
DISCHARGE PARAMETERS: Single Port Discharge
Nearest bank = right
Distance to bank DISTB = 10 m
Port diameter D0 = 0.6 m
Port cross-sectional area A0 = 0.2827 m^2
Discharge velocity U0 = 0.32 m/s
Discharge flowrate Q0 = 0.0892 m^3/s
Discharge port height H0 = 0.7 m
Vertical discharge angle THETA = 0 deg
Horizontal discharge angle SIGMA = 90 deg
Discharge density RHO0 = 1001 kg/m^3
Density difference DRHO = 26 kg/m^3
Buoyant acceleration GP0 = 0.2483 m/s^2
Discharge concentration C0 = 0.165 ppb
Surface heat exchange coeff. KS = 0 m/s
Coefficient of decay KD = 0 /s
-------------------------------------------------------------------
DISCHARGE/ENVIRONMENT LENGTH SCALES:
LQ = 0.53 m Lm = 0.47 m Lb = 0.47 m
LM = 0.46 m Lm'= 99999 m Lb'= 99999 m
UNSTEADY TIDAL SCALES:
Tu = 0.0803 hours Lu = 6.96 m Lmin = 0.81 m
-------------------------------------------------------------------
NON-DIMENSIONAL PARAMETERS:
Port densimetric Froude number FR0 = 0.82
Velocity ratio R = 0.88
-------------------------------------------------------------------
MIXING ZONE / TOXIC DILUTION ZONE / AREA OF INTEREST PARAMETERS:
Toxic discharge = yes
CMC concentration CMC = 0.095 ppb
CCC concentration CCC = 0.045 ppb
Water quality standard specified = given by CCC value
Regulatory mixing zone = no
Region of interest = 2000 m downstream
*******************************************************************
HYDRODYNAMIC CLASSIFICATION:
*------------------------*
| FLOW CLASS = H1A1 |
*------------------------*
This flow configuration applies to a layer corresponding to the full
water depth at the discharge site.
Applicable layer depth = water depth = 2.15 m
*******************************************************************
MIXING ZONE EVALUATION (hydrodynamic and regulatory summary):
-------------------------------------------------------------------
X-Y-Z Coordinate system:
Origin is located at the bottom below the port center:
10 m from the right bank/shore.
Number of display steps NSTEP = 10 per module.
-------------------------------------------------------------------
NEAR-FIELD REGION (NFR) CONDITIONS :
Note: The NFR is the zone of strong initial mixing. It has no
regulatory implication. However, this information may be useful for the
discharge designer because the mixing in the NFR is usually sensitive to
the discharge design conditions.
Pollutant concentration at NFR edge c = 0.0082 ppb
Dilution at edge of NFR s = 20.1
Anexos
Luz Marina Troya Pérez 185
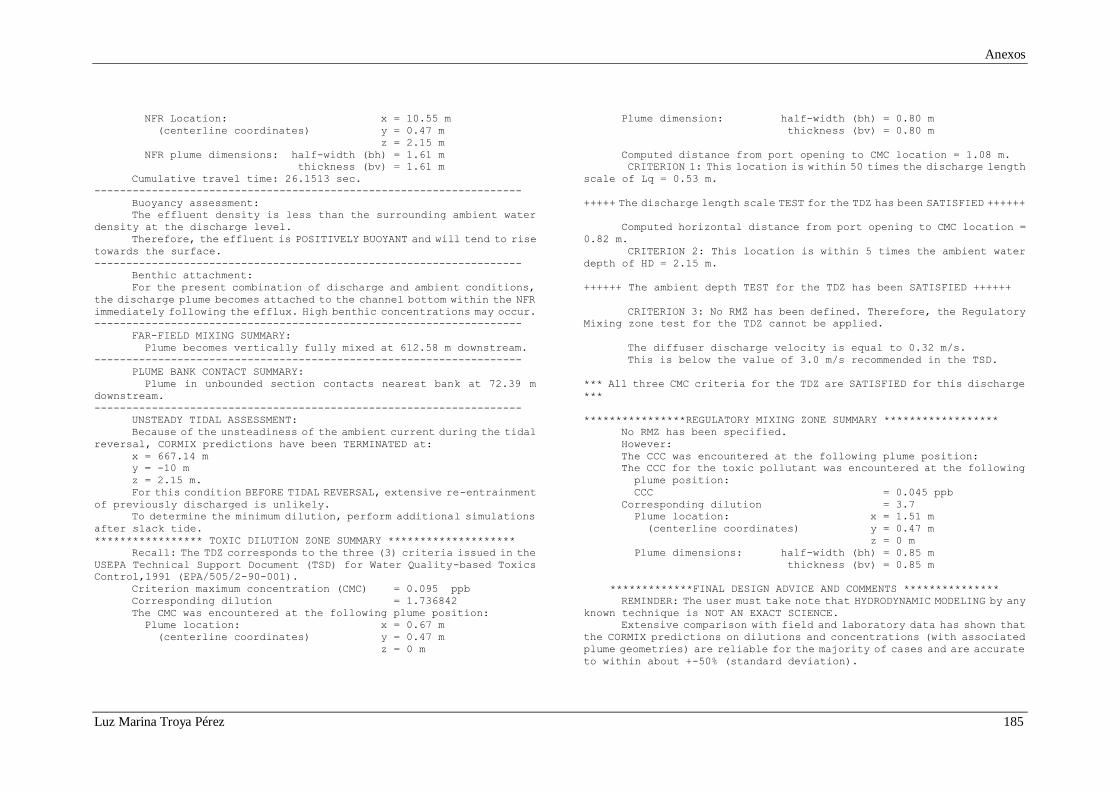
NFR Location: x = 10.55 m
(centerline coordinates) y = 0.47 m
z = 2.15 m
NFR plume dimensions: half-width (bh) = 1.61 m
thickness (bv) = 1.61 m
Cumulative travel time: 26.1513 sec.
-------------------------------------------------------------------
Buoyancy assessment:
The effluent density is less than the surrounding ambient water
density at the discharge level.
Therefore, the effluent is POSITIVELY BUOYANT and will tend to rise
towards the surface.
-------------------------------------------------------------------
Benthic attachment:
For the present combination of discharge and ambient conditions,
the discharge plume becomes attached to the channel bottom within the NFR
immediately following the efflux. High benthic concentrations may occur.
-------------------------------------------------------------------
FAR-FIELD MIXING SUMMARY:
Plume becomes vertically fully mixed at 612.58 m downstream.
-------------------------------------------------------------------
PLUME BANK CONTACT SUMMARY:
Plume in unbounded section contacts nearest bank at 72.39 m
downstream.
-------------------------------------------------------------------
UNSTEADY TIDAL ASSESSMENT:
Because of the unsteadiness of the ambient current during the tidal
reversal, CORMIX predictions have been TERMINATED at:
x = 667.14 m
y = -10 m
z = 2.15 m.
For this condition BEFORE TIDAL REVERSAL, extensive re-entrainment
of previously discharged is unlikely.
To determine the minimum dilution, perform additional simulations
after slack tide.
***************** TOXIC DILUTION ZONE SUMMARY ********************
Recall: The TDZ corresponds to the three (3) criteria issued in the
USEPA Technical Support Document (TSD) for Water Quality-based Toxics
Control,1991 (EPA/505/2-90-001).
Criterion maximum concentration (CMC) = 0.095 ppb
Corresponding dilution = 1.736842
The CMC was encountered at the following plume position:
Plume location: x = 0.67 m
(centerline coordinates) y = 0.47 m
z = 0 m
Plume dimension: half-width (bh) = 0.80 m
thickness (bv) = 0.80 m
Computed distance from port opening to CMC location = 1.08 m.
CRITERION 1: This location is within 50 times the discharge length
scale of Lq = 0.53 m.
+++++ The discharge length scale TEST for the TDZ has been SATISFIED ++++++
Computed horizontal distance from port opening to CMC location =
0.82 m.
CRITERION 2: This location is within 5 times the ambient water
depth of HD = 2.15 m.
++++++ The ambient depth TEST for the TDZ has been SATISFIED ++++++
CRITERION 3: No RMZ has been defined. Therefore, the Regulatory
Mixing zone test for the TDZ cannot be applied.
The diffuser discharge velocity is equal to 0.32 m/s.
This is below the value of 3.0 m/s recommended in the TSD.
*** All three CMC criteria for the TDZ are SATISFIED for this discharge
***
****************REGULATORY MIXING ZONE SUMMARY ******************
No RMZ has been specified.
However:
The CCC was encountered at the following plume position:
The CCC for the toxic pollutant was encountered at the following
plume position:
CCC = 0.045 ppb
Corresponding dilution = 3.7
Plume location: x = 1.51 m
(centerline coordinates) y = 0.47 m
z = 0 m
Plume dimensions: half-width (bh) = 0.85 m
thickness (bv) = 0.85 m
*************FINAL DESIGN ADVICE AND COMMENTS ***************
REMINDER: The user must take note that HYDRODYNAMIC MODELING by any
known technique is NOT AN EXACT SCIENCE.
Extensive comparison with field and laboratory data has shown that
the CORMIX predictions on dilutions and concentrations (with associated
plume geometries) are reliable for the majority of cases and are accurate
to within about +-50% (standard deviation).
Anexos
Luz Marina Troya Pérez 186
As a further safeguard, CORMIX will not give predictions whenever
it judges the design configuration as highly complex and uncertain for
prediction.
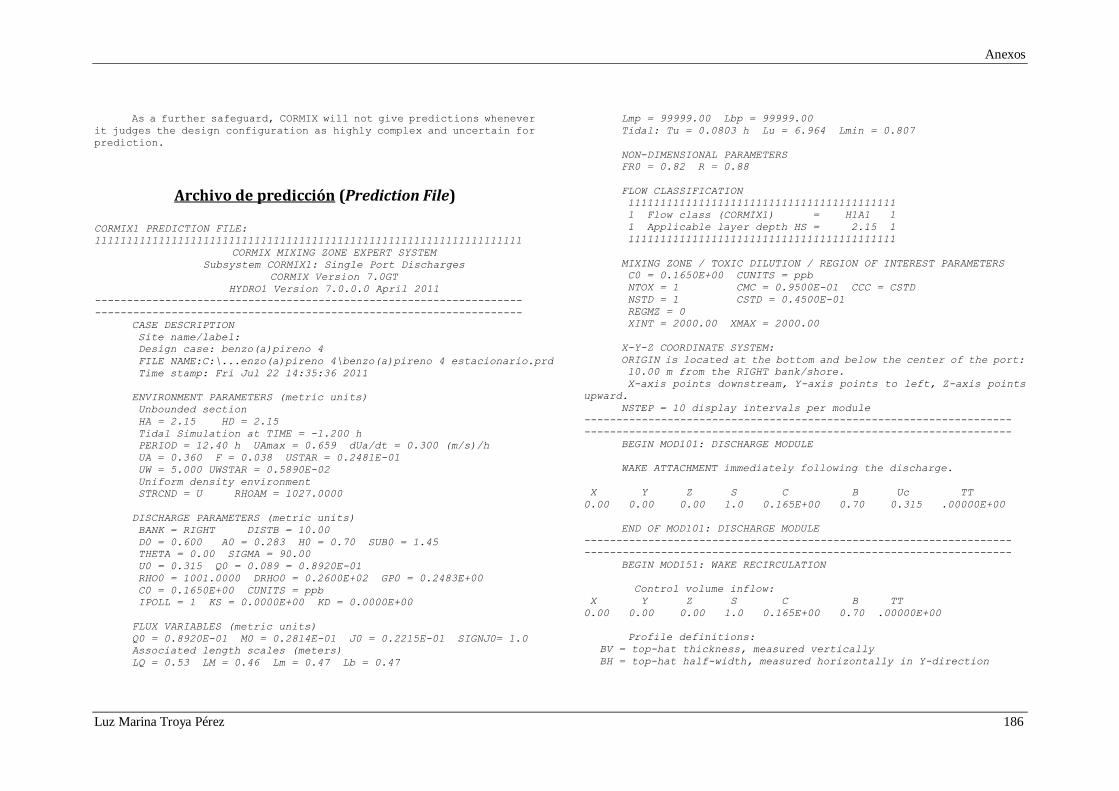
Archivo de predicción (Prediction File)
CORMIX1 PREDICTION FILE:
1111111111111111111111111111111111111111111111111111111111111111111
CORMIX MIXING ZONE EXPERT SYSTEM
Subsystem CORMIX1: Single Port Discharges
CORMIX Version 7.0GT
HYDRO1 Version 7.0.0.0 April 2011
-------------------------------------------------------------------
-------------------------------------------------------------------
CASE DESCRIPTION
Site name/label:
Design case: benzo(a)pireno 4
FILE NAME:C:\...enzo(a)pireno 4\benzo(a)pireno 4 estacionario.prd
Time stamp: Fri Jul 22 14:35:36 2011
ENVIRONMENT PARAMETERS (metric units)
Unbounded section
HA = 2.15 HD = 2.15
Tidal Simulation at TIME = -1.200 h
PERIOD = 12.40 h UAmax = 0.659 dUa/dt = 0.300 (m/s)/h
UA = 0.360 F = 0.038 USTAR = 0.2481E-01
UW = 5.000 UWSTAR = 0.5890E-02
Uniform density environment
STRCND = U RHOAM = 1027.0000
DISCHARGE PARAMETERS (metric units)
BANK = RIGHT DISTB = 10.00
D0 = 0.600 A0 = 0.283 H0 = 0.70 SUB0 = 1.45
THETA = 0.00 SIGMA = 90.00
U0 = 0.315 Q0 = 0.089 = 0.8920E-01
RHO0 = 1001.0000 DRHO0 = 0.2600E+02 GP0 = 0.2483E+00
C0 = 0.1650E+00 CUNITS = ppb
IPOLL = 1 KS = 0.0000E+00 KD = 0.0000E+00
FLUX VARIABLES (metric units)
Q0 = 0.8920E-01 M0 = 0.2814E-01 J0 = 0.2215E-01 SIGNJ0= 1.0
Associated length scales (meters)
LQ = 0.53 LM = 0.46 Lm = 0.47 Lb = 0.47
Lmp = 99999.00 Lbp = 99999.00
Tidal: Tu = 0.0803 h Lu = 6.964 Lmin = 0.807
NON-DIMENSIONAL PARAMETERS
FR0 = 0.82 R = 0.88
FLOW CLASSIFICATION
111111111111111111111111111111111111111111
1 Flow class (CORMIX1) = H1A1 1
1 Applicable layer depth HS = 2.15 1
111111111111111111111111111111111111111111
MIXING ZONE / TOXIC DILUTION / REGION OF INTEREST PARAMETERS
C0 = 0.1650E+00 CUNITS = ppb
NTOX = 1 CMC = 0.9500E-01 CCC = CSTD
NSTD = 1 CSTD = 0.4500E-01
REGMZ = 0
XINT = 2000.00 XMAX = 2000.00
X-Y-Z COORDINATE SYSTEM:
ORIGIN is located at the bottom and below the center of the port:
10.00 m from the RIGHT bank/shore.
X-axis points downstream, Y-axis points to left, Z-axis points
upward.
NSTEP = 10 display intervals per module
-------------------------------------------------------------------
-------------------------------------------------------------------
BEGIN MOD101: DISCHARGE MODULE
WAKE ATTACHMENT immediately following the discharge.
X Y Z S C B Uc TT
0.00 0.00 0.00 1.0 0.165E+00 0.70 0.315 .00000E+00
END OF MOD101: DISCHARGE MODULE
-------------------------------------------------------------------
-------------------------------------------------------------------
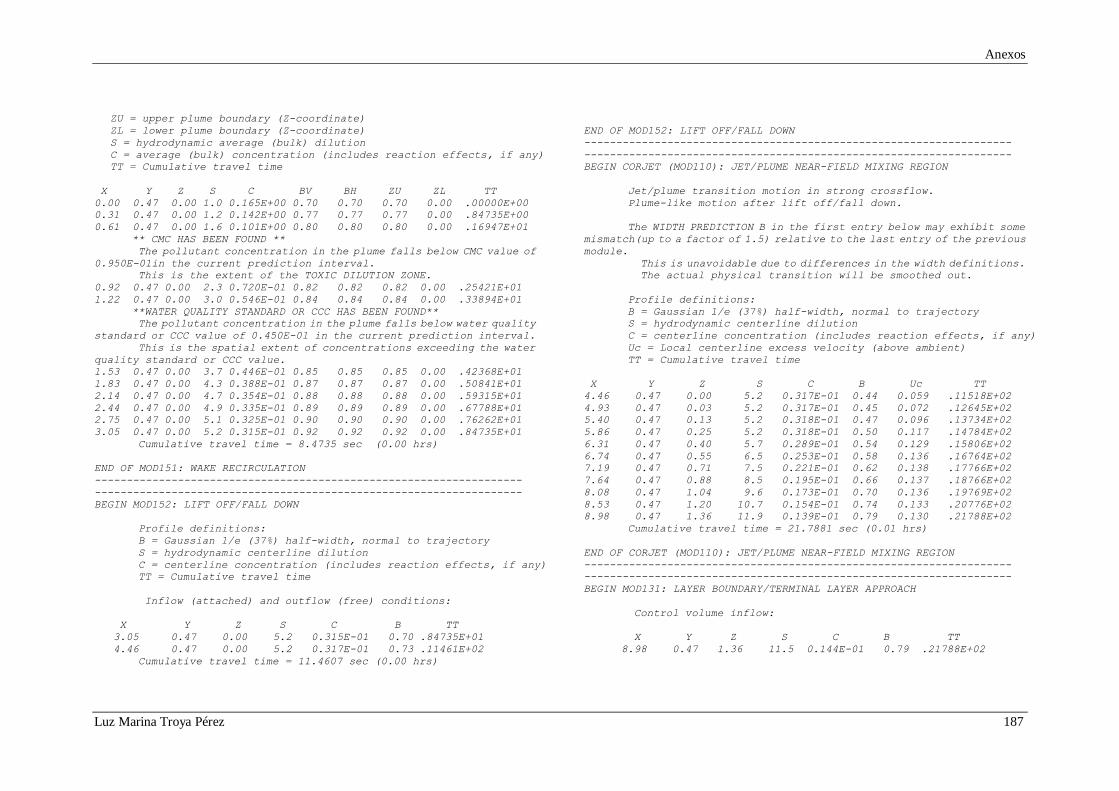
BEGIN MOD151: WAKE RECIRCULATION
Control volume inflow:
X Y Z S C B TT
0.00 0.00 0.00 1.0 0.165E+00 0.70 .00000E+00
Profile definitions:
BV = top-hat thickness, measured vertically
BH = top-hat half-width, measured horizontally in Y-direction
Anexos
Luz Marina Troya Pérez 187
ZU = upper plume boundary (Z-coordinate)
ZL = lower plume boundary (Z-coordinate)
S = hydrodynamic average (bulk) dilution
C = average (bulk) concentration (includes reaction effects, if any)
TT = Cumulative travel time
X Y Z S C BV BH ZU ZL TT
0.00 0.47 0.00 1.0 0.165E+00 0.70 0.70 0.70 0.00 .00000E+00
0.31 0.47 0.00 1.2 0.142E+00 0.77 0.77 0.77 0.00 .84735E+00
0.61 0.47 0.00 1.6 0.101E+00 0.80 0.80 0.80 0.00 .16947E+01
** CMC HAS BEEN FOUND **
The pollutant concentration in the plume falls below CMC value of
0.950E-01in the current prediction interval.
This is the extent of the TOXIC DILUTION ZONE.
0.92 0.47 0.00 2.3 0.720E-01 0.82 0.82 0.82 0.00 .25421E+01
1.22 0.47 0.00 3.0 0.546E-01 0.84 0.84 0.84 0.00 .33894E+01
**WATER QUALITY STANDARD OR CCC HAS BEEN FOUND**
The pollutant concentration in the plume falls below water quality
standard or CCC value of 0.450E-01 in the current prediction interval.
This is the spatial extent of concentrations exceeding the water
quality standard or CCC value.
1.53 0.47 0.00 3.7 0.446E-01 0.85 0.85 0.85 0.00 .42368E+01
1.83 0.47 0.00 4.3 0.388E-01 0.87 0.87 0.87 0.00 .50841E+01
2.14 0.47 0.00 4.7 0.354E-01 0.88 0.88 0.88 0.00 .59315E+01
2.44 0.47 0.00 4.9 0.335E-01 0.89 0.89 0.89 0.00 .67788E+01
2.75 0.47 0.00 5.1 0.325E-01 0.90 0.90 0.90 0.00 .76262E+01
3.05 0.47 0.00 5.2 0.315E-01 0.92 0.92 0.92 0.00 .84735E+01
Cumulative travel time = 8.4735 sec (0.00 hrs)
END OF MOD151: WAKE RECIRCULATION
-------------------------------------------------------------------
-------------------------------------------------------------------
BEGIN MOD152: LIFT OFF/FALL DOWN
Profile definitions:
B = Gaussian 1/e (37%) half-width, normal to trajectory
S = hydrodynamic centerline dilution
C = centerline concentration (includes reaction effects, if any)
TT = Cumulative travel time
Inflow (attached) and outflow (free) conditions:
X Y Z S C B TT
3.05 0.47 0.00 5.2 0.315E-01 0.70 .84735E+01
4.46 0.47 0.00 5.2 0.317E-01 0.73 .11461E+02
Cumulative travel time = 11.4607 sec (0.00 hrs)
END OF MOD152: LIFT OFF/FALL DOWN
-------------------------------------------------------------------
-------------------------------------------------------------------
BEGIN CORJET (MOD110): JET/PLUME NEAR-FIELD MIXING REGION
Jet/plume transition motion in strong crossflow.
Plume-like motion after lift off/fall down.
The WIDTH PREDICTION B in the first entry below may exhibit some
mismatch(up to a factor of 1.5) relative to the last entry of the previous
module.
This is unavoidable due to differences in the width definitions.
The actual physical transition will be smoothed out.
Profile definitions:
B = Gaussian 1/e (37%) half-width, normal to trajectory
S = hydrodynamic centerline dilution
C = centerline concentration (includes reaction effects, if any)
Uc = Local centerline excess velocity (above ambient)
TT = Cumulative travel time
X Y Z S C B Uc TT
4.46 0.47 0.00 5.2 0.317E-01 0.44 0.059 .11518E+02
4.93 0.47 0.03 5.2 0.317E-01 0.45 0.072 .12645E+02
5.40 0.47 0.13 5.2 0.318E-01 0.47 0.096 .13734E+02
5.86 0.47 0.25 5.2 0.318E-01 0.50 0.117 .14784E+02
6.31 0.47 0.40 5.7 0.289E-01 0.54 0.129 .15806E+02
6.74 0.47 0.55 6.5 0.253E-01 0.58 0.136 .16764E+02
7.19 0.47 0.71 7.5 0.221E-01 0.62 0.138 .17766E+02
7.64 0.47 0.88 8.5 0.195E-01 0.66 0.137 .18766E+02
8.08 0.47 1.04 9.6 0.173E-01 0.70 0.136 .19769E+02
8.53 0.47 1.20 10.7 0.154E-01 0.74 0.133 .20776E+02
8.98 0.47 1.36 11.9 0.139E-01 0.79 0.130 .21788E+02
Cumulative travel time = 21.7881 sec (0.01 hrs)
END OF CORJET (MOD110): JET/PLUME NEAR-FIELD MIXING REGION
-------------------------------------------------------------------
-------------------------------------------------------------------
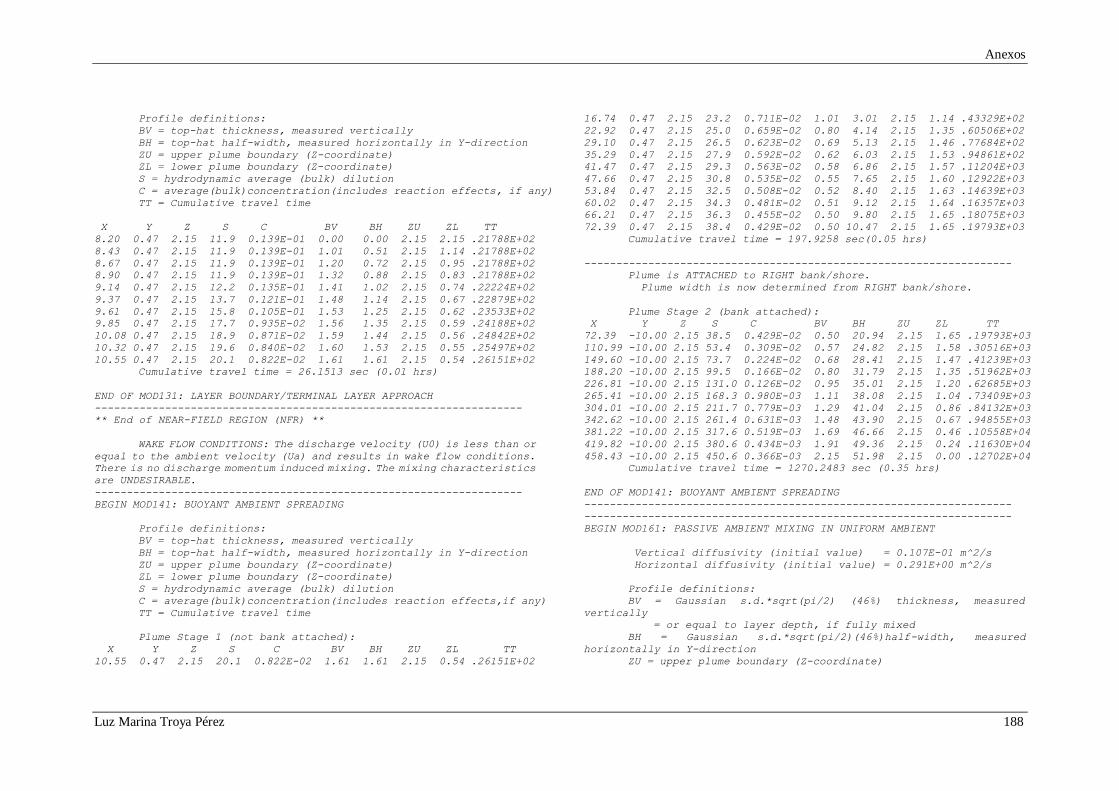
BEGIN MOD131: LAYER BOUNDARY/TERMINAL LAYER APPROACH
Control volume inflow:
X Y Z S C B TT
8.98 0.47 1.36 11.5 0.144E-01 0.79 .21788E+02
Anexos
Luz Marina Troya Pérez 188
Profile definitions:
BV = top-hat thickness, measured vertically
BH = top-hat half-width, measured horizontally in Y-direction
ZU = upper plume boundary (Z-coordinate)
ZL = lower plume boundary (Z-coordinate)
S = hydrodynamic average (bulk) dilution
C = average(bulk)concentration(includes reaction effects, if any)
TT = Cumulative travel time
X Y Z S C BV BH ZU ZL TT
8.20 0.47 2.15 11.9 0.139E-01 0.00 0.00 2.15 2.15 .21788E+02
8.43 0.47 2.15 11.9 0.139E-01 1.01 0.51 2.15 1.14 .21788E+02
8.67 0.47 2.15 11.9 0.139E-01 1.20 0.72 2.15 0.95 .21788E+02
8.90 0.47 2.15 11.9 0.139E-01 1.32 0.88 2.15 0.83 .21788E+02
9.14 0.47 2.15 12.2 0.135E-01 1.41 1.02 2.15 0.74 .22224E+02
9.37 0.47 2.15 13.7 0.121E-01 1.48 1.14 2.15 0.67 .22879E+02
9.61 0.47 2.15 15.8 0.105E-01 1.53 1.25 2.15 0.62 .23533E+02
9.85 0.47 2.15 17.7 0.935E-02 1.56 1.35 2.15 0.59 .24188E+02
10.08 0.47 2.15 18.9 0.871E-02 1.59 1.44 2.15 0.56 .24842E+02
10.32 0.47 2.15 19.6 0.840E-02 1.60 1.53 2.15 0.55 .25497E+02
10.55 0.47 2.15 20.1 0.822E-02 1.61 1.61 2.15 0.54 .26151E+02
Cumulative travel time = 26.1513 sec (0.01 hrs)
END OF MOD131: LAYER BOUNDARY/TERMINAL LAYER APPROACH
-------------------------------------------------------------------
** End of NEAR-FIELD REGION (NFR) **
WAKE FLOW CONDITIONS: The discharge velocity (U0) is less than or
equal to the ambient velocity (Ua) and results in wake flow conditions.
There is no discharge momentum induced mixing. The mixing characteristics
are UNDESIRABLE.
-------------------------------------------------------------------
BEGIN MOD141: BUOYANT AMBIENT SPREADING
Profile definitions:
BV = top-hat thickness, measured vertically
BH = top-hat half-width, measured horizontally in Y-direction
ZU = upper plume boundary (Z-coordinate)
ZL = lower plume boundary (Z-coordinate)
S = hydrodynamic average (bulk) dilution
C = average(bulk)concentration(includes reaction effects,if any)
TT = Cumulative travel time
Plume Stage 1 (not bank attached):
X Y Z S C BV BH ZU ZL TT
10.55 0.47 2.15 20.1 0.822E-02 1.61 1.61 2.15 0.54 .26151E+02
16.74 0.47 2.15 23.2 0.711E-02 1.01 3.01 2.15 1.14 .43329E+02
22.92 0.47 2.15 25.0 0.659E-02 0.80 4.14 2.15 1.35 .60506E+02
29.10 0.47 2.15 26.5 0.623E-02 0.69 5.13 2.15 1.46 .77684E+02
35.29 0.47 2.15 27.9 0.592E-02 0.62 6.03 2.15 1.53 .94861E+02
41.47 0.47 2.15 29.3 0.563E-02 0.58 6.86 2.15 1.57 .11204E+03
47.66 0.47 2.15 30.8 0.535E-02 0.55 7.65 2.15 1.60 .12922E+03
53.84 0.47 2.15 32.5 0.508E-02 0.52 8.40 2.15 1.63 .14639E+03
60.02 0.47 2.15 34.3 0.481E-02 0.51 9.12 2.15 1.64 .16357E+03
66.21 0.47 2.15 36.3 0.455E-02 0.50 9.80 2.15 1.65 .18075E+03
72.39 0.47 2.15 38.4 0.429E-02 0.50 10.47 2.15 1.65 .19793E+03
Cumulative travel time = 197.9258 sec(0.05 hrs)
-------------------------------------------------------------------
Plume is ATTACHED to RIGHT bank/shore.
Plume width is now determined from RIGHT bank/shore.
Plume Stage 2 (bank attached):
X Y Z S C BV BH ZU ZL TT
72.39 -10.00 2.15 38.5 0.429E-02 0.50 20.94 2.15 1.65 .19793E+03
110.99 -10.00 2.15 53.4 0.309E-02 0.57 24.82 2.15 1.58 .30516E+03
149.60 -10.00 2.15 73.7 0.224E-02 0.68 28.41 2.15 1.47 .41239E+03
188.20 -10.00 2.15 99.5 0.166E-02 0.80 31.79 2.15 1.35 .51962E+03
226.81 -10.00 2.15 131.0 0.126E-02 0.95 35.01 2.15 1.20 .62685E+03
265.41 -10.00 2.15 168.3 0.980E-03 1.11 38.08 2.15 1.04 .73409E+03
304.01 -10.00 2.15 211.7 0.779E-03 1.29 41.04 2.15 0.86 .84132E+03
342.62 -10.00 2.15 261.4 0.631E-03 1.48 43.90 2.15 0.67 .94855E+03
381.22 -10.00 2.15 317.6 0.519E-03 1.69 46.66 2.15 0.46 .10558E+04
419.82 -10.00 2.15 380.6 0.434E-03 1.91 49.36 2.15 0.24 .11630E+04
458.43 -10.00 2.15 450.6 0.366E-03 2.15 51.98 2.15 0.00 .12702E+04
Cumulative travel time = 1270.2483 sec (0.35 hrs)
END OF MOD141: BUOYANT AMBIENT SPREADING
-------------------------------------------------------------------
-------------------------------------------------------------------
BEGIN MOD161: PASSIVE AMBIENT MIXING IN UNIFORM AMBIENT
Vertical diffusivity (initial value) = 0.107E-01 m^2/s
Horizontal diffusivity (initial value) = 0.291E+00 m^2/s
Profile definitions:
BV = Gaussian s.d.*sqrt(pi/2) (46%) thickness, measured
vertically
= or equal to layer depth, if fully mixed
BH = Gaussian s.d.*sqrt(pi/2)(46%)half-width, measured
horizontally in Y-direction
ZU = upper plume boundary (Z-coordinate)
Anexos
Luz Marina Troya Pérez 189
ZL = lower plume boundary (Z-coordinate)
S = hydrodynamic centerline dilution
C = centerline concentration (includes reaction effects, if any)
TT = Cumulative travel time
Plume Stage 2 (bank attached):
X Y Z S C BV BH ZU ZL TT
458.43 -10.00 2.15 450.6 0.366E-03 2.15 51.98 2.15 0.00 .12702E+04
Plume interacts with BOTTOM.
The passive diffusion plume becomes VERTICALLY FULLY MIXED within this
prediction interval.
612.58 -10.00 2.15 484.0 0.341E-03 2.15 55.79 2.15 0.00 .16985E+04
667.14 -10.00 2.15 496.0 0.333E-03 2.15 57.17 2.15 0.00
Cumulative travel time = 1850.0173 sec (0.51 hrs)
CORMIX prediction has been TERMINATED at last prediction interval.
Limiting distance due to TIDAL REVERSAL has been reached.
END OF MOD161: PASSIVE AMBIENT MIXING IN UNIFORM AMBIENT
-------------------------------------------------------------------
-------------------------------------------------------------------
CORMIX1: Single Port Discharges End of Prediction File
1111111111111111111111111111111111111111111111111111111111111111111
Informe sobre la descripción del tipo de flujo (Flow Class Description)
************** FLOW CLASS DESCRIPTION ********************
The following description of flow class H1A1 applies to the FULL
WATER DEPTH at the discharge site.
Since the flow experiences bottom attachment, the description for
the ACTUAL ATTACHED FLOW CLASS A1 is given below.
FLOW_CLASS_(..)A1
Irrespective of the buoyancy or direction of the discharge, the
near-field of this flow configuration is dominated by wake attachment.
The ambient crossflow effect is strong and/or the height of the discharge
port above the bottom is too small. This leads to rapid attachment of the
discharge flow to the bottom with a recirculation wake in the lee of the
discharge structure.
Following the recirculation the discharge flow will lift off from
the bottom due to its strong buoyancy.
In the absence of wake attachment the dominant flow class would be
given by the prefix (..). You may request detailed information on that
flow class further below. Additional advice on how to prevent bottom
attachment (e.g. by increasing the height of the discharge port) will be
provided in the summary program element SUM.
The following flow zones exist:
1) Recirculation zone: The discharge flow becomes quickly deflected
by the ambient flow and attaches to the bottom. A recirculation eddy exists
in the lee of the discharge structure.
2) Lift-off: Because of the positive buoyancy the plume detaches
from the bottom and starts to rise upward.
3) Strongly deflected plume in crossflow: The plume has been
strongly deflected by the current and is slowly rising toward the surface.
4) Layer boundary approach: The bent-over submerged jet/plume
approaches the layer boundary (water surface or pycnocline). Within a
short distance the concentration distribution becomes relatively uniform
across the plume width and thickness.
*** The zones listed above constitute the NEAR-FIELD REGION in which
strong initial mixing takes place ***
5) Buoyant spreading at layer boundary: The plume spreads laterally
along the layer boundary (surface or pycnocline) while it is being
advected by the ambient current. The plume thickness may decrease during
this phase. The mixing rate is relatively small. The plume may interact
with a nearby bank or shoreline.
6) Passive ambient mixing: After some distance the background
turbulence in the ambient shear flow becomes the dominating mixing
mechanism. The passive plume is growing in depth and in width. The plume
may interact with the channel bottom and/or banks.
*** Predictions will be terminated in zone 5 or 6 depending on the
definitions of the REGULATORY MIXING ZONE or the REGION OF INTEREST ***
END OF FLOW CLASS DESCRIPTION
**********************************************
Recommended