Cátedra de Anatomía Comparada. Facultad de Ciencias Naturales, Universidad Nacional de Salta. Avda. Bolivia 5150, 4400, Salta,
Argentina. E-mail: [email protected]
CONICET (Consejo Nacional de Investigaciones Científicas y Técnicas). IBIGEO (Instituto de Bio y Geociencias), IBIGEO.
Volume 46(24):261-274, 2006
HISTORICAL BIOGEOGRAPHY OF A CLADE OF LIOLAEMUS
(IGUANIA: LIOLAEMIDAE) BASED ON ANCESTRAL AREAS
AND DISPERSAL-VICARIANCE ANALYSIS (DIVA)
JUAN MANUEL DÍAZ GÓMEZ
FERNANDO LOBO
ABSTRACT
Although many phylogenetic studies have been made on the genus Liolaemus, they are inappropriate for
a biogeographic study because of incomplete taxon sampling. Here we develop a biogeographic analysis
using a new phylogenetic study of the chiliensis group, which differs from the other studies in having his
members fully represented. The biogeographic analysis presented here consists in reconstructing the
ancestral area of this clade, under three different methods of analysis: Fitch Optimisation, Dispersal
Vicariance Analysis and Weighted Ancestral Area Analysis. The analyses were made on phylogenies
from parsimony under equally weighted characters, as well as under implied weighting. The equally
weighted tree recovers most of the groupings proposed in previous studies. The strict consensus of the
implied weighting trees recovers fifteen groups, but there is no agreement of the relationships between
those groups. The ancestral area analyses agree in an Andean-Patagonian origin for the chiliensis clade,
and are congruent with previous hypotheses and paleontological data.
KEYWORDS: Liolaemus, chiliensis-group, biogeography, ancestral area, DIVA, Fitch, Patagonia,
Andes.
INTRODUCTION
The genus Liolaemus includes about one hundred
and sixty species (Espinoza et al., 2004), and is the sec-
ond most specious genus of Lizards. Its distribution
extends from Tierra del Fuego (Liolaemus magellanicus)
in the southernmost extreme of South America, to the
Peruvian Andes (L. walkeri). Liolaemus species occupy
diverse habitats, including terrestrial and arboreal, some
are saxicolous, some arenicolous, others live in very rig-
orous climates, in very high latitudes or at high altitudes
(over 4000 m above sea level). This diversity and wide
distribution has allowed the development of very di-
verse biological characteristics, like oviparous and vivipa-
rous species (perhaps related to cold conditions, Schulte
et al. 2000) and a diverse diet, existing omnivorous, her-
bivorous and insectivorous species.
Some authors included several statements regard-
ing the distributional patterns of this genus in their
taxonomic studies. One of them is Hellmich (1951)
262 DÍAZ GÓMES, J.M. & LOBO, F.: ANCESTRAL AREA ANALYSIS ON LIOLAEMUS
who described the distribution of six species groups
from Chile, which occupy very different areas. Hellmich
explained these current distributions as a consequence
of expansions and contractions of the original distri-
butions. According to him, this happened during the
interglacial and glacial periods of the Tertiary, and this
would have given rise to the ‘races’ recognized. For
Hellmich, the final explanation was dispersal, a state-
ment which was also used by Lamborot et al. (1981) to
explain the chromosomic variation in the monticola spe-
cies complex.
Laurent (1983, 1985, 1992) also included biogeo-
graphic comments when dividing the genus into two
major subgroups (subgenus Eulaemus or Argentine
group and subgenus Liolaemus or Chilean group), divi-
sion attributed to the uplift of the Andes.
Cei (1979) described the composition of the
Patagonian and Andean herpetofauna, characterising
these regions by their high endemicity, and described
centres of speciation and dispersal by using paleonto-
logical and paleoclimatic data.
Lobo (2001) described the areas of distribution
on the phylogeny of the chiliensis group, following the
biogeographic characterization of Roig-Juñent (1994)
and adding areas not considered previously (i.e: Puna).
There are only two works where the historical bio-
geography of Liolaemus is discussed using some cladis-
tic methodology. Young-Downey (1998) performed a
Brooks Parsimony Analysis by using areas defined by
Cabrera & Willink (1980) and Brown & Gibson (1983),
and compared her results with the hypothesis of Solbrig
(1976) on the origin and evolution of those areas. Schulte
et al. (2000) proposed a hypothesis in which the species
inhabiting three general areas, Andes, West of the Andes
and East of the Andes were monophyletic. Using a
molecular-based phylogeny, they optimized the distri-
butions of the species, and ultimately rejected that hy-
pothesis as the shortest phylogenetic estimate required
multiple invasions of each of the areas. The pattern of
distribution of Liolaemus is explained by recurring
vicariance with subsequent dispersal between the areas
that allowed further vicariance. Both studies had the
problem that the areas of distribution were represented
by biogeographic units (provinces) or arbitrarily defined,
and in many cases, those units were not fully occupied
by the species. Using areas much larger than the ranges
of the species used in the analysis, as is the case with
biogeographic provinces, will cause a loss of resolution
in the analysis, because sometimes species separated by
hundreds of kilometres will be included in the same
province. Even worse, the sampling of species in the
cited studies was not complete, then, the identification
of dispersal events could be just a problem of taxon
sampling.
Although in the last years many works have been
focused on the phylogeny of Liolaemus (Ortiz, 1981;
Etheridge, 1995, Halloy et al. 1998; Young-Downey,
1998; Etheridge, 2000; Schulte et al. 2000), they are not
useful for a biogegraphic analysis because they are fo-
cused on subgroups or the genus is not fully repre-
sented. The cladistic analysis on the chiliensis group re-
cently performed by Lobo (2001, 2005) differs from the
other studies in having the chiliensis group, which is half
the genus Liolaemus, fully represented.
In this paper we present a new cladistic analysis
of the chiliensis group, based on already published data
as well as evidence not previously considered. We in-
clude species recently described and ethological charac-
ters, and use parsimony to obtain a new hypothesis for
the clade, and study its historical biogeography based
on the topologies obtained. We apply three different
methods of ancestral area analysis: Fitch optimisation
(Ronquist, 1994), Weighted Ancestral Area Analysis
(WAAA, Hausdorf, 1998) and Dispersal Vicariance
Analysis (DIVA, Ronquist, 1997). The results are com-
pared with previous hypothesis, and the methods are
discussed.
MATERIALS AND METHODS
Taxa and Characters
The biogeographic analyses are based on a new
hypothesis for the chiliensis group, and include all the
species currently known for this group (83 species). We
constructed a matrix using the morphological data from
Lobo (2005), which was updated by adding three new
species and 35 characters. The new species are Liolaemus
yanalcu, (Martinez Oliver & Lobo, 2002), L. puna and
L. chaltin (Lobo & Espinoza, 2004). Three new charac-
ters are original to this study: gravid coloration, plant-
microhabitat preference and lateral black spots; character
states are included in appendix 1. We also included in
the morphological matrix the allozyme data set of
Young-Downey (1998) (32 characters for 26 taxa of the
chiliensis group); the species L. alticolor of Young-
Downey (op.cit.) analysis is actually L. puna (Lobo &
Espinoza, 2004). Sp 1 is a new Liolaemus under descrip-
tion (Vega et al. pers. comm), Sp 2 is a new species (Lobo
et al. submitted). Being Phymaturus the closest living rela-
tive to Liolaemus (Espinoza et al. 2004), we used
Phymaturus indisctintus as outgroup. Data matrix is avail-
able at www.unsa.edu.ar/acunsa/index02.html.
PAP. AVULS ZOOL. 46(24), 2006 263
Cladistic Analysis
Parsimony analysis was made under implied
weighting (Goloboff, 1993). This weighting method
weights each character according to the number of extra
or homoplasious steps in a tree, using a concave func-
tion that gives lower weights to the characters with high
homoplasy (Kitching et al. 1998). For the implied
weighting analysis 6 concavity values were used (K, 1 to
6). Also we made a parsimony analysis under equal
weights. For both analyses TNT version 1.0b4
(Goloboff et al. 2003) was used. We searched for opti-
mal trees using TBR branch swapping, making 500
replications saving up to 10 trees for both the equally
weighted and implied weights analysis. A strict consen-
sus tree was generated using the topologies obtained
from the implied weights. Continuous characters were
coded using the gap weighting method (Thiele, 1993).
Characters 0-20, 22-34, 37-82, 115 and 116 were coded
as additive.
Biogeographic Analysis
Ancestral Area Analysis was proposed by
Bremer (1992) as a way for identifying the area of
distribution of the ancestor of a monophyletic taxon,
which he named the ancestral area. The analytical meth-
ods for ancestral areas are based on the assumption
that there is information about the ancestral area of a
taxon in the topology of its area cladogram, that is,
the probability for an area of being part of the ances-
tral area increases with its presence in plesiomorphic
branches and its general presence in the cladogram
(Hausdorf, 1998). We applied three methods pro-
posed in the last years: Fitch optimisation (Ronquist,
1994), Weighted Ancestral Area Analysis (WAAA)
(Hausdorf, 1998) and Dispersal Vicariance Analysis
(DIVA) (Ronquist, 1997). All these methods use
optimisations with reversible parsimony for estimat-
ing ancestral areas. Fitch Optimisation was proposed
by Ronquist (1994) to avoid the problems of Camin-
Sokal (irreversible) parsimony originally proposed by
Bremer (1992). WAAA uses Fitch parsimony with a
weighting scheme that weights favourably areas lo-
cated in plesiomorphic branches, and areas more com-
mon as terminals. In this method, a Probability In-
dex (PI) is calculated to give a measure of the likeli-
hood of a particular area of being part of the ances-
tral area. The index is calculated for each area from the
ratio of gains (assuming that the area was not part of
the ancestral area) over losses (assuming that the area
was part of the ancestral area). DIVA searches ances-
tral areas using a three dimensional cost matrix that
gives different costs to events, minimizing the dis-
persal events needed for explaining the distributions.
In this approach, the vicariance events have no cost,
while the dispersals and extinctions cost one per area
unit added to the distribution.
Ancestral area analysis has been considered by
some authors as a reimplementation of the centre of
origin concept, and recently criticized on the basis that it
utilizes paralogy (widespread taxa and redundant dis-
tributions) instead of reducing it, as is the usual proce-
dure for methods of cladistic biogeography (Ebach,
1999). However, ancestral area methods rely on the fact
that all taxa have an area where their ancestor was dis-
tributed, and the search for that area is a valid proce-
dure. The ancestral area of a taxon needs not to be
smaller than the actual distribution of its descendants,
it can be larger or equal (Bremer, 1992), and dispersal
needs not to be postulated as the only possible expla-
nation. Ancestral area analysis tries to identify areas that
may have been part of the ancestral area, and to distin-
guish vicariance events from possible dispersals
(Hausdorf, 1998). As Hovenkamp (1997) pointed out,
methods that try to elucidate Earth history search for
common patterns in cladograms, discard the incongru-
ences, opposed to methods that try to search for taxon
histories (as ancestral area methods), which have differ-
ent methodologies and does not need to discard
paralogies.
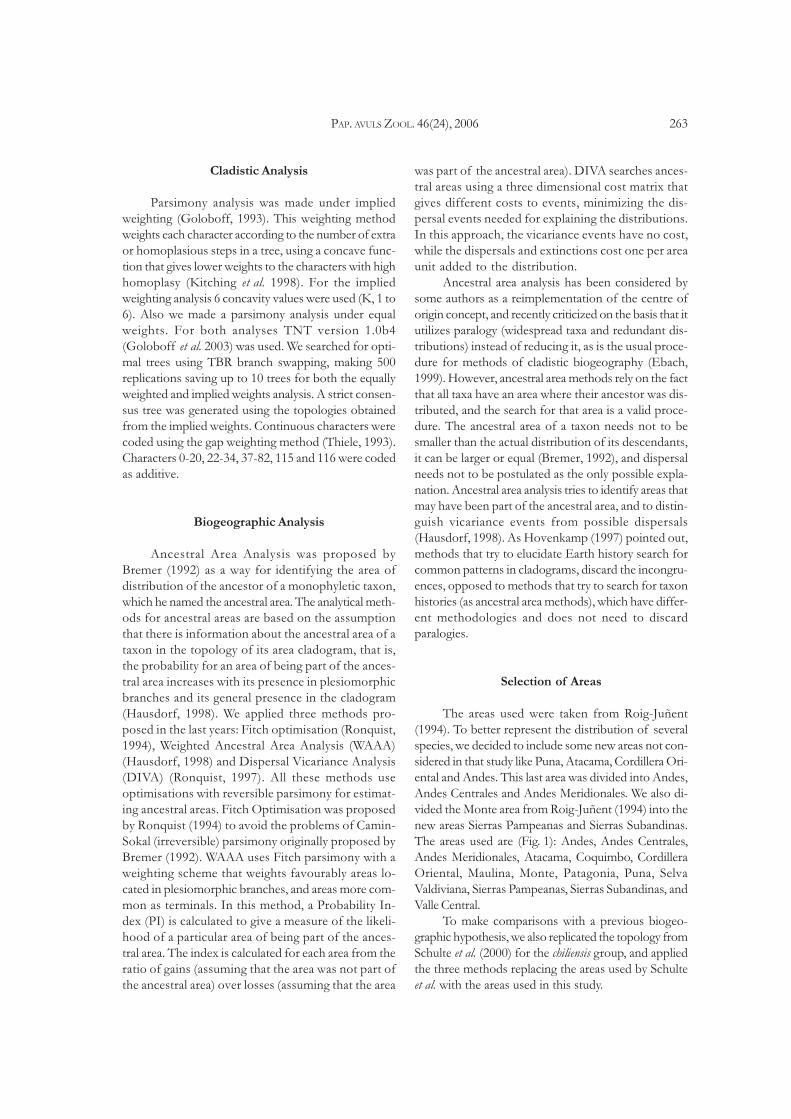
Selection of Areas
The areas used were taken from Roig-Juñent
(1994). To better represent the distribution of several
species, we decided to include some new areas not con-
sidered in that study like Puna, Atacama, Cordillera Ori-
ental and Andes. This last area was divided into Andes,
Andes Centrales and Andes Meridionales. We also di-
vided the Monte area from Roig-Juñent (1994) into the
new areas Sierras Pampeanas and Sierras Subandinas.
The areas used are (Fig. 1): Andes, Andes Centrales,
Andes Meridionales, Atacama, Coquimbo, Cordillera
Oriental, Maulina, Monte, Patagonia, Puna, Selva
Valdiviana, Sierras Pampeanas, Sierras Subandinas, and
Valle Central.
To make comparisons with a previous biogeo-
graphic hypothesis, we also replicated the topology from
Schulte et al. (2000) for the chiliensis group, and applied
the three methods replacing the areas used by Schulte
et al. with the areas used in this study.

264 DÍAZ GÓMES, J.M. & LOBO, F.: ANCESTRAL AREA ANALYSIS ON LIOLAEMUS
RESULTS
Liolaemus systematics
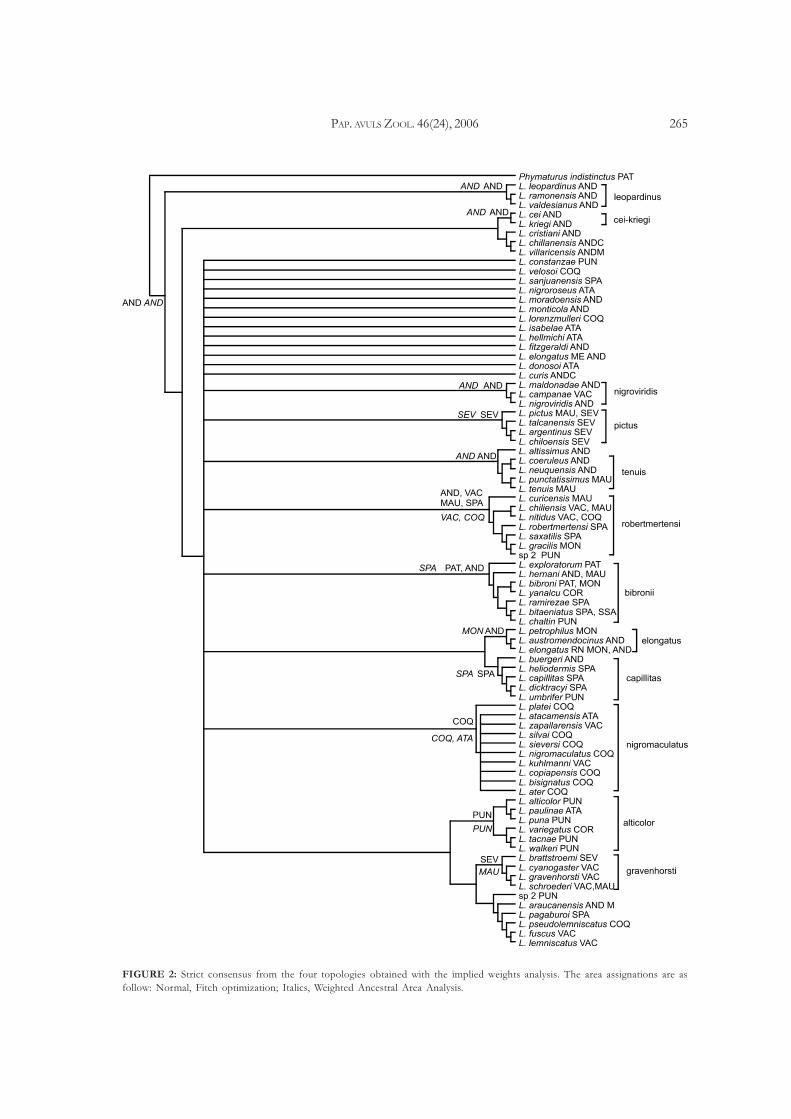
Four different topologies were obtained using the
six concavity values (K). The strict consensus indicates
that these four topologies have in common thirteen
groups (Fig. 2). The analysis under equal weights yielded
one tree (Fig. 3). Eight groups of species are recovered.
The list of groups and the species included are in Table 1.
Liolaemus biogeography
The results for the three methods utilized are re-
sumed on Table 2. These assignations refer to the most
basal node of the tree.
Fitch Optimisation. The Fitch optimization on the con-
sensus tree (Fig. 2) assigns the most basal node Andes
as the ancestral area. The Fitch optimisation on the
equally weighted tree (Fig. 3) assigns for the most basal
node the areas Patagonia, Andes or Monte as the ances-
tral area.
FIGURE 1: Areas used in the Ancestral Area Analysis. AND:
Andes; ANDC: Andes Centrales; ANDM: Andes Meridionales;
ATA: Atacama; COQ: Coquimbo; COR: Cordillera Oriental;
MAU: Maulina; MON: Monte; PAT: Patagonia; PUN: Puna; SEV:
Selva Valdiviana; SPA: Sierras Pampeanas; SSA: Sierras Subandinas;
VAC: Valle Central
TABLE 1: List of groups and species belonging to each group
according to the parsimony analysis under equal weights and
implied weighting. The species not included were found not
belonging to any group.
Group Equally Implied
weighted weighting
analysis analysis
alticolor L. chaltin L. alticolor
L. alticolor L. paulinae
L. puna L. puna
L. walkeri L. variegatus
L. tacnae
L. walkeri
bibronii L. exploratorum
L. hernani
L. bibronii
L. yanalcu
L. ramirezae
L. bitaeniatus
L. chaltin
capillitas L. capillitas L. buergueri
L. heliodermis L. heliodermis
L. dicktracyi L. capillitas
L. umbrifer L. dicktracyi
L. umbrifer
ceii-kriegi L. ceii L. ceii
L. kriegii L. kriegii
L. buergueri
elongatus L. petrophilus
L. austromendocinus
L. elongatusRN
gravenhorsti L. gravenhorsti L. brattstroemi
L. cyanogaster L. cyanogaster
L. schroederi L. gravenhorsti
L. schroederi
leopardinus L. leopardinus L. leopardinus
L. ramonensis L. ramonensis
L. valdesianus
nigroviridis L. maldonadae
L. campanae
L. nigroviridis
nigromaculatus L. donosoi L. platei
L. monticola L. atacamensis
L. tacnae L. silvai
L. platei L. sieversi
L. velosoi L. nigromaculatus
L. atacamensis L. kuhlmanni
L. ater L. copiapensis
L. bisignatus L. bisignatus
L. copiapensis L. ater
L. nigromaculatus
L. sieversi
L. zapallarensis
L. kuhlmanni
L. hellmichi
L. silvai
pictus L. pictus
L. talcanensis
L. argentinus
L. chiloensis
robertmertensi L. robertmertensi L. curicensis
L. chiliensis L. chiliensis
L. nitidus L. nitidus
L. robertmertensi
L. saxatilis
L. gracilis
L. sp 2
tenuis L. tenuis L. coerulus
L. punctatissimus L. neuquensis
L. argentinus L. punctatissimus
L. pictus L. tenuis
L. talcanensis
L. brattstroemi
L. chiloensis
L. coerulus
L. neuquensis
PAP. AVULS ZOOL. 46(24), 2006 265
FIGURE 2: Strict consensus from the four topologies obtained with the implied weights analysis. The area assignations are as
follow: Normal, Fitch optimization; Italics, Weighted Ancestral Area Analysis.

266 DÍAZ GÓMES, J.M. & LOBO, F.: ANCESTRAL AREA ANALYSIS ON LIOLAEMUS
Dispersal Vicariance analysis (DIVA). The DIVA on the
equally weighted tree achieved an exact solution, with 6
optimal reconstructions, requiring 45 dispersals each.
(Table 2). For the most basal node, the areas Puna,
Atacama, Monte, Andes, Valle Central, Coquimbo, Sier-
ras Pampeanas, Andes Meridionales y Andes Centrales
are repeated in all reconstructions. Maulina appears in
four of six reconstructions, and Selva Valdiviana in three.
The only areas that don’t appear in any reconstruction
are Sierras Subandinas and Patagonia.
The DIVA could not be done on the consensus
tree, as the software cannot handle trees with polytomies.
We selected for DIVA the trees corresponding to K = 1
and 2, and K = 5 and 6, because those hypothesis repre-
sented two different weighting schemes: a stronger for
K = 1,2 and weaker for K = 5, 6. Because of time con-
FIGURE 3: Tree from the equally weighted analysis. The area assignations are as follow: Normal, Fitch optimization; Italics,
Weighted Ancestral Area Analysis; Bold, DIVA (constrained to 2 maximum areas)

PAP. AVULS ZOOL. 46(24), 2006 267T
AB
LE
2: R
esults o
f th
e an
cestral area an
alysis. T
he ab
brevia
tio
ns fo
r th
e areas are fro
m F
ig. 1.
Eq
ually W
eigh
ted
A
nalysis
Co
nsen
su
sK
=
1,2
K =
5,6
Fitch
PA
T,
AN
D, M
ON
AN
DA
ND
AN
D
WA
AA
AN
D,
MO
NA
ND
AN
D, PA
TA
ND
, SPA
Co
nstrain
ed
Max areas =
2
Max areas =
3
—M
ax areas =
2,3
,4M
ax areas =
2,3
,4,5
,6
DIV
APA
T,
MO
NPA
T,
AN
D, M
ON
PA
T, A
ND
PA
T, A
ND
PA
T,
AN
D, M
ON U
nco
nstrain
ed
D
IV
A
PU
N A
TA
M
ON
A
ND
A
ND
M A
ND
CP
UN
A
TA
M
ON
A
ND
A
ND
M A
ND
CA
TA
M
ON
A
ND
A
ND
M V
AC
VA
C C
OQ
SPA
VA
C C
OQ
M
AU
SE
V SPA
C
OR
CO
Q M
AU
SE
V SPA
C
OR
PU
N A
TA
M
ON
A
ND
A
ND
M A
ND
CPA
T P
UN
A
TA
M
ON
A
ND
A
ND
M A
ND
CPA
T P
UN
A
TA
M
ON
A
ND
A
ND
M V
AC
VA
C C
OQ
M
AU
SPA
VA
C C
OQ
M
AU
SE
V SPA
C
OR
CO
Q M
AU
SE
V SPA
C
OR
PU
N A
TA
M
ON
A
ND
A
ND
M A
ND
CP
UN
A
TA
M
ON
A
ND
A
ND
M A
ND
CP
UN
A
TA
M
ON
A
ND
A
ND
M V
AC
VA
C C
OQ
SE
V SPA
VA
C C
OQ
M
AU
SE
V SPA
SSA
C
OR
CO
Q M
AU
SE
V SPA
SSA
C
OR
PU
N A
TA
M
ON
A
ND
A
ND
M A
ND
CPA
T P
UN
A
TA
M
ON
A
ND
A
ND
M A
ND
CPA
T P
UN
A
TA
M
ON
A
ND
A
ND
M V
AC
VA
C C
OQ
M
AU
SE
V SPA
VA
C C
OQ
M
AU
SE
V SPA
SSA
C
OR
CO
Q M
AU
SE
V SPA
SSA
C
OR
PU
N A
TA
M
ON
A
ND
A
ND
M A
ND
CP
UN
A
TA
M
ON
A
ND
A
ND
M A
ND
C V
AC
VA
C C
OQ
M
AU
SPA
C
OR
CO
Q M
AU
SE
V SPA
C
OR
PU
N A
TA
M
ON
A
ND
A
ND
M A
ND
CPA
T P
UN
A
TA
M
ON
A
ND
A
ND
M A
ND
C V
AC
VA
C C
OQ
M
AU
SE
V SPA
C
OR
CO
Q M
AU
SE
V SPA
C
OR
PU
N A
TA
M
ON
A
ND
A
ND
M A
ND
C V
AC
CO
Q M
AU
SE
V SPA
SSA
C
OR
PA
T P
UN
A
TA
M
ON
A
ND
A
ND
M A
ND
C V
AC
CO
Q M
AU
SE
V SPA
SSA
C
OR
268 DÍAZ GÓMES, J.M. & LOBO, F.: ANCESTRAL AREA ANALYSIS ON LIOLAEMUS
straints the solution was heuristic, yielding 4 optimal
reconstructions that required 41 dispersals each. These
reconstructions are both essentially the same, except that
Andes and Sierras Subandinas are not present in three
of them: in one reconstruction both areas are missing,
and one of them is absent from each of the other two.
The last reconstruction includes all the areas. The analy-
sis on the tree resulting form K = 5 and 6, also heuris-
tic, produced 8 optimal reconstructions, requiring 42
dispersals. One of the optimal reconstructions involves
all the areas, the other seven differ in the presence or
absence of Patagonia, Sierras Subandinas, and Andes
Centrales. These results are summarized in Table 2. Given
the number of possible reconstructions, it’s hard to
identify unambiguous vicariance events, making diffi-
cult to hypothesize a sequence of events for the distri-
bution of Liolaemus.
When constraints were used on the maximum
number of areas allowed for the ancestral area, on the
equally weighted analysis, for a maximum of 2 areas the
reconstruction is Patagonia-Monte or Patagonia-Andes;
for a maximum of 3 to 6 areas the reconstruction is
Patagonia, Andes, Monte (Table 2). For the trees with
implied weights, when making DIVA on the topolo-
gies corresponding to K = 1 and 2, the reconstruction
for a maximum of 2 to 4 areas is Patagonia and Andes;
for K = 5 and 6 with a maximum of 2 to 6 areas, the
reconstruction is Patagonia and Andes (Table 2). In all
cases, the optimizations for a maximum number of
areas superior to 6 showed several ambiguous recon-
structions (data not shown).
Weighted Ancestral Area Analysis (WAAA). The PI val-
ues for the WAAA analysis were calculated for the most
basal node of the tree, and for the nodes that give rise to
groups of species.
Equally weighted analysis. The areas with higher PI are
Andes and Monte (0.67 and 0.44 respectively), and have
more probability of being part of the ancestral area
(Table 2). This result is congruent with Fitch
optimisation, which has Patagonia, Andes or Monte as
equally probable reconstructions for the basal node, and
Andes as the ancestral reconstruction for the nodes as
we go up in the tree. Nevertheless, the area Patagonia
has a very low PI (0.04), discarding it as part of the
ancestral area. There are other areas that have low values
of PI, but slightly higher than the remaining, these ar-
eas are Sierras Pampeanas and Selva Valdiviana (0.13 and
0.12 respectively). This may be reflecting the fact that
these areas appear in more plesiomorfic branches, and
are given more weight accordingly.
Implied weighting analysis. The WAAA analysis was made
on the strict consensus tree as well as the topologies
corresponding to K = 1, 2 and K = 5, 6 (Table 2). The
areas with higher PI in the consensus were Andes (0.48)
and Coquimbo (0.23). Monte has a low PI of 0.10. The
areas with higher PI for the tree with K 1 and 2 are
Andes (0.69) and Patagonia (0.30). Again Monte has a
very low PI (0.07). Sierras Pampeanas (0.19) and
Coquimbo (0.17) are areas that present higher values of
PI than the rest. The tree resulting from K 5 and 6 has
only Andes with a high PI of 0.59, the values for other
areas are: 0.16 (Atacama), 0.16 (Sierras Pampeanas), 0.16
(Selva Valdiviana) and 0.12 (Coquimbo).
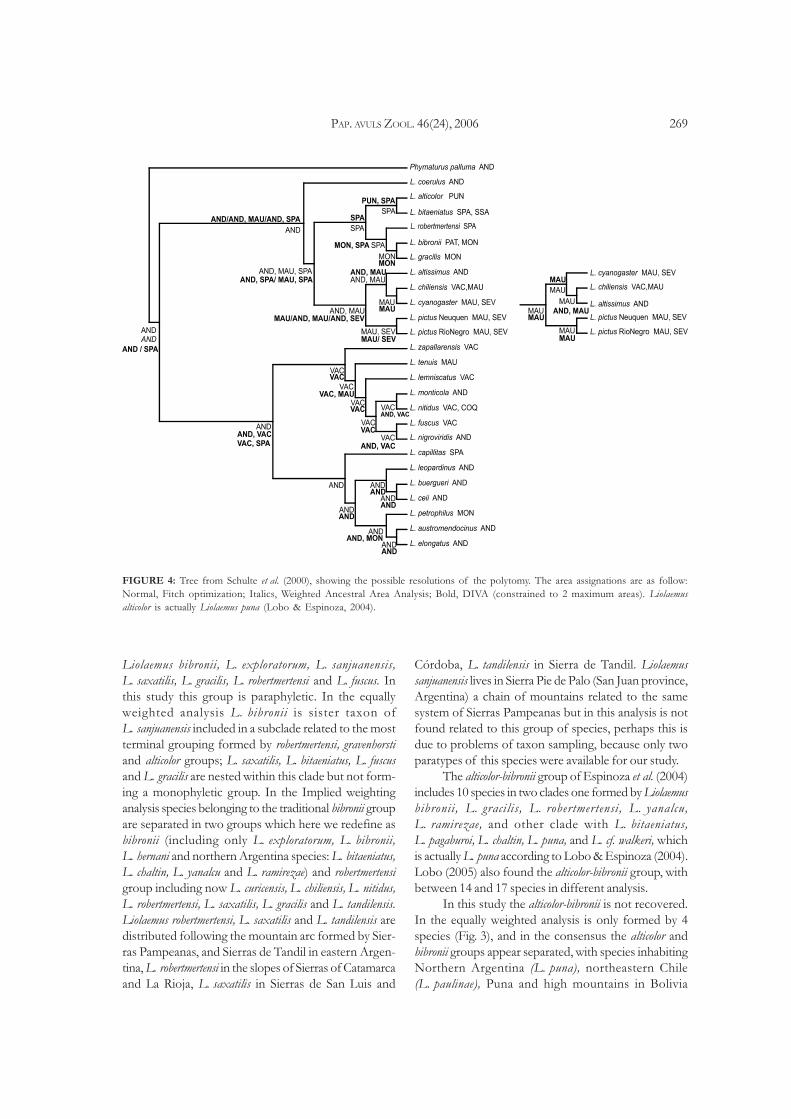
Ancestral Area analysis on the topology of
Schulte et al. (2000)
The topology of Schulte et al. (2000) (Fig. 4) has a
polytomy with the taxons Liolaemus bellii, L. chiliensis
and L. cyanogaster; the polytomy was resolved, and the
two resolutions used for the DIVA analysis. For the
Fitch optimization (11 steps) on the topology of Schulte
et al. (2000) assigns Andes as the ancestral area. Uncon-
strained DIVA (8 equally optimal reconstructions) as-
signs to the basal node all the areas, requiring 15 dis-
persal events. When using constraints to a maximum
of 2 areas, it requires 18 dispersal events, with two equally
optimal reconstructions between Andes and Sierras
Pampeanas. Weighted Ancestral Area Analysis found
Andes with the higher PI (0.44) followed by Sierras
Pampeanas and Maulina (0.39), and Valle Central in Chile
(0.38).
DISCUSSION
Liolaemus systematics
Lobo (2005) found six different resolutions
among subclades of the chiliensis group, some of those
resolutions are recovered here, i.e. the basal position of
leopardinus and kriegi groups is recovered in every
analysis,and the clade formed by the robertmertensi,
gravenhorsti and alticolor groups appears only on the
equally weighted tree. The strict consensus of the im-
plied weighting analysis recovered 15 groups, most of
them found in previous studies, but the relationships
among these groups remain unresolved.
Cei (1986, 1993) and Avila et al. (1992) defined the
bibronii group based on a character combination includ-
ing as members of this group the following species:
PAP. AVULS ZOOL. 46(24), 2006 269
Liolaemus bibronii, L. exploratorum, L. sanjuanensis,
L. saxatilis, L. gracilis, L. robertmertensi and L. fuscus. In
this study this group is paraphyletic. In the equally
weighted analysis L. bibronii is sister taxon of
L. sanjuanensis included in a subclade related to the most
terminal grouping formed by robertmertensi, gravenhorsti
and alticolor groups; L. saxatilis, L. bitaeniatus, L. fuscus
and L. gracilis are nested within this clade but not form-
ing a monophyletic group. In the Implied weighting
analysis species belonging to the traditional bibronii group
are separated in two groups which here we redefine as
bibronii (including only L. exploratorum, L. bibronii,
L. hernani and northern Argentina species: L. bitaeniatus,
L. chaltin, L. yanalcu and L. ramirezae) and robertmertensi
group including now L. curicensis, L. chiliensis, L. nitidus,
L. robertmertensi, L. saxatilis, L. gracilis and L. tandilensis.
Liolaemus robertmertensi, L. saxatilis and L. tandilensis are
distributed following the mountain arc formed by Sier-
ras Pampeanas, and Sierras de Tandil in eastern Argen-
tina, L. robertmertensi in the slopes of Sierras of Catamarca
and La Rioja, L. saxatilis in Sierras de San Luis and
Córdoba, L. tandilensis in Sierra de Tandil. Liolaemus
sanjuanensis lives in Sierra Pie de Palo (San Juan province,
Argentina) a chain of mountains related to the same
system of Sierras Pampeanas but in this analysis is not
found related to this group of species, perhaps this is
due to problems of taxon sampling, because only two
paratypes of this species were available for our study.
The alticolor-bibronii group of Espinoza et al. (2004)
includes 10 species in two clades one formed by Liolaemus
bibronii, L. gracilis, L. robertmertensi, L. yanalcu,
L. ramirezae, and other clade with L. bitaeniatus,
L. pagaburoi, L. chaltin, L. puna, and L. cf. walkeri, which
is actually L. puna according to Lobo & Espinoza (2004).
Lobo (2005) also found the alticolor-bibronii group, with
between 14 and 17 species in different analysis.
In this study the alticolor-bibronii is not recovered.
In the equally weighted analysis is only formed by 4
species (Fig. 3), and in the consensus the alticolor and
bibronii groups appear separated, with species inhabiting
Northern Argentina (L. puna), northeastern Chile
(L. paulinae), Puna and high mountains in Bolivia
FIGURE 4: Tree from Schulte et al. (2000), showing the possible resolutions of the polytomy. The area assignations are as follow:
Normal, Fitch optimization; Italics, Weighted Ancestral Area Analysis; Bold, DIVA (constrained to 2 maximum areas). Liolaemus
alticolor is actually Liolaemus puna (Lobo & Espinoza, 2004).
270 DÍAZ GÓMES, J.M. & LOBO, F.: ANCESTRAL AREA ANALYSIS ON LIOLAEMUS
(L. variegatus and L. alticolor) and Perú (L. tacnae and
L. walkeri) forming the alticolor group, and the remain-
ing species of alticolor-bibronii which are oviparous
(L. ramirezae, L. yanalcu, L. bitaeniatus and L. chaltin) are
included in the bibronii group. Liolaemus fuscus and
L. lemniscatus form a separated monophyletic group,
lemniscatus group (congruent with the fuscus-lemniscatus
group of Ortiz (1981), and lemniscatus group of Cei,
1986).
The petrophilus group recovered in the analysis with
implied weights includes the capillitas group; this is con-
gruent with the results of Morando et al. (2003). The
morphological information does not support the in-
clusion of the ceii-kriegi within the petrophilus group as
suggested by the mitochondrial DNA analysis.
Liolaemus Biogeography
The results are summarized in Table 2. There is
congruence between the three methods because all sus-
tain the hypothesis of an Andean-Patagonian origin for
the chiliensis group. The common area to all the analyses
is Andes, followed by Patagonia, and Monte.
This results show some degree of congruence with
previous studies. Cei (1979) sustained that Patagonia
was a center of origin for at least four groups of
Liolaemus, describing two major faunal regions in
Patagonia (see Cei 1979, Fig. 13:3): the northern or an-
cient Patagonian region and the southern or Santa Cruz
region, the former includes part of the Patagonia and
Andes areas used in this study. The first fossil attrib-
uted to Liolaemus (Albino, 1998) comes from the Mi-
ocene of Patagonia, found in sediments of the Miembro
Trelew, Formación Sarmiento, near Gaiman in Chubut
Province, this locality is included in the area Patagonia.
These studies, although not focused on the chiliensis
group but on the entire genus, are congruent with the
ancestral areas found here. Recently, Albino (2005) found
new fossils attributed to Liolaemus from the late Quater-
nary in the Southwest of Buenos Aires Province, in-
cluded in the Monte Area of this study.
Because the BPA results of Young-Downey (1998)
had incongruences with the hypothesis of Solbrig (1976),
she evaluated the area cladogram of Liolaemus regarding
ancestral distributions and evaluating possible dispers-
als, extinctions, and lack of response to vicariance. Thus,
Young-Downey (1998) postulates that the ancestor of
Liolaemus inhabited areas comprising the Southern
Nothofagus forest (Subantartic Province), Central Argen-
tina and Central-Northern Chile, and from there, it
vicariated by the appearance of the Andes, and by the
following climate effects (desertification of the
Patagonian steppe). Unfortunately, the areas indicated
as occupied by the ancestor of Liolaemus are not clearly
described by Young-Downey and is difficult to estab-
lish direct correspondences with the areas used here.
Young-Downey (1998) found Atacama region as more
related to Coquimbo and Chilean (Valle Central) in con-
gruence with Solbrig (1976). The current distributions
of the species and the phylogenetic analysis used here as
well as the cladogram of Lobo (2005) suggest different
area relationships. The nigromaculatus group from the
Northern deserts in Chile (Coquimbo and Atamaca ar-
eas) in that analysis is sister taxon of the alticolor group
(Puna); interestingly Morrone (1996) found Puna and
the Northern deserts forming a monophyletic unit.
Comparisons with the distribution of the groups
more related with Liolaemus may prove useful. The sis-
ter clade of Liolaemus, Phymaturus (Schulte et al. 2003;
Espinoza et al. 2004), is distributed in Patagonia and in
both sides of the Andes, reaching north to the Puna of
Catamarca Province in Argentina, distribution that is
shared with many species of Liolaemus and does not
contradict the hypothesis of ancestral areas for the chiliensis
group. Nevertheless, Ctenoblepharis, the basal taxa for
Liolaemidae (Schulte et al. 2003; Espinoza et al. 2004), is
found only in coastal deserts of Peru, thus making nec-
essary further studies including these two genera.
Fitch optimisation. The Fitch optimisation on the equally
weighted analysis yielded Andes, Patagonia and Monte.
This shows the perhaps excessive effect that Fitch opti-
mization places in the more plesiomorfic areas, because,
Patagonia only appears again in more terminal branches
of the tree.
Effect of constraining the number of areas
Ronquist (1997) noted that when using DIVA
for reconstruct the ancestral area of a taxon, the root
node will tend to include all the areas occupied by the
terminals, making it very uninformative. The solutions
to this suggested by Ronquist are two: the inclusion of
more outgroups, thus making the root node no longer
the root node, and constraining the maximum number
of areas that may form part of the ancestral area. The
first of this possible solutions is, at least in this case,
not useful: for example, the inclusion of other
outgroups related to Liolaemus, i.e. Phymaturus and
Ctenoblepharis, will not solve the problem, given that
Phymaturus is distributed in the same areas used for
Liolaemus, and Ctenoblepharis, distributed in coastal Peru,

PAP. AVULS ZOOL. 46(24), 2006 271
probably will only add this new area to the ancestral area
reconstruction in the root, leaving the ancestral area for
Liolaemus without major changes. The second alterna-
tive presents the problem that there is no criteria for
choosing the number of areas for constraining. The
sympatry of sister groups is evidence for dispersal
(Hausdorf, 1998), so it can be argued that the ancestral
distribution may have been larger o smaller than the
present area occupied by the taxon. Examples of such
sympatry in sister species are L. chiliensis and L. nitidus,
both living in Valle Central (Chile); L. cyanogaster and
L. schroederi, both distributed in Maulina (Chile). On
this basis, one may assume that the ancestral area may
have been smaller in the past, and this provides a ratio-
nale for constraining the maximum number of areas
allowed in the ancestral distribution, taking into account
that this practice remains ad hoc.
When using constrained DIVA (Table 2), con-
straining the maximum number of areas that may form
the ancestral distribution from 3 to 6 areas, yield as op-
timal reconstruction Andes, Patagonia and Monte, the
same areas that yield the Fitch optimization on the equally
weighted tree (when constraining to 2 areas, the recon-
struction is Andes and Monte). Andes also have the
highest PI in the WAAA analysis, being Monte the sec-
ond. Sadly, there are no criteria for selecting a number of
area units by constraining the ancestral distributions,
making any further statements speculative.
Commentaries about Schulte et al. (2000)
Schulte et al. (2000) postulated that the ancestral
area for the subgenus Liolaemus (equivalent to the chiliensis
group) in their reconstruction is equivocal between
Andes, western lowlands and eastern lowlands, the three
areas used for the analysis. With the exception of Andes,
the other areas found in the analysis (Sierras Pampeanas,
Maulina and Chile Central) are not hypothesized as an-
cestral in the biogeographic analysis of the more com-
plete phylogeny herein. This shows the effects of a lim-
ited taxon sampling for making biogeographic infer-
ences about ancestral areas. There are areas not repre-
sented in the analysis, and the species located
plesiomorphically on the cladogram have a strong influ-
ence in the result of the optimization. There are only
three species inhabiting Sierras Pampeanas (L. bitaeniatus,
L. robertmertensi and L. capillitas) but ten in Andes, but
both areas appear as equally probable ancestral areas.
Also, there is an oversimplification of the distribution
of the species used by Schulte et al. (2000); any ambigu-
ity at any node will involve at least two of the three
areas, making the results uninformative, given the size
of the areas.
A last remark is needed about the areas used for
this study. These areas from Roig-Juñent (1994) are based
on distributions of arthropods, and despite they are
accurate respect to the distribution of Liolaemus, some
regions are missing (i.e. Puna), and others do not repre-
sent very well the distributions of Liolaemus, like Monte,
and would need a reformulation.
The ancestral area of a taxon, as defined by Bremer
(1992), needs not to be limited to a single place, it may
be equal or larger than the current area occupied by the
taxa. However, as implemented by the methods, the
results of the ancestral area analysis will be an ancestral
area for a taxon at least equal or smaller than the com-
bined distributions of his descendants. The only pos-
sible way to find an ancestral area larger than the sum of
the distributions used would be with the inclusion of
fossil groups distributed in areas not currently occupied
by the taxa in study. For many groups, this is very diffi-
cult. For example, the fossil record may be absent, or the
fossils may be found only in the areas already present in
the analysis, as is the case with the fossils attributed to
Liolaemus (Albino, 1998, 2005). Even in the case that a
fossil distribution could be used, the area occupied by
the fossil taxa would have to be present in deep branches
of the cladogram or in numerous terminals or it would
have no influence in the analysis and could not be hy-
pothesized as being part of the ancestral area. Thus,
although the methods contemplate the possibility of
identifying an ancestral area larger than the current distri-
bution using data from fossils, is very difficult to this
situation to effectively appear in an analysis.
CONCLUSIONS
In recent years several studies have dealed with the
phylogenetic relationships of the chiliensis group (Schulte
et al. 2000; Lobo, 2001; Espinoza et al. 2004; Lobo, 2005;
this study). Some groups are recovered in this analysis,
but others do not, as the alticolor-bibronii, which appears
splitted. The consensus of the implied weighting analy-
sis shows that the relationships between the groups are
not yet resolved, and would require further studies to
clarify the intern relationships inside the chiliensis group.
As with any cladistic biogeographic analysis, the results
of the ancestral area methods may vary according to the
different hypothesis. However, if the degree of varia-
tion is only on the terminal groups, the ancestral area
assignations will likely not be affected. Nevertheless, some
area relationships found in other studies (Morrone, 1996;
272 DÍAZ GÓMES, J.M. & LOBO, F.: ANCESTRAL AREA ANALYSIS ON LIOLAEMUS
Lobo, 2005) are recovered here, like the sister relation-
ship between Puna and the Northern deserts of Chile
(Coquimbo and Atacama).
Of the studies that include biogeographic consid-
erations about Liolaemus, only Young-Downey (1998)
applied an explicit methodology. However, these stud-
ies have the problem of limited taxon sampling and
area definitions, making difficult to make comparisons
between the results. However, the results of the ances-
tral area analysis of this work are congruent with previ-
ous studies and paleontological data, hypothesizing an
Andean-Patagonian ancestral area for the chiliensis group.
A large part of the genus is not included in the chiliensis
group (the Eulaemus subgenus or Argentine group),
and its inclusion is necessary for the completion of the
ancestral area analysis of the genus. This work is under-
way and will be published elsewhere.
A last consideration is needed regarding the ances-
tral area methodologies. Although they erroneously are
criticized as an absolute dispersalist approach, they are a
valid procedure for studying the historical biogeogra-
phy of a taxon. These methods, however, present some
problems, as the sometimes uninformative multiple
reconstructions of DIVA, or the excessive importance
of the basal areas for the Fitch optimization.
This work represents the first study of the his-
torical biogeography of the chiliensis group, a major part
of the genus Liolaemus using explicit methodology and
with a complete taxon sampling. Further studies need
to be carried out, especially concerning the areas used,
particularly its unambiguous definition, and using geo-
morphologic data to contrast the hypothesis produced.
RESUMO
Ainda que tenham sido feito muitos estudos filogenéticos
no gênero Liolaemus, os mesmos não são apropriados para uma
análise biogeográfica, porque não possuem uma amostragem
taxonômica adequada. Desenvolve-se neste trabalho, uma análi-
se biogeográfica do grupo de L. chiliensis, que se diferencia das
contribuições prévias por representar a todos os membros do gru-
po. A análise biogeográfica consiste em reconstruir a área ances-
tral deste clado, utilizando três métodos diferentes: Otimização
de Fitch, Análise de Dispersão-Vicariância e Áreas Ancestrais
Pesadas. As análises foram realizadas em filogenias feitas com o
critério de parsimônia sob pesos iguais e pesos implicados. A
árvore obtida sob pesos iguais, recupera a maioria dos grupos
encontrados em análises prévias. O consenso estrito das árvores
de pesos implicados, recupera quinze grupos, mas não pode-se
estabelecer as relações entre eles. A análise de áreas ancestrais
permite postular a região Andino-Patagônica como provável área
ancestral, resultado este, congruente com hipóteses prévias e com
informação paleontológica.
PALABRAS-CHAVE: Liolaemus, chilinesis, Dispersão-
Vicariância, Fitch, Áreas Ancestrais Pesadas, Andes,
Patagonia.
ACKNOWLEDGMENTS
We thank Claudia Szumik and Sebastián
Quinteros for making suggestions to an earlier draft of
the manuscript. We also thank Sonia Kretzschmar for
help with the translation of the abstract to Portuguese.
Cristian Abdala, Sebastián Quinteros, Federico Arias and
Soledad Vadecantos helped with disscussions and with
friendship. The senior author would like to thank Elisa
Núñez for her invaluable help and patience. This study
was supported by Consejo Nacional de Investigaciones
Científicas y Técnicas (CONICET – PIP Nº 5982).
REFERENCES
Avila, L.J.; Cei, J.M.; Martori, R.A. & Acosta, J.C. 1992. A new
species of Liolaemus of the bibronii group from granitic
ravines of Achiras, Sierra de Comechingones, Córdoba,
Argentina (Reptilia: Tropiduridae). Bolletino del Museo Regionale
di Scienze Naturali, Torino, 10(1):101-111.
Albino, A.M. 1998. Primer registro fósil de Liolaemus (Squamata:
Iguania: Tropiduridae). In: VII Congreso Argentino de
Paleontología y Bioestratigrafía, Bahía Blanca. Actas, p. 57.
Albino, A.M. 2005. A late Quartenary lizard assemblage from
the Southern Pampean region of Argentina. Journal of
Vertebrate Paleontology, 25(1):185-191.
Bremer, K. 1992. Ancestral Areas: a cladistic reinterpretation of
the center of origin concept. Systematic Biology, 41:436-445.
Brown, J.H. & Gibson, A.C. 1983. Biogeography. C.V. Mosby,
Toronto.
Cabrera, A.L. & Willink, A. 1980. Biogeografía de América Latina.
Secretaría General de la OEA. Washington.
Cei, J.M. 1979. The Patagonian Herpetofauna. In: Duellman, W.E.
(Ed.), The South American Herpetofauna: Its Origin, Evolution,
and Dispersal. Museum of Natural History University of
Kansas, Monograph 7, p. 309-339.
Cei, J.M. 1986. Reptiles del centro, centro-oeste y sur de la Argentina.
Museo Regionale di Scienze Naturali, Torino, Monografie
4.
Cei, J.M. 1993. Reptiles del noroeste, nordeste y este de la Argentina. Museo
Regionale di Scienze Naturali, Torino, Monografie 14.
Ebach, M.C. 1999. Paralogy and the Centre of Origin Concept.
Cladistics, 15(4):387-391.
Espinoza, R.E.; Wiens, J.J. & Tracy, C.R. 2004. Recurrent evolution
of herbivory in small, cold-climate lizards: breaking the
ecophysiological rules of reptilian herbivory. Proceedings of
the National Academy of Sciences, DOI: 101:16819-16824.
Etheridge, R. 1995. Redescription of Ctenoblepharys adspersa
Tschudi, 1845, and the taxonomy of Liolaeminae (Reptilia:
PAP. AVULS ZOOL. 46(24), 2006 273
Squamata: Tropiduridae). American Museum Novitates,
3142:1-34.
Etheridge, R. 2000. A review of lizards of the Liolaemus
wiegmanniii group (Squamata, Iguania, Tropiduridae), and a
history of morphological change in the sand-dwelling
species. Herpertological Monographs, 14:293-352.
Goloboff, P. 1993. Estimating character weights during tree
search. Cladistics, 9:83-91.
Goloboff, P.; Farris, S. & Nixon, K. 2003. T.N.T.: Tree analysis
using New Technology. Available at: <www.zmuc.dk./
public/phylogeny>.
Halloy, M.; Etheridge, R. & Burghardt, G.M. 1998. To bury in
sand: Phylogenetic relationships among lizard species of
the boulengeri group, Liolaemus (Reptilia: Squamata:
Tropiduridae), based on behavioral characters. Herpetological
Monographs, 12:1-37.
Hausdorf, B. 1998. Weighted ancestral area analysis and the
solution of the redundant distribution problem. Systematic
Biology, 47(3):445-456.
Hellmich, W. 1951. On ecotypic and autotypic characters, a
con-tribution to the knowledge of the evolution of the
genus Liolaemus (Iguanidae). Evolution, 5:359-369.
Hovenkamp, P. 1997. Vicariance events, not Areas, should be
used in Biogeographical analysis. Cladistics, 13:67-79.
Kitching, I.J.; Forey, P.L.; Humphries, C.J. & Williams, D.M. 1998.
Cladistics: The Theory and Practice of Parsimony Analysis.
Oxford University Press, Oxford.
Lamborot, M.; Alvarez, E.; Campos, I. & Espinoza, A. 1981.
Karyotypic characterization of three chilean subspecies
of Liolaemus monticola. The Journal of Heredity, 72:328-334.
Laurent, R.F. 1983. Contribución al conocimiento de la estructura
taxonómica del género Liolaemus Wiegmann (Iguanidae).
Boletin de la Asociación Herpetologica Argentina, 1:16-18.
Laurent, R.F. 1985. Segunda contribución al conocimiento de la
estructura taxonómica del género Liolaemus Wiegmann
(Iguanidae). Cuadernos de Herpetología, 1:1-37.
Laurent, R.F. 1992. On some overlooked species of the genus
Liolaemus Wiegmann (Reptilia Tropidurinae) from Peru.
Breviora, 494:1-33.
Lobo, F. 2001. A phylogenetic analysis of lizards of the Liolaemus
chiliensis group (Iguania: Tropiduridae). Herpetological Journal,
11(4):137-150
Lobo, F. 2005. Las relaciones filogenéticas dentro del grupo
chiliensis (Iguania: Liolaemidae) sumando nuevos caracteres
y taxones. Acta Zoológica Lilloana, 49(1-2):67-89.
Lobo, F. & Espinoza, R.E. 2004. Further Resolution of Purported
Reproductive Bimodality in Liolaemus alticolor (Iguania:
Tropiduridae) with descriptions of Two New Species from
the Puna Region of Argentina and Chile. Copeia, (4):850-867.
Lobo, F; Quinteros, S. & Díaz Gómez, J.M. In press. Description
of a new species of the liolaemus alticolor group (Iguania:
Liolaemidae) from Cuzco, Peru.
Martinez Oliver, I. & Lobo, F. 2002. Una nueva especie de
Liolaemus del grupo alticolor (Iguania: Liolaemidae) de la
puna salteña, Argentina. Cuadernos de Herpetología, 16(1):47-64.
Morando M.; Avila, L.J. & Sites Jr., J.W. 2003. Sampling strategies
for delimiting species: genes, individulas, and populations
in the Liolaemus elongatus-kriegi complex (Squamata:
Liolaemidae) in andean-patagonian South America. Systematic
Biology, 52(2):159-185.
Morrone, J.J. 1996. The biogeographical Andean subregion: a
proposal exemplified by Arthropod taxa (Arachnida,
Crustacea and Hexapoda). Neotropica, 42:103-114.
Ortiz, J.C. 1981. Révision taxonomique et biologique des Liolaemus du
groupe nigromaculatus (Squamata, Iguanidae). Université de Paris
VII. (Thèse Doctorat d’Etat ès Sciences Naturelles).
Roig-Juñent, S. 1994. Historia Biogeográfica de América del Sur
Austral. Multequina. 3:167-203.
Ronquist, F. 1994. Ancestral areas and parsimony. Systematic Biology,
43:267-274.
Ronquist, F. 1997. Dispersal-vicariance analysis: a new approach
to the quantification of historical biogeography. Systematic
Biology, 46:195-203.
Schulte, J.A.; Macey, J.R.; Espinoza, R.E. & Larson, A. 2000.
Phylogenetic relationships in the iguanid lizard genus
Liolaemus: multiple origins of viviparous reproduction and
evidence for recurring andean vicariance and dispersal.
Biological Journal of the Linnean Society, 69:75-102.
Schulte II, J.A.; Valladares, J.P. & Larson, A. 2003. Phylogenetic
relationships within Iguanidae using molecular and
morphological data and a phylogenetic taxonomy of
iguanian lizards. Herpetologica, 59:399-419.
Solbrig, O.T. 1976. The origin and floristic affinities of the
South American temperate desert and semidesert regions.
In: Goodall, D.W. (Ed.), Evolution of desert biota. University
Texas Press, Austin, p. 7-49.
Thiele, K. 1993. The holy grail of the perfect character: the
cladistic treatment of morphometric data. Cladistics,
9:275-304.
Young-Downey, A.R. 1998. Phylogenetic studies on Liolaemus (Sauria:
Tropiduridae): an interpretation based on molecular data and
a biochemical test of a biogeographic hypothesis. Univestity
of Miami, Coral Gables, Florida. (Ph.D. Dissertation).
Recebido em: 21.08.2006
Aceito em: 19.12.2006

274 DÍAZ GÓMES, J.M. & LOBO, F.: ANCESTRAL AREA ANALYSIS ON LIOLAEMUS
APPENDIX 1
New characters used:
1. Gravid Coloration: (0) Absent; (1) Present
2. Plant-Microhabitat: (0) Bunch grass (Festuca sp); (1) Spiny shrub (Parastrephia); (2) Both
3. Lateral Black Spots: (0) Absent; (1) Present
Recommended