De conformidad con lo establecido en el artículo 228 del Real Decreto 4/2015, de 23 de octubre, por el
que se aprueba el texto refundido de la Ley del Mercado de Valores, Inmobiliaria Colonial, S.A.
(“Colonial”) comunica el siguiente
HECHO RELEVANTE
Como continuación al Hecho Relevante publicado con fecha 5 de mayo de 2016 con número de registro 238212, Colonial remite documentación de soporte a la presentación a analistas e inversores relativa a
los resultados correspondientes al primer trimestre de 2016, que se celebrará hoy viernes día 13 de
mayo de 2016 a las 15:00 horas (CET) a través de un webcast.
Los datos de conexión a la conferencia se detallan a continuación:
Desde España: +34 917900881
Desde Holanda: +31 107138194 + 58822699#
Desde el Reino Unido: +44 (0) 2071070685
La presentación online será visible a través del siguiente link:
http://event.onlineseminarsolutions.com/r.htm?e=1169704&s=1&k=0390C96E72ADB6F7572AA52586F9E824
Adicionalmente, la presentación de resultados semestrales estará disponible en la página web de la
Sociedad.
En Barcelona, a 13 de mayo de 2016.
1
13 May 2016
First Quarter Results 2016
2
Disclaimer
By accepting this presentation and/or by attending this presentation, you will be taken to have represented, warranted and undertaken that you have read
and agree to comply with the contents of this disclaimer. The information contained in this presentation (“Presentation”) has been prepared by Inmobiliaria
Colonial, S.A. (the “Company”) and has not been independently verified and will not be updated. No representation, warranty or undertaking, express or
implied, is made as to, and no reliance should be placed on, the fairness, accuracy, completeness or correctness of the information or opinions contained
herein and nothing in this Presentation is, or shall be relied upon as, a promise or representation. None of the Company nor any of its employees, officers,
directors, advisers, representatives, agents or affiliates shall have any liability whatsoever (in negligence or otherwise, whether direct or indirect, in
contract, tort or otherwise) for any loss howsoever arising from any use of this Presentation or its contents or otherwise arising in connection with this
Presentation.
This Presentation is for information purposes only and is incomplete without reference to, and should be viewed solely in conjunction with, the Company’s
publicly available information and, if applicable, the oral briefing provided by the Company. The information and opinions in this presentation are provided
as at the date hereof and subject to change without notice. It is not the intention to provide, and you may not rely on these materials as providing, a
complete or comprehensive analysis of the Company’s financial or trading position or prospects.
This Presentation does not constitute investment, legal, accounting, regulatory, taxation or other advice and does not take into account your investment
objectives or legal, accounting, regulatory, taxation or financial situation or particular needs. You are solely responsible for forming your own opinions and
conclusions on such matters and for making your own independent assessment of the Company. You are solely responsible for seeking independent
professional advice in relation to the Company. No responsibility or liability is accepted by any person for any of the information or for any action taken by
you or any of your officers, employees, agents or associates on the basis of such information.
This Presentation could contain financial information regarding the businesses and assets of the Company. Such financial information may not have been
audited, reviewed or verified by any independent accounting firm. The inclusion of such financial information in this Presentation or any related presentation
should not be regarded as a representation or warranty by the Company, its affiliates, advisors or representatives or any other person as to the accuracy or
completeness of such information’s portrayal of the financial condition or results of operations by the Company and should not be relied upon when making
an investment decision. Certain financial and statistical information in this document has been subject to rounding off adjustments. Accordingly, the sum of
certain data may not conform to the expressed total.
Certain statements in this Presentation may be forward-looking. By their nature, forward-looking statements involve a number of risks, uncertainties and
assumptions which could cause actual results or events to differ materially from those expressed or implied by the forward-looking statements. These
include, among other factors, changing economic, business or other market conditions, changing political conditions and the prospects for growth anticipated
by the Company’s management. These and other factors could adversely affect the outcome and financial effects of the plans and events described herein.
Any forward-looking statements contained in this Presentation and based upon past trends or activities should not be taken as a representation that such
trends or activities will continue in the future. The Company does not undertake any obligation to update or revise any forward-looking statements, whether
as a result of new information, future events or otherwise.
The market and industry data and forecasts that may be included in this Presentation were obtained from internal surveys, estimates, experts and studies,
where appropriate as well as external market research, publicly available information and industry publications. The Company, it affiliates, directors,
officers, advisors and employees have not independently verified the accuracy of any such market and industry data and forecasts and make no
representations or warranties in relation thereto. Such data and forecasts are included herein for information purposes only. Accordingly, undue reliance
should not be placed on any of the industry or market data contained in this Presentation.
The distribution of this Presentation in other jurisdictions may be restricted by law and persons into whose possession this presentation comes should inform
themselves about and observe any such restrictions.
NEITHER THIS DOCUMENT NOR ANY OF THE INFORMATION CONTAINED HEREIN CONSTITUTES AN OFFER OF PURCHASE, SALE OR EXCHANGE, NOR A REQUEST
FOR AN OFFER OF PURCHASE, SALE OR EXCHANGE OF SECURITIES, OR ANY ADVICE OR RECOMMENDATION WITH RESPECT TO SUCH SECURITIES.

3
AGENDA – FIRST QUARTER 2016 RESULTS PRESENTATION
PRESENTING MANAGEMENT TEAM
Pere Viñolas
CEO
Carmina Ganyet
Corporate Managing Director
Carlos Krohmer
Chief Corporate Development Officer
AGENDA
Highlights
Office markets
Operating performance
Financial review
Growth drivers
Conclusion & Outlook
1
2
3
4
5
6
HIGHLIGHTS1
Prime CBD70%
CBD 6%
BD 17%
Others 7%
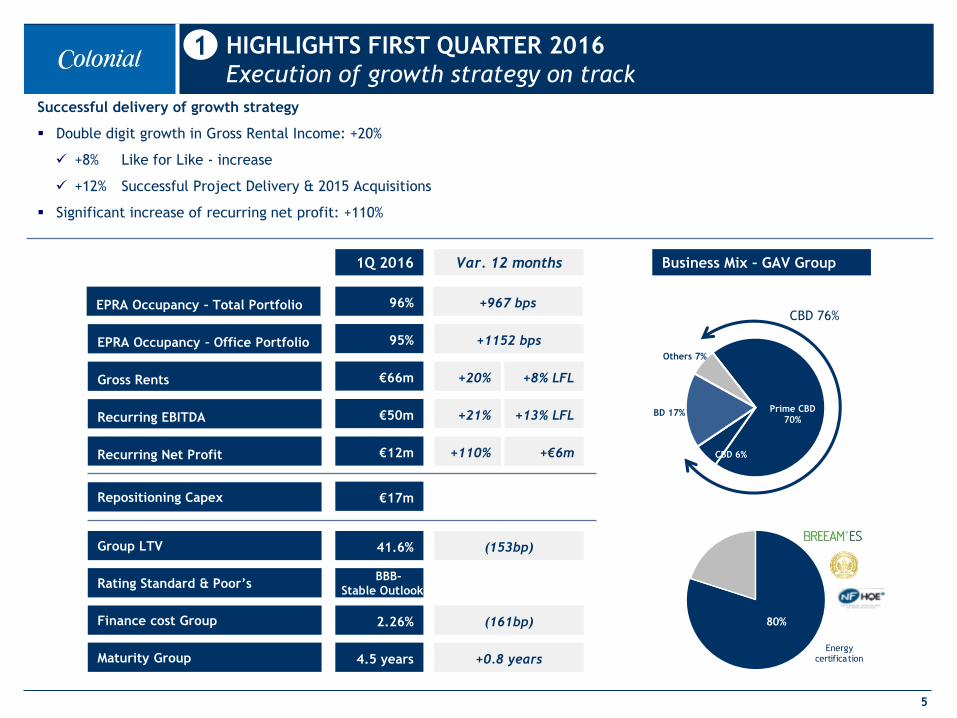
Successful delivery of growth strategy
Double digit growth in Gross Rental Income: +20%
+8% Like for Like - increase
+12% Successful Project Delivery & 2015 Acquisitions
Significant increase of recurring net profit: +110%
5
HIGHLIGHTS FIRST QUARTER 2016
Execution of growth strategy on track1
Repositioning Capex
1Q 2016 Var. 12 months
Gross Rents
Recurring Net Profit
Recurring EBITDA
€66m
€12m
€50m
+20%
Group LTV
Rating Standard & Poor’s
€17m
41.6%
BBB-
Stable Outlook
EPRA Occupancy – Office Portfolio 95% +1152 bps
Finance cost Group 2.26%
Maturity Group 4.5 years
CBD 76%
Energy certification
80%(161bp)
(153bp)
+0.8 years
Business Mix – GAV Group
EPRA Occupancy – Total Portfolio 96% +967 bps
+8% LFL
+21% +13% LFL
+110% +€6m

OFFICE MARKETS2
3.2
1.1
1.5
3.1
2.8
1.3
1.6
3.4
2.1
1.4
1.7
3.7
Spain France Euro Area World
2015 2016 2017
7
OFFICE MARKETS
Macroeconomic context2
Source: Monthly report “la Caixa”
15 16E 17E
SPAIN
15 16E 17E 15 16E 17E 15 16E 17E
FRANCE EURO AREA WORLD
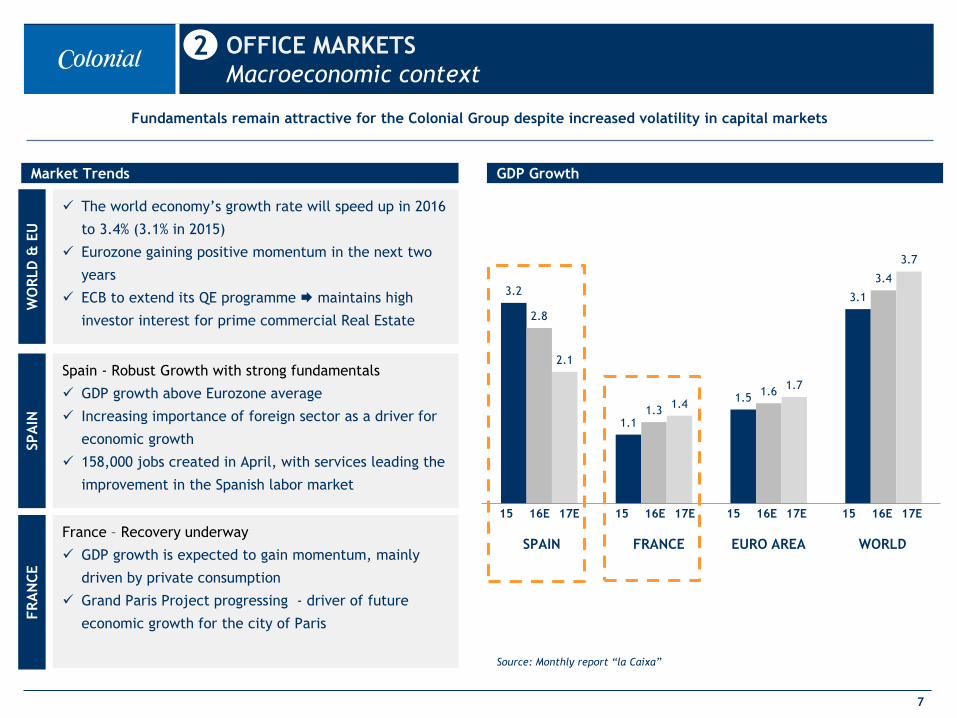
Fundamentals remain attractive for the Colonial Group despite increased volatility in capital markets
GDP Growth
The world economy’s growth rate will speed up in 2016
to 3.4% (3.1% in 2015)
Eurozone gaining positive momentum in the next two
years
ECB to extend its QE programme maintains high
investor interest for prime commercial Real Estate
Spain - Robust Growth with strong fundamentals
GDP growth above Eurozone average
Increasing importance of foreign sector as a driver for
economic growth
158,000 jobs created in April, with services leading the
improvement in the Spanish labor market
FR
AN
CE
SPA
INW
OR
LD
& E
U
Market Trends
France – Recovery underway
GDP growth is expected to gain momentum, mainly
driven by private consumption
Grand Paris Project progressing - driver of future
economic growth for the city of Paris
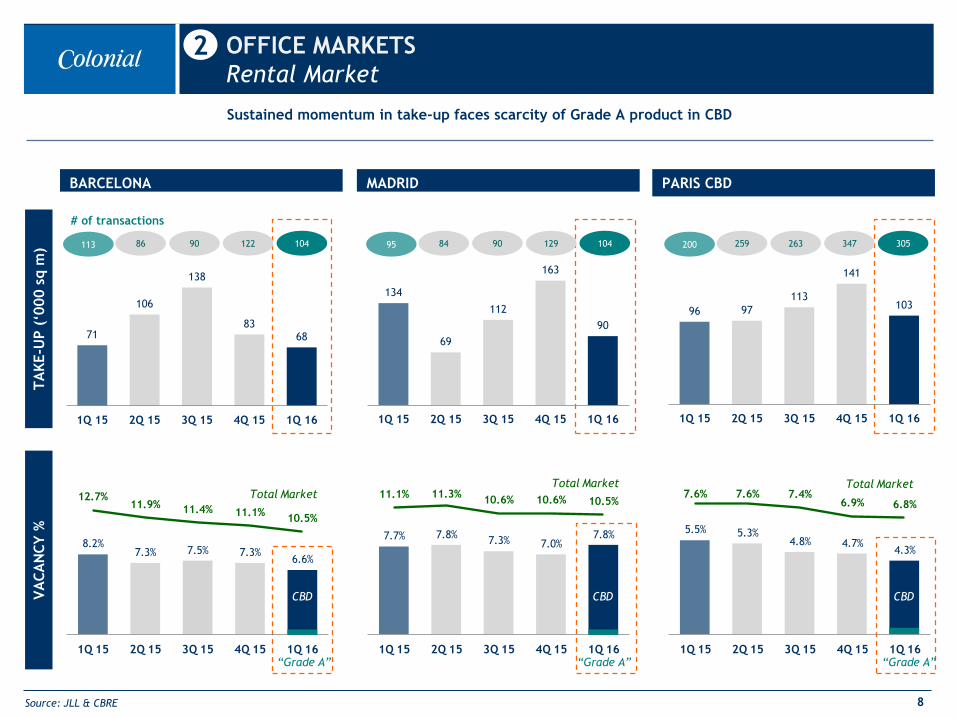
5.5% 5.3%4.8% 4.7%
4.3%
7.6% 7.6% 7.4%6.9% 6.8%
1Q 15 2Q 15 3Q 15 4Q 15 1Q 16
8.2%7.3% 7.5% 7.3%
6.6%
12.7%11.9% 11.4% 11.1%
10.5%
1Q 15 2Q 15 3Q 15 4Q 15 1Q 16
7.7% 7.8%7.3% 7.0%
7.8%
11.1% 11.3%10.6% 10.6% 10.5%
1Q 15 2Q 15 3Q 15 4Q 15 1Q 16“Grade A”
CBD
Total MarketTotal Market Total Market
CBDCBD
“Grade A”“Grade A”
Sustained momentum in take-up faces scarcity of Grade A product in CBD
8
OFFICE MARKETS
Rental Market2
TA
KE-U
P (
‘000 s
qm
)
Source: JLL & CBRE
BARCELONA MADRID PARIS CBD
VA
CA
NC
Y %
71
106
138
8368
1Q 15 2Q 15 3Q 15 4Q 15 1Q 16
134
69
112
163
90
1Q 15 2Q 15 3Q 15 4Q 15 1Q 16
96 97
113
141
103
1Q 15 2Q 15 3Q 15 4Q 15 1Q 16
# of transactions
86 90 122 104 84 90 129 104 259 263 347 305113 95 200
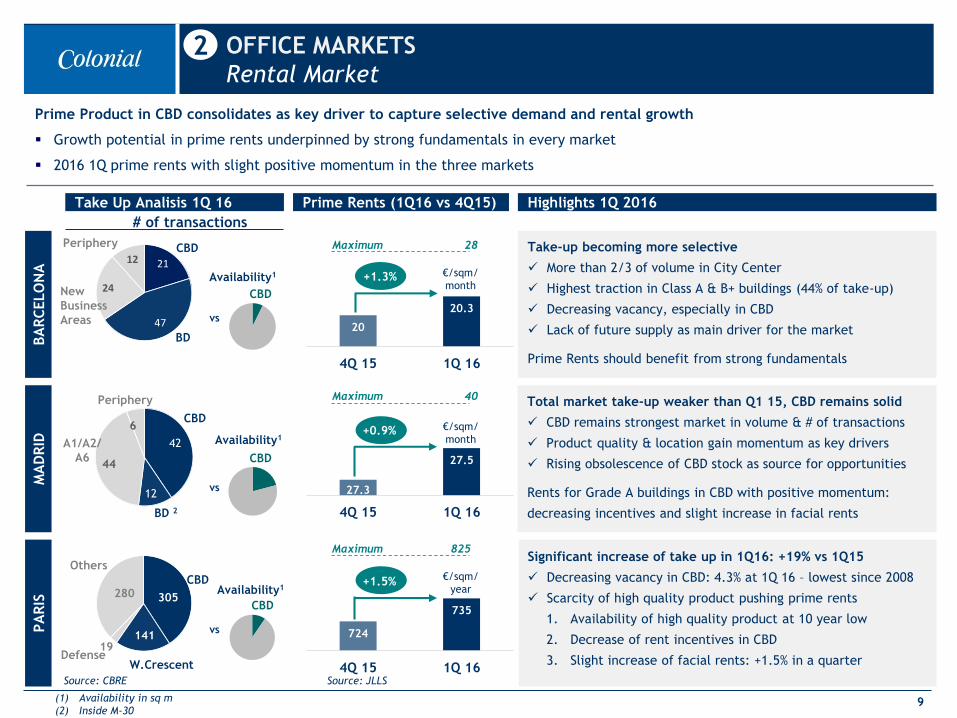
Maximum 28
724
735
4Q 15 1Q 16
20
20.3
4Q 15 1Q 16
Maximum 40
27.3
27.5
4Q 15 1Q 16
Maximum 825
42
12
44
6
305
14119
280
21
47
24
12
9
OFFICE MARKETS
Rental Market2
(1) Availability in sq m
(2) Inside M-30
Take Up Analisis 1Q 16 Highlights 1Q 2016
BA
RC
ELO
NA
PA
RIS
MA
DR
ID
vs
vs
vs
Availability1
CBD
CBD
BD
New
Business
Areas
CBD
BD 2
Periphery
Periphery
# of transactions
CBD
Others
Defense
Availability1
Availability1
CBD
CBD
A1/A2/
A6
W.Crescent
Source: CBRE
Prime Rents (1Q16 vs 4Q15)
+1.3%
+0.9%
+1.5%
Source: JLLS
Take-up becoming more selective
More than 2/3 of volume in City Center
Highest traction in Class A & B+ buildings (44% of take-up)
Decreasing vacancy, especially in CBD
Lack of future supply as main driver for the market
Prime Rents should benefit from strong fundamentals
Total market take-up weaker than Q1 15, CBD remains solid
CBD remains strongest market in volume & # of transactions
Product quality & location gain momentum as key drivers
Rising obsolescence of CBD stock as source for opportunities
Rents for Grade A buildings in CBD with positive momentum:
decreasing incentives and slight increase in facial rents
Significant increase of take up in 1Q16: +19% vs 1Q15
Decreasing vacancy in CBD: 4.3% at 1Q 16 – lowest since 2008
Scarcity of high quality product pushing prime rents
1. Availability of high quality product at 10 year low
2. Decrease of rent incentives in CBD
3. Slight increase of facial rents: +1.5% in a quarter
Prime Product in CBD consolidates as key driver to capture selective demand and rental growth
Growth potential in prime rents underpinned by strong fundamentals in every market
2016 1Q prime rents with slight positive momentum in the three markets
€/sqm/
month
€/sqm/
month
€/sqm/
year
Source: JLL & Bloomberg 10(1) Market consultants in Spain report gross yields and in France they report net yields
OFFICE MARKETS
Investment Market2
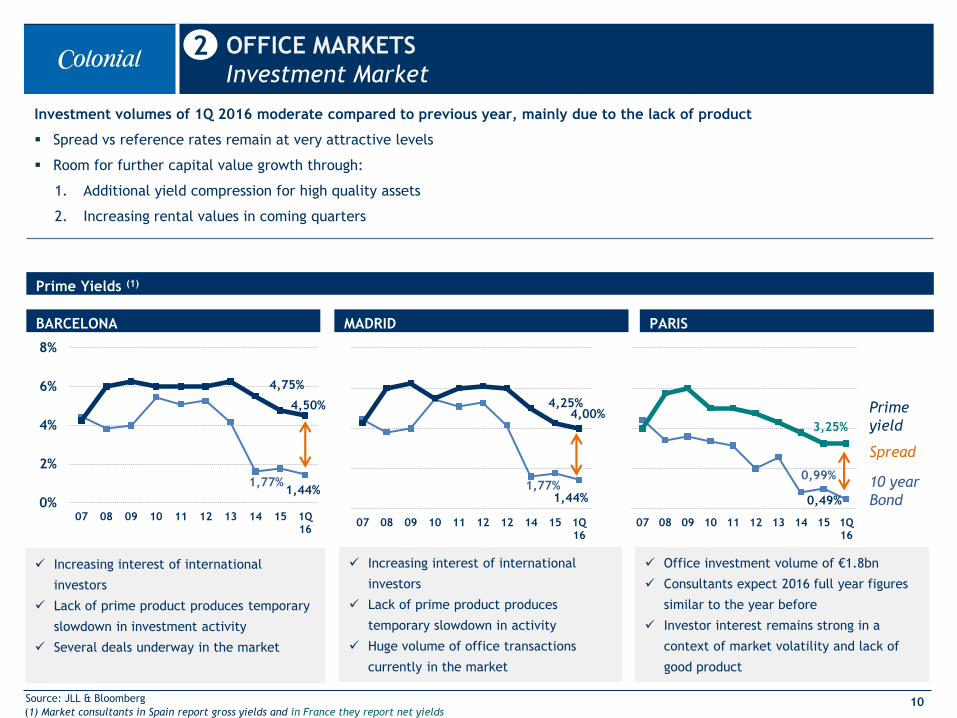
Investment volumes of 1Q 2016 moderate compared to previous year, mainly due to the lack of product
Spread vs reference rates remain at very attractive levels
Room for further capital value growth through:
1. Additional yield compression for high quality assets
2. Increasing rental values in coming quarters
PARISBARCELONA MADRID
Prime Yields (1)
Increasing interest of international
investors
Lack of prime product produces temporary
slowdown in investment activity
Several deals underway in the market
Increasing interest of international
investors
Lack of prime product produces
temporary slowdown in activity
Huge volume of office transactions
currently in the market
Office investment volume of €1.8bn
Consultants expect 2016 full year figures
similar to the year before
Investor interest remains strong in a
context of market volatility and lack of
good product
1,77%1,44%
4,75%
4,50%
0%
2%
4%
6%
8%
07 08 09 10 11 12 13 14 15 1Q16
1,77%1,44%
4,25%4,00%
07 08 09 10 11 12 12 14 15 1Q16
0,99%
0,49%
3,25%
07 08 09 10 11 12 13 14 15 1Q16
10 year
Bond
Prime
yield
Spread
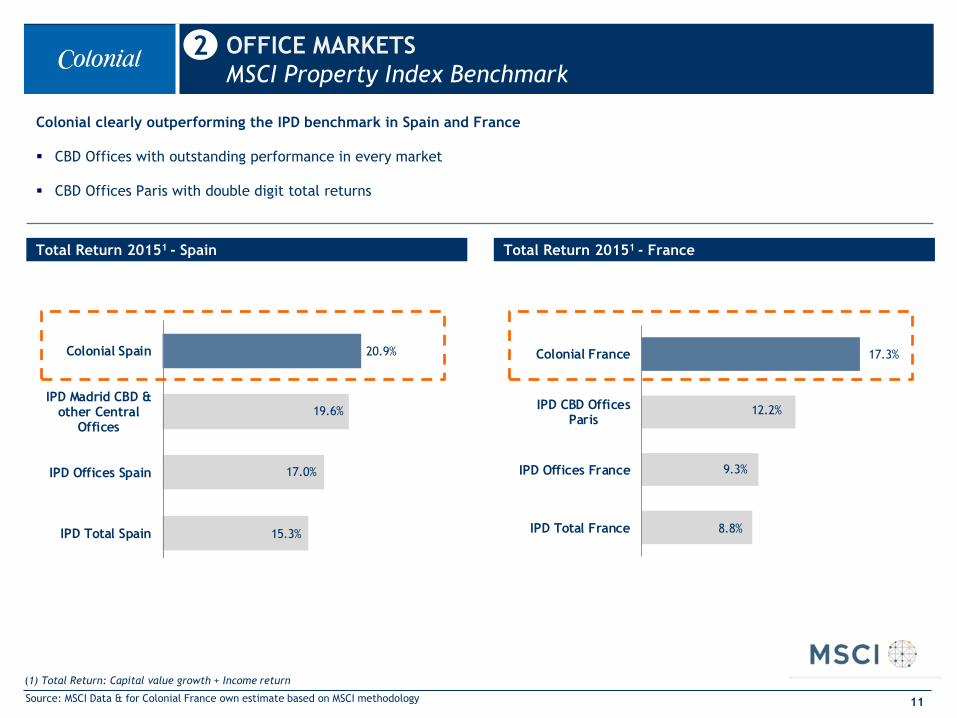
Colonial clearly outperforming the IPD benchmark in Spain and France
CBD Offices with outstanding performance in every market
CBD Offices Paris with double digit total returns
Total Return 20151 - Spain Total Return 20151 - France
11
(1) Total Return: Capital value growth + Income return
OFFICE MARKETS
MSCI Property Index Benchmark2
Source: MSCI Data & for Colonial France own estimate based on MSCI methodology
15.3%
17.0%
19.6%
20.9%
IPD Total Spain
IPD Offices Spain
IPD Madrid CBD &other Central
Offices
Colonial Spain
8.8%
9.3%
12.2%
17.3%
IPD Total France
IPD Offices France
IPD CBD OfficesParis
Colonial France
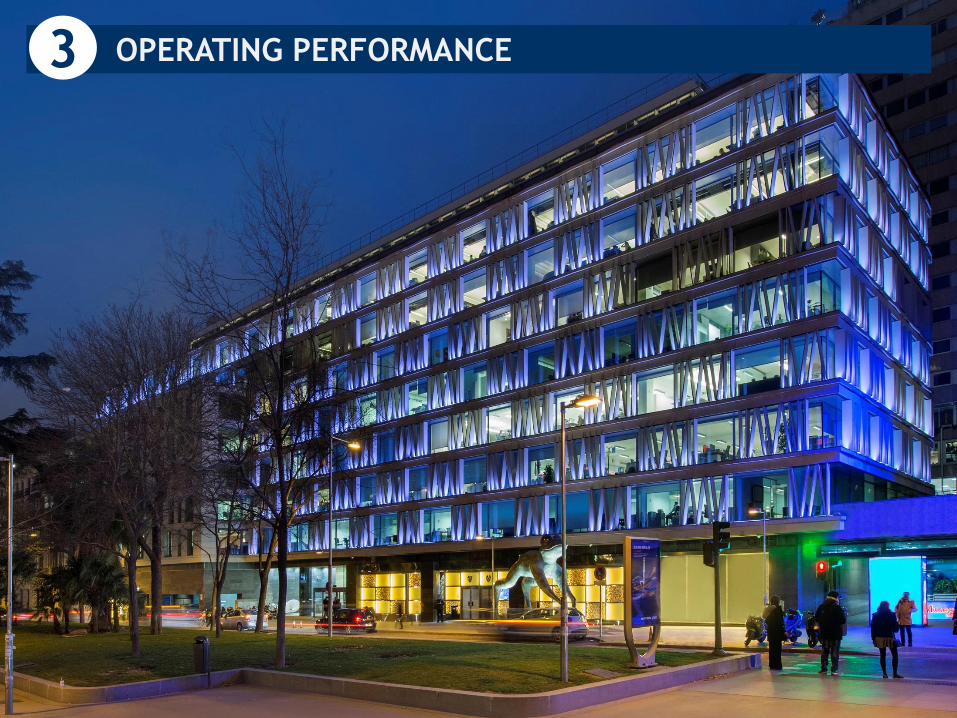
OPERATING PERFORMANCE3
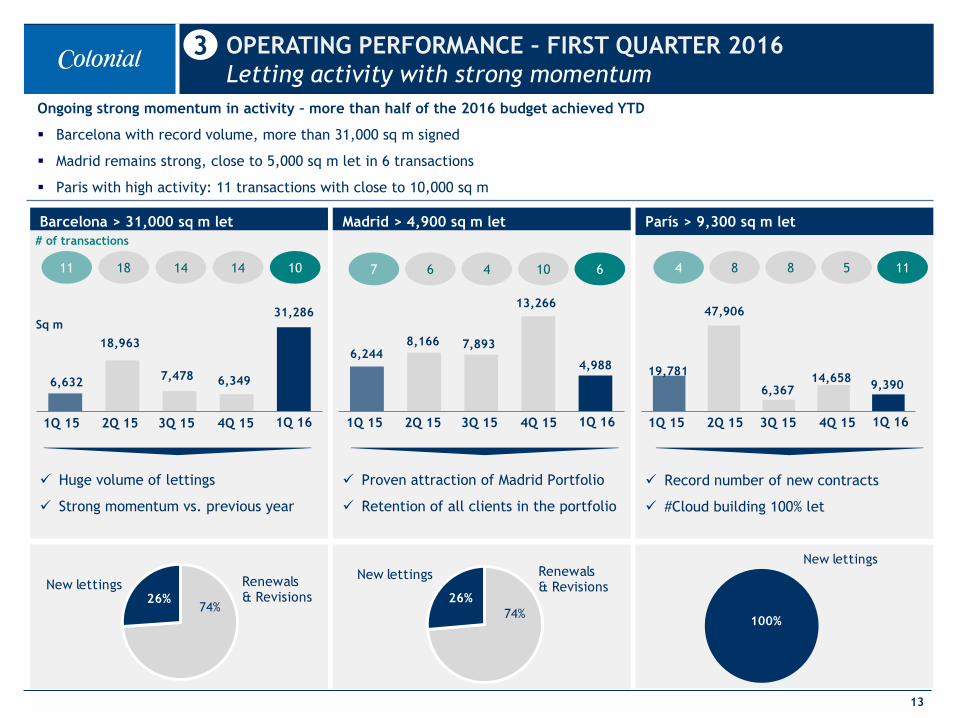
Record number of new contracts
#Cloud building 100% let
Proven attraction of Madrid Portfolio
Retention of all clients in the portfolio
Huge volume of lettings
Strong momentum vs. previous year
Ongoing strong momentum in activity – more than half of the 2016 budget achieved YTD
Barcelona with record volume, more than 31,000 sq m signed
Madrid remains strong, close to 5,000 sq m let in 6 transactions
Paris with high activity: 11 transactions with close to 10,000 sq m
13
Barcelona > 31,000 sq m let Madrid > 4,900 sq m let París > 9,300 sq m let
OPERATING PERFORMANCE – FIRST QUARTER 2016
Letting activity with strong momentum3
# of transactions
18 14 1411 8 8 54
Sq m
6 4 10710 6 11
1Q 15 3Q 15 4Q 152Q 15 1Q 16 1Q 15 3Q 15 4Q 152Q 15 1Q 16 1Q 15 3Q 15 4Q 152Q 15 1Q 16
74%26%
Renewals & Revisions
New lettings
74%
26%
Renewals & Revisions
New lettings
6,632
18,963
7,478 6,349
31,286
1T 15 2T 15 3T 15 4T 15 1T 16
6,2448,166 7,893
13,266
4,988
1T 15 2T 15 3T 15 4T 15 1T 16
19,781
47,906
6,36714,658
9,390
1T 15 2T 15 3T 15 4T 15 1T 16
0%
100%
New lettings
100% let 100% let
22,394
sqm
2,693
sqm
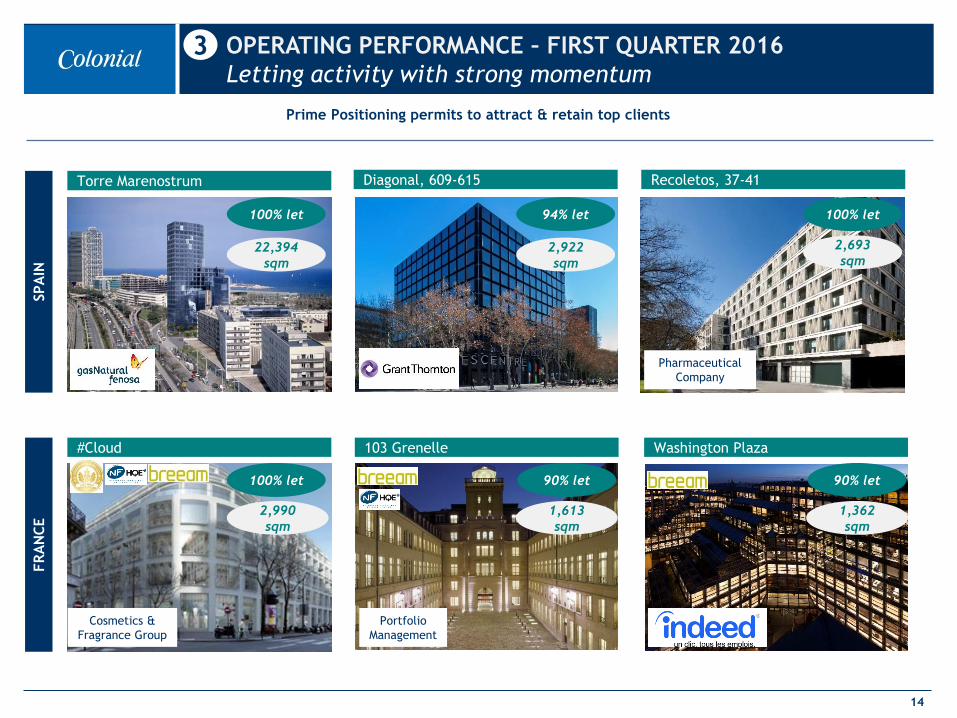
Prime Positioning permits to attract & retain top clients
OPERATING PERFORMANCE – FIRST QUARTER 2016
Letting activity with strong momentum3
2,990
sqm
94% let
2,922
sqm
14
Recoletos, 37-41
#Cloud
Torre Marenostrum Diagonal, 609-615
100% let
103 Grenelle
1,362
sqm
Washington Plaza
90% let
1,613
sqm
90% let
Pharmaceutical
Company
SPA
INFR
AN
CE
Cosmetics &
Fragrance Group
Portfolio
Management
MA
DR
IDPA
RIS
TO
TA
LB
AR
CELO
NA
79%85% 87% 89%
93%
1Q 15 2Q 15 3Q 15 4Q 15 1Q 16
83%85%
95% 94%
96%
1Q 15 2Q 15 3Q 15 4Q 15 1Q 16
84%
86%93% 94%
95%
1Q 15 2Q 15 3Q 15 4Q 15 1Q 16
91%
93% 92%96%
97%
1Q 15 2Q 15 3Q 15 4Q 15 1Q 16
MA
DR
IDPA
RIS
TO
TA
LB
AR
CELO
NA
79%85% 87% 89%
93%
1Q 15 2Q 15 3Q 15 4Q 15 1Q 16
83%85%
95% 94%
96%
1Q 15 2Q 15 3Q 15 4Q 15 1Q 16
84%
86%93% 94%
95%
1Q 15 2Q 15 3Q 15 4Q 15 1Q 16
91%
93% 92%96%
97%
1Q 15 2Q 15 3Q 15 4Q 15 1Q 16
15
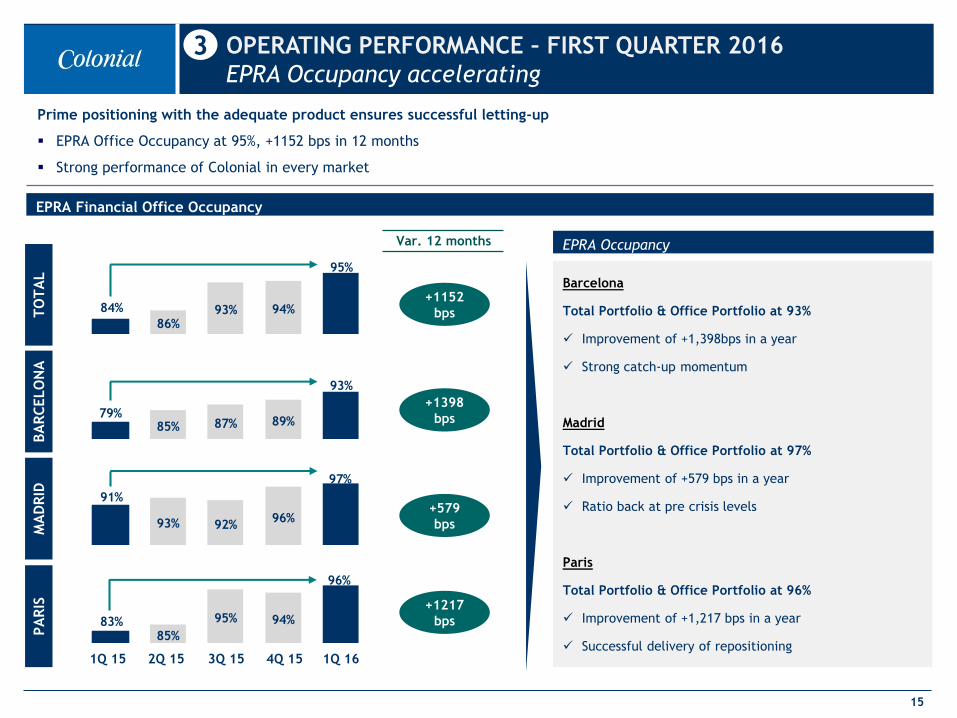
EPRA Financial Office Occupancy
Prime positioning with the adequate product ensures successful letting-up
EPRA Office Occupancy at 95%, +1152 bps in 12 months
Strong performance of Colonial in every market
EPRA Occupancy
Barcelona
Total Portfolio & Office Portfolio at 93%
Improvement of +1,398bps in a year
Strong catch-up momentum
Madrid
Total Portfolio & Office Portfolio at 97%
Improvement of +579 bps in a year
Ratio back at pre crisis levels
Paris
Total Portfolio & Office Portfolio at 96%
Improvement of +1,217 bps in a year
Successful delivery of repositioning
+1398
bps
+579
bps
+1152
bps
+1217
bps
OPERATING PERFORMANCE – FIRST QUARTER 2016
EPRA Occupancy accelerating3
BA
RC
ELO
NA
PA
RIS
MA
DR
IDT
OT
AL
Var. 12 months
2Q 15 4Q 15 1Q 163Q 151Q 15
228
273283
12/14 12/15 1Q 16
19%
16
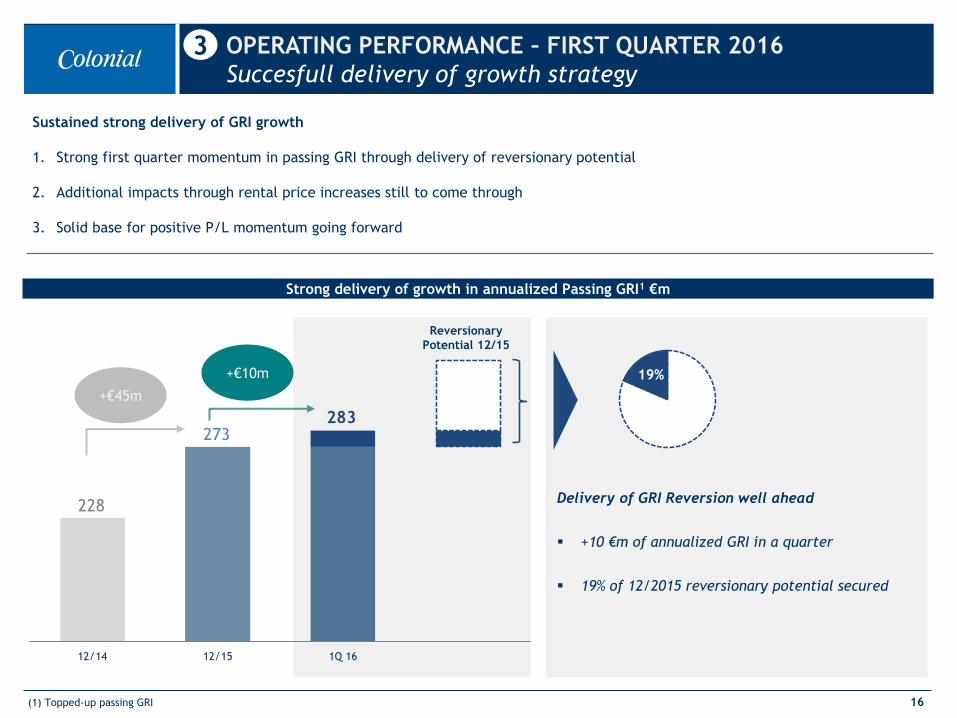
OPERATING PERFORMANCE – FIRST QUARTER 2016
Succesfull delivery of growth strategy3
(1) Topped-up passing GRI
Sustained strong delivery of GRI growth
1. Strong first quarter momentum in passing GRI through delivery of reversionary potential
2. Additional impacts through rental price increases still to come through
3. Solid base for positive P/L momentum going forward
Strong delivery of growth in annualized Passing GRI1 €m
Delivery of GRI Reversion well ahead
+10 €m of annualized GRI in a quarter
19% of 12/2015 reversionary potential secured
+€45m
+€10m
Reversionary
Potential 12/15
17
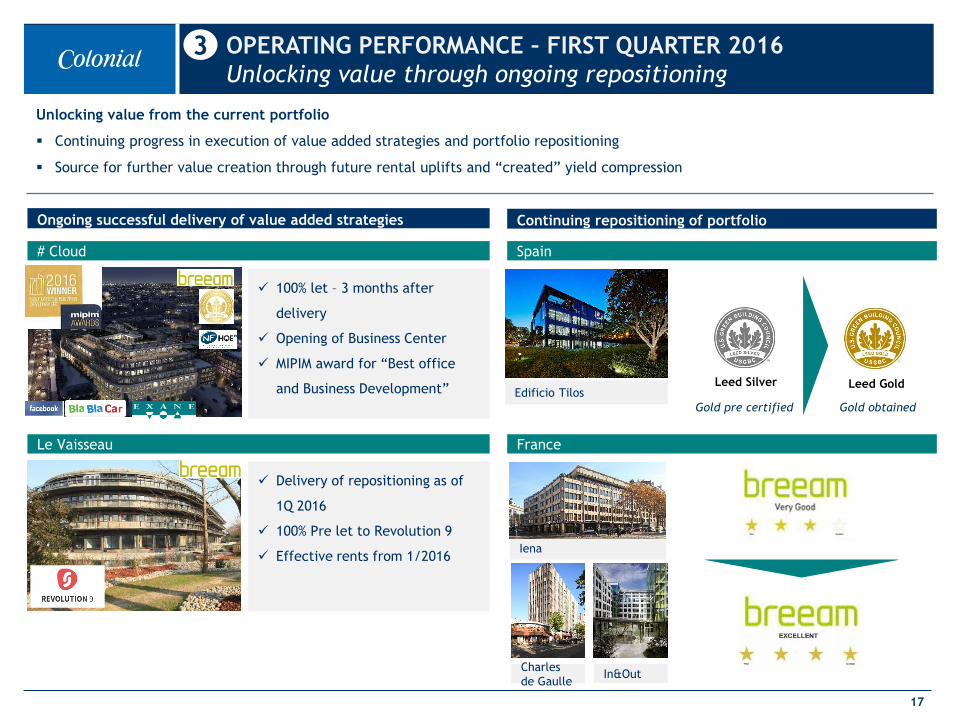
Unlocking value from the current portfolio
Continuing progress in execution of value added strategies and portfolio repositioning
Source for further value creation through future rental uplifts and “created” yield compression
Ongoing successful delivery of value added strategies
100% let – 3 months after
delivery
Opening of Business Center
MIPIM award for “Best office
and Business Development”
OPERATING PERFORMANCE – FIRST QUARTER 2016
Unlocking value through ongoing repositioning3
# Cloud
Le Vaisseau
Delivery of repositioning as of
1Q 2016
100% Pre let to Revolution 9
Effective rents from 1/2016
Continuing repositioning of portfolio
Edificio Tilos
Iena
Spain
France
Leed Silver Leed Gold
Charles
de GaulleIn&Out
Gold pre certified Gold obtained

FINANCIAL REVIEW4
55
66
4.4
6.6
Like-for-Like Projects &Acquisitions
1Q 2015 1Q 2016
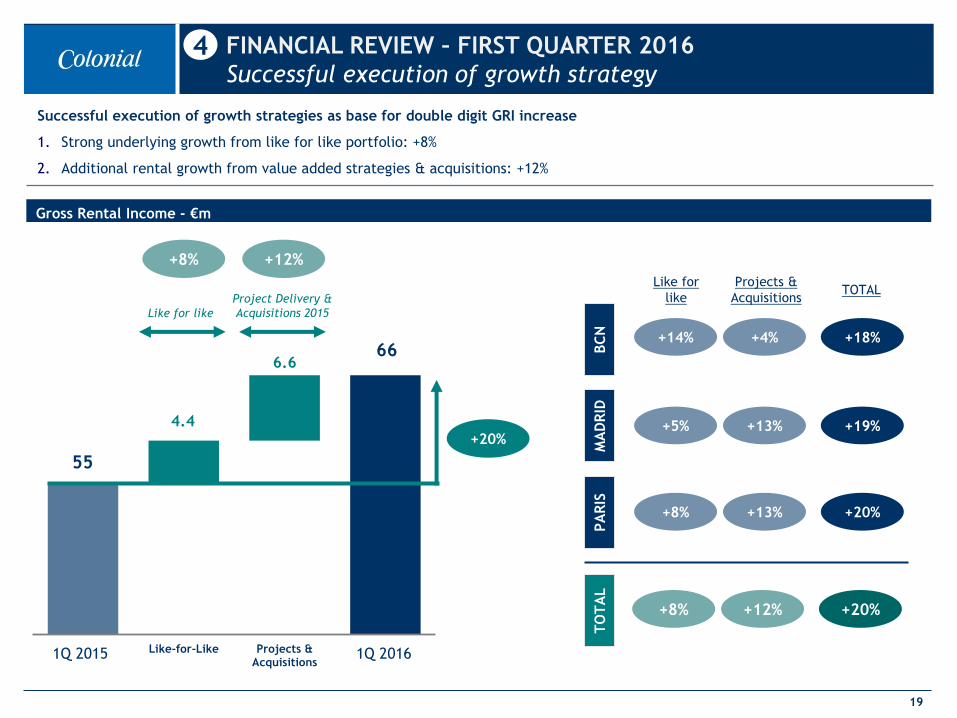
Successful execution of growth strategies as base for double digit GRI increase
1. Strong underlying growth from like for like portfolio: +8%
2. Additional rental growth from value added strategies & acquisitions: +12%
19
Gross Rental Income - €m
4 FINANCIAL REVIEW – FIRST QUARTER 2016
Successful execution of growth strategy
Projects &
AcquisitionsTOTAL
+18%
+19%
+20%
+20%
Like for
like
BC
NM
AD
RID
PA
RIS
TO
TA
L
+14%
+5%
+8%
+8%
+4%
+13%
+13%
+12%
+20%
Like for like
Project Delivery &
Acquisitions 2015
+8% +12%
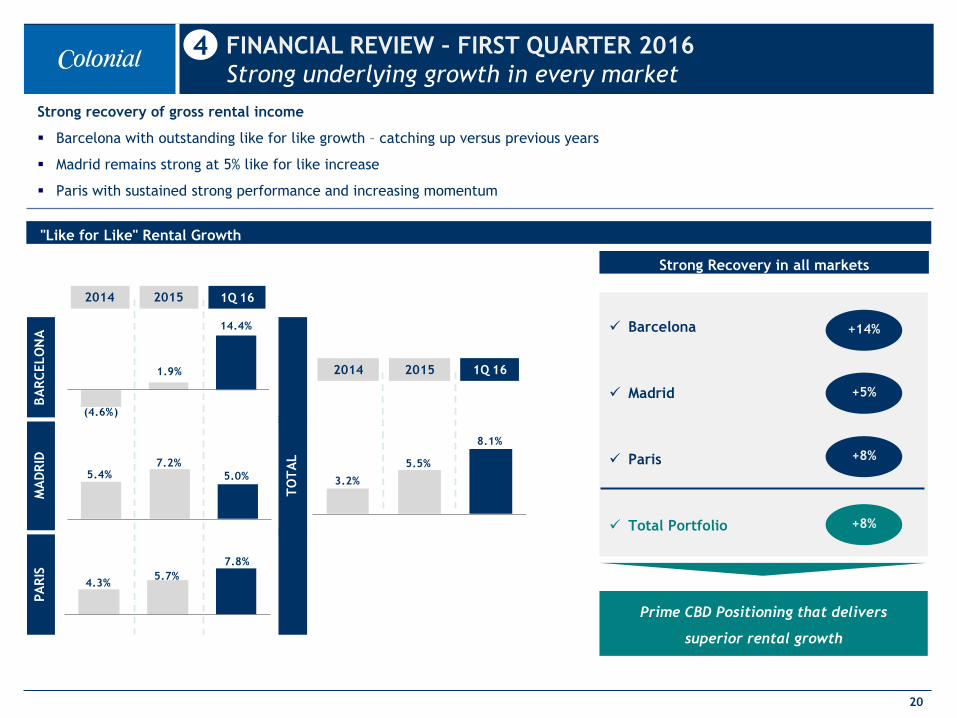
Strong recovery of gross rental income
Barcelona with outstanding like for like growth – catching up versus previous years
Madrid remains strong at 5% like for like increase
Paris with sustained strong performance and increasing momentum
20
"Like for Like" Rental Growth
Strong Recovery in all markets
Barcelona
Madrid
Paris
Total Portfolio
Prime CBD Positioning that delivers
superior rental growth
4 FINANCIAL REVIEW – FIRST QUARTER 2016
Strong underlying growth in every market
+14%
+5%
+8%
+8%
BA
RC
ELO
NA
TO
TA
L
MA
DR
IDPA
RIS
4.3%5.7%
7.8%
5.4%7.2%
5.0%
(4.6%)
1.9%
14.4%
3.2%
5.5%
8.1%
2014 2015
2014 2015 1Q 16
1Q 16
0.0
500,000,000.0
1,000,000,000.0
1,500,000,000.0
2016 2017 2018 2019 2020 >2020
Other debt
Bonds France
Bonds Spain
Syndicate debt
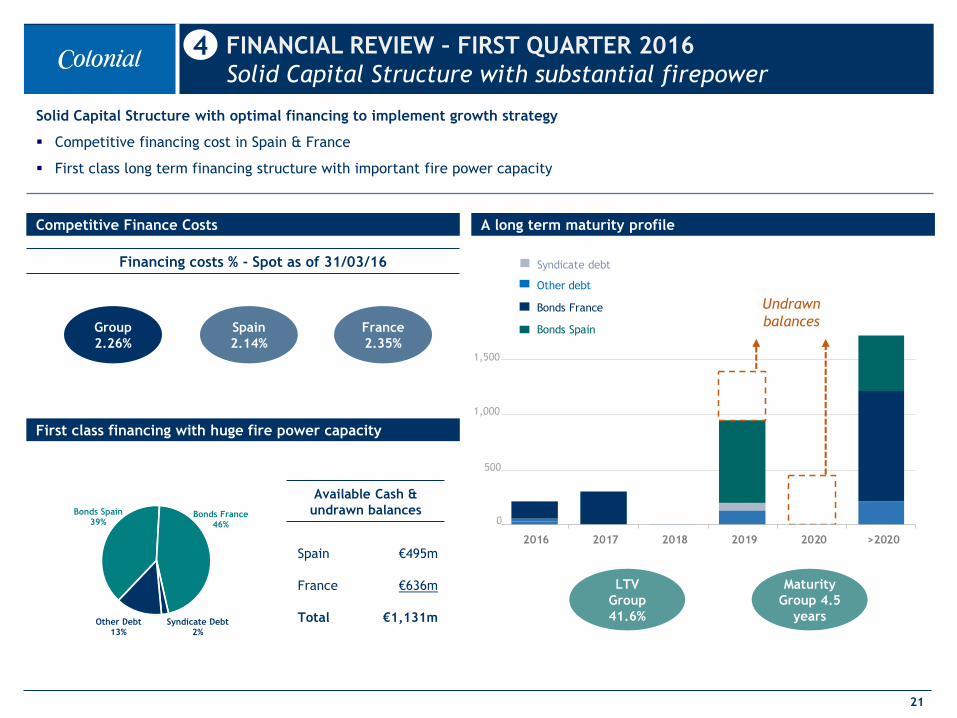
Solid Capital Structure with optimal financing to implement growth strategy
Competitive financing cost in Spain & France
First class long term financing structure with important fire power capacity
21
4 FINANCIAL REVIEW – FIRST QUARTER 2016
Solid Capital Structure with substantial firepower
Available Cash &
undrawn balances
Financing costs % - Spot as of 31/03/16
Competitive Finance Costs
Group
2.26%
Spain
2.14%
France
2.35%
First class financing with huge fire power capacity
A long term maturity profile
Spain €495m
France €636m
Total €1,131m
Undrawn
balances
0
500
1,000
1,500
Bonds Spain39%
Bonds France46%
Syndicate Debt2%
Other Debt13%
LTV
Group
41.6%
Maturity
Group 4.5
years
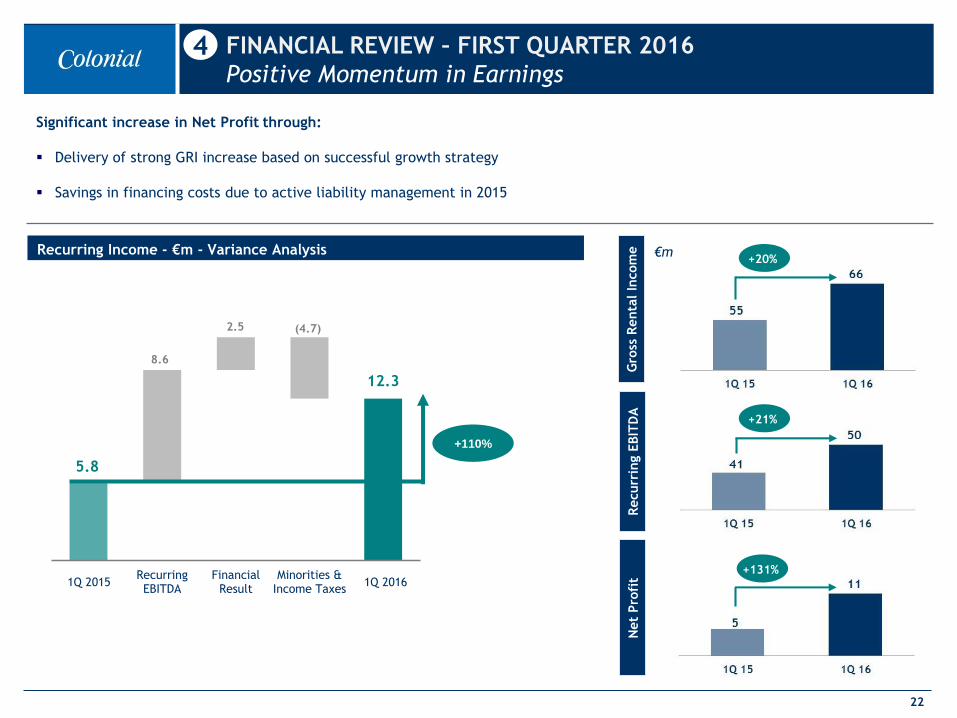
5.8
5.8
14.512.3
12.3
8.6
2.5 (4.7)
RecurringEarnings1Q 2015
RecurringEBITDA
FinancialResult
Minorities &Income Taxes
RecurringEarnings1Q 2016
1Q 2015 1Q 2016
Significant increase in Net Profit through:
Delivery of strong GRI increase based on successful growth strategy
Savings in financing costs due to active liability management in 2015
22
Recurring Income - €m - Variance Analysis
4 FINANCIAL REVIEW – FIRST QUARTER 2016
Positive Momentum in Earnings
Gro
ss R
enta
l In
com
eR
ecurr
ing E
BIT
DA
Net
Pro
fit
€m
+110%
+20%
+21%
+131%
29% 44% 45% 64%
0.63
0.68
0.710.72
0.60
0.62
0.64
0.66
0.68
0.70
0.72
0.74
0.00%
20.00%
40.00%
60.00%
80.00%
100.00%
120.00%
6/15 9/15 12/15 3/16
31-12 10-1 20-1 30-1 9-2 19-2 29-2 10-3 20-3 30-3
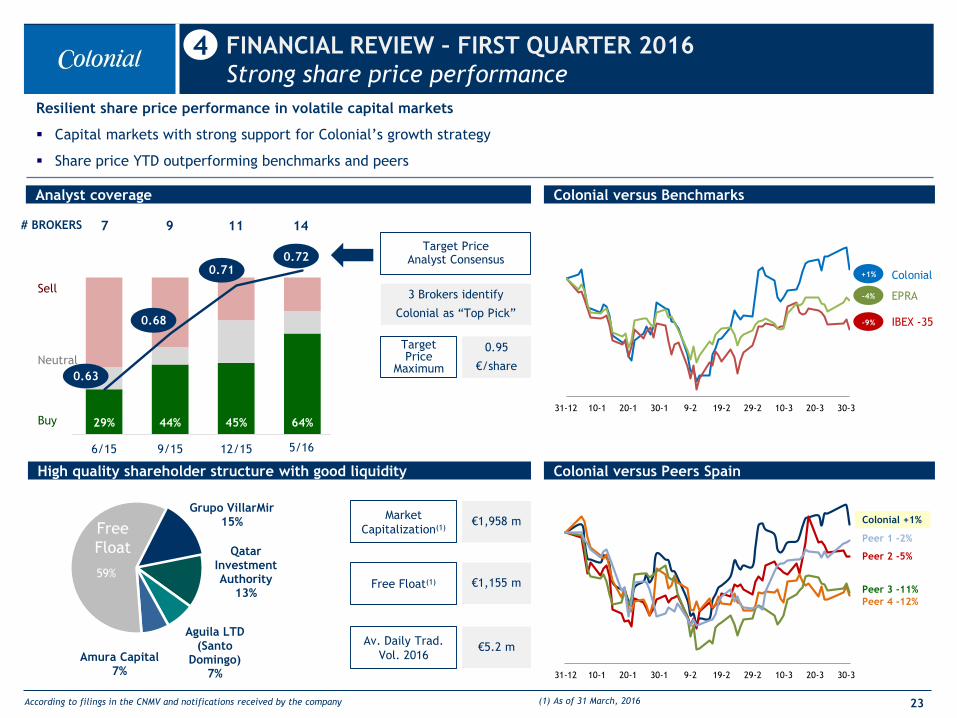
Peer 2 -5%
Colonial +1%
Peer 4 -12%
Peer 1 -2%
Peer 3 -11%
31-12-15 31-01-16 29-02-16 31-03-16
Colonial
IBEX -35-9%
EPRA
+1%
-4%
Grupo VillarMir15%
Qatar Investment Authority
13%
Aguila LTD (Santo
Domingo)7%
Amura Capital7%
59%
23
Analyst coverage Colonial versus Benchmarks
4 FINANCIAL REVIEW – FIRST QUARTER 2016
Strong share price performance
High quality shareholder structure with good liquidity
Free
Float
According to filings in the CNMV and notifications received by the company
€1,958 m
€1,155 m
Market
Capitalization(1)
Free Float(1)
€5.2 mAv. Daily Trad.
Vol. 2016
(1) As of 31 March, 2016
# BROKERS 7 9 11 14
Resilient share price performance in volatile capital markets
Capital markets with strong support for Colonial’s growth strategy
Share price YTD outperforming benchmarks and peers
Sell
Neutral
Buy
Colonial versus Peers Spain
31-12 10-1 20-1 30-1 9-2 19-2 29-2 10-3 20-3 30-3
0.63
0.68
0.710.72
Target PriceAnalyst Consensus
0.95
€/share
Target Price
Maximum
3 Brokers identify
Colonial as “Top Pick”
5/16

GROWTH DRIVERS 5
25
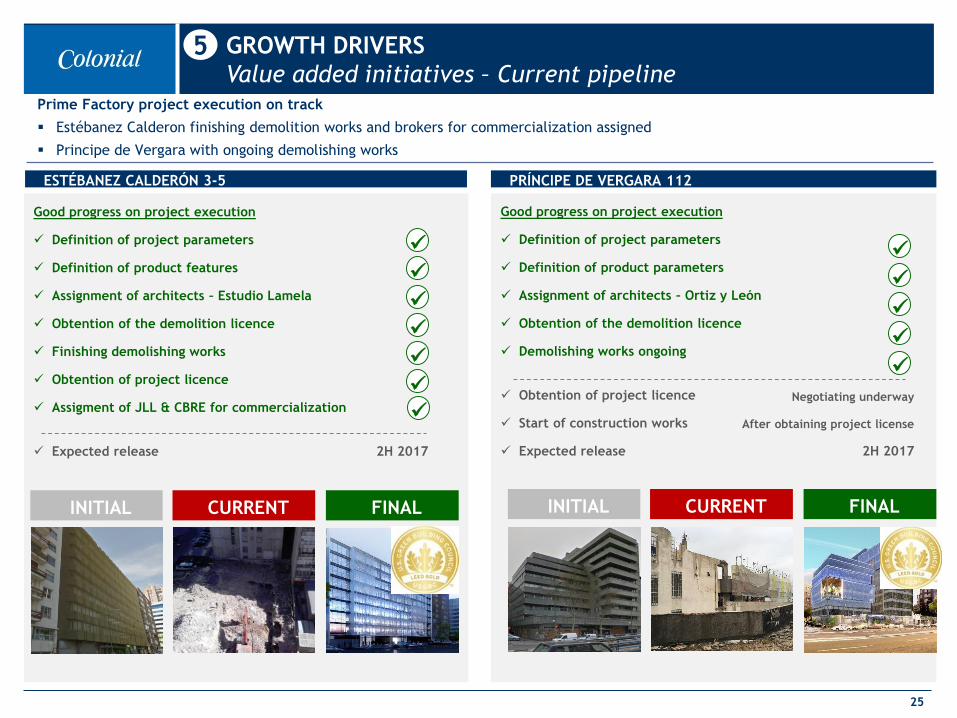
Good progress on project execution
Definition of project parameters
Definition of product features
Assignment of architects – Estudio Lamela
Obtention of the demolition licence
Finishing demolishing works
Obtention of project licence
Assigment of JLL & CBRE for commercialization
Expected release 2H 2017
5 GROWTH DRIVERS
Value added initiatives – Current pipeline
Prime Factory project execution on track
Estébanez Calderon finishing demolition works and brokers for commercialization assigned
Principe de Vergara with ongoing demolishing works
ESTÉBANEZ CALDERÓN 3-5
Good progress on project execution
Definition of project parameters
Definition of product parameters
Assignment of architects – Ortiz y León
Obtention of the demolition licence
Demolishing works ongoing
Obtention of project licence
Start of construction works
Expected release 2H 2017
PRÍNCIPE DE VERGARA 112
Negotiating underway
After obtaining project license
FINALCURRENTINITIAL FINALCURRENTINITIAL
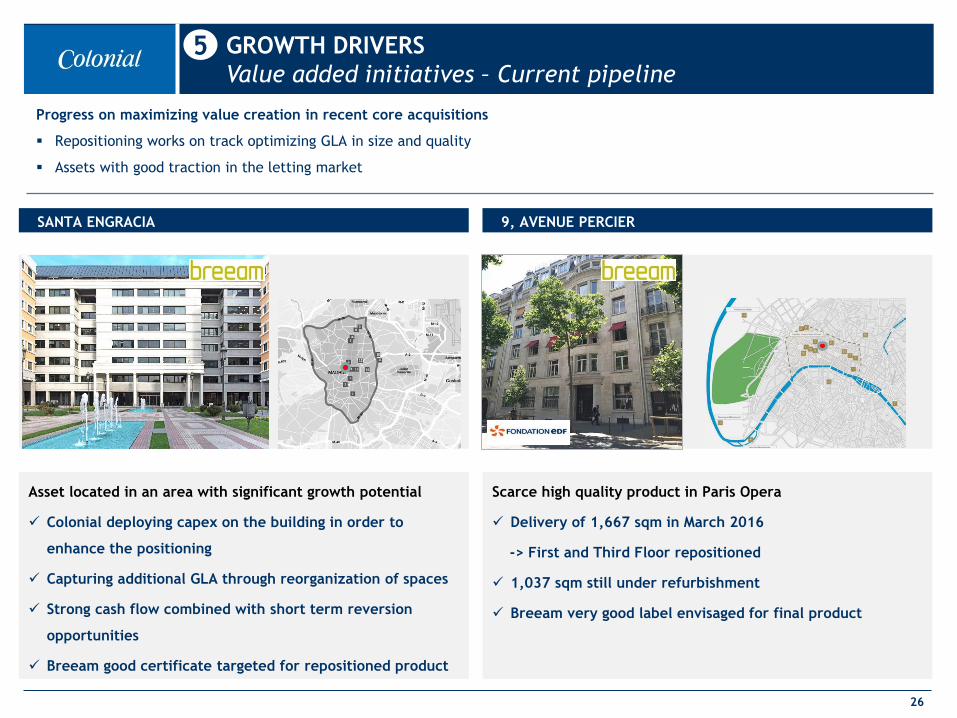
Scarce high quality product in Paris Opera
Delivery of 1,667 sqm in March 2016
-> First and Third Floor repositioned
1,037 sqm still under refurbishment
Breeam very good label envisaged for final product
Asset located in an area with significant growth potential
Colonial deploying capex on the building in order to
enhance the positioning
Capturing additional GLA through reorganization of spaces
Strong cash flow combined with short term reversion
opportunities
Breeam good certificate targeted for repositioned product
26
Progress on maximizing value creation in recent core acquisitions
Repositioning works on track optimizing GLA in size and quality
Assets with good traction in the letting market
5 GROWTH DRIVERS
Value added initiatives – Current pipeline
9, AVENUE PERCIERSANTA ENGRACIA
Pipeline
under
analysis
€400m
27
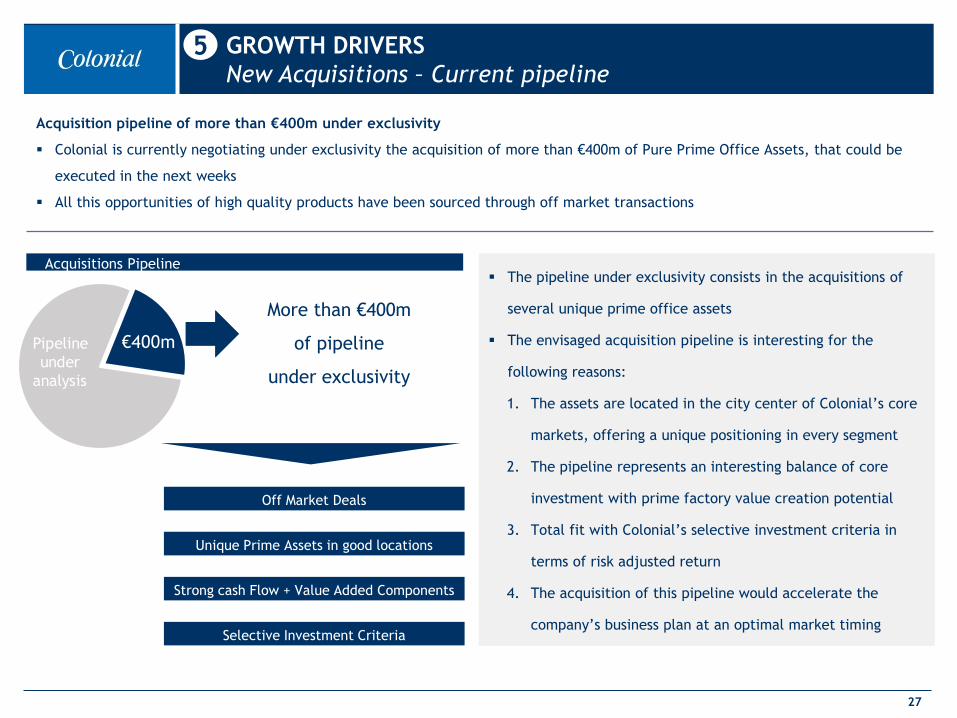
Acquisition pipeline of more than €400m under exclusivity
Colonial is currently negotiating under exclusivity the acquisition of more than €400m of Pure Prime Office Assets, that could be
executed in the next weeks
All this opportunities of high quality products have been sourced through off market transactions
5 GROWTH DRIVERS
New Acquisitions – Current pipeline
The pipeline under exclusivity consists in the acquisitions of
several unique prime office assets
The envisaged acquisition pipeline is interesting for the
following reasons:
1. The assets are located in the city center of Colonial’s core
markets, offering a unique positioning in every segment
2. The pipeline represents an interesting balance of core
investment with prime factory value creation potential
3. Total fit with Colonial’s selective investment criteria in
terms of risk adjusted return
4. The acquisition of this pipeline would accelerate the
company’s business plan at an optimal market timing
Acquisitions Pipeline
More than €400m
of pipeline
under exclusivity
Off Market Deals
Unique Prime Assets in good locations
Strong cash Flow + Value Added Components
Selective Investment Criteria
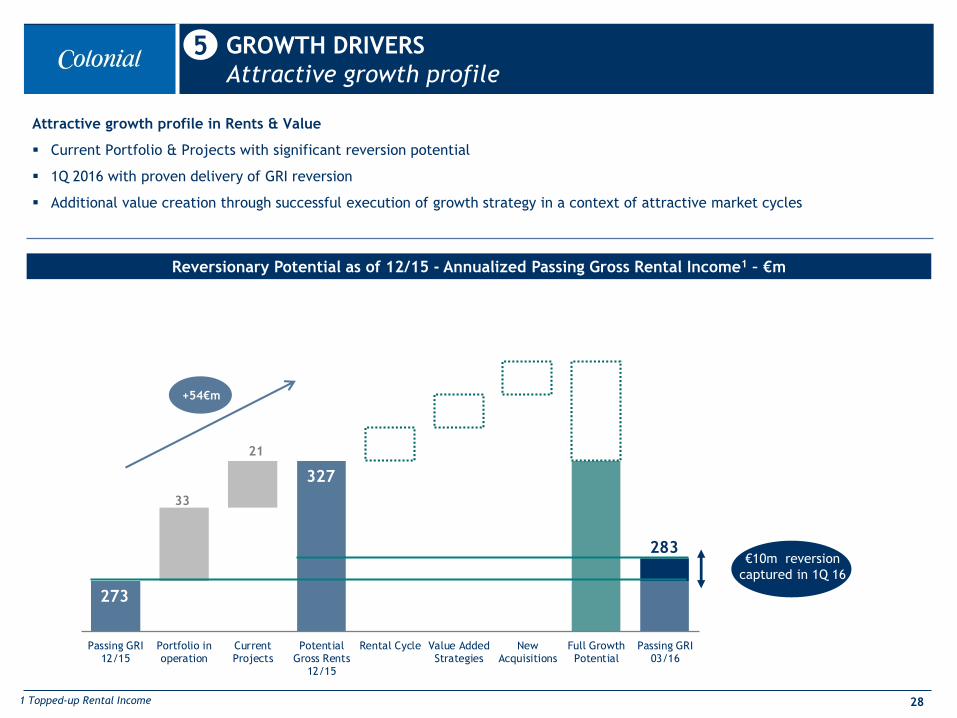
273273
306
327
283
33
21
Passing GRI12/15
Portfolio inoperation
CurrentProjects
PotentialGross Rents
12/15
Rental Cycle Value AddedStrategies
NewAcquisitions
Full GrowthPotential
Passing GRI03/16
28
Attractive growth profile in Rents & Value
Current Portfolio & Projects with significant reversion potential
1Q 2016 with proven delivery of GRI reversion
Additional value creation through successful execution of growth strategy in a context of attractive market cycles
+54€m
Reversionary Potential as of 12/15 - Annualized Passing Gross Rental Income1 – €m
5 GROWTH DRIVERS
Attractive growth profile
1 Topped-up Rental Income
€10m reversion
captured in 1Q 16
29
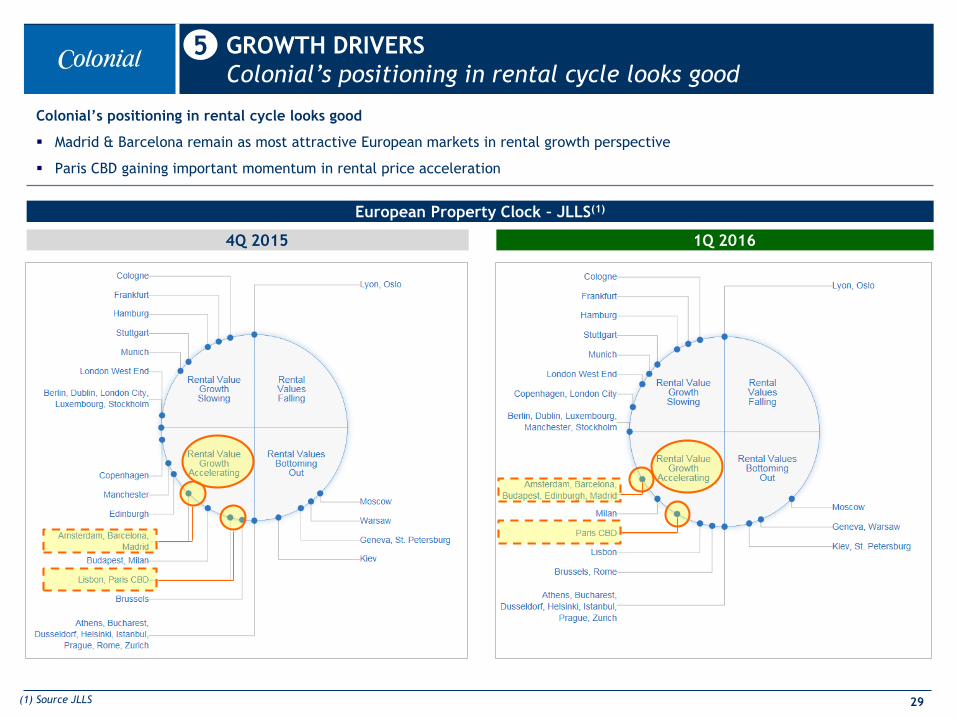
European Property Clock – JLLS(1)
5 GROWTH DRIVERS
Colonial’s positioning in rental cycle looks good
(1) Source JLLS
1Q 2016
Colonial’s positioning in rental cycle looks good
Madrid & Barcelona remain as most attractive European markets in rental growth perspective
Paris CBD gaining important momentum in rental price acceleration
4Q 2015
CONCLUSION & OUTLOOK6
31
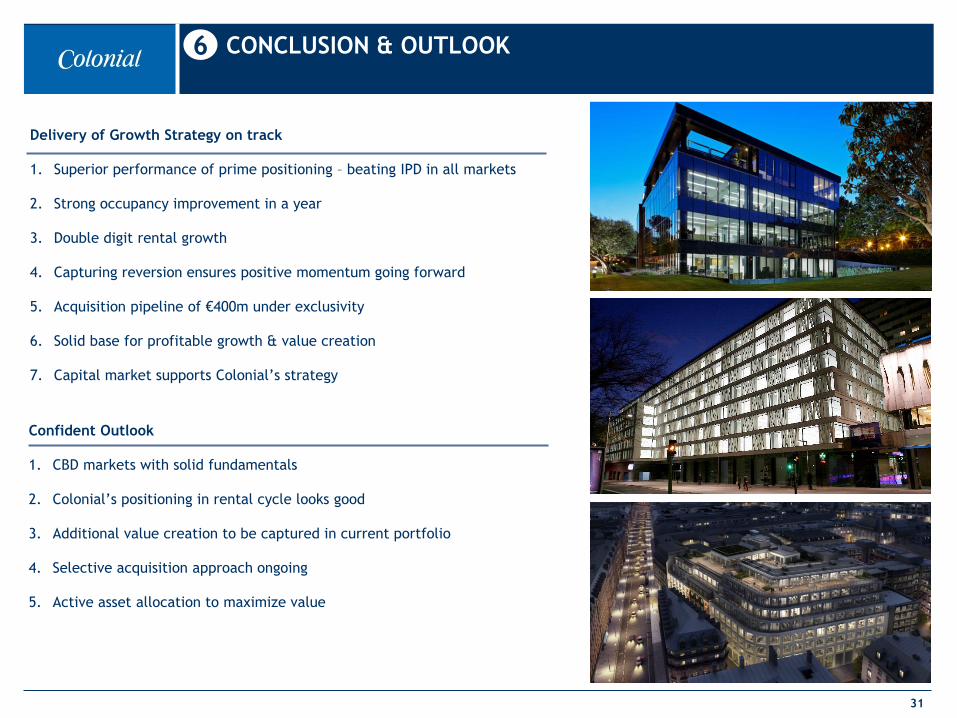
6 CONCLUSION & OUTLOOK
Delivery of Growth Strategy on track
1. Superior performance of prime positioning – beating IPD in all markets
2. Strong occupancy improvement in a year
3. Double digit rental growth
4. Capturing reversion ensures positive momentum going forward
5. Acquisition pipeline of €400m under exclusivity
6. Solid base for profitable growth & value creation
7. Capital market supports Colonial’s strategy
Confident Outlook
1. CBD markets with solid fundamentals
2. Colonial’s positioning in rental cycle looks good
3. Additional value creation to be captured in current portfolio
4. Selective acquisition approach ongoing
5. Active asset allocation to maximize value
32
6 CONCLUSION & OUTLOOK
Q & A
33
APPENDIX
Profit & Loss Account
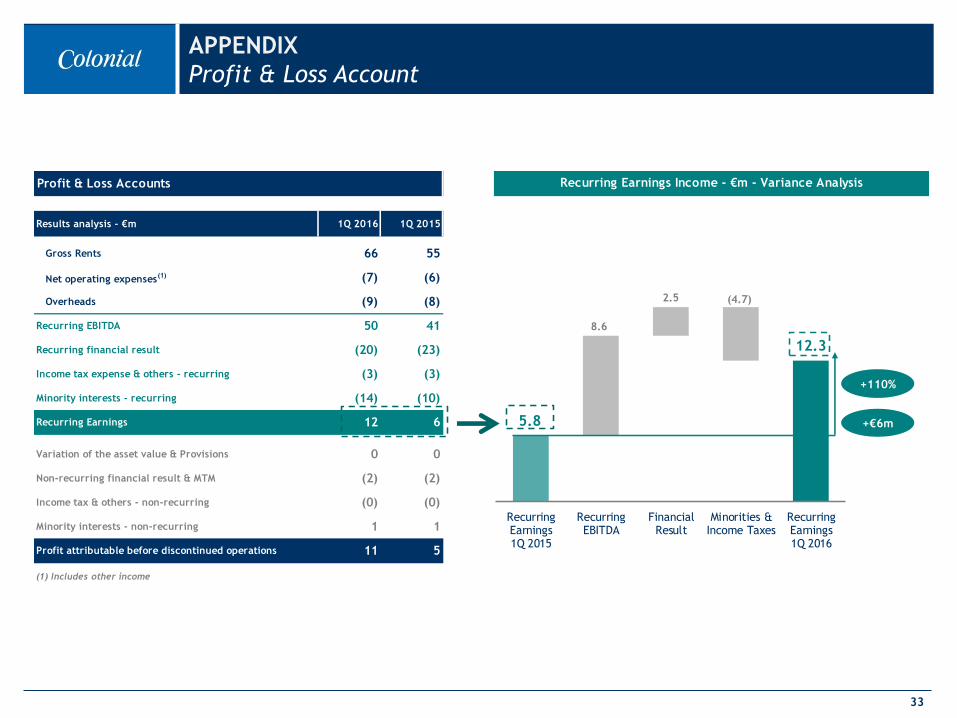
Profit & Loss Accounts
Results analysis - €m 1Q 2016 1Q 2015
Gross Rents 66 55
Net operating expenses(1) (7) (6)
Overheads (9) (8)
Recurring EBITDA 50 41
Recurring financial result (20) (23)
Income tax expense & others - recurring (3) (3)
Minority interests - recurring (14) (10)
Recurring Earnings 12 6
Variation of the asset value & Provisions 0 0
Non-recurring financial result & MTM (2) (2)
Income tax & others - non-recurring (0) (0)
Minority interests - non-recurring 1 1
Profit attributable before discontinued operations 11 5
(1) Includes other income
Recurring Earnings Income - €m - Variance Analysis
5.8
5.8
14.512.3
12.3
8.6
2.5 (4.7)
RecurringEarnings1Q 2015
RecurringEBITDA
FinancialResult
Minorities &Income Taxes
RecurringEarnings1Q 2016
+110%
+€6m
Q & A
34
Recommended