Integracion de un modelo de laconectividad de los nucleos de la base
del cerebro con informacionestructural para mejorar la deteccionde la Red Neuronal por Defecto en
IRMf alteradas con ruido pormovimiento
Aura Marıa Forero Pachon
Universidad Nacional de Colombia
Facultad de Medicina
Bogota, Colombia
2017

Integration of a connectivity model ofthe basal ganglia nuclei with
structural information in order toenhance the default mode networkdetection in rs-fMRI corrupted by
movement
Aura Marıa Forero Pachon
Tesis presentada como requisito parcial para optar al tıtulo de:
Magister en Ingenierıa Biomedica
Director:
Ph.D., Doctor. Eduardo Romero
Lınea de Investigacion:
Imagenes Medicas
Grupo de Investigacion:
Computer Imaging and Medical Applications Laboratory(Cimalab)
Universidad Nacional de Colombia
Facultad de Medicina
Bogota, Colombia
2017

To family and friends who have accompanied
and encourage me with love, patience and
affection.
Acknowledgment
This work was possible thanks to professor Eduardo Romero leader of CIMALAB research
group, director of the Biomedical Engineering Master Program and of the Telemedicine cen-
ter at Universidad Nacional de Colombia. He was the advisor of this work and without his
guidance, advices, support and motivation it would not be possible.
Another special acknowledgment is for Norberto Malpica and Eva Manzanedo from LAIM-
BIO at Universidad Rey Juan Carlos III, Spain, who gave very friendly assistance taking and
sharing the images from the 14 people used in this study as well as the initial orientations
at the beginning of this project.
vi
Abstract
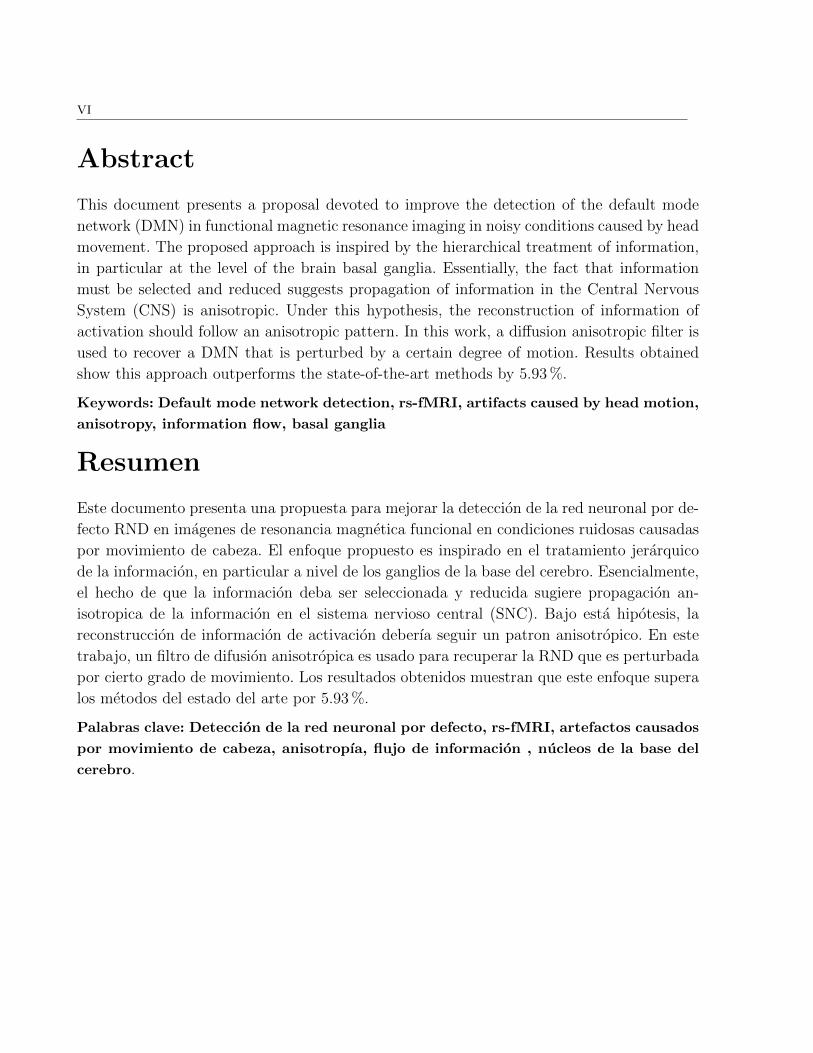
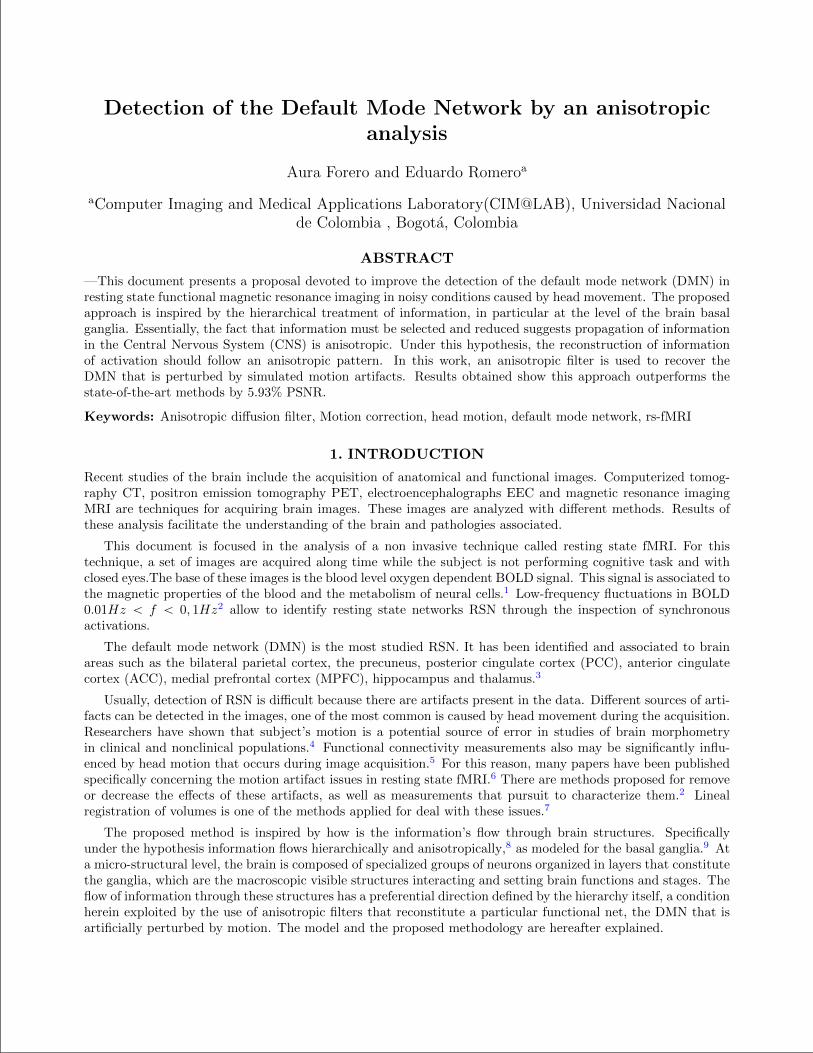
This document presents a proposal devoted to improve the detection of the default mode
network (DMN) in functional magnetic resonance imaging in noisy conditions caused by head
movement. The proposed approach is inspired by the hierarchical treatment of information,
in particular at the level of the brain basal ganglia. Essentially, the fact that information
must be selected and reduced suggests propagation of information in the Central Nervous
System (CNS) is anisotropic. Under this hypothesis, the reconstruction of information of
activation should follow an anisotropic pattern. In this work, a diffusion anisotropic filter is
used to recover a DMN that is perturbed by a certain degree of motion. Results obtained
show this approach outperforms the state-of-the-art methods by 5.93 %.
Keywords: Default mode network detection, rs-fMRI, artifacts caused by head motion,
anisotropy, information flow, basal ganglia
Resumen
Este documento presenta una propuesta para mejorar la deteccion de la red neuronal por de-
fecto RND en imagenes de resonancia magnetica funcional en condiciones ruidosas causadas
por movimiento de cabeza. El enfoque propuesto es inspirado en el tratamiento jerarquico
de la informacion, en particular a nivel de los ganglios de la base del cerebro. Esencialmente,
el hecho de que la informacion deba ser seleccionada y reducida sugiere propagacion an-
isotropica de la informacion en el sistema nervioso central (SNC). Bajo esta hipotesis, la
reconstruccion de informacion de activacion deberıa seguir un patron anisotropico. En este
trabajo, un filtro de difusion anisotropica es usado para recuperar la RND que es perturbada
por cierto grado de movimiento. Los resultados obtenidos muestran que este enfoque supera
los metodos del estado del arte por 5.93 %.
Palabras clave: Deteccion de la red neuronal por defecto, rs-fMRI, artefactos causados
por movimiento de cabeza, anisotropıa, flujo de informacion , nucleos de la base del
cerebro.
Figure List
1-1. Resting State Networks . . . . . . . . . . . . . . . . . . . . . . . . . . . . . . 3
1-2. Default Mode Network. . . . . . . . . . . . . . . . . . . . . . . . . . . . . . . 4
1-3. Diagram representative of column neocortex. . . . . . . . . . . . . . . . . . 6
1-4. Head motion . . . . . . . . . . . . . . . . . . . . . . . . . . . . . . . . . . . . 8
2-1. Basal Ganglia. . . . . . . . . . . . . . . . . . . . . . . . . . . . . . . . . . . . 12
2-2. Histology of the basal ganglia. . . . . . . . . . . . . . . . . . . . . . . . . . . 13
2-3. Information’s flow in the Basal Ganglia. . . . . . . . . . . . . . . . . . . . . 13
2-4. Pipeline followed for the experimentation . . . . . . . . . . . . . . . . . . . . 16
2-5. Values of Motion added artificially . . . . . . . . . . . . . . . . . . . . . . . 17
2-6. Probabilistic Template of the DMN . . . . . . . . . . . . . . . . . . . . . . . 20
2-7. Baseline: DMN obtained without noise . . . . . . . . . . . . . . . . . . . . . 21
2-8. DMN obtained after applying the standard method for motion correction . . 21
2-9. DMN obtained after applying the anisotropic proposed method for motion
correction . . . . . . . . . . . . . . . . . . . . . . . . . . . . . . . . . . . . . 21
2-10.PSNR Results . . . . . . . . . . . . . . . . . . . . . . . . . . . . . . . . . . . 22


Table list
1-1. Motion in fMRI. . . . . . . . . . . . . . . . . . . . . . . . . . . . . . . . . . . 8
2-1. Experimentation . . . . . . . . . . . . . . . . . . . . . . . . . . . . . . . . . 19
2-2. Mean of PSNR for the applied methods . . . . . . . . . . . . . . . . . . . . . 23
2-3. Percentage of performance . . . . . . . . . . . . . . . . . . . . . . . . . . . . 23
Index
Acknowledgements V
Abstract VI
Figure List VII
Table list IX
List of Symbols and abbreviations XII
1. Introduction 1
1.1. Resting State Networks -RSN- . . . . . . . . . . . . . . . . . . . . . . . . . . 1
1.2. Default Mode Network -DMN- . . . . . . . . . . . . . . . . . . . . . . . . . . 2
1.2.1. Functional analysis of regions of the DMN . . . . . . . . . . . . . . . 3
1.2.2. Micro-structure of the regions of the DMN . . . . . . . . . . . . . . . 5
1.3. Functional Magnetic Resonance Imaging -fMRI- . . . . . . . . . . . . . . . . 5
1.4. Artifacts in fMRI . . . . . . . . . . . . . . . . . . . . . . . . . . . . . . . . . 7
1.5. Document organization . . . . . . . . . . . . . . . . . . . . . . . . . . . . . . 10
2. Method for detection of the Default Mode Network using Anisotropic Analysis
of Functional Data 11
2.1. Introduction . . . . . . . . . . . . . . . . . . . . . . . . . . . . . . . . . . . . 11
2.1.1. Basal Ganglia . . . . . . . . . . . . . . . . . . . . . . . . . . . . . . . 12
2.1.2. Anisotropy . . . . . . . . . . . . . . . . . . . . . . . . . . . . . . . . . 14
2.2. Methodology . . . . . . . . . . . . . . . . . . . . . . . . . . . . . . . . . . . 15
2.2.1. Noise addition . . . . . . . . . . . . . . . . . . . . . . . . . . . . . . . 16
2.2.2. Preprocessing . . . . . . . . . . . . . . . . . . . . . . . . . . . . . . . 16
2.2.3. Motion Correction . . . . . . . . . . . . . . . . . . . . . . . . . . . . 17
2.2.4. Processing . . . . . . . . . . . . . . . . . . . . . . . . . . . . . . . . . 18
2.2.5. Datasets and experimental setup . . . . . . . . . . . . . . . . . . . . 20
2.3. Results . . . . . . . . . . . . . . . . . . . . . . . . . . . . . . . . . . . . . . . 20
2.3.1. Performance Analysis . . . . . . . . . . . . . . . . . . . . . . . . . . . 22
3. Discussion, Conclusions and Future Work 24
3.1. Discussion . . . . . . . . . . . . . . . . . . . . . . . . . . . . . . . . . . . . . 24
Index xi
3.2. Conclusion . . . . . . . . . . . . . . . . . . . . . . . . . . . . . . . . . . . . . 24
3.3. Future Work . . . . . . . . . . . . . . . . . . . . . . . . . . . . . . . . . . . . 25
A. Appendix 1: Presented Article 26
Bibliography 35
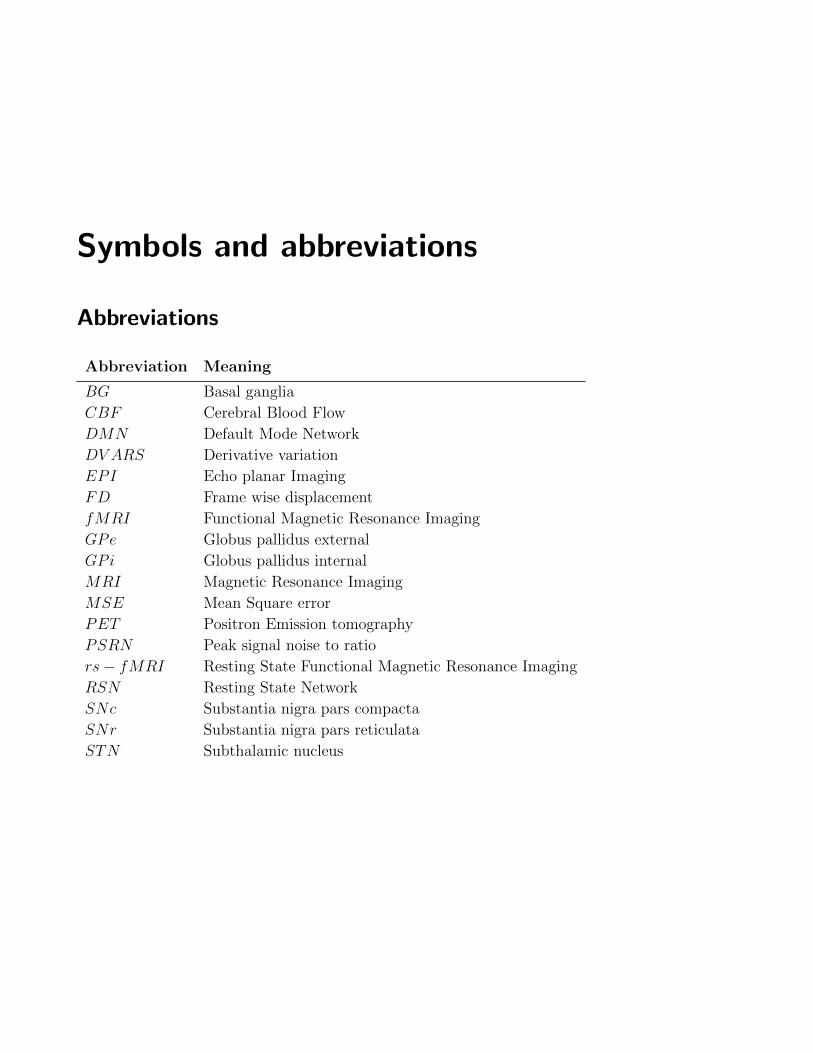
Symbols and abbreviations
Abbreviations
Abbreviation Meaning
BG Basal ganglia
CBF Cerebral Blood Flow
DMN Default Mode Network
DV ARS Derivative variation
EPI Echo planar Imaging
FD Frame wise displacement
fMRI Functional Magnetic Resonance Imaging
GPe Globus pallidus external
GPi Globus pallidus internal
MRI Magnetic Resonance Imaging
MSE Mean Square error
PET Positron Emission tomography
PSRN Peak signal noise to ratio
rs− fMRI Resting State Functional Magnetic Resonance Imaging
RSN Resting State Network
SNc Substantia nigra pars compacta
SNr Substantia nigra pars reticulata
STN Subthalamic nucleus
1. Introduction
Recent studies of the brain have became non invasive, and they allow to study not only the
structure of the brain but also its functionality through images. Medical Imaging, such as,
computerized tomography CT, positron emission tomography PET, electroencephalographs
EEC and also functional magnetic resonance imaging fMRI are techniques currently used
by researchers to get and analyze data that facilitate the understanding of the brain and
pathologies associated with it. However, these techniques present some issues such as noi-
se, artifacts and limitations for the analysis of the data. This document is focused on the
technique of resting state functional magnetic resonance imaging (rs-fMRI), and presents a
methodology that is bio-inspired in the directional and hierarchical flow of the information
trough the structures of neural tissue. This methodology is proposed for the restoration of
the information of activation of the DMN and detect it in rs-fMRI with artifacts caused by
head movement.
The proposed method is inspired by how is the information’s flow through brain structures.
Specifically under the hypothesis information is hierarchically reconstructed from the bottom
to the top, as described for the basal ganglia models [1]. At a micro-structural level, the brain
is composed of specialized groups of neurons organized in layers that constitute the ganglia,
which are the macroscopic visible structures interacting and setting brain functions and
stages. The flow of information through these structures has a preferential direction defined
by the hierarchy itself, a condition herein exploited by the use of anisotropic filters that
reconstitute a particular functional net, the DMN that is artificially perturbed by motion.
The model and the proposed methodology are hereafter explained.
1.1. Resting State Networks -RSN-
Cognitive studies tested evoked potentials, also called evoked response, refers to the electro
physiologic activity or response of the brain to a variety of sensory stimulus of specific sen-
sory nerve pathways[2]. Studies of evoked potentials were important for the understanding
of brain functionality, using an electroencephalograph EEG the signal represent summed
activity within a specific area of cortex that creates a current flow. In 1929 the inventor
of the EEG, Hans Berger, recorded regular and low frequency cerebral fluctuations using
EEG when people was at resting, it indicated that the brain was active even in resting state
[3]. However, these measurements were considered as uninformative noise and not worthy of
2 1 Introduction
investigation. Decades after, similar fluctuations were identified at resting by using neuro-
imaging techniques and the attention on the importance and utility of these fluctuations at
resting state increased. These flutuations also were present in specific regions on the brain
which have specific functions. All this was interpreted as potential biomarkers for unders-
tanding pathologies or brain abnormalities.
Resting state functional magnetic resonance imaging (rs-fMRI) consists of the acquisition of
fMRI data while the person is resting with closed eyes. Typical resting experiments are of
the order of 5-10min. These studies are focused on spontaneous low frequency fluctuations
(0,01Hz < f < 0, 1Hz) in the blood oxygenation level dependent (BOLD) signal. Rs-fMRI
allows to identify RSN through the inspection of synchronous activations between regions
that are spatially distinct, occurring in the absence of a task or stimulus. The low-frequency
fluctuations in BOLD have shown to be temporally correlated within spatially distinct but
functionally related RSN.
Researchers apply several methods to analyze resting state data and to identify correlations
of activation among the voxels. Consistent regions of the brain have been found active during
rest, and also it has been identified that these activations decreased when cognitive tasks
were performed. The most common method is independent component analysis ICA, but
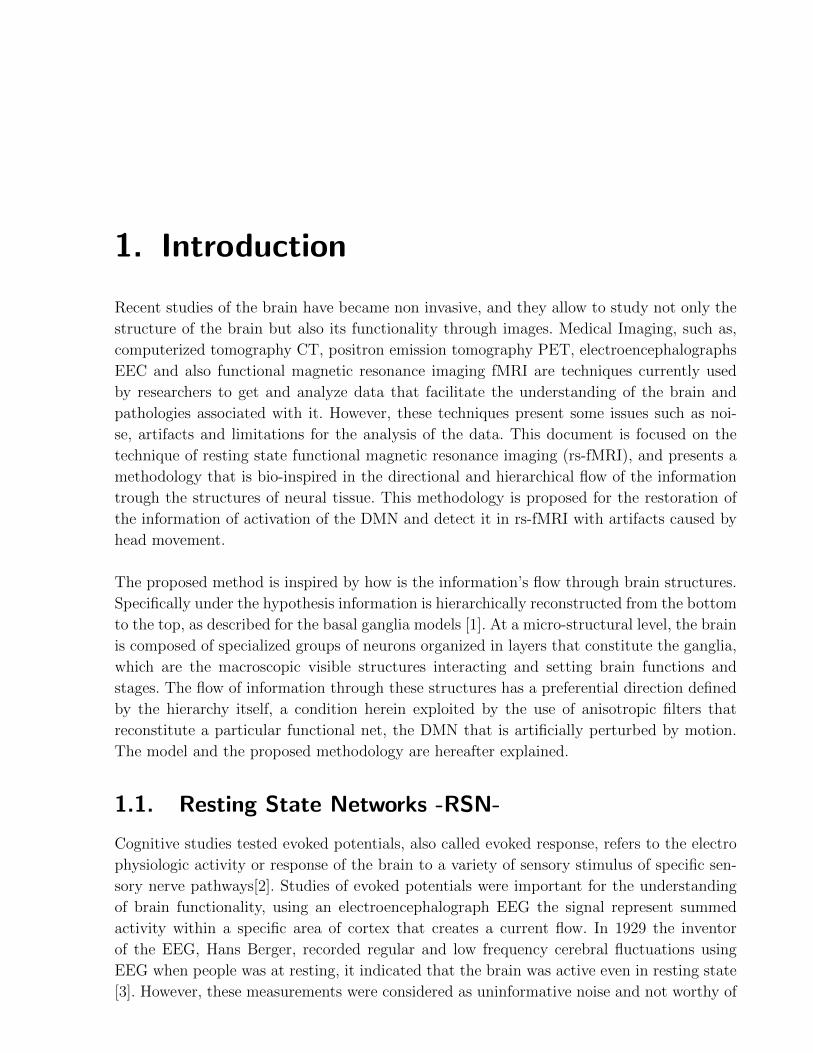
seed voxel analysis is also widely used. Using these methods, have been reported different
RSN, in Figure 1-1 are shown some of the RSN identified during researches.
Several resting state networks RSN have been identified, i.e: default mode network, somato-
motor network, visual network, language network, dorsal attention network, ventral attention
networks fronto control network, auditory network, cingulo opercular network.[5]. The net-
work that has been widely identified and also the most studied network is the default mode
network DMN.
Clinical uses of RSN is at an early stage of developments and are still under study. Especially
the DMN has shown promising results to be used in clinical applications such as prognosis,
diagnosis and control of neurological and psychiatric diseases [6].
1.2. Default Mode Network -DMN-
Rs-fMRI studies have shown evidence of resting state networks (RSN), the most known of
these networks is called default mode network (DMN) it refers to a group of interconnected
brain structures that are hypothesized to be part of a functional system activated when the
person is awake but not involved in any specific mental exercise. There is not yet a complete
consensus on which brain regions should be included in a definition of the DMN, but it is
usually identified in the posterior cingulate cortex (PCC) and anterior medial prefrontal cor-
1.2 Default Mode Network -DMN- 3
Figure 1-1.: Resting State Networks
reported by Smith et al, 2009.[4].
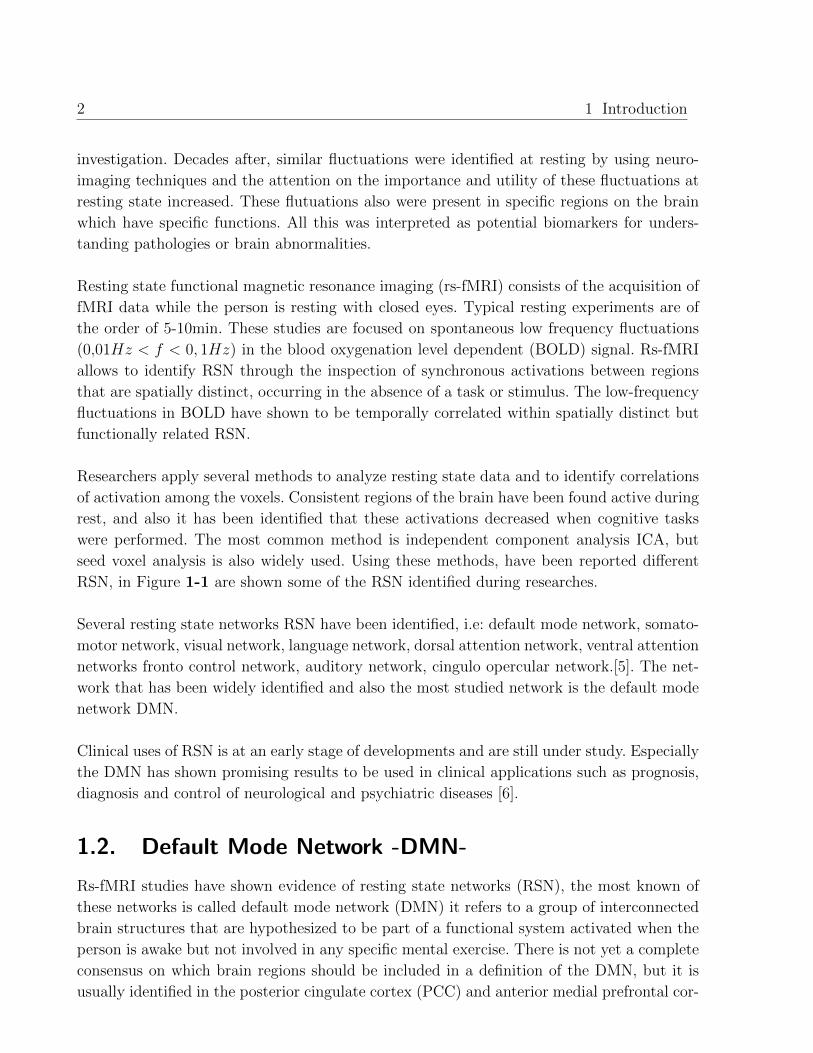
tex (mPFC). The DMN also has been associated to other structures that may be considered
part of this network, they are the precuneus,the bilateral parietal cortex, anterior cingula-
te cortex (ACC), hippocampus and thalamus. In FIGURE.1-2 is shown a template of the
DMN developed by Wang et al, and used to compare the components when an independent
component analysis ICA is perform.
Researchers identified that the DMN remains active during episodic and autobiographi-
cal memory retrieval, but its activity decreases during the performance of cognitive tasks
that demand attention to external stimuli. Other studies have reported alterations on the
DMN activation when the acquisition was done in people in special states; such as deficit
of consciousness[8][9], or with pathologies i.e Alzheimer’s disease (AD) [10], Migraine, schi-
zophrenia. For this reason the DMN have been proposed and studied as biomarker for those
pathologies.
1.2.1. Functional analysis of regions of the DMN
The DMN is identified by using different techniques such as PET and rs-fMRI. It is identified
as a group of interconnected brain structures. These structures are apparently are part of
4 1 Introduction
Figure 1-2.: Default Mode Network.
Regions were reported by Bruckner et al, 2008 [7].
a functional system activated when people are not involved in any mental activity. Some of
the structures related to the DMN are introduced hereinafter.
The posterior cingulate cortex (PCC) lies behind the anterior cingulate and is
active during the recall of autobiographical memories it is also activated by emotional
stimuli.
The medial prefrontal cortex (mPFC) is composed of granular cortical areas and
agranular regions which encompasses the anterior cingulate cortex infralimbic cortex,
and prelimbic cortex.
The prefrontal cortex is highly interconnected with much of the brain, including
extensive connections with other cortical, subcortical and brain stem sites. The pre-
frontal cortex also receives inputs from the brainstem arousal systems, and its function
is particularly dependent on its neurochemical environment.
The precuneus is located on the medial surface of the cerebral hemisphere, functio-
nally it is hypothesized to be involved in a variety of functions, ranging from memory
to consciousness.
The thalamus has a major role as a gatekeeper for information on its way to the
cortex, making sure that the information gets sent to the right place, it relays between
sensory and motor systems and the cerebral cortex. It is also involved in consciousness
and arousal.
The hippocampus is a structure in the temporal lobe which plays an important role
in memory consolidation.
1.3 Functional Magnetic Resonance Imaging -fMRI- 5
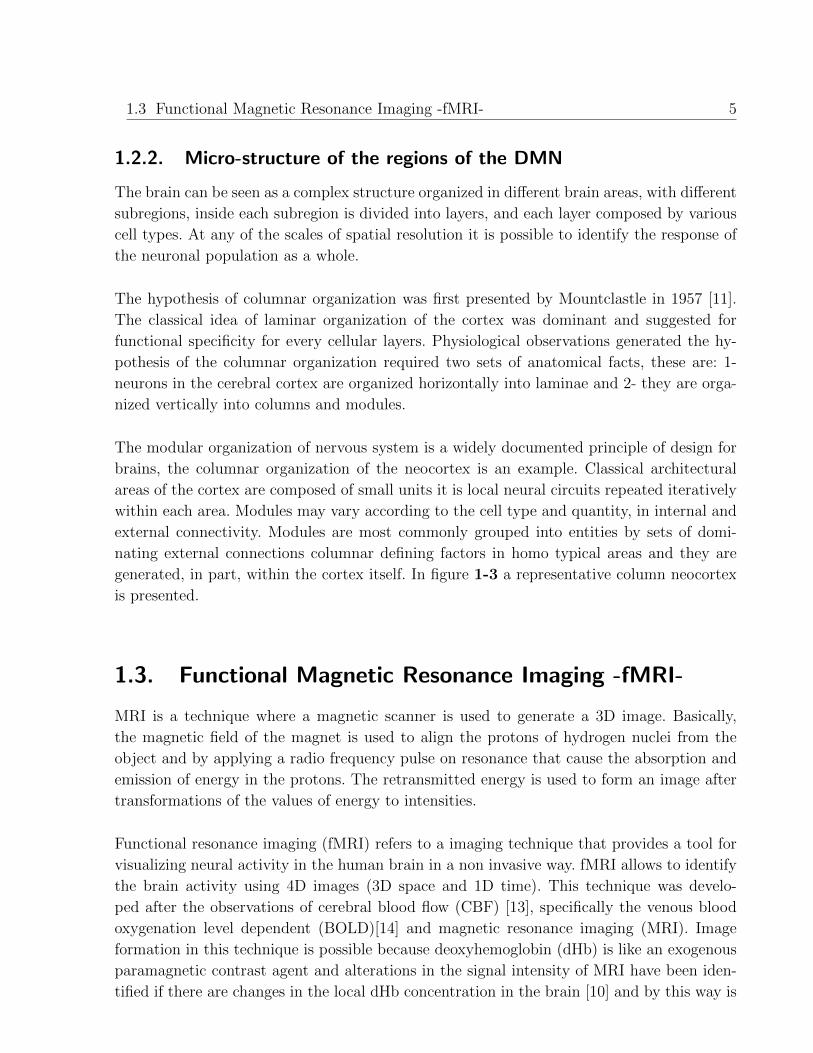
1.2.2. Micro-structure of the regions of the DMN
The brain can be seen as a complex structure organized in different brain areas, with different
subregions, inside each subregion is divided into layers, and each layer composed by various
cell types. At any of the scales of spatial resolution it is possible to identify the response of
the neuronal population as a whole.
The hypothesis of columnar organization was first presented by Mountclastle in 1957 [11].
The classical idea of laminar organization of the cortex was dominant and suggested for
functional specificity for every cellular layers. Physiological observations generated the hy-
pothesis of the columnar organization required two sets of anatomical facts, these are: 1-
neurons in the cerebral cortex are organized horizontally into laminae and 2- they are orga-
nized vertically into columns and modules.
The modular organization of nervous system is a widely documented principle of design for
brains, the columnar organization of the neocortex is an example. Classical architectural
areas of the cortex are composed of small units it is local neural circuits repeated iteratively
within each area. Modules may vary according to the cell type and quantity, in internal and
external connectivity. Modules are most commonly grouped into entities by sets of domi-
nating external connections columnar defining factors in homo typical areas and they are
generated, in part, within the cortex itself. In figure 1-3 a representative column neocortex
is presented.
1.3. Functional Magnetic Resonance Imaging -fMRI-
MRI is a technique where a magnetic scanner is used to generate a 3D image. Basically,
the magnetic field of the magnet is used to align the protons of hydrogen nuclei from the
object and by applying a radio frequency pulse on resonance that cause the absorption and
emission of energy in the protons. The retransmitted energy is used to form an image after
transformations of the values of energy to intensities.
Functional resonance imaging (fMRI) refers to a imaging technique that provides a tool for
visualizing neural activity in the human brain in a non invasive way. fMRI allows to identify
the brain activity using 4D images (3D space and 1D time). This technique was develo-
ped after the observations of cerebral blood flow (CBF) [13], specifically the venous blood
oxygenation level dependent (BOLD)[14] and magnetic resonance imaging (MRI). Image
formation in this technique is possible because deoxyhemoglobin (dHb) is like an exogenous
paramagnetic contrast agent and alterations in the signal intensity of MRI have been iden-
tified if there are changes in the local dHb concentration in the brain [10] and by this way is
6 1 Introduction
Figure 1-3.: Diagram representative of column neocortex.
Image source: [12].
possible to map brain functions. BOLD does not measure neuronal activity directly, it mea-
sures the metabolic demand of active neurons. in other words, BOLD induces changes in the
local magnetic susceptibility and these can be measured by Gradient Echo-Planar-Imaging
(EPI).
The fundamental unit of a 3D image is called voxel (volume element). Each voxel represents
a spatial intensity associated to a location. Taking into account the size of a neuron, a voxel
of 1x1x1 mm could represent the activation signal of a population of almost 100.000 neu-
rons. Because of this, the voxel size determines the resolution of the image (the smaller size
corresponds to a higher resolution of the image). Voxels in the same plane represent a slice.
The 3D image is composed by several slices along an axis, these slices are grouped in order
to form a volume.
In fMRI, volumes are captured several times, they and the values of BOLD are projected
along time. The temporal resolution is limited by the haemodynamic response to a few se-
conds. In fMRI, voxels of a volume contain the BOLD signal value at an instant in the time.
When a study in fMRI is done, an anatomical volume of MRI is taken using the T1 and T2
signal. Moreover, several volumes of T2* are taken along time.
This is because while MRI allows high spatial resolution, fMRI allows a good temporal re-
solution but low spatial resolution. So, the anatomical volume MRI is used to analyze the
anatomy and structure of the brain and fMRI is focused on understanding neural activity
1.4 Artifacts in fMRI 7
through visualization of metabolic process in maps of activation.
A functional map or map of activation is generated from fMRI dataset when the signal
intensities of images obtained during control and stimulation periods are compared on a
voxel-by-voxel basis [10]. Active voxels are those that pass a statistical threshold based on
correlation, they are color-coded based on statistical values (i.e. t-values). Then, the functio-
nal map formed by this voxels is overlaid on an anatomical image to enhance the visualization.
Researchers and specialists have used fMRI to investigate and visualize brain functions in-
cluding memory, vision, motor, language and cognition. For these studies, images acquisition
is done during repeated control and stimulation periods. Studies in resting state have been
also applied [15], it is known as rs-fMRI, and consists in data acquisitions while the people
is resting quietly with their eyes closed.
1.4. Artifacts in fMRI
In fMRI have been detected and reported artifacts [16]. The artifacts are basically descri-
bed as an inaccurate effect or unwanted events observed in a scientific investigation or from
experimental error. They are not naturally present but occur during the acquisition of the
image and cause signal loss or added noise to the resulting image. There are different types
of artifacts in fMRI and they are caused by different sources. For example, artifacts can
be result of a malfunction in the hardware or software of the scanner or another device.
They can also be a consequence of environmental influences as heat, chemical or humidity.
The body of the scanned person can cause artifacts, too. Although there are many kind
of artifacts caused by the physiology, and specifically by voluntary movement such as head
movement, or involuntary i.e. respiration and cardiac activity. This work has been focused
on the treatment of images with artifacts caused by head movement, basically because it
posses significant challenges for the analysis of data acquires from children, older adults and
patients with dementia[5].
Artifacts caused by head movement correspond to alterations of the signals captured during
the acquisition when the person moves his or her head, this is problematic for several reasons:
1) Activation caused by head motion can be correlated with activation due to processing
in response to an experimental condition. 2) Head motion increases residuals, resulting in
weaker statistical effects. 3) Head motion causes changes intensity of activation at the voxel
level. [17]. In clinical fMRI, the major contribution to signal artifacts comes from bulk
head motion during the functional data series. Physiological brain motion driven by cardiac
pulsations also is a minor contribution. Thus, the main reason for most failed clinical fMRI
examinations is motion. For example, the presence of head motion artifacts was the most
8 1 Introduction
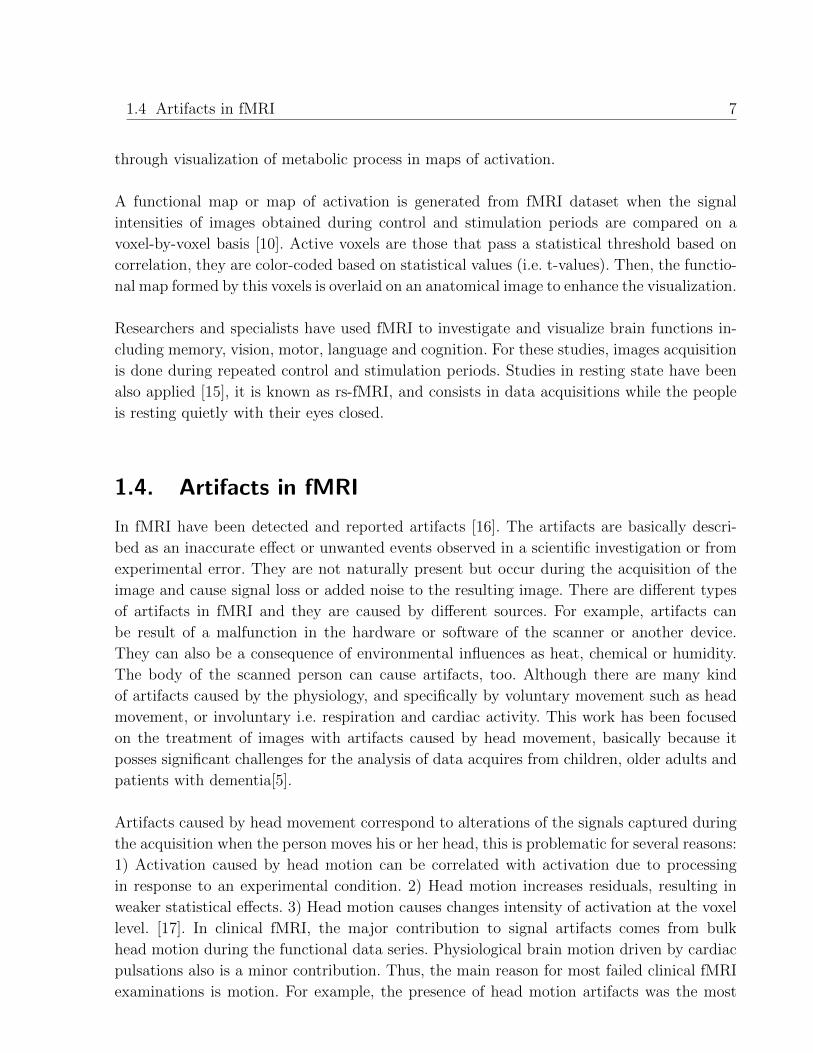
Table 1-1.: Motion in fMRI.
Adapted from [17]
Description Time scaleEffects on the acquired image
and the functional map
Intra-
image
Fast and
sudden motion
Smaller than
the image
acquisition
time scale
Blurring and ghosting.
Changing the contrast in the images
Inter-
imageslow movement
Between a
couple of
seconds
and minutes.
Leads misregistration of the
images within the time series,
and makes activation foci
undetectable or induces artefactual
activation when it is temporally
correlated to the stimulus.
frequent cause for the failure in the study of Krings et al [18].
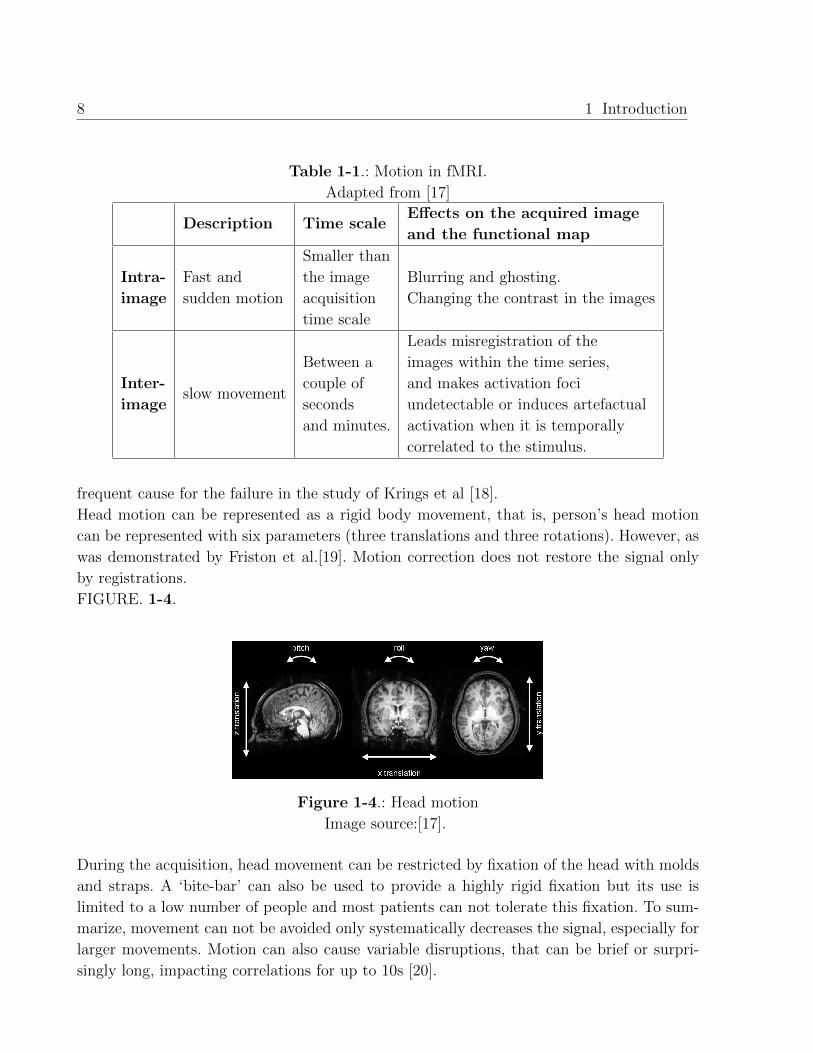
Head motion can be represented as a rigid body movement, that is, person’s head motion
can be represented with six parameters (three translations and three rotations). However, as
was demonstrated by Friston et al.[19]. Motion correction does not restore the signal only
by registrations.
FIGURE. 1-4.
Figure 1-4.: Head motion
Image source:[17].
During the acquisition, head movement can be restricted by fixation of the head with molds
and straps. A ‘bite-bar’ can also be used to provide a highly rigid fixation but its use is
limited to a low number of people and most patients can not tolerate this fixation. To sum-
marize, movement can not be avoided only systematically decreases the signal, especially for
larger movements. Motion can also cause variable disruptions, that can be brief or surpri-
singly long, impacting correlations for up to 10s [20].
1.4 Artifacts in fMRI 9
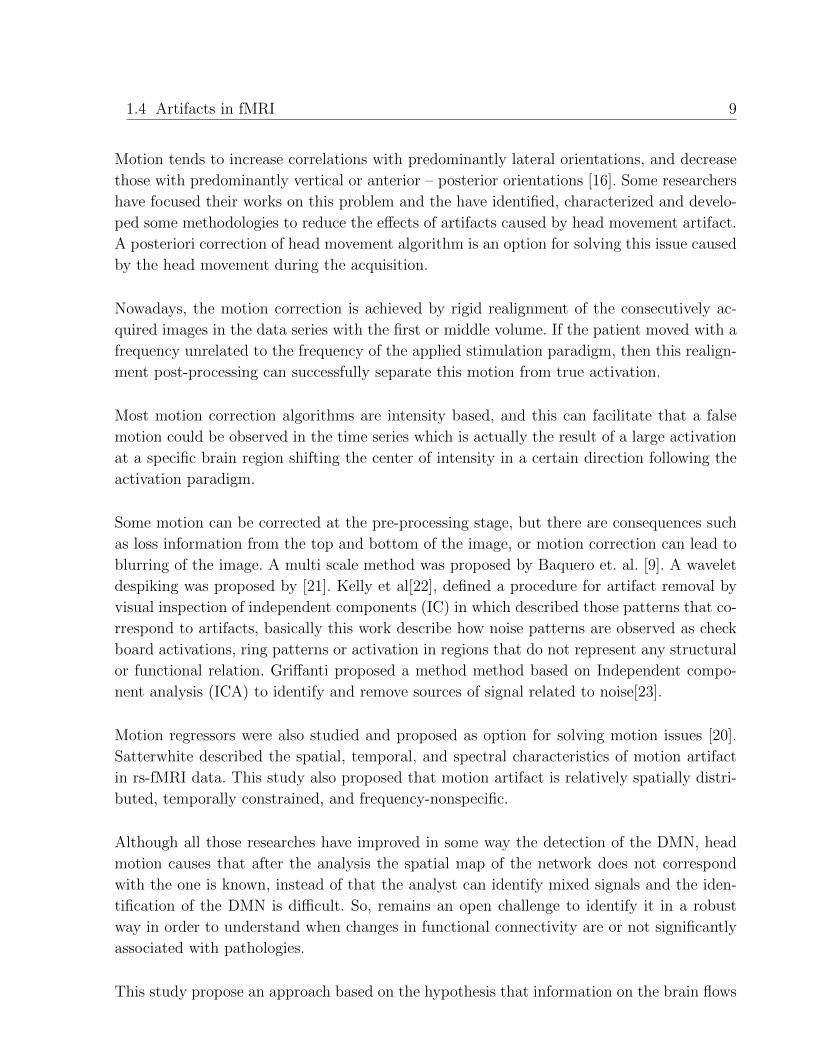
Motion tends to increase correlations with predominantly lateral orientations, and decrease
those with predominantly vertical or anterior – posterior orientations [16]. Some researchers
have focused their works on this problem and the have identified, characterized and develo-
ped some methodologies to reduce the effects of artifacts caused by head movement artifact.
A posteriori correction of head movement algorithm is an option for solving this issue caused
by the head movement during the acquisition.
Nowadays, the motion correction is achieved by rigid realignment of the consecutively ac-
quired images in the data series with the first or middle volume. If the patient moved with a
frequency unrelated to the frequency of the applied stimulation paradigm, then this realign-
ment post-processing can successfully separate this motion from true activation.
Most motion correction algorithms are intensity based, and this can facilitate that a false
motion could be observed in the time series which is actually the result of a large activation
at a specific brain region shifting the center of intensity in a certain direction following the
activation paradigm.
Some motion can be corrected at the pre-processing stage, but there are consequences such
as loss information from the top and bottom of the image, or motion correction can lead to
blurring of the image. A multi scale method was proposed by Baquero et. al. [9]. A wavelet
despiking was proposed by [21]. Kelly et al[22], defined a procedure for artifact removal by
visual inspection of independent components (IC) in which described those patterns that co-
rrespond to artifacts, basically this work describe how noise patterns are observed as check
board activations, ring patterns or activation in regions that do not represent any structural
or functional relation. Griffanti proposed a method method based on Independent compo-
nent analysis (ICA) to identify and remove sources of signal related to noise[23].
Motion regressors were also studied and proposed as option for solving motion issues [20].
Satterwhite described the spatial, temporal, and spectral characteristics of motion artifact
in rs-fMRI data. This study also proposed that motion artifact is relatively spatially distri-
buted, temporally constrained, and frequency-nonspecific.
Although all those researches have improved in some way the detection of the DMN, head
motion causes that after the analysis the spatial map of the network does not correspond
with the one is known, instead of that the analyst can identify mixed signals and the iden-
tification of the DMN is difficult. So, remains an open challenge to identify it in a robust
way in order to understand when changes in functional connectivity are or not significantly
associated with pathologies.
This study propose an approach based on the hypothesis that information on the brain flows
10 1 Introduction
according to the direction, specifically taking into account the connectivity model of the basal
ganglia in which signal travel according to the layer of cells in each nuclei. Mainly this thesis
sought to contribute to the goal of enhancing the detection of the default mode network in
resting state functional resonance imaging. In order to contribute on this field, the research
was focused on the problem of motion correction caused by head motion. Specifically, this
thesis presents a methodology centered in the hypothesis of the anisotropy in the information
of the images and in the brain and how the use of filters to detect in a better way the default
mode network even with high motion added to the images.
1.5. Document organization
This document is organized as follows: In chapter 1 it is introduced the functional resonance
imaging, the default mode network and the artifacts caused by head motion, as well as
definition of the problem and the necessity of enhancing the detection of the DMN. In
chapter 2 is introduced the idea of how the connectivity model of the basal ganglia can be
understood as a framework for the use of an anisotropic approach for DMN detection. A
generic formulation of anisotropic filters is introduced, with further focus on the use of it in
the proposed methodology. Qualitative and Numerical results of the detection of the DMN
in rs-fMRI with head motion noise artificially added. Those results are discussed in chapter
3 followed by conclusions and future work.
This document has been structured around the main product of this thesis: a paper submitted
to SIPAIM 2017, the 13th International Symposium on Medical Information Processing and
Analysis . The paper presents the results of applying the anisotropic proposed approach in
order to test the performance of the restoration of the DMN even after motion artificially
added. Results show that the DMN detected by using the anisotropic approach has a good
performance.
2. Method for detection of the Default
Mode Network using Anisotropic
Analysis of Functional Data
2.1. Introduction
Resting state magnetic resonance imaging rs-fMRI is a powerful and non invasive technique
in medical imagenology that recently has become in a widely used technique for the detec-
tion of resting state networks (RSN) and analysis related with its connectivity. Default mode
network (DMN) is one of the RSN that has been widely known and studied, alterations on
its connectivity have been related to the presence of alterations in the brain.
Usually, detection of networks in resting state is difficult because there are artifacts present
in the data. Different sources of artifacts can be detected in the images, one of the most
common are those caused by head movement. Researches have shown that participant mo-
tion is a potential source of error in studies of brain morphometry in clinical and nonclinical
populations [24] and also that the stronger the head motion, the fewer networks are detected
by data-driven methods such as independent component analysis (ICA).
Researches have detected that functional connectivity measurements also may be signifi-
cantly influenced by head motion that occurs during image acquisition. [25].
There are methods proposed for remove or decrease that kind of artifacts, as well as mea-
surements that pursuit to characterize those artifacts and establish a better compression of
the ways to avoid the effects of them.
The aim of this study was to propose a method for motion correction based on anisotropic
filtering of the functional data and compare the results of methods for motion correction
and its utility for the detection of the DMN. Data from the performance of various methods
for motion correction (a standard method and the proposed one using anisotropic filter) are
compare and results of the transformations performed are presented.
122 Method for detection of the Default Mode Network using Anisotropic Analysis of
Functional Data
2.1.1. Basal Ganglia
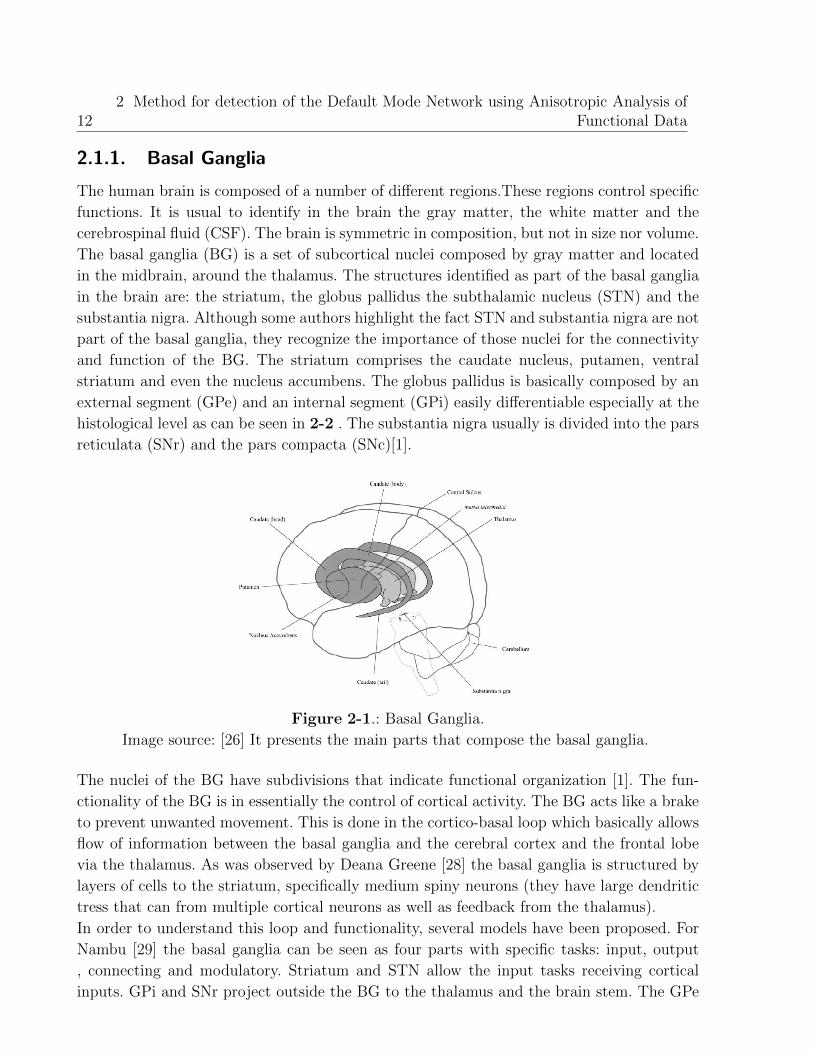
The human brain is composed of a number of different regions.These regions control specific
functions. It is usual to identify in the brain the gray matter, the white matter and the
cerebrospinal fluid (CSF). The brain is symmetric in composition, but not in size nor volume.
The basal ganglia (BG) is a set of subcortical nuclei composed by gray matter and located
in the midbrain, around the thalamus. The structures identified as part of the basal ganglia
in the brain are: the striatum, the globus pallidus the subthalamic nucleus (STN) and the
substantia nigra. Although some authors highlight the fact STN and substantia nigra are not
part of the basal ganglia, they recognize the importance of those nuclei for the connectivity
and function of the BG. The striatum comprises the caudate nucleus, putamen, ventral
striatum and even the nucleus accumbens. The globus pallidus is basically composed by an
external segment (GPe) and an internal segment (GPi) easily differentiable especially at the
histological level as can be seen in 2-2 . The substantia nigra usually is divided into the pars
reticulata (SNr) and the pars compacta (SNc)[1].
Figure 2-1.: Basal Ganglia.
Image source: [26] It presents the main parts that compose the basal ganglia.
The nuclei of the BG have subdivisions that indicate functional organization [1]. The fun-
ctionality of the BG is in essentially the control of cortical activity. The BG acts like a brake
to prevent unwanted movement. This is done in the cortico-basal loop which basically allows
flow of information between the basal ganglia and the cerebral cortex and the frontal lobe
via the thalamus. As was observed by Deana Greene [28] the basal ganglia is structured by
layers of cells to the striatum, specifically medium spiny neurons (they have large dendritic
tress that can from multiple cortical neurons as well as feedback from the thalamus).
In order to understand this loop and functionality, several models have been proposed. For
Nambu [29] the basal ganglia can be seen as four parts with specific tasks: input, output
, connecting and modulatory. Striatum and STN allow the input tasks receiving cortical
inputs. GPi and SNr project outside the BG to the thalamus and the brain stem. The GPe
2.1 Introduction 13
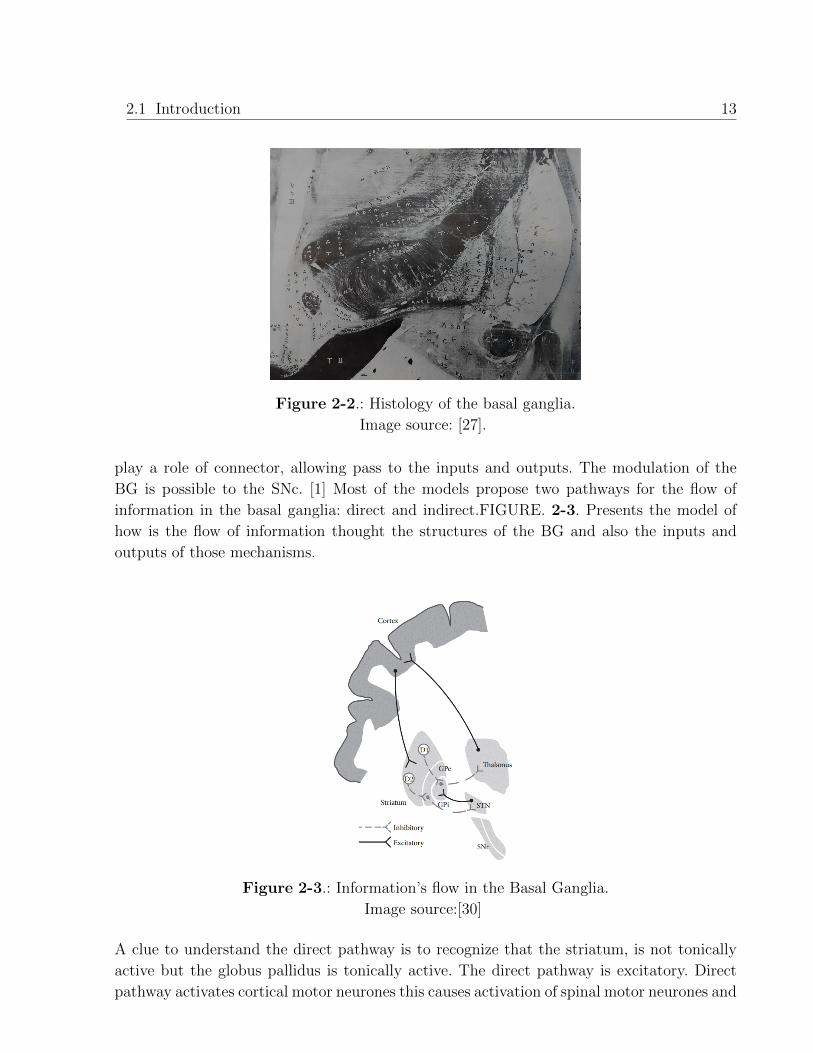
Figure 2-2.: Histology of the basal ganglia.
Image source: [27].
play a role of connector, allowing pass to the inputs and outputs. The modulation of the
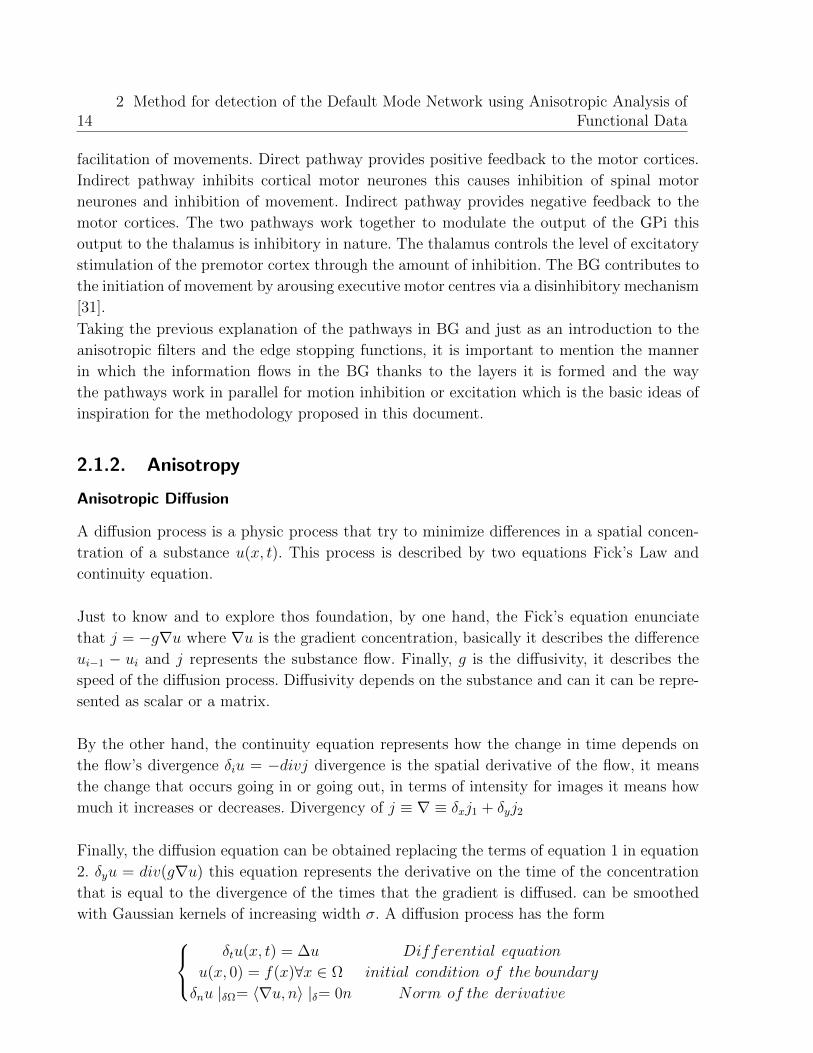
BG is possible to the SNc. [1] Most of the models propose two pathways for the flow of
information in the basal ganglia: direct and indirect.FIGURE. 2-3. Presents the model of
how is the flow of information thought the structures of the BG and also the inputs and
outputs of those mechanisms.
Figure 2-3.: Information’s flow in the Basal Ganglia.
Image source:[30]
A clue to understand the direct pathway is to recognize that the striatum, is not tonically
active but the globus pallidus is tonically active. The direct pathway is excitatory. Direct
pathway activates cortical motor neurones this causes activation of spinal motor neurones and
142 Method for detection of the Default Mode Network using Anisotropic Analysis of
Functional Data
facilitation of movements. Direct pathway provides positive feedback to the motor cortices.
Indirect pathway inhibits cortical motor neurones this causes inhibition of spinal motor
neurones and inhibition of movement. Indirect pathway provides negative feedback to the
motor cortices. The two pathways work together to modulate the output of the GPi this
output to the thalamus is inhibitory in nature. The thalamus controls the level of excitatory
stimulation of the premotor cortex through the amount of inhibition. The BG contributes to
the initiation of movement by arousing executive motor centres via a disinhibitory mechanism
[31].
Taking the previous explanation of the pathways in BG and just as an introduction to the
anisotropic filters and the edge stopping functions, it is important to mention the manner
in which the information flows in the BG thanks to the layers it is formed and the way
the pathways work in parallel for motion inhibition or excitation which is the basic ideas of
inspiration for the methodology proposed in this document.
2.1.2. Anisotropy
Anisotropic Diffusion
A diffusion process is a physic process that try to minimize differences in a spatial concen-
tration of a substance u(x, t). This process is described by two equations Fick’s Law and
continuity equation.
Just to know and to explore thos foundation, by one hand, the Fick’s equation enunciate
that j = −g∇u where ∇u is the gradient concentration, basically it describes the difference
ui−1 − ui and j represents the substance flow. Finally, g is the diffusivity, it describes the
speed of the diffusion process. Diffusivity depends on the substance and can it can be repre-
sented as scalar or a matrix.
By the other hand, the continuity equation represents how the change in time depends on
the flow’s divergence δiu = −divj divergence is the spatial derivative of the flow, it means
the change that occurs going in or going out, in terms of intensity for images it means how
much it increases or decreases. Divergency of j ≡ ∇ ≡ δxj1 + δyj2
Finally, the diffusion equation can be obtained replacing the terms of equation 1 in equation
2. δyu = div(g∇u) this equation represents the derivative on the time of the concentration
that is equal to the divergence of the times that the gradient is diffused. can be smoothed
with Gaussian kernels of increasing width σ. A diffusion process has the formδtu(x, t) = ∆u Differential equation
u(x, 0) = f(x)∀x ∈ Ω initial condition of the boundary
δnu |δΩ= 〈∇u, n〉 |δ= 0n Norm of the derivative
2.2 Methodology 15
The function g describes the diffusion.
The idea of using anisotropic diffusion for image processing became stronger with Perona and
Malik’s work, they presented the first formal description of anisotropy. Exactly, they establis-
hed three criteria for generating multi scale semantically meaningful:Causality, Immediate
Localization and Piecewise Smoothing. They also demonstrated that the simplest version
of anisotropic diffusion can be applied with success to multi scale image segmentation[32].
And they proposed a function for edge stopping based on this concept of anisotropy. The
anisotropic diffusion equation is:
It = div(c(x, y, t))∇I = c(x, y, t)∆I +∇c+∇I
where div indicates the divergence operator, and with ∆and5 respectively represent the
gradient and Laplacian operators, with respect to the space variables. It reduces to the iso-
tropic heat diffusion equation It = c5 if c(x, y, t) is a constant.
After that, other researches have done contributions to the formulations and the comprehen-
sion of the anisotropic diffusion method.
Weickert has contributed widely to this topic, through his analysis and comprehension of
the anisotropic diffusion in image processing foundations [33]. He also introduced an explicit
discretization for coherence-enhancing anisotropic diffusion filtering which uses first-order
derivative approximations that have been optimized for rotational invariance [34]. This work
was previously optimized with an algorithm based on 5x5 stencils allowing a better behavior
for rotational invariance and avoiding blurring artifacts [35].
Gerig et al, proposed a post process based on anisotropic diffusion. Extensions of a new tech-
nique support 3D and multi echo MRI, incorporating higher spatial and spectral dimensions.
They demonstrated efficient noise reduction and sharpening of object boundaries.[36]
Ding presented a particularly useful technique for smoothing diffusion tensor images in which
direction information contained in the tensor needs to be restored following noise corruption
and preserved around tissue boundaries.[37]
Researches as the one done by Zuo [38] suggested that Non Local Diffusion-based spatial
smoothing maybe more effective and reliable at improving the quality of both MRI data
preprocessing and default network mapping, and have proposed anisotropic diffusion and
non-local diffusion kernels.
2.2. Methodology
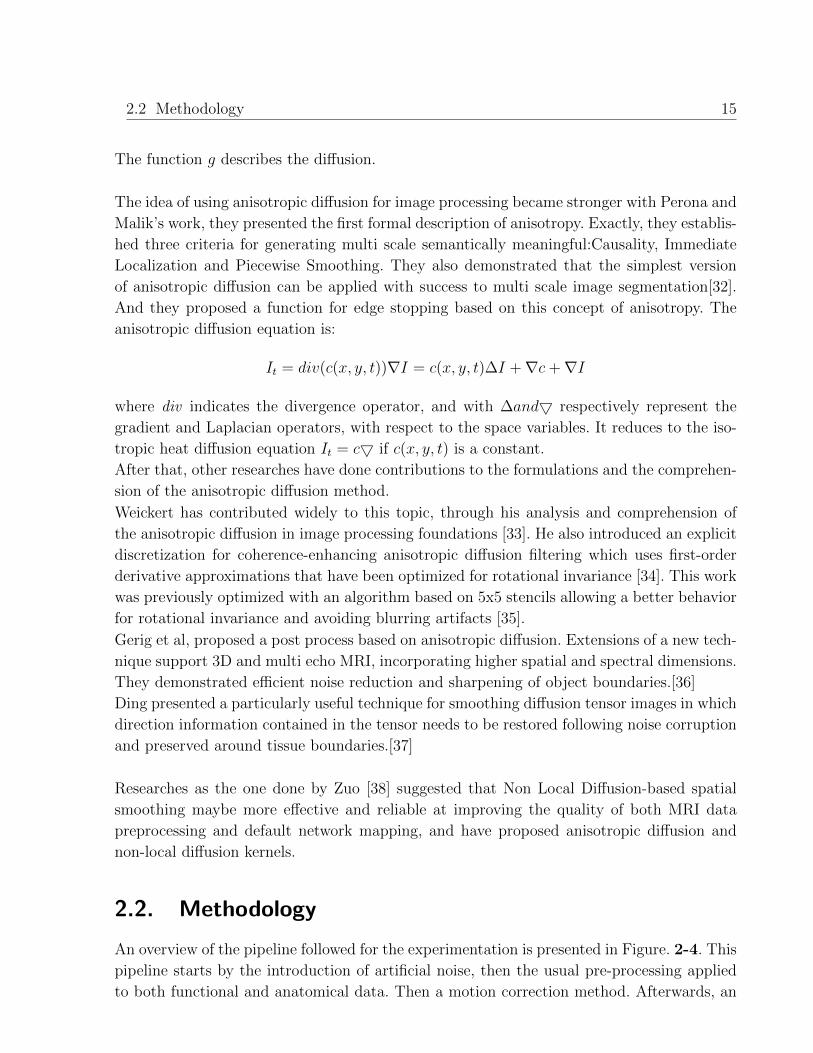
An overview of the pipeline followed for the experimentation is presented in Figure. 2-4. This
pipeline starts by the introduction of artificial noise, then the usual pre-processing applied
to both functional and anatomical data. Then a motion correction method. Afterwards, an
162 Method for detection of the Default Mode Network using Anisotropic Analysis of
Functional Data
independent component analysis ICA is carried out followed by the usual DMN template
detection.
Figure 2-4.: Pipeline followed for the experimentation
2.2.1. Noise addition
In order to validate the method, images were altered with artificial noise. For this, volume
from each fMRI dataset were transformed spatially in order to simulate head movement,
this process was done applying an affine transformation matrix with randomly values for
displacement between -3 and 3 mm and with values between -3 and 3 degrees for rotation in
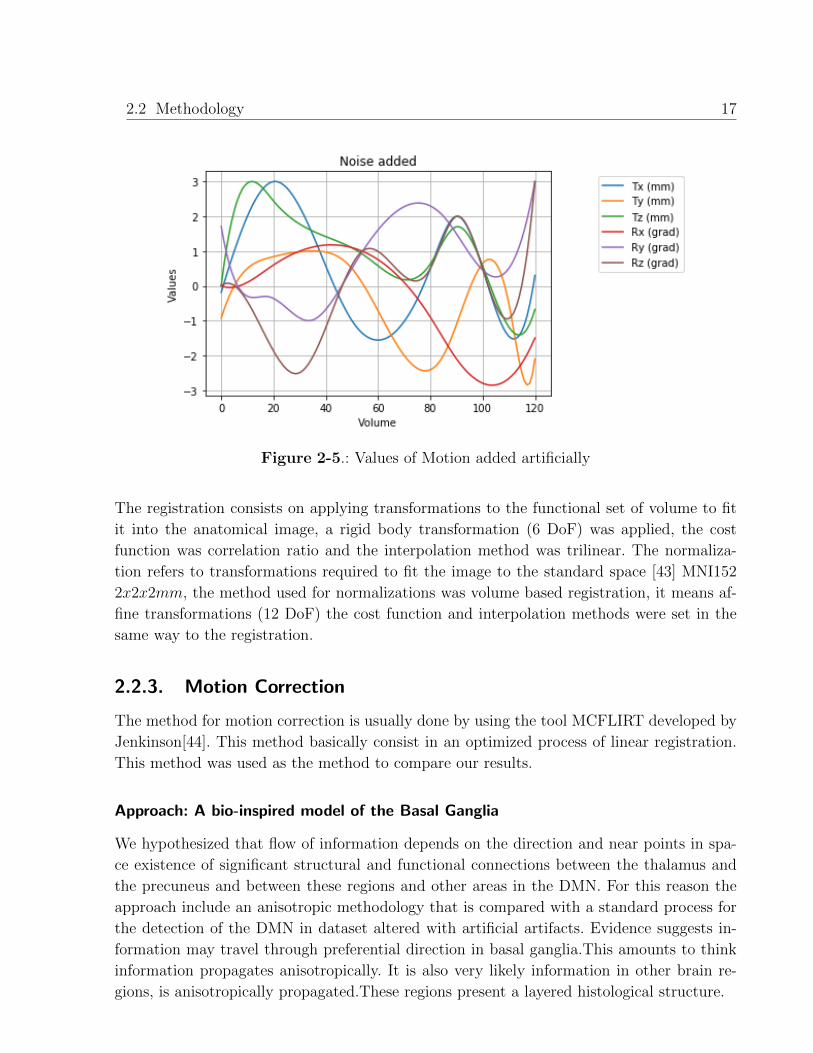
in all the axes. Figure.2-5 shows the values of motion applied by following the method for
noise simulation in fMRI presented by Ivanna Drobnjak in [39].
2.2.2. Preprocessing
The common preprocessing steps for perform an standard analysis of rs-fMRI consist in
reorientation, motion correction, remove non-brain tissues, smoothing spatially and filtering
temporally.
Remotion of non brain tissues was done wit brain extraction tool BET [40]. Structural data
were spatially smoothed with a 5mm FWHM Gaussian Kernel and functional data were
temporally filtered with a high-pass filter using 0,01Hz as cut-off frequency to remove slow
drifts. Those parameters were chosen according with [41] [42].
2.2 Methodology 17
Figure 2-5.: Values of Motion added artificially
The registration consists on applying transformations to the functional set of volume to fit
it into the anatomical image, a rigid body transformation (6 DoF) was applied, the cost
function was correlation ratio and the interpolation method was trilinear. The normaliza-
tion refers to transformations required to fit the image to the standard space [43] MNI152
2x2x2mm, the method used for normalizations was volume based registration, it means af-
fine transformations (12 DoF) the cost function and interpolation methods were set in the
same way to the registration.
2.2.3. Motion Correction
The method for motion correction is usually done by using the tool MCFLIRT developed by
Jenkinson[44]. This method basically consist in an optimized process of linear registration.
This method was used as the method to compare our results.
Approach: A bio-inspired model of the Basal Ganglia
We hypothesized that flow of information depends on the direction and near points in spa-
ce existence of significant structural and functional connections between the thalamus and
the precuneus and between these regions and other areas in the DMN. For this reason the
approach include an anisotropic methodology that is compared with a standard process for
the detection of the DMN in dataset altered with artificial artifacts. Evidence suggests in-
formation may travel through preferential direction in basal ganglia.This amounts to think
information propagates anisotropically. It is also very likely information in other brain re-
gions, is anisotropically propagated.These regions present a layered histological structure.
182 Method for detection of the Default Mode Network using Anisotropic Analysis of
Functional Data
Anisotropic filtering
We hypothesize that the flow of information depends on the anatomic direction, modified
by the functional connections between the thalamus and the precuneus and between these
regions and other DMN areas. Yet neurons are on the order of micrometers, they are struc-
turally connected into layers which have been widely described in many histology treaties.
This type of organization allow us to infer that the flow of information at the level of voxels
is also anisotropic. This hypothesis is at the very base of the present investigation and is
introduced by an anisotropic filter into the usual workflow analysis. The anisotropic filtering
herein used aims then to capture the essential information in the dataset altered by artificial
motion perturbations. A new implementation of the classic anisotropic filter is out of the
scope of the present work. In consequence the filter herein applied was already described by
Weickert in [35] and is briefly hereafter described: this filter smooths images by applying the
partial differential equation:
∂I
∂t= ∇(T · ∇I)
where I refers to the image intensity, ∇I is the intensity gradient, t is the iteration time
parameter and T is the diffusion tensor. The intensity gradient tensor G is used to obtain the
diffusion tensor T and is computed by convolving the outer product of the intensity gradient
∇I and a Gaussian kernel Kρ . It is possible to capture the boundary information that is
missing in one direction from another direction by summing ∇Ii ⊗ ∇Ii over all directions,
followed by a component wise convolution with Gaussian kernel as G = Kρ ∗∑
(∇I ⊗∇I)
and ρ is the standard deviation of the gaussian kernel and represents the integration scale of
convolution. The principal directions and magnitudes of the image intensity gradient G over
the integration scale ρ are the eigenvectors and eigenvalues of G respectively. The direction
of the largest intensity gradient is the eigenvector associated with the largest eigenvalue and
the other way around. The constructed T smooths then out along the tangential direction
of edges. This tensor gives a direction where the diffusion is preferred and another direction
where the diffusion is suppressed [37].
2.2.4. Processing
Structural Information: Registration and Normalization
Each fMRI volume was registered to the subjects high resolution T1-weighted scan using
rigid-body registration (6DoF) referring to 3 rotations and 3 translations, for this registration
was used the tool FLIRT [45] from FLS. After that, each volume was normalized using
volume based approach, it is registering to standard space (MNI152 2x2x2mm) by using
affine registration (12DoF).
2.2 Methodology 19
Table 2-1.: Experimentation
ExpNoise
Adition
Pre-
processing
Motion
correction
Reg and
NormICA
DMN
Selection
Baseline No Yes No Yes Yes Yes
Compared Yes Yes Mcflirt Yes Yes Yes
Proposed Yes Yes Anisotropic Yes Yes Yes
Independent Component Analysis (ICA)
Once done preprocessing steps, the datasets of all the methods previously mentioned the
data was decomposed into 30 independent components (IC) as was used in [9] [46] using
Multivariate Exploratory Linear Optimized Decomposition into Independent Components
(MELODIC) [47] using simple temporal concatenation. For ICA, the usual supposition is
that fMRI data is composed by a mixture of unknown source components which are temporal
or spatial independent and uncorrelated and all the IC are non-Gaussian variables. The
main criterion of ICA includes minimization of the mutual information, maximum likelihood
estimation ans non-Gaussian measure. In the parameters a threshold of 0.5 was chosen. And
for the IC visualization the BRICON values were establish between 2 and 10.
DMN selection
Although exist criteria for the visual inspection of IC, standardization of denoising and RSN
identification [22]. Manual selection of the DMN may be time consuming and a hard work
task because all components should be carefully visualized and analyzed. Technical advances
have shown the possibility to automate denoising and the identification of the RSN, saving
man-hours of highly qualified technical personnel. Here we tested methods for the selection
of the DMN based on a measurements of similarity proposed by [48] in order to identify the
IC that fit better to the probabilistic DMN template.
Probabilistic Template
All components were compared with a probabilistic template of the default mode network
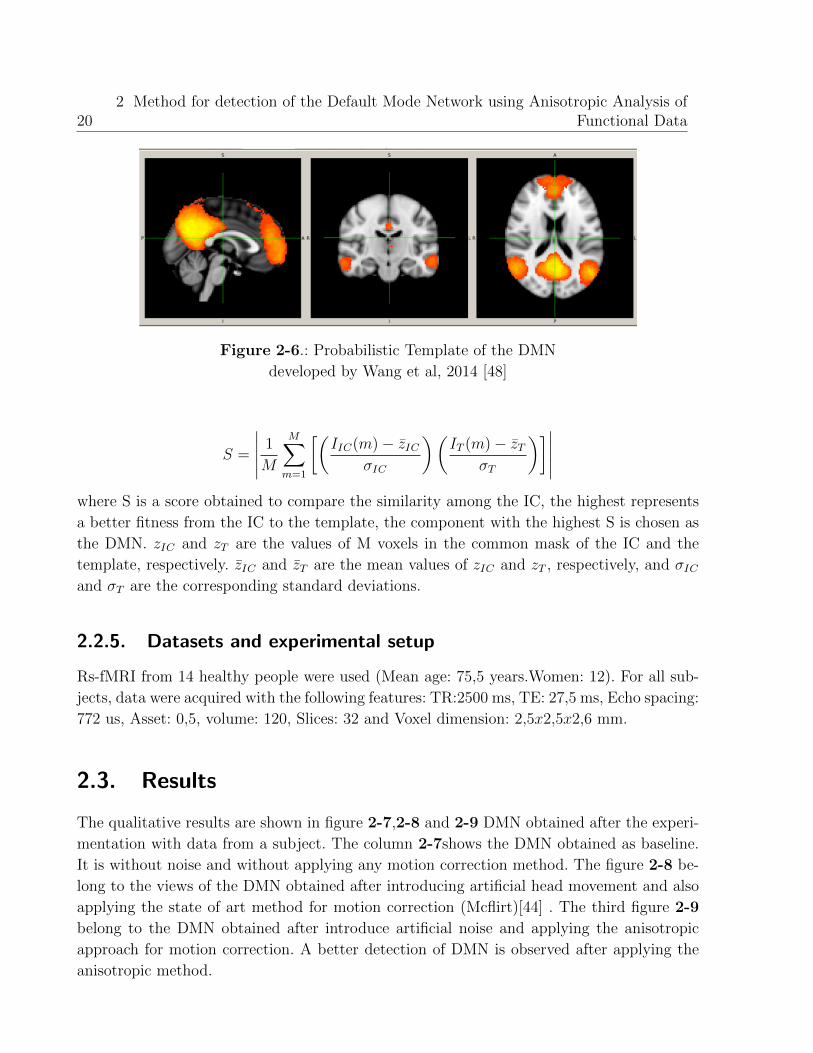
[48], in order to select the more similar component of the DMN. In figure 2-6
Method to Select the DMN
In order to get the IC most similar to the DMN, the IC obtained from ICA were compared
to the template using a similarity measurement proposed by Wang et al, [48].
202 Method for detection of the Default Mode Network using Anisotropic Analysis of
Functional Data
Figure 2-6.: Probabilistic Template of the DMN
developed by Wang et al, 2014 [48]
S =
∣∣∣∣∣ 1
M
M∑m=1
[(IIC(m)− zIC
σIC
)(IT (m)− zT
σT
)]∣∣∣∣∣where S is a score obtained to compare the similarity among the IC, the highest represents
a better fitness from the IC to the template, the component with the highest S is chosen as
the DMN. zIC and zT are the values of M voxels in the common mask of the IC and the
template, respectively. zIC and zT are the mean values of zIC and zT , respectively, and σICand σT are the corresponding standard deviations.
2.2.5. Datasets and experimental setup
Rs-fMRI from 14 healthy people were used (Mean age: 75,5 years.Women: 12). For all sub-
jects, data were acquired with the following features: TR:2500 ms, TE: 27,5 ms, Echo spacing:
772 us, Asset: 0,5, volume: 120, Slices: 32 and Voxel dimension: 2,5x2,5x2,6 mm.
2.3. Results
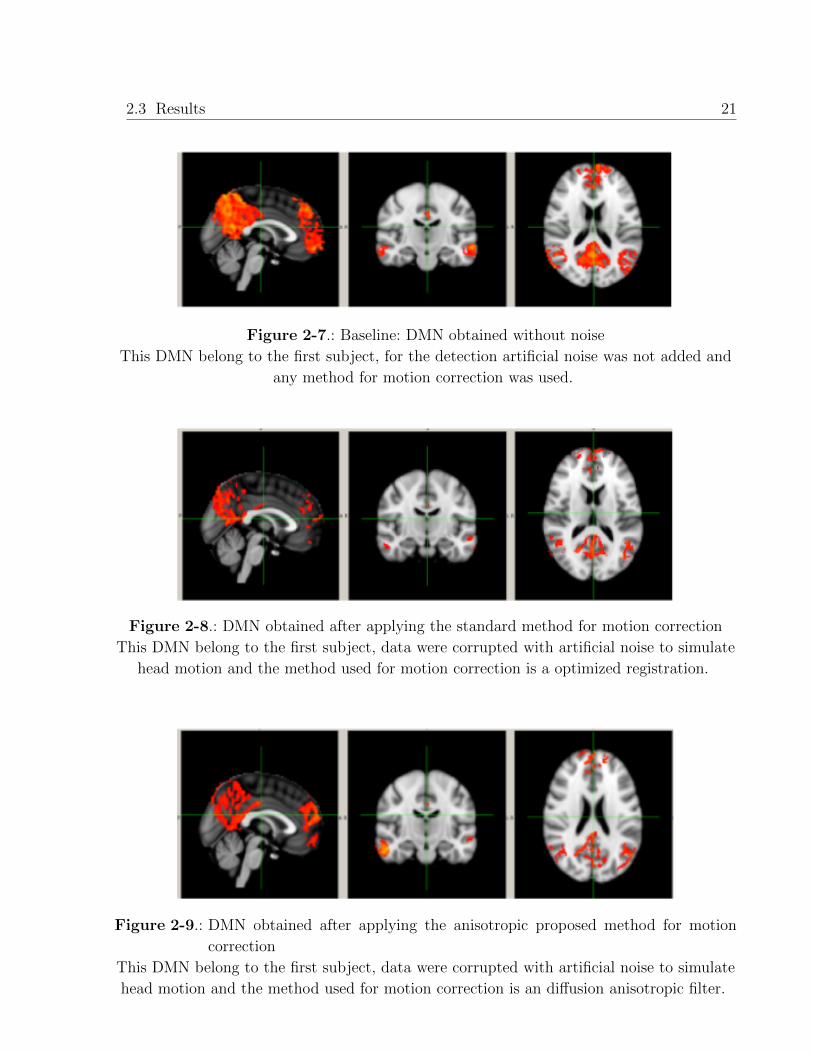
The qualitative results are shown in figure 2-7,2-8 and 2-9 DMN obtained after the experi-
mentation with data from a subject. The column 2-7shows the DMN obtained as baseline.
It is without noise and without applying any motion correction method. The figure 2-8 be-
long to the views of the DMN obtained after introducing artificial head movement and also
applying the state of art method for motion correction (Mcflirt)[44] . The third figure 2-9
belong to the DMN obtained after introduce artificial noise and applying the anisotropic
approach for motion correction. A better detection of DMN is observed after applying the
anisotropic method.
2.3 Results 21
Figure 2-7.: Baseline: DMN obtained without noise
This DMN belong to the first subject, for the detection artificial noise was not added and
any method for motion correction was used.
Figure 2-8.: DMN obtained after applying the standard method for motion correction
This DMN belong to the first subject, data were corrupted with artificial noise to simulate
head motion and the method used for motion correction is a optimized registration.
Figure 2-9.: DMN obtained after applying the anisotropic proposed method for motion
correction
This DMN belong to the first subject, data were corrupted with artificial noise to simulate
head motion and the method used for motion correction is an diffusion anisotropic filter.
222 Method for detection of the Default Mode Network using Anisotropic Analysis of
Functional Data
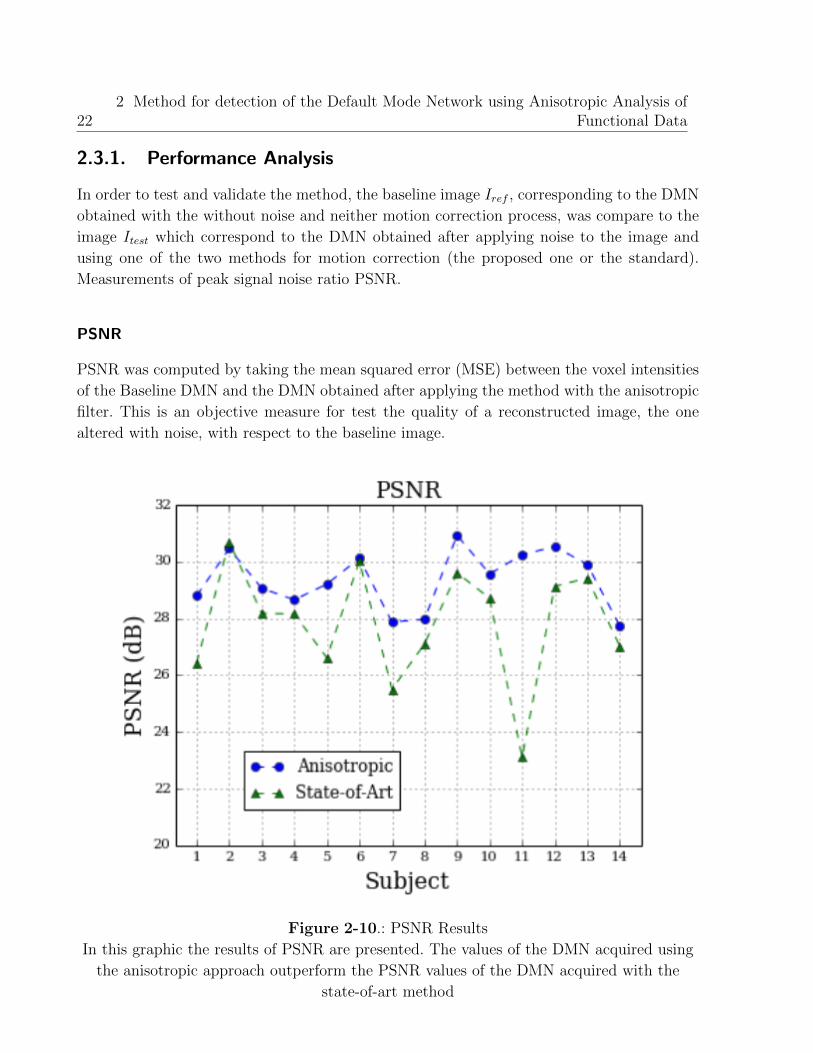
2.3.1. Performance Analysis
In order to test and validate the method, the baseline image Iref , corresponding to the DMN
obtained with the without noise and neither motion correction process, was compare to the
image Itest which correspond to the DMN obtained after applying noise to the image and
using one of the two methods for motion correction (the proposed one or the standard).
Measurements of peak signal noise ratio PSNR.
PSNR
PSNR was computed by taking the mean squared error (MSE) between the voxel intensities
of the Baseline DMN and the DMN obtained after applying the method with the anisotropic
filter. This is an objective measure for test the quality of a reconstructed image, the one
altered with noise, with respect to the baseline image.
Figure 2-10.: PSNR Results
In this graphic the results of PSNR are presented. The values of the DMN acquired using
the anisotropic approach outperform the PSNR values of the DMN acquired with the
state-of-art method
2.3 Results 23
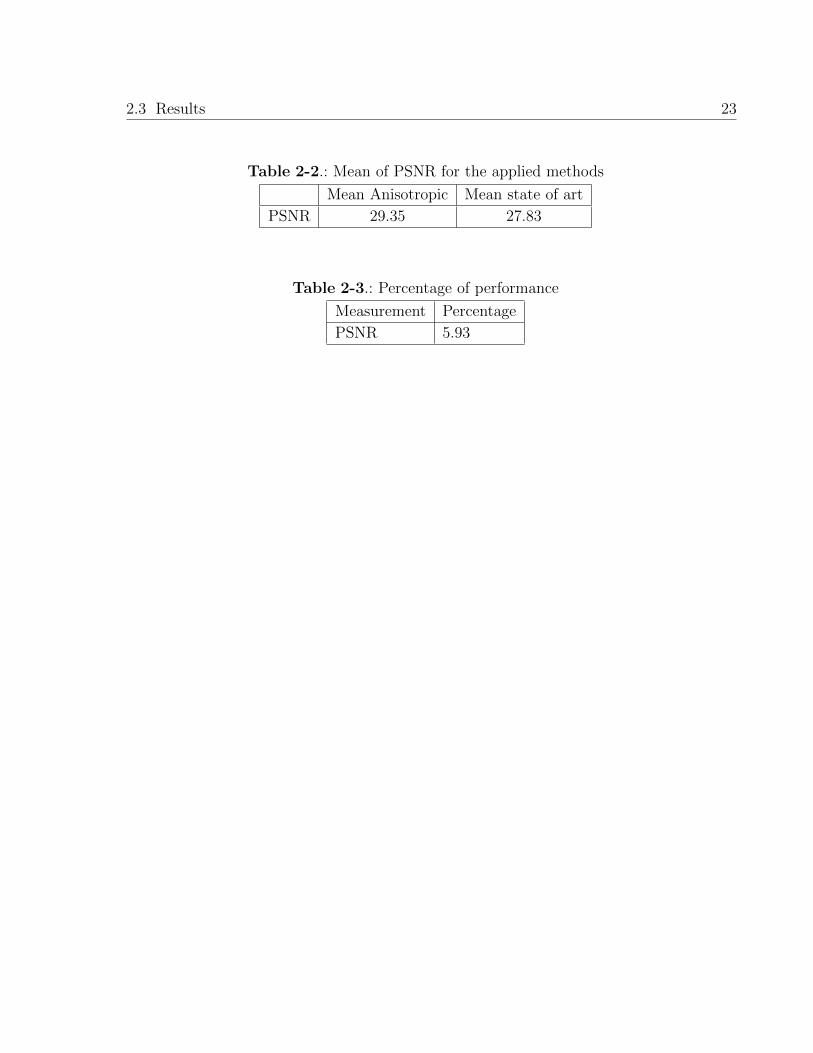
Table 2-2.: Mean of PSNR for the applied methods
Mean Anisotropic Mean state of art
PSNR 29.35 27.83
Table 2-3.: Percentage of performance
Measurement Percentage
PSNR 5.93
3. Discussion, Conclusions and Future
Work
3.1. Discussion
A voxel is nothing but the space location of the average activity of a large population of
neurons. The way the nervous systems processes information is essentially hierarchical, that
is to say from the environment, where information is more or less linearly represented by cap-
tors, to the central networks, dimensionality is reduced aiming to extract the most relevant
information. This hierarchical construction of the external world is by nature anisotropic,
that is to say information is wired from many to few. Anatomical and histological evidence
supports this claim, neurons communicate with networks that highlight the essential part of
the information and this is performed by specialized architectures, columns or layers, whose
main role is to select relevant information.
A method for enhance the detection of the DMN was proposed inspired on the organization
of neural cells in the basal ganglia. The method was tested and compared the results with a
metric of PSNR.
The contribution presented is a method inspired in the model of how information is propa-
gated and the use of this to improve the DMN restoration when some motion perturbs the
network. This method for enhancing the detection of the DMN was proposed inspired on the
organization of neural cells in the basal ganglia. This method was tested and compared the
results with a metric of PSNR.
3.2. Conclusion
The study proposes an anisotropic analysis of the information flow in rs-fMRI to correct ar-
tifacts caused by head motion. The results show an improvement in the DMN detection, less
variability in the response of the DMN and a better detection by applying the anisotropic
method. Results obtained show that the anisotropic approach outperforms the state-of-the-
art method by 5.93 % PSNR.
The contribution presented is a model of how information is propagated and the use of this
3.3 Future Work 25
to improve the DMN restoration when some motion perturbs the network. This analysis is
inspired by the fact that the nervous systems reduces dimensionality by structuring informa-
tion hierarchically and anisotropically. This simple modification results to be very efficient
in terms of recovery of the network perturbed by artifacts caused by head movement.
3.3. Future Work
The proposed method shows a better detection of the DMN even with altered images. Expe-
rimentation with a large dataset could be reinforce the validity of results through a statistical
test. Variability among the population also can be tested, it means the use of the the aniso-
tropic approach in images from people whit pathologies or states that induce head motion
during the acquisition taking into account the motion patterns characteristic of the patho-
logy or state analyzed. This work was focused on artifacts caused by head motion in rs-fMRI,
however the analysis combining information from images acquired with different techniques
(i.e PET or DWI) also could be possible.
An interesting way to continue exploring and modeling the information’s flow for the detec-
tion of resting state networks in rs-fMRI altered by head movement is the work with fluid
equations. This approach could model in a best way the information’s flow following rules of
dynamic of fluids, using techniques such as finite elements, finite differences and finite volume.
Another way could be the use of machine learning techniques such as convolutional neural
networks that employ intelligent filters. Here, a neural network can be trained to adapt
itself to the dynamic of historic images. For both, analysis and quantification of functional
connectivity performance could be required.
A. Appendix 1: Presented Article
The following article was presented at 13th International Symposium on Medical Information
Processing and Analysis SIPAIM 2017. Conference proceedings are expected to be published
by SPIE Digital Library.
Detection of the Default Mode Network by an anisotropicanalysis
Aura Forero and Eduardo Romeroa
aComputer Imaging and Medical Applications Laboratory(CIM@LAB), Universidad Nacionalde Colombia , Bogota, Colombia
ABSTRACT
—This document presents a proposal devoted to improve the detection of the default mode network (DMN) inresting state functional magnetic resonance imaging in noisy conditions caused by head movement. The proposedapproach is inspired by the hierarchical treatment of information, in particular at the level of the brain basalganglia. Essentially, the fact that information must be selected and reduced suggests propagation of informationin the Central Nervous System (CNS) is anisotropic. Under this hypothesis, the reconstruction of informationof activation should follow an anisotropic pattern. In this work, an anisotropic filter is used to recover theDMN that is perturbed by simulated motion artifacts. Results obtained show this approach outperforms thestate-of-the-art methods by 5.93% PSNR.
Keywords: Anisotropic diffusion filter, Motion correction, head motion, default mode network, rs-fMRI
1. INTRODUCTION
Recent studies of the brain include the acquisition of anatomical and functional images. Computerized tomog-raphy CT, positron emission tomography PET, electroencephalographs EEC and magnetic resonance imagingMRI are techniques for acquiring brain images. These images are analyzed with different methods. Results ofthese analysis facilitate the understanding of the brain and pathologies associated.
This document is focused in the analysis of a non invasive technique called resting state fMRI. For thistechnique, a set of images are acquired along time while the subject is not performing cognitive task and withclosed eyes.The base of these images is the blood level oxygen dependent BOLD signal. This signal is associated tothe magnetic properties of the blood and the metabolism of neural cells.1 Low-frequency fluctuations in BOLD0.01Hz ă f ă 0, 1Hz2 allow to identify resting state networks RSN through the inspection of synchronousactivations.
The default mode network (DMN) is the most studied RSN. It has been identified and associated to brainareas such as the bilateral parietal cortex, the precuneus, posterior cingulate cortex (PCC), anterior cingulatecortex (ACC), medial prefrontal cortex (MPFC), hippocampus and thalamus.3
Usually, detection of RSN is difficult because there are artifacts present in the data. Different sources of arti-facts can be detected in the images, one of the most common is caused by head movement during the acquisition.Researchers have shown that subject’s motion is a potential source of error in studies of brain morphometryin clinical and nonclinical populations.4 Functional connectivity measurements also may be significantly influ-enced by head motion that occurs during image acquisition.5 For this reason, many papers have been publishedspecifically concerning the motion artifact issues in resting state fMRI.6 There are methods proposed for removeor decrease the effects of these artifacts, as well as measurements that pursuit to characterize them.2 Linealregistration of volumes is one of the methods applied for deal with these issues.7
The proposed method is inspired by how is the information’s flow through brain structures. Specificallyunder the hypothesis information flows hierarchically and anisotropically,8 as modeled for the basal ganglia.9 Ata micro-structural level, the brain is composed of specialized groups of neurons organized in layers that constitutethe ganglia, which are the macroscopic visible structures interacting and setting brain functions and stages. Theflow of information through these structures has a preferential direction defined by the hierarchy itself, a conditionherein exploited by the use of anisotropic filters that reconstitute a particular functional net, the DMN that isartificially perturbed by motion. The model and the proposed methodology are hereafter explained.
The contribution presented in this document is a method inspired in the model of how information is propa-gated and the use of this to improve the DMN restoration when some motion perturbs the network. This methodfor enhancing the detection of the DMN was proposed inspired on the organization of neural cells in the basalganglia. The results of applying this method were tested using metrics of SNR, PSNR and BOLD variation.These results are also compared with results of applying a state-of-art method.
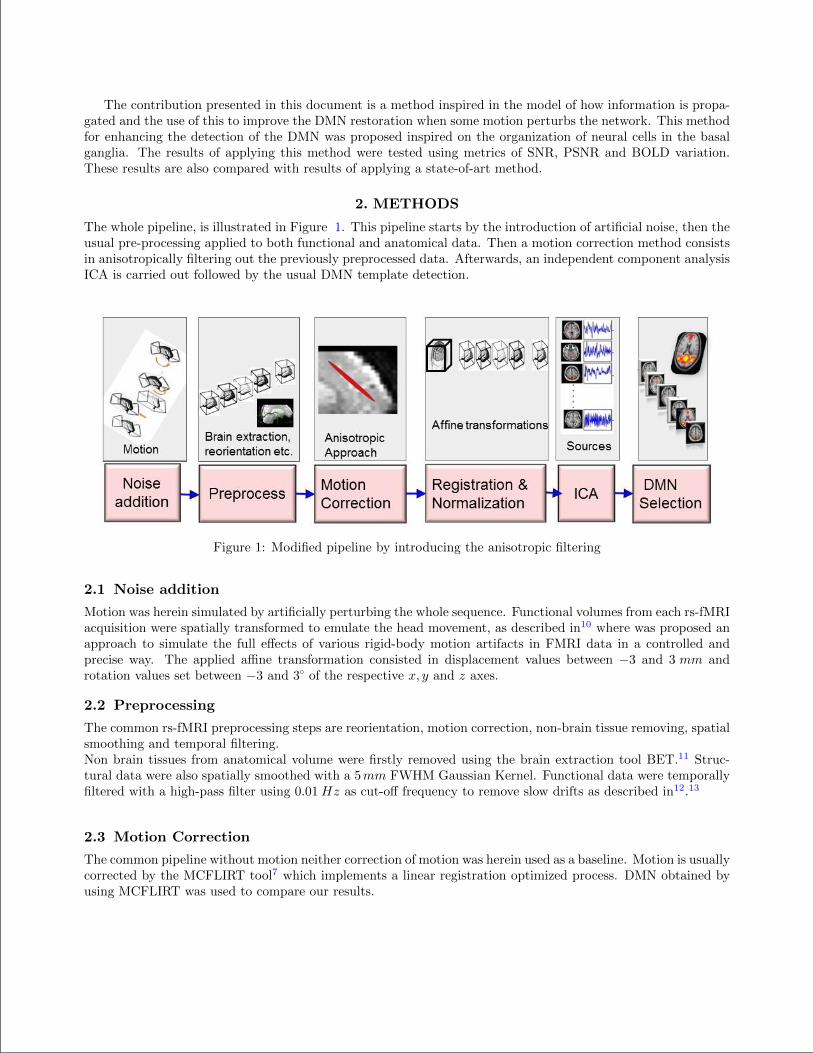
2. METHODS
The whole pipeline, is illustrated in Figure 1. This pipeline starts by the introduction of artificial noise, then theusual pre-processing applied to both functional and anatomical data. Then a motion correction method consistsin anisotropically filtering out the previously preprocessed data. Afterwards, an independent component analysisICA is carried out followed by the usual DMN template detection.
Figure 1: Modified pipeline by introducing the anisotropic filtering
2.1 Noise addition
Motion was herein simulated by artificially perturbing the whole sequence. Functional volumes from each rs-fMRIacquisition were spatially transformed to emulate the head movement, as described in10 where was proposed anapproach to simulate the full effects of various rigid-body motion artifacts in FMRI data in a controlled andprecise way. The applied affine transformation consisted in displacement values between ´3 and 3 mm androtation values set between ´3 and 30 of the respective x, y and z axes.
2.2 Preprocessing
The common rs-fMRI preprocessing steps are reorientation, motion correction, non-brain tissue removing, spatialsmoothing and temporal filtering.Non brain tissues from anatomical volume were firstly removed using the brain extraction tool BET.11 Struc-tural data were also spatially smoothed with a 5mm FWHM Gaussian Kernel. Functional data were temporallyfiltered with a high-pass filter using 0.01Hz as cut-off frequency to remove slow drifts as described in12.13
2.3 Motion Correction
The common pipeline without motion neither correction of motion was herein used as a baseline. Motion is usuallycorrected by the MCFLIRT tool7 which implements a linear registration optimized process. DMN obtained byusing MCFLIRT was used to compare our results.
2.3.1 The Anisotropic Approach
We hypothesize that the flow of information depends on the anatomic direction, modified by the functionalconnections between the thalamus and the precuneus and between these regions and other DMN areas. Yetneurons are on the order of micrometers, they are structurally connected into layers which have been widelydescribed in many histology treaties. This type of organization allow us to infer that the flow of informationat the level of voxels is also anisotropic. This hypothesis is at the very base of the present investigation andis introduced by an anisotropic filter into the usual workflow analysis. The anisotropic filtering herein usedaims then to capture the essential information in the dataset altered by artificial motion perturbations. A newimplementation of the classic anisotropic filter is out of the scope of the present work. In consequence the filterherein applied was already described by Weickert in14 and is briefly hereafter described: this filter smoothsimages by applying the partial differential equation:
BIBt “ ∇pT ¨∇Iq (1)
where I refers to the image intensity, ∇I is the intensity gradient, t is the iteration time parameter and T isthe diffusion tensor. The intensity gradient tensor G is used to obtain the diffusion tensor T and is computed byconvolving the outer product of the intensity gradient ∇I and a Gaussian kernel Kρ . It is possible to capturethe boundary information that is missing in one direction from another direction by summing ∇Iib∇Ii over alldirections, followed by a component wise convolution with Gaussian kernel as G “ Kρ ˚řp∇I b∇Iq and ρ isthe standard deviation of the gaussian kernel and represents the integration scale of convolution. The principaldirections and magnitudes of the image intensity gradient G over the integration scale ρ are the eigenvectorsand eigenvalues of G respectively. The direction of the largest intensity gradient is the eigenvector associatedwith the largest eigenvalue and the other way around. The constructed T smooths then out along the tangentialdirection of edges. This tensor gives a direction where the diffusion is preferred and another direction where thediffusion is suppressed.15
2.4 Registration and Normalization
Registration aims to match the set of functional data and the anatomical image (T1-weighted scan), applying rigidbody transformations with 6 degrees of freedom (DoF). Afterward, normalization consists in registering thesedata to the standard MNI1522x2x2 space (Stereotaxic Registration Model),16 applying affine transformationswith 12 DoF. Both, registration and normalization, use the same FLIRT tool17 from the FS.
2.5 Independent Component Analysis (ICA)
After these preprocessing steps, an independent component analysis ICA is applied to data per subject. ICAsupposes fMRI data is composed of a mixture of unknown non-Gaussian source components which are temporallyor spatially independent. Separation of these non Gaussian sources is achieved by minimization of the mutualinformation and maximum likelihood estimation. Data are decomposed into sources, the independent components(IC), herein 30 as described in18,19 .
2.6 DMN selection
Several methods for visually classifying the independent components have been proposed.20 Here, the detectionof the DMN is based on the comparison of scores obtained from a similarity metric proposed by Wang etal,.21 Basically, Wang applied an algorithm for selecting the most similar independent component to a DMNprobabilistic template. For this, the z-values of both signals are convolved as shown in Equation (2) to computethe score.
S “ˇˇˇ
1
M
Mÿ
m“1
„ˆIICpmq ´ zIC
σIC
˙ˆIT pmq ´ zT
σT
˙ˇˇˇ (2)
Being S the score obtained by comparing the similarity between the image of each independent compo-nent IIC and a probabilistic DMN template IT . The highest score component represents the highest match to
the DMN, zIC and zT are the z values of M voxels in the common mask of the IC and the template, while zICand zT are the zIC and zT mean values, respectively, and σIC and σT are their corresponding standard deviations.
3. DATASET AND EXPERIMENTAL SETUP
3.1 Dataset
The proposed strategy was assessed in rs-fMRI data from 14 healthy people (Mean age: 75.5 years.Women: 12).For all subjects, data were acquired under the following parameters: TR:2500 ms, TE: 27.5 ms, Echo spacing:772 us, Asset: 0.5, volume: 120, Slices: 32 and Voxel dimension: 2.5ˆ 2.5ˆ 2.6 mm.
3.2 Experimentation
The dataset described above was used following the steps mentioned in the pipeline proposed to obtain threesets of DMN.The first group correspond to the baseline DMN, this was obtained skipping the step of noise addition and alsothe step of motion correction. It is applying the steps of preprocessing, registration, normalization, independentcomponent analysis and DMN selection.Then, original dataset was altered by introducing artificial head motion. The generation of noisy data was donefollowing the method exposed in10 with values between ´3 and 3. These dataset was preprocessed. Afterwards asecond group of DMN was obtained applying a commonly used method for motion correction known as MCflirt,7
it applies an optimized registration. Steps of registration, normalization, independent component analysis andDMN selection were also followed.The third DMN group was obtained by using the altered and preprocessed dataset, applying an anisotropicfilter as method for motion correction and applying the steps of registration, normalization, independent com-ponent analysis and DMN selection as was previously mentioned. The calculated tensor used as the basis forthe anisotropic method was performed with the 3DAnisosmooth tool14,22,23,15 and it is part of the softwareAFNI.24The filter is applied only one time, for this reason the iteration time parameter is set to only one iter-ation. The use of higher values of time iteration amplifies boundaries of smoothing and this produces loss offlow’s information.At the end three spatial DMN maps were obtained for each subject, these DMN were compared and analyzedwith measurements of PSNR as is explain in next section.
3.3 Performance Analysis
Performance of the motion correction method is tested using the groups of DMN detected and computing themeasurement of peak signal noise ratio PSNR to compare the DMN obtained with different methods of motioncorrection.
PSNR was computed by using the DMN obtained from each subject but changing the motion correctionmethods. This is the baseline DMN image Iref and the DMN obtained after applying to a noisy image a methodfor motion correction Itest.
The election of PSNR is because it estimates the quality of the reconstructed images with respect to anoriginal image. So, it is a good measure for comparing restoration results for the same image. Here we areusing the same image but adding noise to one and obtaining the independent component corresponding to theDMN. We are also sleuthing the connectivity by analyzing information’s flow from internal neural structuresrepresented in voxels with similar values of BOLD. Restored Images with higher PSNR are judged better.
3.4 Results
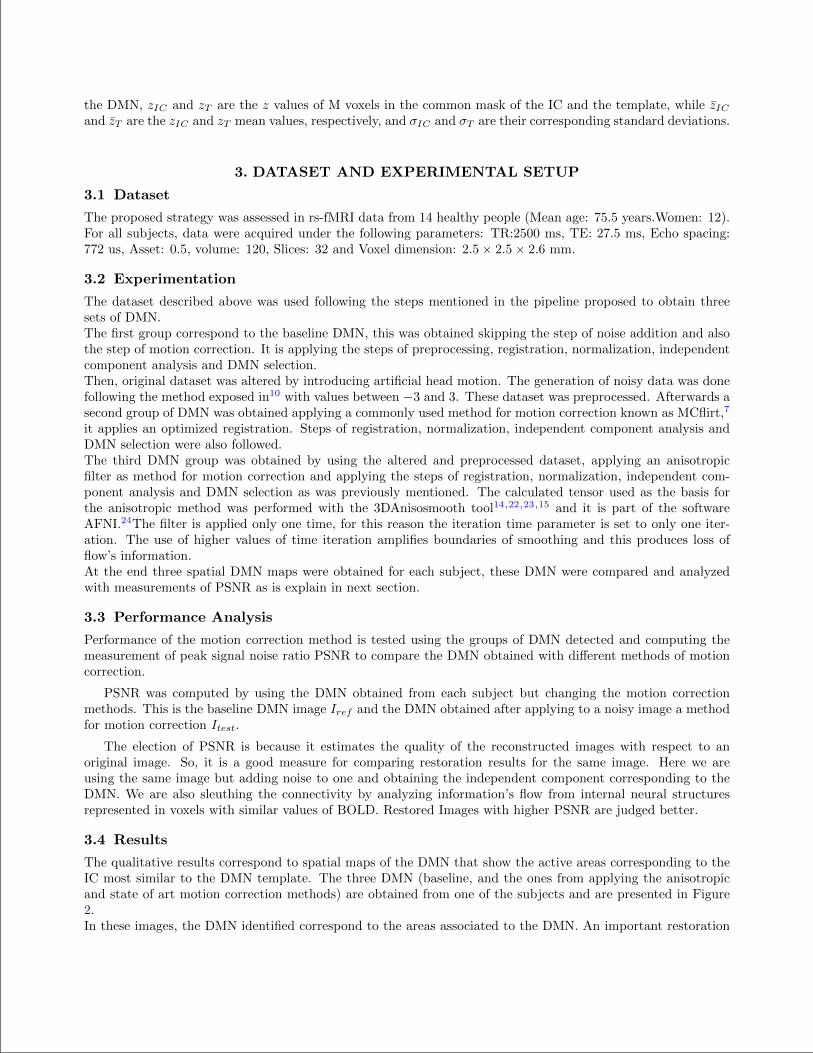
The qualitative results correspond to spatial maps of the DMN that show the active areas corresponding to theIC most similar to the DMN template. The three DMN (baseline, and the ones from applying the anisotropicand state of art motion correction methods) are obtained from one of the subjects and are presented in Figure2.In these images, the DMN identified correspond to the areas associated to the DMN. An important restoration
of the mPFC is observed when the anisotropic method is applied. Region of PCC presents also good restorationof activation information after the anisotropic method. In axial slices can be observed that activation Bold signalin inferior parietal lobules apparently does not have a good restoration.
Figure 2: DMN obtained after the experimentation with data from a subject. The column a shows the sagittaland axial views of the DMN obtained as baseline. It is without noise and without apply any motion correctionmethod. The column b belong to the sagittal and axial views of the DMN obtained after introducing artificialhead movement and also applying the state of art method for motion correction (Mcflirt). The third column cbelong to the DMN obtained after introduce artificial noise and applying the anisotropic approach for motioncorrection. A better detection of DMN is observed after applying the anisotropic method.
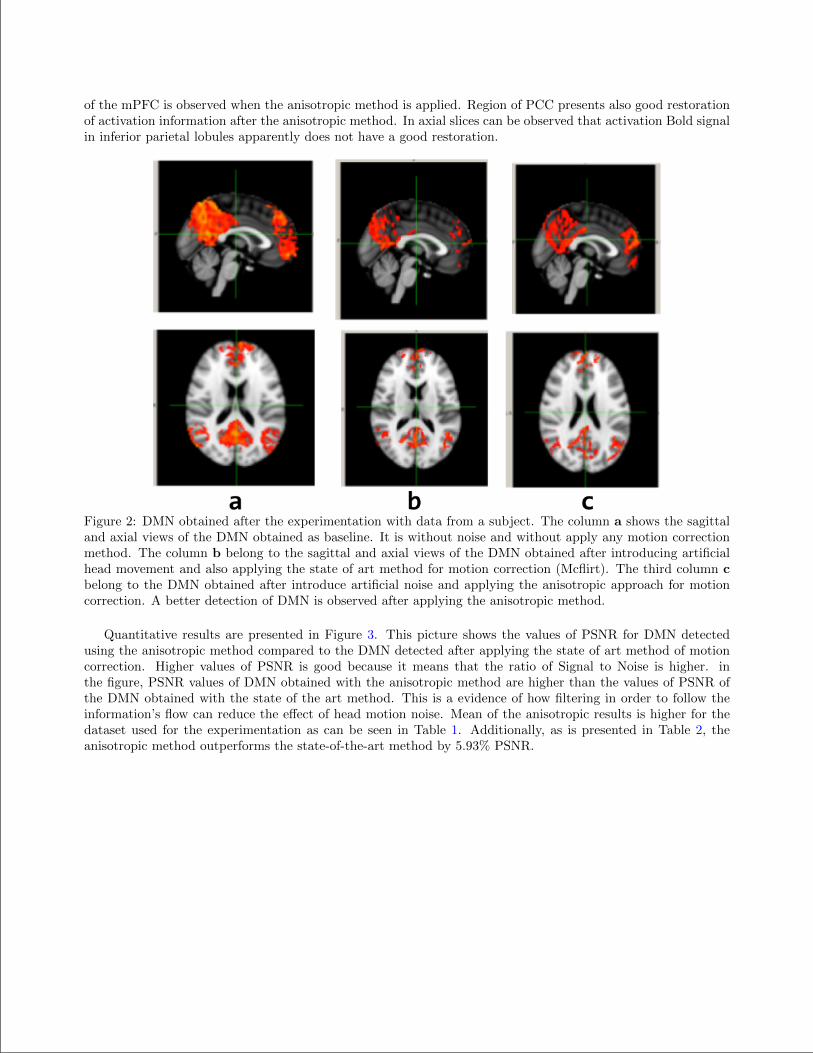
Quantitative results are presented in Figure 3. This picture shows the values of PSNR for DMN detectedusing the anisotropic method compared to the DMN detected after applying the state of art method of motioncorrection. Higher values of PSNR is good because it means that the ratio of Signal to Noise is higher. inthe figure, PSNR values of DMN obtained with the anisotropic method are higher than the values of PSNR ofthe DMN obtained with the state of the art method. This is a evidence of how filtering in order to follow theinformation’s flow can reduce the effect of head motion noise. Mean of the anisotropic results is higher for thedataset used for the experimentation as can be seen in Table 1. Additionally, as is presented in Table 2, theanisotropic method outperforms the state-of-the-art method by 5.93% PSNR.
Figure 3: PSNR obtained for two groups of DMN, one obtained applying the anisotropic method for motioncorrection and the other group obtained applying the method of optimized registration of the state of the art.
Table 1: Mean of PSNR for the applied methodsMean Anisotropic Mean state of art
PSNR 29.35 27.83
Table 2: Percentage of performanceMeasurement PercentagePSNR 5.93
4. DISCUSSION AND CONCLUSIONS
The aim of this study was to propose a method for motion correction based on anisotropic filtering of thefunctional data and compare the results of methods for motion correction and its utility for the detection of theDMN. Data from the performance of various methods for motion correction (like a standard method and theproposed one using anisotropic filter) are compared and results of the transformations performed are presented.
A method for enhance the detection of the DMN was proposed inspired on the organization of neural cellsin the basal ganglia. The method was tested and compared the results with measurement of PSNR. The resultsshow an improvement in the detection, less variability in the response of the DMN and a better detection byapplying the anisotropic method. Results obtained show that the anisotropic approach outperforms the state-of-the-art method by 5.93% PSNR. The contribution presented is a model of how information is propagatedand the use of this to improve the DMN restoration when some motion perturbs the network. This analysis isinspired by the fact that the nervous systems reduces dimensionality by structuring information hierarchicallyand anisotropically. This simple modification results to be very efficient in terms of recovery of the networkperturbed by artifacts caused by head movement.
ACKNOWLEDGMENTS
We are grateful to Norberto Malpica and Eva Manzanedo from laimbio, Universidad Rey Juan Carlos III, Spain,who gave very friendly assistance taking and sharing the images from the 14 people used in this study.
REFERENCES
[1] Ogawa, S., Lee, T. M., Kay, A. R., and Tank, D. W., “Brain magnetic resonance imaging with contrastdependent on blood oxygenation.,” Proceedings of the National Academy of Sciences of the United States ofAmerica 87(24), 9868–72 (1990).
[2] Power, J. D., Mitra, A., Laumann, T. O., Snyder, A. Z., Schlaggar, B. L., and Petersen, S. E., “Methods todetect, characterize, and remove motion artifact in resting state fMRI,” NeuroImage 84, 320–341 (2013).
[3] Bruckner, R. Andrews, J. S. D., “The Brain’s Default Network,” 38, 1–38 (2008).
[4] Pardoe, H. R., Hiess, R. K., and Kuzniecky, R., “Motion and morphometry in clinical and nonclinicalpopulations,” (2016).
[5] Pujol, J., Macia, D., Blanco-Hinojo, L., Martınez-Vilavella, G., Sunyer, J., de la Torre, R., Caixas, A.,Martın-Santos, R., Deus, J., and Harrison, B. J., “Does motion-related brain functional connectivity reflectboth artifacts and genuine neural activity?,” NeuroImage 101, 87–95 (2014).
[6] Power, J. D., Schlaggar, B. L., and Petersen, S. E., “Recent progress and outstanding issues in motioncorrection in resting state fMRI,” (2014).
[7] Jenkinson, M., B. P. B. J. M. and Smith, S. M., “Improved optimisation for the robust and accurate linearregistration and motion correction of brain images,” NeuroImage , 825–841 (2002).
[8] Reimann, M. W., Nolte, M., Scolamiero, M., Turner, K., Perin, R., Chindemi, G., D lotko, P., Levi, R., Hess,K., and Markram, H., “Cliques of neurons bound into cavities provide a missing link between structure andfunction,” Frontiers in Computational Neuroscience 11, 48 (2017).
[9] Charara, A., Sidibe, M., and Smith, Y., “Basal Ganglia Circuitry and Synaptic Connectivity,” SurgicalTreatment of Parkinson’s Disease and Other Movement Disorders , 19–39 (2003).
[10] Drobnjak, I., “Fmri simulator: Development and applications,” (2007).
[11] Smith, S. M., “Fast robust automated brain extraction,” Human brain mapping 17(3), 143–155 (2002).
[12] Binnewijzend, M. A. A., Schoonheim, M. M., Wink, A. M., Flier, W. M. V. D., Tolboom, N., Adriaanse,S. M., Damoiseaux, J. S., Scheltens, P., Berckel, B. N. M. V., and Barkhof, F., “Resting-state fMRI changesin Alzheimer’s disease and mild cognitive impairment,” NBA 33(9), 2018–2028 (2011).
[13] Griffanti, L., Rolinski, M., Szewczyk-krolikowski, K., Menke, R. A., Filippini, N., Jenkinson, M., Hu, M.T. M., and Mackay, C. E., “Challenges in the reproducibility of clinical studies with resting state fMRI: Anexample in early Parkinson’s disease,” 1–13 (2016).
[14] Weickert, J. and Scharr, H., “A Scheme for Coherence-Enhancing Diffusion Filtering with Optimized Ro-tation Invariance,” (2000).
[15] Ding, Z., Gore, J. C., and Anderson, A. W., “Reduction of noise in diffusion tensor images using anisotropicsmoothing,” Magnetic Resonance in Medicine (2005).
[16] Mazziotta, J. C., Toga, A. W., Evans, A., Fox, P., and Lancaster, J., “A probabilistic atlas of the humanbrain: Theory and rationale for its development: The international consortium for brain mapping (icbm),”Neuroimage 2(2), 89–101 (1995).
[17] Jenkinson, M. and Smith, S., “A global optimisation method for robust affine registration of brain images,”Medical Image Analysis , 5(2):143–156 (2001).
[18] Baquero, K., Gomez, F., Cifuentes, C., Guldenmund, P., Demertzi, A., Vanhaudenhuyse, A., Gosseries, O.,Tshibanda, J.-F., Noirhomme, Q., Laureys, S., Soddu, A., and Romero, E., “A multiscale method for arobust detection of the default mode network,” (2013).
[19] Liu, D., “Clustering analysis of default mode network in fmri data,” IEEE , 151–155 (2014).
[20] Kelly, R. E., Alexopoulos, G. S., Wang, Z., Gunning, F. M., Murphy, C. F., Morimoto, S. S., Kanellopoulos,D., Jia, Z., Lim, K. O., and Hoptman, M. J., “Visual inspection of independent components: Defining aprocedure for artifact removal from fmri data,” Neuroscience Methods 15(1892), 233–245 (2010).

[21] Wang, D., Kong, Y., Chu, W. C. W., Tam, C. W. C., Lam, L. C. W., Wang, Y., Northoff, G., Mok, V.C. T., Wang, Y., and Shi, L., “Generation of the probabilistic template of default mode network derivedfrom resting-state fMRI,” IEEE Transactions on Biomedical Engineering (2014).
[22] Weickert, J., “Coherence-Enhancing Diffusion Filtering,” International Journal of Computer Vision 31(23),111–127 (1999).
[23] Gerig, G., Kubler, O., and Jolesz, F. A., “Nonlinear Anisotropic Filtering of MRI Data,” 1(2) (1992).
[24] Cox, R., “Afni: Software for analysis and visualization of functional magnetic resonance neuroimages,”29:162–173 (1996).
Bibliography
[1] A. Charara, M. Sidibe, and Y. Smith, “Basal Ganglia Circuitry and Synaptic Con-
nectivity,” Surgical Treatment of Parkinson’s Disease and Other Movement Disorders.
Humana Press Inc., pp. 19–39, 2003.
[2] F. L. Mastaglia and W. M. Carroll, “Evoked potentials in neurological diagnosis,” Bri-
tish Medical Journal(Clinical research ed.), vol. 285, pp. 1678–1679, 1982.
[3] B. Hans, “Uber das Elektrenkephalogramm des Menschen,” Archiv fur Psychiatrie und
Nervenkrankheite, pp. 87:527–570, 1929.
[4] S. M. Smith, P. T. Fox, K. L. Miller, D. C. Glahn, P. M. Fox, C. E. Mackay, N. Filippini,
K. E. Watkins, R. Toro, A. R. Laird, and C. F. Beckmann, “Correspondence of the
brain’s functional architecture during activation and rest,” Proceedings of the National
Academy of Sciences of the United States of America, vol. 106, pp. 13 040–13 045, 2009.
[5] M. H. Lee, C. D. Smyser, and J. S. Shimony, “Resting State fMRI: A Review of Methods
and Clinical Applications,” AJNR. American journal of neuroradiology, p. 1866–1872,
2013.
[6] Y. I. Sheline and M. E. Raichle, “Resting State Functional Connectivity in Preclinical
Alzheimer’s Disease,” Biological Psychiatry, vol. 74, no. 5, pp. 340–347, 2012.
[7] J. S. D. Bruckner, R. Andrews, “The Brain’s Default Network:Anatomy, Function, and
Relevance to Disease,” Annals of the New York Academy of Sciences, vol. 38, pp. 1–38,
2008.
[8] A. Demertzi, F. Gomez, J. S. Crone, A. Vanhaudenhuyse, L. Tshibanda, Q. Noirhomme,
M. Thonnard, V. Charland-Verville, M. Kirsch, S. Laureys, and A. Soddu, “Multiple
fMRI system-level baseline connectivity is disrupted in patients with consciousness al-
terations,” Cortex, vol. 52, no. 1, pp. 35–46, 2014.
[9] K. Baquero, F. Gomez, C. Cifuentes, P. Guldenmund, A. Demertzi, A. Vanhaudenhuyse,
O. Gosseries, J.-F. Tshibanda, Q. Noirhomme, S. Laureys, A. Soddu, and E. Romero,
“A multiscale method for a robust detection of the default mode network,” pp. 892 208–
892 209, 2013.
36 Bibliography
[10] S.-g. Kim and K. Ugurbil, “Functional magnetic resonance imaging of the human brain,”
Journal of Neuroscience Methods, vol. 74, pp. 229–243, 1997.
[11] V. B. Mountcastle, “Modality and topographic properties of single neurons of cat’s
somatic sensory cortex,” Journal of Neurophysiology, vol. 20, no. 4, pp. 408–434, 1957.
[12] A. DG, The anatomical organization of the central nervous system. New York: McGraw-
Hill 4th Edition ER Kandel, JH Schwartz, TM Jessell, Eds., 2000.
[13] C. Roy and C. Sherrington, “On the Regulation of the Blood-Supply of the Brain,” The
Journal of physiology, vol. 11, no. 1-2, pp. 85–158, 1890.
[14] S. Ogawa, T. M. Lee, A. R. Kay, and D. W. Tank, “Brain magnetic resonance imaging
with contrast dependent on blood oxygenation,” Proceedings of the National Academy
of Sciences of the United States of America, vol. 87, no. 24, pp. 9868–72, 1990.
[15] M. E. Raichle and A. Z. Snyder, “A default mode of brain function: A brief history of
an evolving idea,” NeuroImage, vol. 2, no. 4, pp. 1083–1090, 2007.
[16] J. D. Power, B. L. Schlaggar, and S. E. Petersen, “Recent progress and outstanding
issues in motion correction in resting state fMRI,” NeuroImage, vol. 105, no. Supplement
C, pp. 536 – 551, 2015.
[17] Brain Voyager Manual: Organizing, Processing and Analyzing fMRI data using Brain
Voyager, Institute for Imaging and Analytical Technologies, 2008. [Online]. Available:
http://www.i2at.msstate.edu/pdf/I2AT Brain Voyager Manual Rev11.19.pdf
[18] T. Krings, M. Reinges, S. Erberich, S. Kemeny, V. Rohde, U. Spetzger, M. Korinth,
K. Willmes, J. Gilsbach, and A. Thron, “Functional MRI for presurgical planning pro-
blems, artifacts ans solution strategies,” Journal of Neurology Neuro Surgery and Psy-
chiatry, vol. 70, no. 6, pp. 749–760, 2001.
[19] K. Friston, S. Williams, R. Howard, R. Frackowiak, and R. Turner, “Movement-Related
effects in fMRI time-series,” Magnetic Resonance in Medicine, vol. 35, pp. 346 – 355,
1996.
[20] J. D. Power, A. Mitra, T. O. Laumann, A. Z. Snyder, B. L. Schlaggar, and S. E. Petersen,
“Methods to detect, characterize, and remove motion artifact in resting state fMRI,”
NeuroImage, vol. 84, pp. 320–341, 2013.
[21] A. X. Patel, P. Kundu, M. Rubinov, P. S. Jones, P. E. Vertes, K. D. Ersche, J. Suckling,
and E. T. Bullmore, “A wavelet method for modeling and despiking motion artifacts
from resting-state fMRI time series,” NeuroImage, vol. 95, pp. 287–304, 2014.
Bibliography 37
[22] R. Kelly, G. Alexopoulos, Z. Wang, F. Gunning-Dixon, C. Murphy, S. Morimoto, T. Ka-
nellopoulos, Z. Jia, K. O Lim, and M. Hoptman, “Visual inspection of independent
components: Defining a procedure for artifact removal from fMRI data,” Journal of
Neuroscience Methods, vol. 189, pp. 233–45, 04 2010.
[23] L. Griffanti, G. Salimi-Khorshidi, C. F. Beckmann, E. J. Auerbach, G. Douaud, C. E.
Sexton, E. Zsoldos, K. P. Ebmeier, N. Filippini, C. E. Mackay, S. Moeller, J. Xu, E. Ya-
coub, G. Baselli, K. Ugurbil, K. L. Miller, and S. M. Smith, “ICA-based artefact removal
and accelerated fMRI acquisition for improved resting state network imaging,” Neuro-
Image, vol. 95, pp. 232–247, 2014.
[24] H. R. Pardoe, R. K. Hiess, and R. Kuzniecky, “Motion and morphometry in clinical
and non clinical populations,” NeuroImage, vol. 135, no. Supplement C, pp. 177 – 185,
2016.
[25] J. Pujol, D. Macia, L. Blanco-Hinojo, G. Martınez-Vilavella, J. Sunyer, R. de la Torre,
A. Caixas, R. Martın-Santos, J. Deus, and B. J. Harrison, “Does motion-related brain
functional connectivity reflect both artifacts and genuine neural activity?” NeuroImage,
vol. 101, pp. 87–95, 2014.
[26] N. J. Herrero M.T, Barcia C, “Functional anatomy of thalamus and basal ganglia,”
Child’s Nervous System, vol. 18, p. 386–404, 2002.
[27] H. A. Riley, An atlas of the Basal ganglia brain stern and spinal cord based on Myelin
stained material. New York: Hafner, 1960.
[28] D. Greene, T. Laumann, J. Dubis, S. Ihnen, M. Neta, J. Power, J. Pruett, K. Black,
and B. Schlaggar, “Developmental changes in the organization of functional connections
between the basal ganglia and cerebral cortex,” Journal of Neuroscience, vol. 34, no. 17,
pp. 5842–5854, 2014.
[29] A. Nambu, “A new dynamic model of the cortico-basal ganglia loop,” in Brain Mecha-
nisms for the Integration of Posture and Movement, ser. Progress in Brain Research.
Elsevier, 2004, vol. 143, no. Supplement C, pp. 461 – 466.
[30] J. Park, “Movement Disorders Following Cerebrovascular Lesion in the Basal Ganglia
Circuit,” JMD, Journal of movement disorder, pp. 71–79, 2016.
[31] G. Chevalier and J.-M. M. Deniau, “Disinhibition as a basic process in the expres-
sion of striatal functions II. The striato-nigral influence on thalamocortical cells of the
ventromedial thalamic nucleus,” Brain Research, vol. 334, no. 2, pp. 227 – 233, 1985.
[32] P. Perona and J. Malik, “Scale-Space and Edge Detection Using Anisotropic Diffusion,”
IEEE Transactions on pattern analysis and machine intelligence, vol. 12, no. 7, 1990.
38 Bibliography
[33] J. Weickert, Anisotropic Diffusion in Image Processing. Stuttgart: B. G. Teubner,
1998.
[34] U. Weickert, “Coherence-Enhancing Diffusion Filtering,” International Journal of Com-
puter Vision, vol. 31, no. 23, pp. 111–127, 1999.
[35] J. Weickert and H. Scharr, “A Scheme for Coherence-Enhancing Diffusion Filtering
with Optimized Rotation Invariance,” Journal of Visual Communication and Image
Representation, vol. 13, no. 1, pp. 103 – 118, 2002.
[36] G. Gerig, O. Kubler, and F. A. Jolesz, “Nonlinear anisotropic filtering of MRI data,”
IEEE Transactions on Medical Imaging, vol. 11, no. 2, 1992.
[37] Z. Ding, J. C. Gore, and A. W. Anderson, “Reduction of noise in diffusion tensor images
using anisotropic smoothing,” Magnetic Resonance in Medicine, vol. 53, no. 2, pp. 485–
490, 2005.
[38] X.-n. Zuo and X.-x. Xing, “Effects of Non-Local Diffusion on Structural MRI Preproces-
sing and Default Network Mapping: Statistical Comparisons with Isotropic/Anisotropic
Diffusion,” PLOS ONE, vol. 6, no. 10, pp. 1–9, 2011.
[39] I. Drobnjak, “Mri simulator: Development and applications,” Ph.D. dissertation, Uni-
versity of Oxford, 2007.
[40] S. M. Smith, “Fast robust automated brain extraction,” Human brain mapping, vol. 17,
no. 3, pp. 143–155, 2002.
[41] M. A. Binnewijzend, M. M. Schoonheim, E. Sanz-Arigita, A. M. Wink, W. M. van der
Flier, N. Tolboom, S. M. Adriaanse, J. S. Damoiseaux, P. Scheltens, B. N. van Berckel,
and F. Barkhof, “Resting-state fMRI changes in Alzheimer’s disease and mild cognitive
impairment,” NBA, vol. 33, no. 9, pp. 2018–2028, 2011.
[42] L. Griffanti, “Effective artifact removal in resting state fMRI data improves detection
of DMN functional connectivity alteration in Alzheimer’s disease,” Frontiers in Human
Neuroscience, vol. 9, no. August, pp. 1–11, 2015.
[43] J. C. Mazziotta, A. W. Toga, A. Evans, P. Fox, and J. Lancaster, “A probabilistic
atlas of the human brain: Theory and rationale for its development: The international
consortium for brain mapping (icbm),” Neuroimage, vol. 2, no. 2, pp. 89–101, 1995.
[44] M. Jenkinson, P. Bannister, J. M. Brady, and S. M. Smith, “Improved Optimisation for
the Robust and Accurate Linear Registration and Motion Correction of Brain Images,”
NeuroImage, pp. 825–841, 2002.
Bibliography 39
[45] M. Jenkinson and S. Smith, “A global optimisation method for robust affine registration
of brain images,” Medical Image Analysis, pp. 5(2):143–156, 2001.
[46] D. Liu, “Clustering analysis of default mode network in fMRI data,” IEEE, pp. 151–155,
2014.
[47] C. F. Beckmann and S. M. Smith, “Probabilistic independent component analysis
for functional magnetic resonance imaging,” IEEE Transactions on Medical Imaging,
vol. 23, no. 2, pp. 137–152, Feb 2004.
[48] D. Wang, Y. Kong, W. C. W. Chu, C. W. C. Tam, L. C. W. Lam, Y. Wang, G. Northoff,
V. C. T. Mok, Y. Wang, and L. Shi, “Generation of the probabilistic template of de-
fault mode network derived from resting-state fMRI,” IEEE Transactions on Biomedical
Engineering, 2014.
Recommended