Embed Size (px)
Citation preview
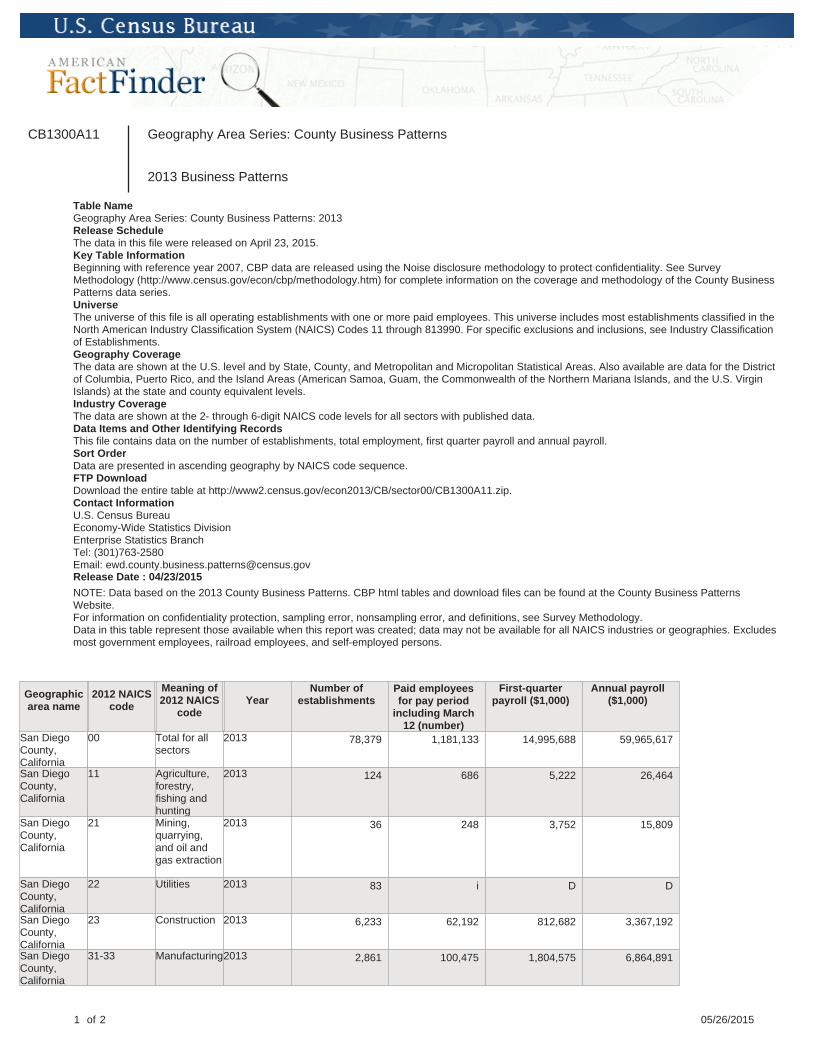
CB1300A11 Geography Area Series: County Business Patterns
2013 Business Patterns
Table NameGeography Area Series: County Business Patterns: 2013Release ScheduleThe data in this file were released on April 23, 2015.Key Table InformationBeginning with reference year 2007, CBP data are released using the Noise disclosure methodology to protect confidentiality. See SurveyMethodology (http://www.census.gov/econ/cbp/methodology.htm) for complete information on the coverage and methodology of the County BusinessPatterns data series.UniverseThe universe of this file is all operating establishments with one or more paid employees. This universe includes most establishments classified in theNorth American Industry Classification System (NAICS) Codes 11 through 813990. For specific exclusions and inclusions, see Industry Classificationof Establishments.Geography CoverageThe data are shown at the U.S. level and by State, County, and Metropolitan and Micropolitan Statistical Areas. Also available are data for the Districtof Columbia, Puerto Rico, and the Island Areas (American Samoa, Guam, the Commonwealth of the Northern Mariana Islands, and the U.S. VirginIslands) at the state and county equivalent levels.Industry CoverageThe data are shown at the 2- through 6-digit NAICS code levels for all sectors with published data.Data Items and Other Identifying RecordsThis file contains data on the number of establishments, total employment, first quarter payroll and annual payroll.Sort OrderData are presented in ascending geography by NAICS code sequence.FTP DownloadDownload the entire table at http://www2.census.gov/econ2013/CB/sector00/CB1300A11.zip.Contact InformationU.S. Census BureauEconomy-Wide Statistics DivisionEnterprise Statistics BranchTel: (301)763-2580Email: [email protected] Date : 04/23/2015
NOTE: Data based on the 2013 County Business Patterns. CBP html tables and download files can be found at the County Business PatternsWebsite.For information on confidentiality protection, sampling error, nonsampling error, and definitions, see Survey Methodology.Data in this table represent those available when this report was created; data may not be available for all NAICS industries or geographies. Excludesmost government employees, railroad employees, and self-employed persons.
Geographicarea name
2012 NAICScode
Meaning of2012 NAICS
codeYear
Number ofestablishments
Paid employeesfor pay period
including March12 (number)
First-quarterpayroll ($1,000)
Annual payroll($1,000)
San DiegoCounty,California
00 Total for allsectors
2013 78,379 1,181,133 14,995,688 59,965,617
San DiegoCounty,California
11 Agriculture,forestry,fishing andhunting
2013 124 686 5,222 26,464
San DiegoCounty,California
21 Mining,quarrying,and oil andgas extraction
2013 36 248 3,752 15,809
San DiegoCounty,California
22 Utilities 2013 83 i D D
San DiegoCounty,California
23 Construction 2013 6,233 62,192 812,682 3,367,192
San DiegoCounty,California
31-33 Manufacturing2013 2,861 100,475 1,804,575 6,864,891
1 of 2 05/26/2015

Geographicarea name
2012 NAICScode
Meaning of2012 NAICS
codeYear
Number ofestablishments
Paid employeesfor pay period
including March12 (number)
First-quarterpayroll ($1,000)
Annual payroll($1,000)
San DiegoCounty,California
42 Wholesaletrade
2013 4,347 62,482 1,391,796 5,154,639
San DiegoCounty,California
44-45 Retail trade 2013 9,297 145,051 948,427 3,914,398
San DiegoCounty,California
48-49 Transportation andwarehousing
2013 1,577 22,530 220,306 921,879
San DiegoCounty,California
51 Information 2013 1,356 35,242 740,133 3,117,128
San DiegoCounty,California
52 Finance andinsurance
2013 4,811 51,448 1,146,193 4,089,023
San DiegoCounty,California
53 Real estateand rentaland leasing
2013 5,549 28,140 357,473 1,415,343
San DiegoCounty,California
54 Professional,scientific, andtechnicalservices
2013 12,881 132,252 2,473,456 10,117,487
San DiegoCounty,California
55 Managementof companiesandenterprises
2013 432 24,210 463,955 1,955,290
San DiegoCounty,California
56 Administrativeand supportand wastemanagementandremediationservices
2013 4,201 91,713 767,389 3,182,190
San DiegoCounty,California
61 Educationalservices
2013 1,332 31,077 271,572 1,125,013
San DiegoCounty,California
62 Health careand socialassistance
2013 8,643 152,207 1,976,818 8,207,429
San DiegoCounty,California
71 Arts,entertainment, andrecreation
2013 1,111 32,502 244,836 1,102,204
San DiegoCounty,California
72 Accommodation and foodservices
2013 7,026 150,487 739,463 3,100,714
San DiegoCounty,California
81 Otherservices(except publicadministration)
2013 6,311 52,226 360,184 1,524,879
San DiegoCounty,California
99 Industries notclassified
2013 168 c 1,010 4,559
i 5,000 to 9,999 employees
D Withheld to avoid disclosing data for individual companies; data are included in higher level totals
c 100 to 249 employees
Source: U.S. Census Bureau, 2013 County Business Patterns.
2 of 2 05/26/2015