Embed Size (px)
Citation preview

8/3/2019 2008HeinzAR
http://slidepdf.com/reader/full/2008heinzar 1/108
Growing Faster Around the World
2008 H. J. Heinz Company Annual Report
8/3/2019 2008HeinzAR
http://slidepdf.com/reader/full/2008heinzar 2/108
H. J. Heinz Company and Subsidiaries
2008 2007
(DOLLARS IN THOUSANDS, EXCEPT PER SHARE AMOUNTS) (52 WEEKS) (52 WEEKS)Sales $10,070,778 $ 9,001,630
Operating income 1,568,967 1,446,715
Income from continuing operations 844,925 791,602
Net income (1) 844,925 785,746
Per common share amounts:
Income from continuing operations - diluted $ 2.63 $ 2.38
Net income - diluted 2.63 2.36
Cash dividends 1.52 1.40
Cash from operations $ 1,188,303 $ 1,062,288Capital expenditures 301,588 244,562
Proceeds from disposals of property, plant, and equipment 8,531 60,661
Depreciation and amortization 288,897 266,197
Property, plant and equipment, net 2,104,713 1,998,153
Cash and cash equivalents $ 617,687 $ 652,896
Cash conversion cycle (days) 49 49
Total debt 5,183,654 4,881,884
Shareholders’ equity 1,887,820 1,841,683
Average common shares outstanding - diluted 321,717 332,468Return on average invested capital (“ROIC”) 16.8% 15.8%
Debt/invested capital 73.3% 72.6%
Dividend/share $ 1.52 $ 1.40
Share repurchases $ 580,707 $ 760,686
(1) Net income in Fiscal Year 2007 includes a loss from discontinued operations of $5.9 million.
See Management’s Discussion and Analysis for details.
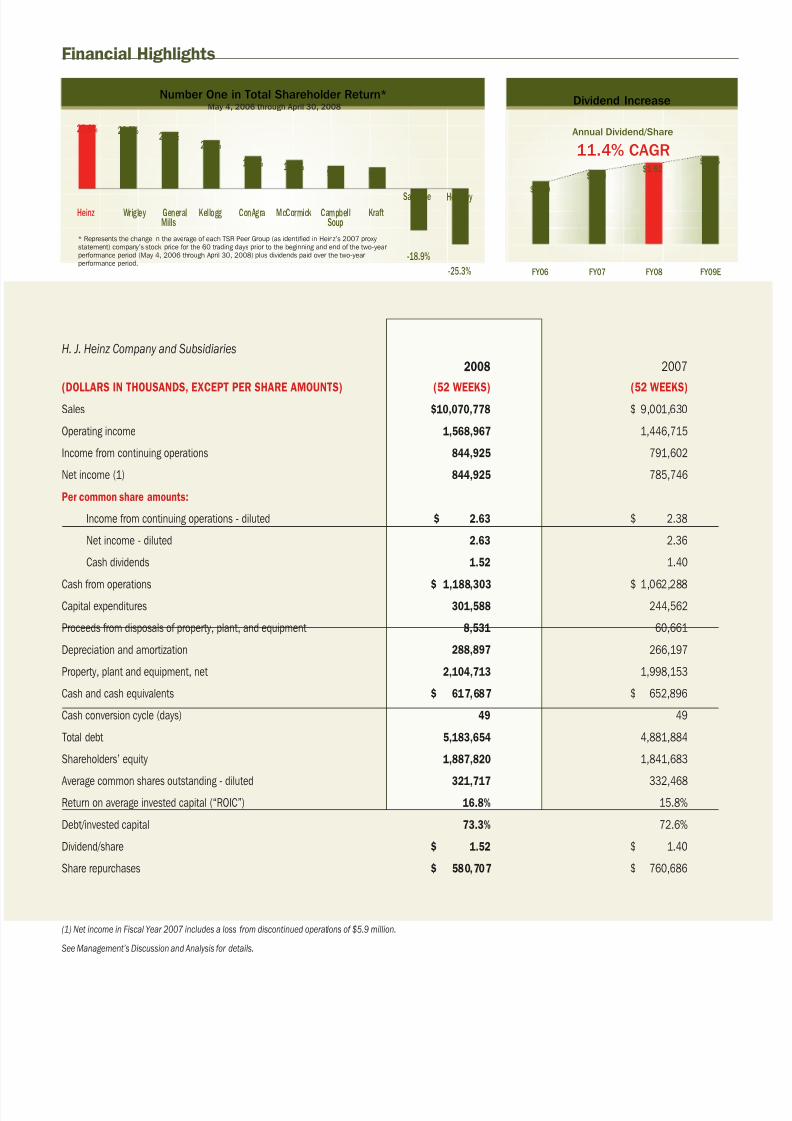
$1.20
FY06 FY07 FY08 FY09E
Dividend Increase
Annual Dividend/Share
11.4% CAGR
$1.40$1.52
$1.66
Heinz
27.6% 26.7%24.6%
21.0%
14.0% 12.4%9.9% 9.3%
-18.9%
-25.3%
Number One in Total Shareholder Return*May 4, 2006 through April 30, 2008
Wrigley GeneralMills
Kellogg ConAgra McCormick CampbellSoup
KraftSara Lee Hershey
* Repr esents the change in the aver age of each TSR Peer Gr oup (as identified in Heinz’s 2007 pr oxy
statement) compan y’s stock pr ice for the 60 tr ading days pr ior to the beginning and end of the two-year
per for mance per iod (May 4, 2006 thr ough Apr il 30, 2008) plus dividends paid over the two-year
per for mance per iod.
Financial Highlights
8/3/2019 2008HeinzAR
http://slidepdf.com/reader/full/2008heinzar 3/108
1
HEINZ’S FISCAL 2008
S ALES W ERE
THE HIGHEST
IN OUR HISTORY .William R. JohnsonChairman, President and
Chief Executive Officer
DEAR FELLOW SHAREHOLDER :
Heinz delivered a record year of growth in Fiscal 2008,
surpassing the top end of our earnings per share outlook
while achieving record sales of $10.1 billion. Organic sales
growth (volume plus price) of 6.9 percent was our best in at
least 15 years. Our financial performance was all the more
significant given the unprecedented increases in
commodity and energy costs.
The Company’s momentum was broad based, with sustained
success in North American Consumer Products, robust growth
in the Pacific, good performance in Europe, and a 25 percent
increase in Emerg-
ing Market sales.
Importantly, we
delivered these
top-tier results
while reinvesting
in our brands,
people, facilities,
business systems,
and processes.
Heinz’s growth is determined by how well our brand innovation
and marketing investment connects with consumers. On this
score, we were very successful, introducing more than 200
new products across the Heinz world in Fiscal 2008, sup-
ported by a double-digit increase in marketing investment.
Consumers enthusiastically embraced our initiatives
resulting in our strong top-line performance.
W E H AVE SUCCESSFULLY R EPOSITIONED
THE COMPANY FOR F ASTER GROWTH
Over the past five-plus years, we have focused Heinz around
the brands, categories, and geographies where we have
clear competitive advantages to enable faster growth in
a rapidly changing landscape.
We now have a focused collection of fifteen strong and
growing brands that each drive at least $100 million in sales
and account for approximately 70 percent of our annual
revenue. The “jewel in the crown” is the nearly four billion
dollar Heinz® brand, which commands extraordinary reach
across all of our categories and most of the world.
These brands have benefited from both our steadfast
emphasis on using market research to better understand our
consumers, and a multi-million dollar investment in our
Global Innovation
and Quality Centerin Pittsburgh.
During the past
five years, we also
expanded our
presence in fast-
growing Emerging
Markets, including
joint ventures in
China and Russia in 2004 and 2005, respectively, which
are both now wholly owned and growing faster than theCompany average.
While improving our business mix, we also strengthened our
managerial talent with 75 percent of our top one hundred
leaders new to their jobs within the past five years and 30
percent new to the Company. Through changes to our
incentive compensation plans, our people are now more
closely aligned with the metrics necessary for creating
shareholder value.
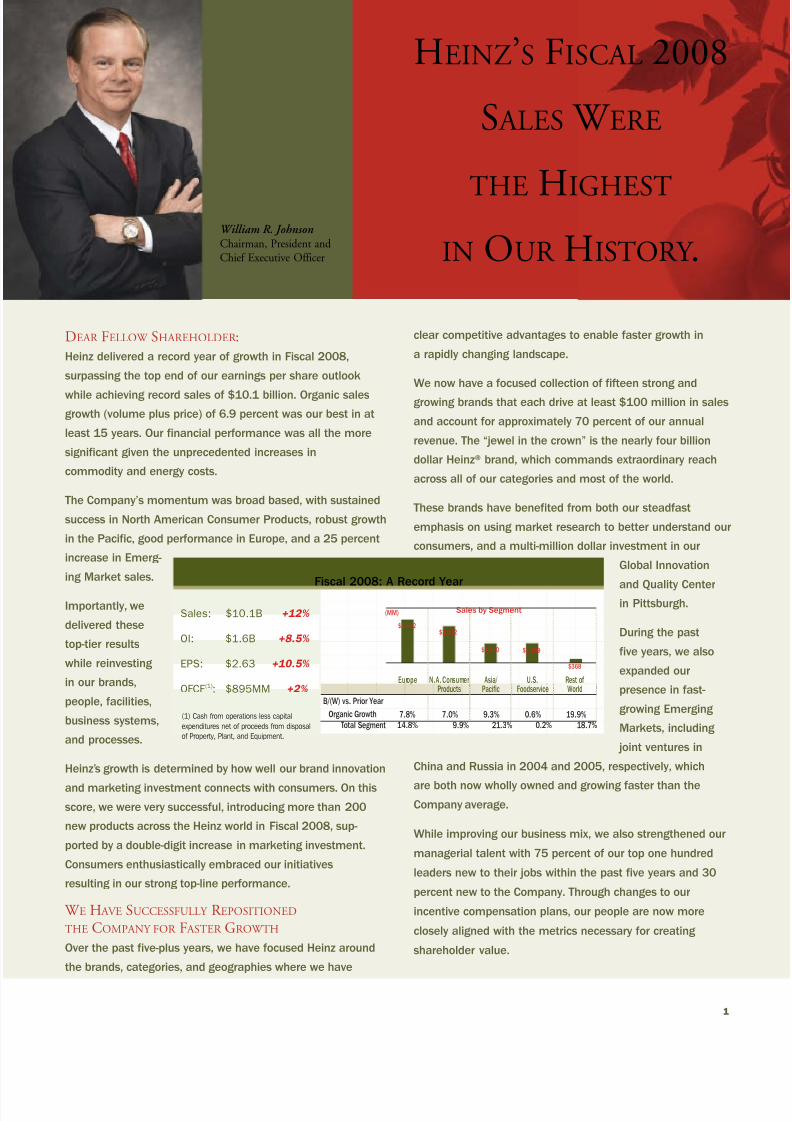
Fiscal 2008: A Record Year
Sales: $10.1B +12%
OI: $1.6B +8.5%
EPS: $2.63 +10.5%
OFCF (1): $895MM +2%
(1) Cash from operations less capital
expenditures net of proceeds from disposal
of Property, Plant, and Equipment.
Europe N.A. ConsumerProducts
Asia/ Pacific
U.S.Foodservice
Rest of World
7.8% 7.0% 9.3% 0.6% 19.9%
$3,532
(MM)
$3,012
$1,600 $1,559
$368
14.8%
Organic Growth
B/(W) vs. Prior Year
Total Segment 9.9% 21.3% 0.2% 18.7%
Sales by Segment
8/3/2019 2008HeinzAR
http://slidepdf.com/reader/full/2008heinzar 4/108
2 H . J . H E I N Z A N N U A L R E P O R T 2 0 0 8
Finally, we invested in the tools our people need to work more
effectively and efficiently, including the phased expansion of
our SAP enterprise resource planning software that will
continue through Fiscal 2009.
HEINZ OVER -DELIVERED THE FY07-08
SUPERIOR V ALUE AND GROWTH PLAN
Fiscal 2008 marked the conclusion of our two-year Superior
Value and Growth Plan, which we announced in June 2006.
I am pleased to report that we met or exceeded virtually
every target for growth and productivity in our ambitious plan.
We introduced hundreds of new products while increasing our
investment in R&D and marketing by 39 percent and 42 per-
cent respectively over the two years. We fueled these invest-ments with nearly $550 million in productivity savings made
possible by our tighter brand and category focus.
The capstone of this plan was achieving the No. 1 position
in Total Shareholder Return versus our peer group for the
two-year period. (See chart on inside front cover.)
During this time, Heinz generated nearly $1.8 billion in operat-
ing free cash flow, most of which we returned to shareholders
through the repurchase of more than $1 billion of our shares
and a 27 percent increase in our dividend. In fact, since Fiscal2003, we have returned in excess of $6.5 billion to our own-
ers. Our approximately 60 percent dividend payout ratio,
meanwhile, remains among the highest in the Consumer
Packaged Goods industry.
HEINZ IS AT THE LEADING EDGE OF CONSUMER
TRENDS TO DRIVE FUTURE GROWTH
This is a time of significant challenge — and even greater
opportunity — for the food industry.
Like the late 1970s and
early 1980s, we are
dealing with the
pressures of significant
cost inflation, along with
weak economies and
declining consumer
sentiment. However,
several significant
countervailing forces
exist today, including
rapid growth in
Emerging Markets and
the accelerating consumer interest in higher-margin Health
and Wellness foods.
More consumers are opting for healthier lifestyles and are
looking to food to help them achieve their goal. Our portfolio
is well suited to the opportunity, given our infant/nutrition and
weight management capabilities, in addition to our leading
positions in tomato-based foods, beans, soups, and other
inherently healthy products.
In the crucial area of infant/nutrition, we possess two leading
brands — Heinz® and Plasmon® — and we are buildingincreased global R&D capabilities in this category with an
expanded R&D Center of Excellence in Milan, Italy.
We are meeting consumer demand for great tasting and
convenient nutritional meals with our Weight Watchers® Smart
Ones® and Weight Watchers® from Heinz® branded products in
North America, Europe, Australia, and New Zealand. These
two brands generate nearly $800 million in sales and are
among the Company’s fastest growing equities.
Sixty percent of Heinz’s portfoliocomprises Health & Wellness products,a segment that is growing at nearly twice the industry rate.
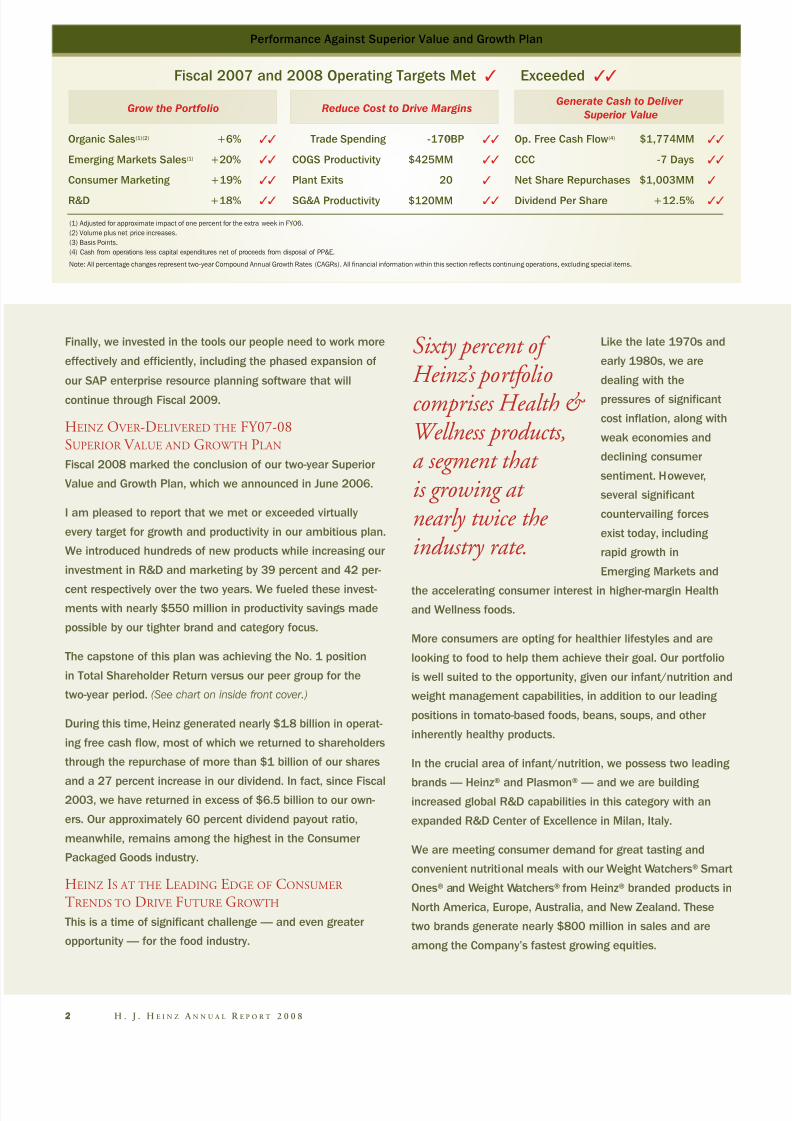
Performance Against Superior Value and Growth Plan
Organic Sales(1)(2) +6% ✓✓
Emerging Markets Sales(1) +20% ✓✓
Consumer Marketing +19% ✓✓
R&D +18% ✓✓
Fiscal 2007 and 2008 Operating Targets Met ✓ Exceeded ✓✓
Grow the Portfolio
Trade Spending -170BP(3) ✓✓
COGS Productivity $425MM ✓✓
Plant Exits 20 ✓
SG&A Productivity $120MM ✓✓
Op. Free Cash Flow(4) $1,774MM ✓✓
CCC -7 Days ✓✓
Net Share Repurchases $1,003MM ✓
Dividend Per Share +12.5% ✓✓
Reduce Cost to Drive MarginsGenerate Cash to Deliver
Superior Value
(1) Adjusted for approximate impact of one percent for the extra week in FY06.
(2) Volume plus net price increases.
(3) Basis Points.
(4) Cash from operations less capital expenditures net of proceeds from disposal of PP&E.
Note: All percentage changes represent two-year Compound Annual Growth Rates (CAGRs). All financial information within this section reflects continuing operations, excluding special items.
8/3/2019 2008HeinzAR
http://slidepdf.com/reader/full/2008heinzar 5/108
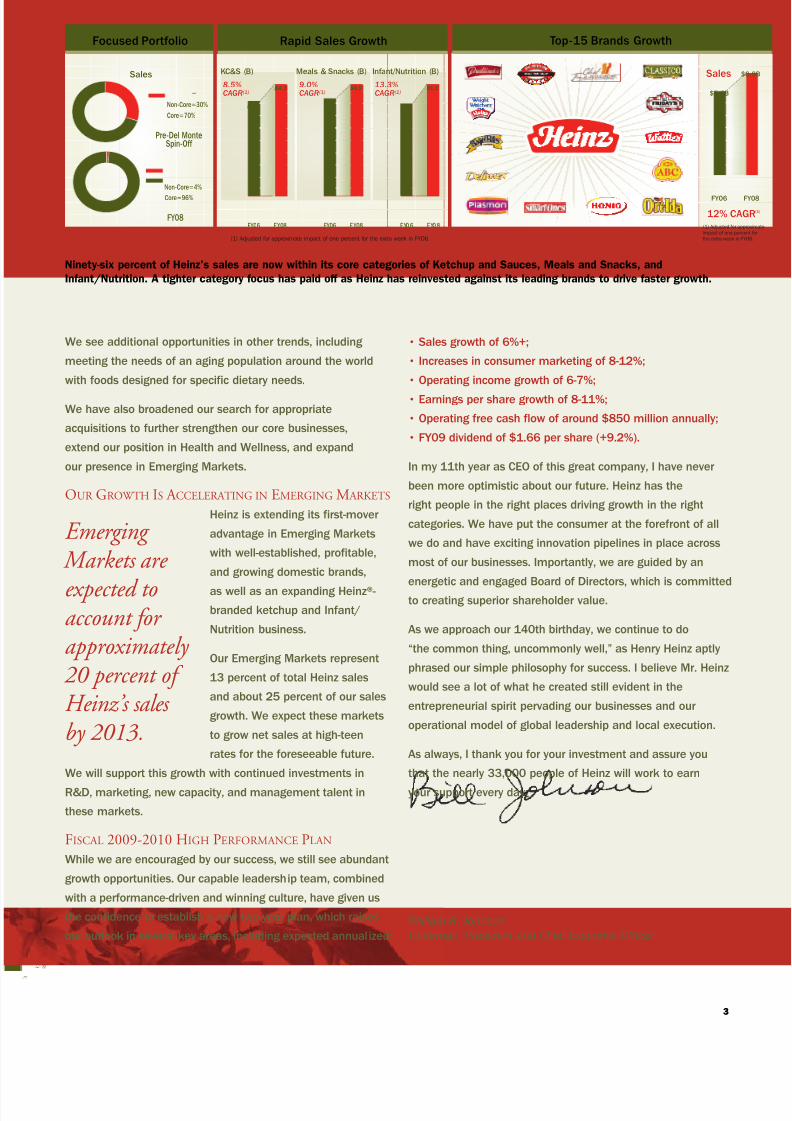
3
Rapid Sales Growth
KC&S (B) Meals & Snacks (B) Infant/Nutrition (B)
FY06 FY08 FY06 F Y08
8.5%CAGR(1)
9.0%CAGR(1)
13.3%CAGR(1)
(1) Adjusted for approximate impact of one percent for the extra week in FYO6.
$4.1
$3.5
$4.5
$3.9
F Y0 6 F Y0 8
$1.1
$0.9
FY06 FY08
$6.9B
$5.6B
Sales
12% CAGR(1)
(1) Adjusted for approximate
impact of one percent for
the extra week in FY06.
Top-15 Brands Growth
We see additional opportunities in other trends, including
meeting the needs of an aging population around the world
with foods designed for specific dietary needs.
We have also broadened our search for appropriate
acquisitions to further strengthen our core businesses,
extend our position in Health and Wellness, and expand
our presence in Emerging Markets.
OUR GROWTH IS A CCELERATING IN EMERGING M ARKETS
Heinz is extending its first-mover
advantage in Emerging Markets
with well-established, profitable,
and growing domestic brands,
as well as an expanding Heinz®-
branded ketchup and Infant/
Nutrition business.
Our Emerging Markets represent
13 percent of total Heinz sales
and about 25 percent of our sales
growth. We expect these markets
to grow net sales at high-teen
rates for the foreseeable future.
We will support this growth with continued investments in
R&D, marketing, new capacity, and management talent in
these markets.
FISCAL 2009-2010 HIGH PERFORMANCE PLAN
While we are encouraged by our success, we still see abundant
growth opportunities. Our capable leadership team, combined
with a performance-driven and winning culture, have given us
the confidence to establish a new two-year plan, which raises
our outlook in several key areas, including expected annualized:
• Sales growth of 6%+;
• Increases in consumer marketing of 8-12%;
• Operating income growth of 6-7%;
• Earnings per share growth of 8-11%;
• Operating free cash flow of around $850 million annually;
• FY09 dividend of $1.66 per share (+9.2%).
In my 11th year as CEO of this great company, I have never
been more optimistic about our future. Heinz has the
right people in the right places driving growth in the right
categories. We have put the consumer at the forefront of all
we do and have exciting innovation pipelines in place across
most of our businesses. Importantly, we are guided by an
energetic and engaged Board of Directors, which is committed
to creating superior shareholder value.
As we approach our 140th birthday, we continue to do
“the common thing, uncommonly well,” as Henry Heinz aptly
phrased our simple philosophy for success. I believe Mr. Heinz
would see a lot of what he created still evident in the
entrepreneurial spirit pervading our businesses and our
operational model of global leadership and local execution.
As always, I thank you for your investment and assure you
that the nearly 33,000 people of Heinz will work to earn
your support every day.
Emerging Markets are
expected toaccount for approximately 20 percent of Heinz’s sales by 2013.
William R. Johnson
Chairman, President and Chief Executive Officer
Ninety-six percent of Heinz’s sales are now within its core categories of Ketchup and Sauces, Meals and Snacks, and
Infant/Nutrition. A tighter category focus has paid off as Heinz has reinvested against its leading brands to drive faster growth.
Focused Portfolio
Sales
Pre-Del MonteSpin-Off
FY08
Core=96%
Non-Core=4%
Non-Core=30%
Core=70%

8/3/2019 2008HeinzAR
http://slidepdf.com/reader/full/2008heinzar 6/108
4 H . J . H E I N Z A N N U A L R E P O R T 2 0 0 8
Heinz’s acquisition search is biased toward businesses that have a strong Health and Wellness platform. The acquisition
of Renée’s Gourmet, Canada’s leading maker of chilled dressings and toppings, is an excellent example of this
approach. Renée’s portfolio includes a line of Wellness dressings with reduced fat and fewer calories.
Lifestyle Children’s Nutrition Weight Management Health ManagementPromotes general Health &
Wellness, lifestyle preferencesInfants, toddlers, and
childrenEnables/promotes weightreduction, maintenance
Science-influencedfoods & beverages
F O C U S O N C O N S U M E R N E E D S
Heinz classifies its Health and Wellness initiatives into four categoriesbased on how consumers view healthy food options:

8/3/2019 2008HeinzAR
http://slidepdf.com/reader/full/2008heinzar 7/108
5
Lifestyle Children’sNutrition
WeightManagement
HealthManagement
Fiscal 2008 Health and Wellness Sales Growth
25%
20%
17%
11%
Fiscal 2008 was a monumental year of progress for Heinz
toward our commitment to improve the Health and
Wellness attributes of our global portfolio. The year was
highlighted by the removal of more than 13 million pounds
of trans fat from the North American diet with the switch to
healthier oils in our Ore-Ida® brand.
HEINZ IS MOVING TO A CONSUMER -CENTRIC
HEALTH AND W ELLNESS MODEL
Our Health and Wellness strategy has been guided by an
internal model focused on food ingredients and our strong
foundation of nutrient-rich potatoes, tomatoes, and beans.
Through the work of the Heinz Health and Wellness Task
Force established last year, the Company has evolved to a
consumer-directed model built around four basic platforms:
Lifestyle, Children’s Nutrition, Weight Management, and
Health Management.
Through this approach, each of our major business units is
responding to Health and Wellness consumer needs within
their respective markets to add value for consumers.
Lifestyle-oriented options are what most major food
companies are pursuing, with an emphasis on making
products incrementally healthier. Heinz is making goodprogress here. Our U.S. Foodservice business, for example,
is developing reduced fat, salt, and sugar varieties of many
of its most popular soups and sauces, as well as
portion-controlled desserts.
It is in the other three categories, however, where the
Company aims to differentiate itself.
Our Children’s Nutrition capabilities are being enhanced
significantly by a new R&D Center of Excellence in Milan,
Italy — home of our Plasmon® brand.
In Weight Management, meanwhile, we license the global
rights to the Weight Watchers® brand in our core categories
and enjoy a strong partnership with the classroom program.
We are broadening the Weight Watchers® Smart Ones®
product line into the breakfast segment, through the intro-
duction of Morning Express™, a line of on-the-go calorie-
controlled breakfast sandwiches. The menu is also expanding
for Weight Watchers® from Heinz® in Europe, Australia, and
New Zealand, with entries into new categories like soups,
salad dressings, and desserts.
Our Health Management capabilities are focused today
in our Italian business under the Aproten® and Biaglut®
brands, which address needs for gluten-free and low-
protein products.
We expect to have many new things to report next year
in our quest to deliver great tasting foods to consumers
that are also good for them.
Heinz’s Health and Wellness-related products com-
bined are growing faster than the Company average.
Extending theHeinz Heritageof Health and
Wellness
Weight Management
is a Heinz core compe-
tency that is on-trend
and demonstrating
rapid growth. Heinz is
capitalizing on this
strength by expanding
our trusted brands to
new categories and
meal occasions.

8/3/2019 2008HeinzAR
http://slidepdf.com/reader/full/2008heinzar 8/108
Upon receiving his first order for Heinz products in the
UK in 1886, Henry Heinz declared, “The World Is
Our Field.” Heinz has been a pioneer among U.S.
food companies in exploring global opportunities
ever since.
Emerging Markets have become one
of the largest growth engines for
today’s Heinz.
Heinz possesses significant
advantages in many of these markets
due to our well-established domestic
brands, in addition to a growing
Heinz® brand in ketchup, sauces,
and infant/nutrition. We also enjoy
scalable infrastructure, unique
distribution capabilities, and strong
local management.
THE INFRASTRUCTURE W E H AVE
A CQUIRED AND BUILT H AS A LLOWED
US TO E XPAND OUR PRESENCE
Heinz was one of the first companies from the western
world to operate in China. Our late Chairman Henry
“Jack” Heinz II, grandson of the Founder, personally
oversaw the opening of our infant cereal factory in
Guangzhou in 1986. We remain the trusted leader in the
Chinese infant cereal category.
Heinz has initiated a new program in China to expand our
fast-growing Long Fong® brand. The Company provides
grocers in second- and third-tier cities with freezers in
exchange for exclusively merchandising Long Fong’s
dumplings, dim sum, rice balls, and steam bread. Aided by
this program, we have doubled Long Fong sales in less than
four years, and expect to
continue driving double-
digit sales increases for the
forseeable future.
In India, meanwhile, a fleet
of bicycle salesmen,
supported by mobile health
clinics and door-to-door promotion,
has significantly
increased brand
penetration for our
Glucon-D® energy
beverage brand.
W E A RE GROWING
WITH OUR GLOBAL
CUSTOMERS
In Russia, the world’s second-largest
ketchup market, we recently extended
our relationship with McDonald’s.
Building on the awareness created
by this partnership, the Heinz® brand
is now the leader in Moscow and
St. Petersburg.
Accelerating Growth inEmerging Markets
Economies in Heinz’s Emerging Markets are growing at
nearly triple the rate of developed markets, with corre-
sponding increases in the growth rate of packaged food.
Increasing Heinz Impact
% of CompanySales
% of CompanySales Growth
~1 / 4 ~1 / 3
FY08
13%15%
20%
FY10* FY13*FY06-08*Target FY08-10E*U.S., Canada, UK, France, Italy, Germany, Spain, Australia, New Zealand, Japan
Source: World Bank; IMF data from Euromonitor; Euromonitor
AverageDeveloped*
AverageEmerging
China Russia Indonesia India Poland L.America
Rapid Economic Growth
GDP Growth (%) Key Emerging Markets GDP Growth (%)
11.8%
10.2%
3.7%
10.5%9.9% 9.3%
7.3%6.3%
Packaged food per capita growth
12.4% 14.6% 15.1% 12.8% 6 .7% 11.7%
6 H . J . H E I N Z A N N U A L R E P O R T 2 0 0 8
In Fiscal 2008, Heinz expanded its freezer
distribution program to introduce the
Long Fong brand to many new cities.
Accelerating growth in Emerging Markets is resulting in a
rapid increase in their share of Heinz’s total sales and
sales growth.

8/3/2019 2008HeinzAR
http://slidepdf.com/reader/full/2008heinzar 9/108
7
We are leveraging the infrastructure we acquired in 2005,
combined with new advertising, to build distribution and
trial deeper in the Russian interior.
W E A RE INVESTING A GGRESSIVELY IN
INNOVATION AND M ARKETING
In India, our Complan® nutritional beverage brand had been
growing modestly for several years until we began an ad
campaign in Fiscal 2005 emphasizing Complan’s milk
protein and other nutrients and their effect on the growth
of children. This has resulted in double-digit growth in eachyear since the campaign began.
THE BEST IS Y ET TO COME
While we are growing rapidly in these
markets, we are only beginning to tap their
full potential. We intend to continue investing
for growth by expanding our strong brand
equities into new categories.
For example, we have recently launched a range of Long
Fong®-branded sauces in China, and in Indonesia, we are
supplementing strong growth in our core ABC®-branded soy
sauce and beverage businesses with new cooking pastes.
We will also consider entering select new markets, given
our proven ability to iden-
tify, execute, and grow joint
ventures and acquisitions
in the developing world.
Heinz has grown sales 40 percent in its Emerging Markets
over the past two years. The introduction of Heinz business
processes, meanwhile, has led to double-digit operating
margins not far below the Company average.
The Complan® brand has been growing at a double-digit rate since an ad campaign in support of the product’s growth benefit
was launched in Fiscal 2005.
Accelerating Sales Growth
Sales (MM)
$923
$1,295
FY06
FY07
FY08
(1) Adjusted for approximate impact of two percent for the extra week in FY06 and one less week in FY07.
+27%(1)
+25%
$1,038+14%(1)

8/3/2019 2008HeinzAR
http://slidepdf.com/reader/full/2008heinzar 10/108
8 H . J . H E I N Z A N N U A L R E P O R T 2 0 0 8
Heinz eliminated more than 13 million pounds of
trans fat from its Ore-Ida® product line in Fiscal
2008 and continues to grow the brand with
exciting new innovations that expand beyond
fries, including new Steam n’ Mash™ potatoes.

8/3/2019 2008HeinzAR
http://slidepdf.com/reader/full/2008heinzar 11/108
9
Strong Top-Line Growth
FY03* FY08
$10.1(Record Sales)
+$2.5 Billion
$7.6
Sales (B)
* Results from continuing operations
Ramped-Up Marketing Investment
Marketing (MM)
FY06* FY08
$383
+42%
$269
* Results from continuing operations
Heinz is driving strong top-line sales growth through a
proven formula of consumer-validated product innovation
supported by creative and targeted marketing.
The Company has strengthened its market research capabil-
ities and has increased R&D investment at a double-digit
rate in each of the past four years, in addition to deploying
significant capital to a new Global Innovation and Quality
Center in Pittsburgh.
As a result, Heinz has built a robust 18–24 month innova-
tion pipeline in its core brands.
Heinz plans to launch at least 200 new products in each of
the next two years, supported by a continued double-digit
increase in R&D investment. Our goal is to derive 15% of
our Fiscal 2010 sales from products launched within the
prior 36 months.
We also expect to increase marketing by 8-12% in each
of the next two years targeting an effective mix of media,
including TV, radio, print, outdoor, in-store, and online.
OUR INNOVATION IS A IMED AT THE S WEET SPOT
W HERE T ASTE, HEALTH, AND CONVENIENCE CONVERGE
In addition to our focus on Health and Wellness, we continueto upgrade taste and convenience in our leading brands.
For example, we recently launched a line of Ore-Ida® Steam
n’ Mash™ potatoes in four varieties. Consumers simply
“steam” the potatoes in the microwave for 10 minutes, add
milk and butter, then mash to their liking. We do the dirty
work of scrubbing, peeling, and chopping.
Also new in the U.S. is T.G.I. Friday’s™ Skillet Meals. These
are tasty meals for two inspired by the restaurant. They
involve a simple, three-step stove-top preparation which, like
Steam n’ Mash™ potatoes, saves consumers time while giving
them the satisfaction of being part of the cooking experience.
HEINZ IS SHARING ITS BEST IDEAS A CROSS THECOMPANY LIKE NEVER BEFORE
Some of the Company’s best growth is derived from its
ability to transfer innovations in one Heinz market success-
fully to others. Soup varieties first launched in
Australia are driving strong growth in the UK, and
a line of Heinz® condiment sauces that
have enjoyed success in France are now
rolling out across Europe.
Investing forGrowth ThroughInnovation andMarketing
Heinz is investing incrementally
behind its robust new product
pipeline, which is driving strong top-
line growth, including record sales
of $10.1 billion in Fiscal 2008.
Heinz plans to launch at least 200 new
products in each of the next two years,supported by a continued double-digit increase in R&D investment.

8/3/2019 2008HeinzAR
http://slidepdf.com/reader/full/2008heinzar 12/108
10 H . J . H E I N Z A N N U A L R E P O R T 2 0 0 8
H. J. Heinz played a pivotal role in introducing the tomato
into the daily lives of Americans when he debuted his
recipe for tomato ketchup in 1876. Today, Heinz ketchup
is found in homes and on restaurant tables from
Minneapolis to Moscow to Mumbai.
With products ranging from Classico® pasta sauces, to
Heinz® Cream of Tomato Soup (the UK’s biggest soupbrand), to supplying custom-made tomato sauces for
restaurants and pizzerias, Heinz continues to market
foods featuring all-natural tomato goodness.
The tomatoes in Heinz’s foods are grown from the
Company’s own hybrid seeds. Heinz has been
breeding hybrid tomatoes since 1936, becoming
a global authority on tomatoes grown for processing.
The Company’s ability to breed for optimum size, color,
flavor, sweetness, thickness, and disease resistance is
a unique competitive advantage.
Importantly, as Heinz grows faster around the world, it is
sharing its tomato technology with farmers in developing
nations. This will ensure Heinz a consistent tomato supplythat meets the Company’s rigorous quality standards, while
improving the livelihood of farmers in these nations and
introducing sustainable farming methods.
Heinz also continues to fund studies
into the health benefits of processed
tomatoes, which contain concentrated
levels of Lycopene, a
powerful antioxidant.
Heinz Europe has launched a campaign heralding Heinz’s
tomato heritage under the slogan “Grown, Not Made.™”
The campaign includes a new clear bottle and label featuring
a red, ripe tomato on the vine. Although it is hard to
improve on perfection, the Heinz Europe team also
leveraged the Company’s tomato expertise to improve the
European ketchup recipe for an even thicker, richer flavor.
Success That’sGrown, Not Made
Heinz uses more than 5 billion pounds of tomatoes every year in its products.

8/3/2019 2008HeinzAR
http://slidepdf.com/reader/full/2008heinzar 13/108
11

8/3/2019 2008HeinzAR
http://slidepdf.com/reader/full/2008heinzar 14/108
The H. J. Heinz Company in May 2008 announced a series
of environmental sustainability goals, highlighted by an
overarching objective to reduce greenhouse gas emissions
by 20 percent by the year 2015.
To achieve these goals we are executing numerous global
initiatives to reduce non-value-added packaging, increase
the use of recycled materials, lower energy consumption,
conserve water, and increase our use of renewable energy
sources at some of our largest plants.
For example, with the launch of the new clear plastic
top-down ketchup bottle in Europe, we have reduced total
package weight by about nine percent, or roughly 340 tonsof plastic per year.
In Fremont, Ohio, Heinz is on track to reduce solid waste
by 10 percent, or 800,000 pounds of recyclable material.
Meanwhile, in Dundalk, Ireland, the Heinz facility is already
recycling 95 percent of the plastic and 99 percent of the
cardboard, wood, and steel it uses.
On the energy conservation front, the process heat recovery
project at our facility in Pocatello, Idaho, is generating 2.3
million kWh in annual electric power reduction.
These initiatives are important to the communities in
which we operate and reflect our heritage as a socially
responsible company. They are also critical to building
improved partnerships with our customers, many of whom
are pioneering the sustainability movement.
We have received widespread recognition for our work
to date and look forward to strong progress toward
our goals in Fiscal 2009.
To learn more about our commitment tosustainability and our other Corporate Social
Responsibility initiatives, visit www.Heinz.com/csr.
Building aSustainable Future
Global 10-Year Sustainability Goals*
Greenhouse Gas (GHG) Emissions ▼ 20%
Energy Use in Manufacturing Usage ▼ 20%
Renewable Energy Renewable Energy Sources ▲ 15%
Packaging Total Packaging ▼ 15%
Sustainable Agriculture Carbon Footprint ▼ 15%
Water Usage ▼ 15%
Field Yield▲
5%Water Use in Manufacturing Water Consumption ▼ 20%
Transportation Fossil Fuel Consumption ▼ 10%
Solid Waste Waste from Heinz Operations ▼ 20%
Energy Use in Manufacturing Usage ▼ 20%
Packaging Total Packaging ▼ 15%
Water Use in Manufacturing Water Consumption ▼ 20%
Solid Waste Waste from Heinz Operations ▼ 20%
As the original Pure Food
Company, Heinz is atrusted leader in nutritionand wellness, dedicated
to the sustainable healthof people, the planet, and our Company.
Cogeneration in California
A one mega-watt natural gas-fired generator was
recently installed in a Heinz plant in California.
The energy-efficient generator not only produces
electrical power, but the thermal exhaust is used
to heat water for factory processes.
12 H . J . H E I N Z A N N U A L R E P O R T 2 0 0 8
*Base year for 10-year goals is 2005
8/3/2019 2008HeinzAR
http://slidepdf.com/reader/full/2008heinzar 15/108
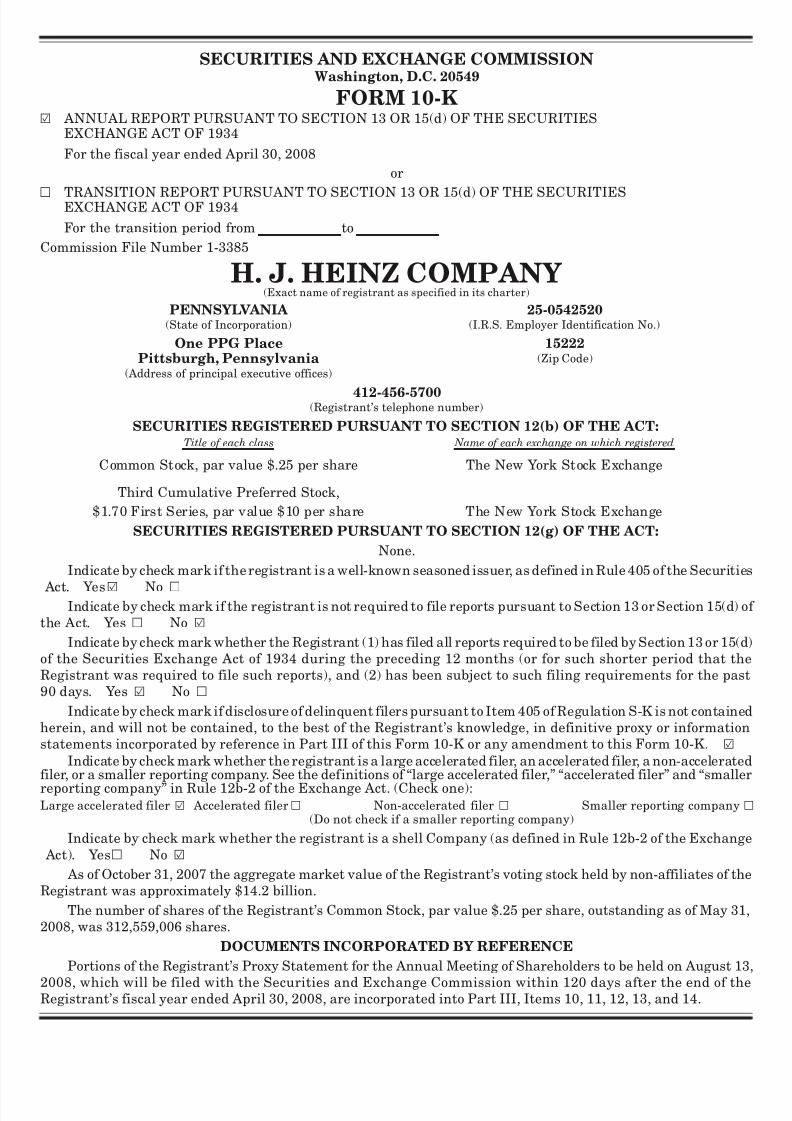
SECURITIES AND EXCHANGE COMMISSIONWashington, D.C. 20549
FORM 10-K¥ ANNUAL REPORT PURSUANT TO SECTION 13 OR 15(d) OF THE SECURITIES
EXCHANGE ACT OF 1934
For the fiscal year ended April 30, 2008
or
n TRANSITION REPORT PURSUANT TO SECTION 13 OR 15(d) OF THE SECURITIESEXCHANGE ACT OF 1934
For the transition period from to
Commission File Number 1-3385
H. J. HEINZ COMPANY(Exact name of registrant as specified in its charter)
PENNSYLVANIA 25-0542520(State of Incorporation) (I.R.S. Employer Identification No.)
One PPG Place 15222Pittsburgh, Pennsylvania (Zip Code)
(Address of principal executive offices)
412-456-5700(Registrant’s telephone number)
SECURITIES REGISTERED PURSUANT TO SECTION 12(b) OF THE ACT:Title of each class Name of each exchange on which registered
Common Stock, par value $.25 per share The New York Stock Exchange
Third Cumulative Preferred Stock,
$1.70 First Series, par value $10 per share The New York Stock Exchange
SECURITIES REGISTERED PURSUANT TO SECTION 12(g) OF THE ACT:
None.
Indicate by check mark if the registrant is a well-known seasoned issuer, as defined in Rule 405 of the Securities
Act. Yes¥ No n
Indicate by check mark if the registrant is not required to file reports pursuant to Section 13 or Section 15(d) of the Act. Yes n No ¥
Indicate by check mark whether the Registrant (1) has filed all reports required to be filed by Section 13 or 15(d)of the Securities Exchange Act of 1934 during the preceding 12 months (or for such shorter period that theRegistrant was required to file such reports), and (2) has been subject to such filing requirements for the past90 days. Yes ¥ No n
Indicate by check mark if disclosure of delinquent filers pursuant to Item 405 of Regulation S-K is not containedherein, and will not be contained, to the best of the Registrant’s knowledge, in definitive proxy or informationstatements incorporated by reference in Part III of this Form 10-K or any amendment to this Form 10-K. ¥
Indicate by check mark whether the registrant is a large accelerated filer, an accelerated filer, a non-acceleratedfiler, or a smaller reporting company. See the definitions of “large accelerated filer,” “accelerated filer” and “smaller
reporting company” in Rule 12b-2 of the Exchange Act. (Check one):Large accelerated filer ¥ Accelerated filer n Non-accelerated filer n
(Do not check if a smaller reporting company)Smaller reporting company n
Indicate by check mark whether the registrant is a shell Company (as defined in Rule 12b-2 of the Exchange Act). Yesn No ¥
As of October 31, 2007 the aggregate market value of the Registrant’s voting stock held by non-affiliates of theRegistrant was approximately $14.2 billion.
The number of shares of the Registrant’s Common Stock, par value $.25 per share, outstanding as of May 31,2008, was 312,559,006 shares.
DOCUMENTS INCORPORATED BY REFERENCE
Portions of the Registrant’s Proxy Statement for the Annual Meeting of Shareholders to be held on August 13,
2008, which will be filed with the Securities and Exchange Commission within 120 days after the end of theRegistrant’s fiscal year ended April 30, 2008, are incorporated into Part III, Items 10, 11, 12, 13, and 14.
8/3/2019 2008HeinzAR
http://slidepdf.com/reader/full/2008heinzar 16/108
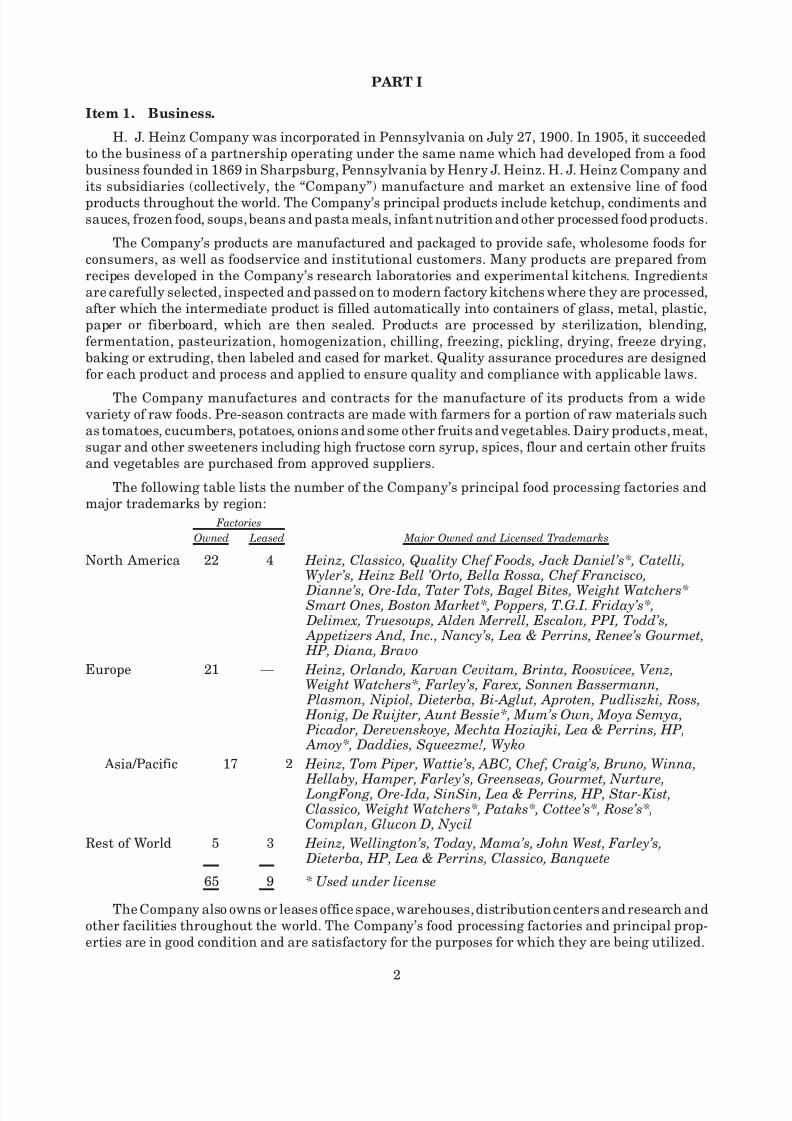
PART I
Item 1. Business.
H. J. Heinz Company was incorporated in Pennsylvania on July 27, 1900. In 1905, it succeededto the business of a partnership operating under the same name which had developed from a foodbusiness founded in 1869 in Sharpsburg, Pennsylvania by Henry J. Heinz. H. J. Heinz Company andits subsidiaries (collectively, the “Company”) manufacture and market an extensive line of foodproducts throughout the world. The Company’s principal products include ketchup, condiments andsauces, frozen food, soups, beans and pasta meals, infant nutrition and other processed food products.
The Company’s products are manufactured and packaged to provide safe, wholesome foods forconsumers, as well as foodservice and institutional customers. Many products are prepared fromrecipes developed in the Company’s research laboratories and experimental kitchens. Ingredientsare carefully selected, inspected and passed on to modern factory kitchens where they are processed,after which the intermediate product is filled automatically into containers of glass, metal, plastic,paper or fiberboard, which are then sealed. Products are processed by sterilization, blending,fermentation, pasteurization, homogenization, chilling, freezing, pickling, drying, freeze drying,baking or extruding, then labeled and cased for market. Quality assurance procedures are designedfor each product and process and applied to ensure quality and compliance with applicable laws.
The Company manufactures and contracts for the manufacture of its products from a wide variety of raw foods. Pre-season contracts are made with farmers for a portion of raw materials suchas tomatoes, cucumbers, potatoes, onions and some other fruits and vegetables. Dairy products, meat,sugar and other sweeteners including high fructose corn syrup, spices, flour and certain other fruitsand vegetables are purchased from approved suppliers.
The following table lists the number of the Company’s principal food processing factories andmajor trademarks by region:
Owned Leased Major Owned and Licensed Trademarks
Factories
North America 22 4 Heinz, Classico, Quality Chef Foods, Jack Daniel’s*, Catelli,Wyler’s, Heinz Bell ’Orto, Bella Rossa, Chef Francisco,
Dianne’s, Ore-Ida, Tater Tots, Bagel Bites, Weight Watchers* Smart Ones, Boston Market*, Poppers, T.G.I. Friday’s*, Delimex, Truesoups, Alden Merrell, Escalon, PPI, Todd’s, Appetizers And, Inc., Nancy’s, Lea & Perrins, Renee’s Gourmet, HP, Diana, Bravo
Europe 21 — Heinz, Orlando, Karvan Cevitam, Brinta, Roosvicee, Venz,Weight Watchers*, Farley’s, Farex, Sonnen Bassermann,
Plasmon, Nipiol, Dieterba, Bi-Aglut, Aproten, Pudliszki, Ross, Honig, De Ruijter, Aunt Bessie*, Mum’s Own, Moya Semya, Picador, Derevenskoye, Mechta Hoziajki, Lea & Perrins, HP, Amoy*, Daddies, Squeezme!, Wyko
Asia/Pacific 17 2 Heinz, Tom Piper, Wattie’s, ABC, Chef, Craig’s, Bruno, Winna,
Hellaby, Hamper, Farley’s, Greenseas, Gourmet, Nurture, LongFong, Ore-Ida, SinSin, Lea & Perrins, HP, Star-Kist,Classico, Weight Watchers*, Pataks*, Cottee’s*, Rose’s*,Complan, Glucon D, Nycil
Rest of World 5 3 Heinz, Wellington’s, Today, Mama’s, John West, Farley’s, Dieterba, HP, Lea & Perrins, Classico, Banquete
65 9 * Used under license
The Company also owns or leases office space, warehouses, distribution centers and research andother facilities throughout the world. The Company’s food processing factories and principal prop-erties are in good condition and are satisfactory for the purposes for which they are being utilized.
2
8/3/2019 2008HeinzAR
http://slidepdf.com/reader/full/2008heinzar 17/108
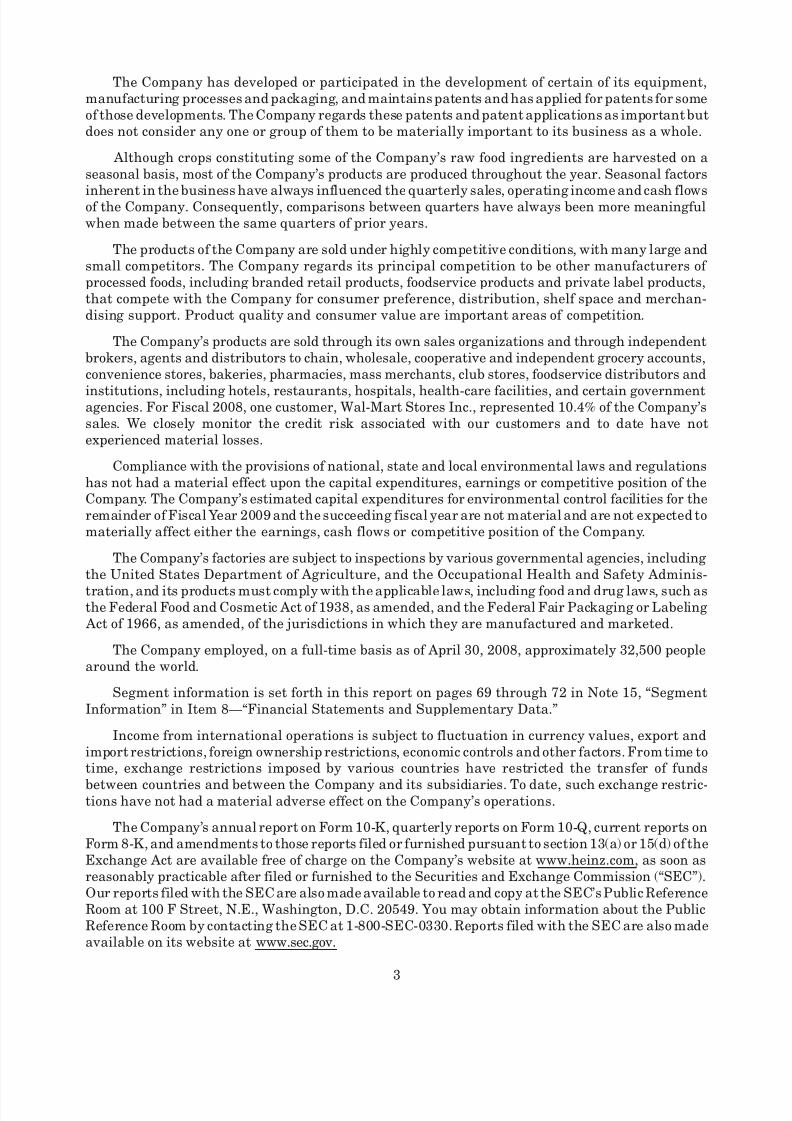
The Company has developed or participated in the development of certain of its equipment,manufacturing processes and packaging, and maintains patents and has applied for patents for someof those developments. The Company regards these patents and patent applications as important butdoes not consider any one or group of them to be materially important to its business as a whole.
Although crops constituting some of the Company’s raw food ingredients are harvested on aseasonal basis, most of the Company’s products are produced throughout the year. Seasonal factors
inherent in the business have always influenced the quarterly sales, operating income and cash flowsof the Company. Consequently, comparisons between quarters have always been more meaningfulwhen made between the same quarters of prior years.
The products of the Company are sold under highly competitive conditions, with many large andsmall competitors. The Company regards its principal competition to be other manufacturers of processed foods, including branded retail products, foodservice products and private label products,that compete with the Company for consumer preference, distribution, shelf space and merchan-dising support. Product quality and consumer value are important areas of competition.
The Company’s products are sold through its own sales organizations and through independentbrokers, agents and distributors to chain, wholesale, cooperative and independent grocery accounts,convenience stores, bakeries, pharmacies, mass merchants, club stores, foodservice distributors and
institutions, including hotels, restaurants, hospitals, health-care facilities, and certain governmentagencies. For Fiscal 2008, one customer, Wal-Mart Stores Inc., represented 10.4% of the Company’ssales. We closely monitor the credit risk associated with our customers and to date have notexperienced material losses.
Compliance with the provisions of national, state and local environmental laws and regulationshas not had a material effect upon the capital expenditures, earnings or competitive position of theCompany. The Company’s estimated capital expenditures for environmental control facilities for theremainder of Fiscal Year 2009 and the succeeding fiscal year are not material and are not expected tomaterially affect either the earnings, cash flows or competitive position of the Company.
The Company’s factories are subject to inspections by various governmental agencies, includingthe United States Department of Agriculture, and the Occupational Health and Safety Adminis-
tration, and its products must comply with the applicable laws, including food and drug laws, such asthe Federal Food and Cosmetic Act of 1938, as amended, and the Federal Fair Packaging or Labeling
Act of 1966, as amended, of the jurisdictions in which they are manufactured and marketed.
The Company employed, on a full-time basis as of April 30, 2008, approximately 32,500 peoplearound the world.
Segment information is set forth in this report on pages 69 through 72 in Note 15, “SegmentInformation” in Item 8—“Financial Statements and Supplementary Data.”
Income from international operations is subject to fluctuation in currency values, export andimport restrictions, foreign ownership restrictions, economic controls and other factors. From time totime, exchange restrictions imposed by various countries have restricted the transfer of funds
between countries and between the Company and its subsidiaries. To date, such exchange restric-tions have not had a material adverse effect on the Company’s operations.
The Company’s annual report on Form 10-K, quarterly reports on Form 10-Q, current reports onForm 8-K, and amendments to those reports filed or furnished pursuant to section 13(a) or 15(d) of theExchange Act are available free of charge on the Company’s website at www.heinz.com, as soon asreasonably practicable after filed or furnished to the Securities and Exchange Commission (“SEC”).Our reports filed with the SEC are also made available to read and copy at the SEC’s Public ReferenceRoom at 100 F Street, N.E., Washington, D.C. 20549. You may obtain information about the PublicReference Room by contacting the SEC at 1-800-SEC-0330. Reports filed with the SEC are also madeavailable on its website at www.sec.gov.
3
8/3/2019 2008HeinzAR
http://slidepdf.com/reader/full/2008heinzar 18/108
Executive Officers of the Registrant
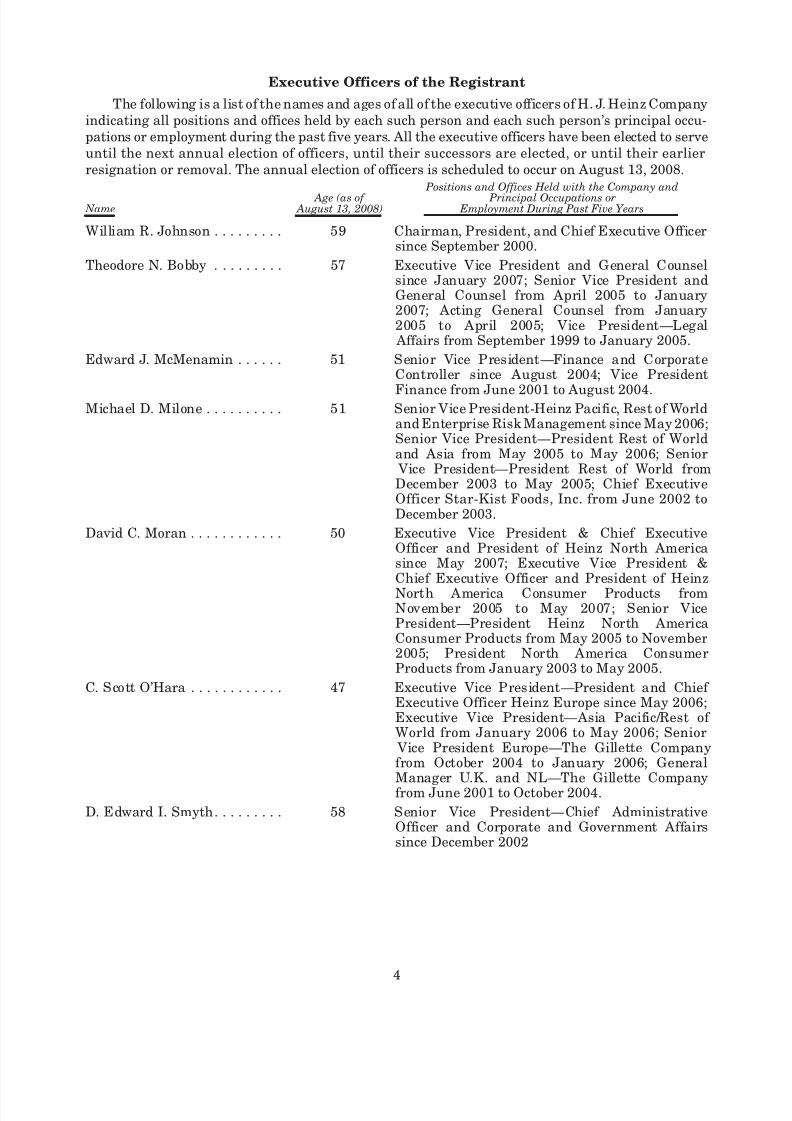
The following is a list of the names and ages of all of the executive officers of H. J. Heinz Companyindicating all positions and offices held by each such person and each such person’s principal occu-pations or employment during the past five years. All the executive officers have been elected to serveuntil the next annual election of officers, until their successors are elected, or until their earlierresignation or removal. The annual election of officers is scheduled to occur on August 13, 2008.
Name Age (as of
August 13, 2008)
Positions and Offices Held with the Company and
Principal Occupations or Employment During Past Five Years
William R. Johnson . . . . . . . . . 59 Chairman, President, and Chief Executive Officersince September 2000.
Theodore N. Bobby . . . . . . . . . 57 Executive Vice President and General Counselsince January 2007; Senior Vice President andGeneral Counsel from April 2005 to January2007; Acting General Counsel from January2005 to April 2005; Vice President—Legal
Affairs from September 1999 to January 2005.
Edward J. McMenamin . . . . . . 51 Senior Vice President—Finance and CorporateController since August 2004; Vice President
Finance from June 2001 to August 2004.Michael D. Milone . . . . . . . . . . 51 Senior Vice President-Heinz Pacific, Rest of World
and Enterprise Risk Management since May 2006;Senior Vice President—President Rest of Worldand Asia from May 2005 to May 2006; Senior
Vice President—President Rest of World fromDecember 2003 to May 2005; Chief ExecutiveOfficer Star-Kist Foods, Inc. from June 2002 toDecember 2003.
David C. Moran . . . . . . . . . . . . 50 Executive Vice President & Chief ExecutiveOfficer and President of Heinz North Americasince May 2007; Executive Vice President &Chief Executive Officer and President of Heinz
North America Consumer Products fromNovember 2005 to May 2007; Senior VicePresident—President Heinz North AmericaConsumer Products from May 2005 to November2005; President North America ConsumerProducts from January 2003 to May 2005.
C. Scott O’Hara . . . . . . . . . . . . 47 Executive Vice President—President and Chief Executive Officer Heinz Europe since May 2006;Executive Vice President—Asia Pacific/Rest of World from January 2006 to May 2006; Senior
Vice President Europe—The Gillette Companyfrom October 2004 to January 2006; GeneralManager U.K. and NL—The Gillette Companyfrom June 2001 to October 2004.
D. Edward I. Smyth. . . . . . . . . 58 Senior Vice President—Chief AdministrativeOfficer and Corporate and Government Affairssince December 2002
4
8/3/2019 2008HeinzAR
http://slidepdf.com/reader/full/2008heinzar 19/108
Name Age (as of
August 13, 2008)
Positions and Offices Held with the Company and Principal Occupations or
Employment During Past Five Years
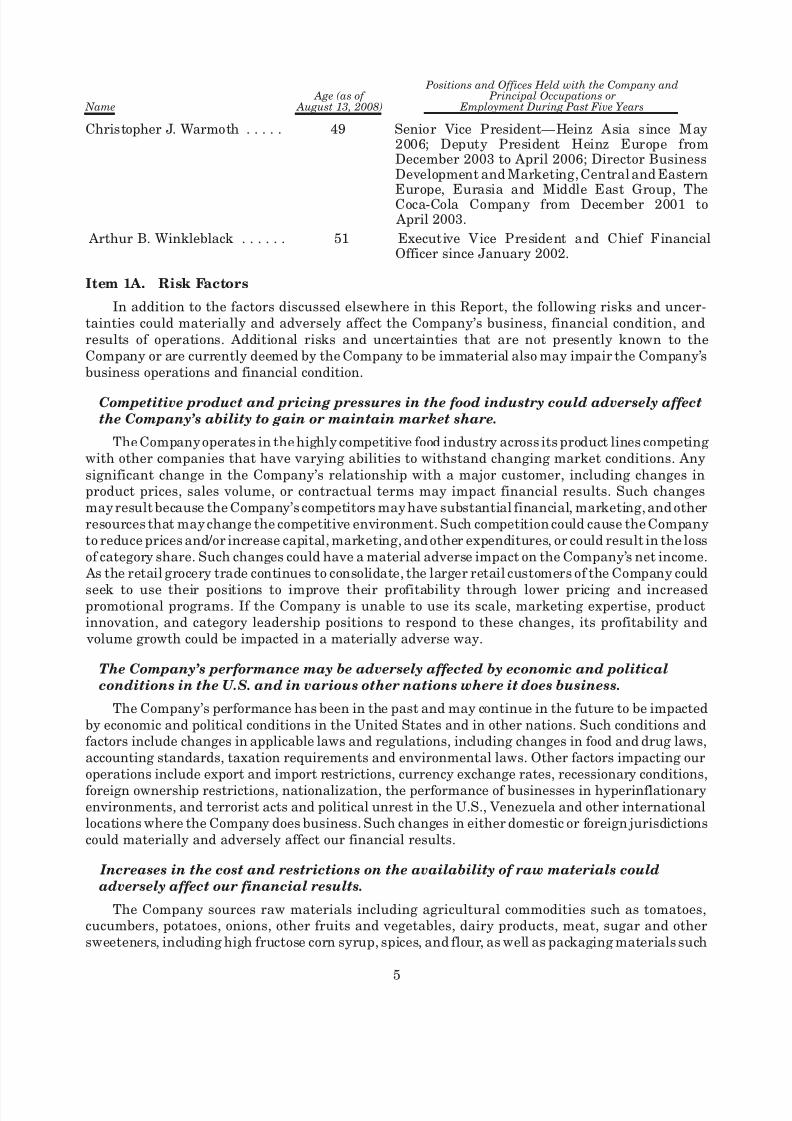
Christopher J. Warmoth . . . . . 49 Senior Vice President—Heinz Asia since May2006; Deputy President Heinz Europe fromDecember 2003 to April 2006; Director BusinessDevelopment and Marketing, Central and Eastern
Europe, Eurasia and Middle East Group, TheCoca-Cola Company from December 2001 to April 2003.
Arthur B. Winkleblack . . . . . . 51 Executive Vice President and Chief FinancialOfficer since January 2002.
Item 1A. Risk Factors
In addition to the factors discussed elsewhere in this Report, the following risks and uncer-tainties could materially and adversely affect the Company’s business, financial condition, andresults of operations. Additional risks and uncertainties that are not presently known to theCompany or are currently deemed by the Company to be immaterial also may impair the Company’sbusiness operations and financial condition.
Competitive product and pricing pressures in the food industry could adversely affectthe Company’s ability to gain or maintain market share.
The Company operates in the highly competitive food industry across its product lines competingwith other companies that have varying abilities to withstand changing market conditions. Anysignificant change in the Company’s relationship with a major customer, including changes inproduct prices, sales volume, or contractual terms may impact financial results. Such changesmay result because the Company’s competitors may have substantial financial, marketing, and otherresources that may change the competitive environment. Such competition could cause the Companyto reduce prices and/or increase capital, marketing, and other expenditures, or could result in the lossof category share. Such changes could have a material adverse impact on the Company’s net income.
As the retail grocery trade continues to consolidate, the larger retail customers of the Company could
seek to use their positions to improve their profitability through lower pricing and increasedpromotional programs. If the Company is unable to use its scale, marketing expertise, productinnovation, and category leadership positions to respond to these changes, its profitability and
volume growth could be impacted in a materially adverse way.
The Company’s performance may be adversely affected by economic and politicalconditions in the U.S. and in various other nations where it does business.
The Company’s performance has been in the past and may continue in the future to be impactedby economic and political conditions in the United States and in other nations. Such conditions andfactors include changes in applicable laws and regulations, including changes in food and drug laws,accounting standards, taxation requirements and environmental laws. Other factors impacting ouroperations include export and import restrictions, currency exchange rates, recessionary conditions,
foreign ownership restrictions, nationalization, the performance of businesses in hyperinflationaryenvironments, and terrorist acts and political unrest in the U.S., Venezuela and other internationallocations where the Company does business. Such changes in either domestic or foreign jurisdictionscould materially and adversely affect our financial results.
Increases in the cost and restrictions on the availability of raw materials couldadversely affect our financial results.
The Company sources raw materials including agricultural commodities such as tomatoes,cucumbers, potatoes, onions, other fruits and vegetables, dairy products, meat, sugar and othersweeteners, including high fructose corn syrup, spices, and flour, as well as packaging materials such
5
8/3/2019 2008HeinzAR
http://slidepdf.com/reader/full/2008heinzar 20/108
as glass, plastic, metal, paper, fiberboard, and other materials in order to manufacture products. Theavailability or cost of such commodities may fluctuate widely due to government policy and regu-lation, crop failures or shortages due to plant disease or insect and other pest infestation, weatherconditions, increased demand for biofuels, or other unforeseen circumstances. To the extent that anyof the foregoing factors increase the prices of such commodities and the Company is unable toincrease its prices or adequately hedge against such changes in a manner that offsets such changes,the results of its operations could be materially and adversely affected. Similarly, if supplier
arrangements and relationships result in increased and unforeseen expenses, the Company’s finan-cial results could be materially and adversely impacted.
Disruption of our supply chain could adversely affect our business.
Damage or disruption to our manufacturing or distribution capabilities due to weather, naturaldisaster, fire, terrorism, pandemic, strikes, the financial and/or operational instability of key sup-pliers, distributors, warehousing and transportation providers, or brokers, or other reasons couldimpair our ability to manufacture or sell our products. To the extent the Company is unable to, orcannot financially mitigate the likelihood or potential impact of such events, or to effectively managesuch events if they occur, particularly when a product is sourced from a single location, there could bea materially adverse affect on our business and results of operations, and additional resources couldbe required to restore our supply chain.
Higher energy costs and other factors affecting the cost of producing, transporting,and distributing the Company’s products could adversely affect our financial results.
Rising fuel and energy costs may have a significant impact on the cost of operations, includingthe manufacture, transportation, and distribution of products. Fuel costs may fluctuate due to anumber of factors outside the control of the Company, including government policy and regulationand weather conditions. Additionally, the Company may be unable to maintain favorable arrange-ments with respect to the costs of procuring raw materials, packaging, services, and transportingproducts, which could result in increased expenses and negatively affect operations. If the Companyis unable to hedge against such increases or raise the prices of its products to offset the changes, itsresults of operations could be materially and adversely affected.
The results of the Company could be adversely impacted as a result of increased pension, labor, and people-related expenses.
Inflationary pressures and any shortages in the labor market could increase labor costs, whichcould have a material adverse effect on the Company’s consolidated operating results or financialcondition. The Company’s labor costs include the cost of providing employee benefits in the U.S. andforeign jurisdictions, including pension, health and welfare, and severance benefits. Any declines inmarket returns could adversely impact the funding of pension plans, the assets of which are investedin a diversified portfolio of equity and fixed income securities and other investments. Additionally,the annual costs of benefits vary with increased costs of health care and the outcome of collectively-bargained wage and benefit agreements.
The impact of various food safety issues, environmental, legal, tax, and other regulations
and related developments could adversely affect the Company’s sales and profitability.
The Company is subject to numerous food safety and other laws and regulations regarding themanufacturing, marketing, and distribution of food products. These regulations govern matters suchas ingredients, advertising, taxation, relations with distributors and retailers, health and safetymatters, and environmental concerns. The ineffectiveness of the Company’s planning and policieswith respect to these matters, and the need to comply with new or revised laws or regulations withregard to licensing requirements, trade and pricing practices, environmental permitting, or otherfood or safety matters, or new interpretations or enforcement of existing laws and regulations, mayhave a material adverse effect on the Company’s sales and profitability. Avian flu or other pandemicscould disrupt production of the Company’s products, reduce demand for certain of the Company’s
6
8/3/2019 2008HeinzAR
http://slidepdf.com/reader/full/2008heinzar 21/108
products, or disrupt the marketplace in the foodservice or retail environment with consequentmaterial adverse effect on the Company’s results of operations.
The need for and effect of product recalls could have an adverse impact on the
Company’s business.
If any of the Company’s products become misbranded or adulterated, the Company may need toconduct a product recall. The scope of such a recall could result in significant costsincurred as a result
of the recall, potential destruction of inventory, and lost sales. Should consumption of any productcause injury, the Company may be liable for monetary damages as a result of a judgment against it. Asignificant product recall or product liability case could cause a loss of consumer confidence in theCompany’s food products and could have a material adverse effect on the value of its brands andresults of operations.
The failure of new product or packaging introductions to gain trade and consumeracceptance and changes in consumer preferences could adversely affect our sales.
The success of the Company is dependent upon anticipating and reacting to changes in consumerpreferences, including health and wellness. There are inherent marketplace risks associated withnew product or packaging introductions, including uncertainties about trade and consumer accep-tance. Moreover, success is dependent upon the Company’s ability to identify and respond to
consumer trends through innovation. The Company may be required to increase expenditures fornew product development. The Company may not be successful in developing new products orimproving existing products, or its new products may not achieve consumer acceptance, each of which could materially and negatively impact sales.
The failure to successfully integrate acquisitions and joint ventures into our existing
operations or the failure to gain applicable regulatory approval for such transactionscould adversely affect our financial results.
The Company’s ability to efficiently integrate acquisitions and joint ventures into its existingoperations also affects the financial success of such transactions. The Company may seek to expandits business through acquisitions and joint ventures, and may divest underperforming or non-corebusinesses. The Company’s success depends, in part, upon its ability to identify such acquisition, joint
venture, and divestiture opportunities and to negotiate favorable contractual terms. Activities insuch areas are regulated by numerous antitrust and competition laws in the U. S., the EuropeanUnion, and other jurisdictions, and the Company may be required to obtain the approval of acqui-sition and joint venture transactions by competition authorities, as well as satisfy other legalrequirements. The failure to obtain such approvals could materially and adversely affect our results.
The Company’s operations face significant foreign currency exchange rate exposure,which could negatively impact its operating results.
The Company holds assets and incurs liabilities, earns revenue, and pays expenses in a variety of currencies other than the U.S. dollar, primarily the British Pound, Euro, Australian dollar, Canadiandollar, and New Zealand dollar. The Company’s consolidated financial statements are presented inU.S. dollars, and therefore the Company must translate its assets, liabilities, revenue, and expensesinto U.S. dollars for external reporting purposes. Increases or decreases in the value of the U.S. dollarmay materially and negatively affect the value of these items in the Company’s consolidated financialstatements, even if their value has not changed in their original currency.
The Company could incur more debt, which could have an adverse impact on ourbusiness.
The Company may incur additional indebtedness in the future to fund acquisitions, repurchaseshares, or fund other activities for general business purposes, which could result in a downwardchange in credit rating. The Company’s ability to make payments on and refinance its indebtednessand fund planned capital expenditures depends upon its ability to generate cash in the future. The
7
8/3/2019 2008HeinzAR
http://slidepdf.com/reader/full/2008heinzar 22/108
cost of incurring additional debt could increase in the event of possible downgrades in the Company’scredit rating. Additionally, the Company’s ability to pay cash dividends will depend upon its ability togenerate cash and profits, which, to a certain extent, is subject to economic, financial, competitive,and other factors beyond the Company’s control.
The failure to implement our growth plans could adversely affect the Company’s
ability to increase net income.
The success of the Company could be impacted by its inability to continue to execute on its publicly-announced growth plans regarding product innovation, implementing cost-cutting measures, improv-ing supply chain efficiency, enhancing processes and systems, including information technologysystems, on a global basis, and growing market share and volume. The failure to fully implementthe plans could materially and adversely affect the Company’s ability to increase net income.
CAUTIONARY STATEMENT RELEVANT TO FORWARD-LOOKING INFORMATION
Statements about future growth, profitability, costs, expectations, plans, or objectives includedin this report, including the management’s discussion and analysis, the financial statements andfootnotes, are forward-looking statements based on management’s estimates, assumptions, andprojections. These forward-looking statements are subject to risks, uncertainties, assumptionsand other important factors, many of which may be beyond the Company’s control and could causeactual results to differ materially from those expressed or implied in this report and the financialstatements and footnotes. Uncertainties contained in such statements include, but are not limited to:
• sales, earnings, and volume growth,
• general economic, political, and industry conditions, including those that could impact con-sumer spending,
• competitive conditions, which affect, among other things, customer preferences and thepricing of products, production, and energy costs,
• increases in the cost and restrictions on the availability of raw materials including agricul-tural commodities and packaging materials, the ability to increase product prices in response,and the impact on profitability,
• the ability to identify and anticipate and respond through innovation to consumer trends,
• the need for product recalls,
• the ability to maintain favorable supplier relationships,
• currency valuations and interest rate fluctuations,
• changes in credit ratings, leverage, and economic conditions, and the impact of these factors onour cost of borrowing and access to capital markets,
• the ability to execute our strategy, which includes our continued evaluation of potentialacquisition opportunities, including strategic acquisitions, joint ventures, divestitures andother initiatives, including our ability to identify, finance and complete these initiatives, andour ability to realize anticipated benefits from them,
• the ability to successfully complete cost reduction programs and increase productivity,
• the ability to effectively integrate acquired businesses, new product and packaginginnovations,
• product mix,
• the effectiveness of advertising, marketing, and promotional programs,
• supply chain efficiency,
• cash flow initiatives,
• risks inherent in litigation, including tax litigation,
8
8/3/2019 2008HeinzAR
http://slidepdf.com/reader/full/2008heinzar 23/108
• the ability to further penetrate and grow in international markets, economic or politicalinstability in those markets, particularly in Venezuela, and the performance of business inhyperinflationary environments,
• changes in estimates in critical accounting judgments and changes in laws and regulations,including tax laws,
• the success of tax planning strategies,
• the possibility of increased pension expense and contributions and other people-related costs,• the potential adverse impact of natural disasters, such as flooding and crop failures,
• the ability to implement new information systems and potential disruptions due to failures intechnology systems,
• with regard to dividends, dividends must be declared by the Board of Directors and will besubject to certain legal requirements being met at the time of declaration, as well as antic-ipated cash needs, and
• other factors as described in “Risk Factors” above.
The forward-looking statements are and will be based on management’s then current views andassumptions regarding future events and speak only as of their dates. The Company undertakes no
obligation to publicly update or revise any forward-looking statements, whether as a result of newinformation, future events or otherwise, except as required by the securities laws.
Item 1B. Unresolved Staff Comments
None.
Item 2. Properties.
See table in Item 1.
Item 3. Legal Proceedings.
None.
Item 4. Submission of Matters to a Vote of Security Holders.
None.
9
8/3/2019 2008HeinzAR
http://slidepdf.com/reader/full/2008heinzar 24/108
PART II
Item 5. Market for Registrant’s Common Equity, Related Stockholder Matters and
Issuer Purchases of Equity Securities.
Information relating to the Company’s common stock is set forth in this report on page 33 underthe caption “Stock Market Information” in Item 7—“Management’s Discussion and Analysis of Financial Condition and Results of Operations,” and on pages 72 through 73 in Note 16, “QuarterlyResults” in Item 8—“Financial Statements and Supplementary Data.”
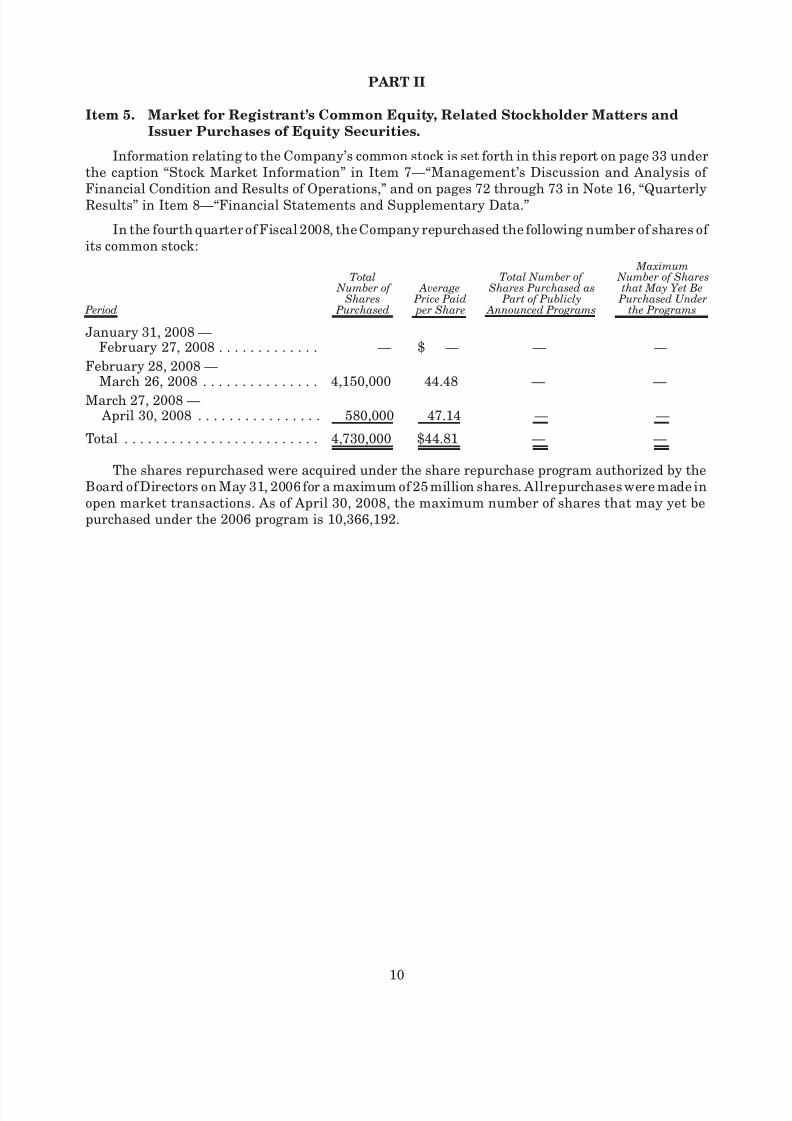
In the fourth quarter of Fiscal 2008, the Company repurchased the following number of shares of its common stock:
Period
Total Number of
Shares Purchased
Average Price Paid per Share
Total Number of Shares Purchased as
Part of Publicly Announced Programs
Maximum Number of Shares
that May Yet Be Purchased Under
the Programs
January 31, 2008 —February 27, 2008 . . . . . . . . . . . . . — $ — — —
February 28, 2008 —March 26, 2008 . . . . . . . . . . . . . . . 4,150,000 44.48 — —
March 27, 2008 — April 30, 2008 . . . . . . . . . . . . . . . . 580,000 47.14 — —
Total . . . . . . . . . . . . . . . . . . . . . . . . . 4,730,000 $44.81 — —
The shares repurchased were acquired under the share repurchase program authorized by theBoard of Directors on May 31, 2006 for a maximum of 25 million shares. Allrepurchases were made inopen market transactions. As of April 30, 2008, the maximum number of shares that may yet bepurchased under the 2006 program is 10,366,192.
10
8/3/2019 2008HeinzAR
http://slidepdf.com/reader/full/2008heinzar 25/108
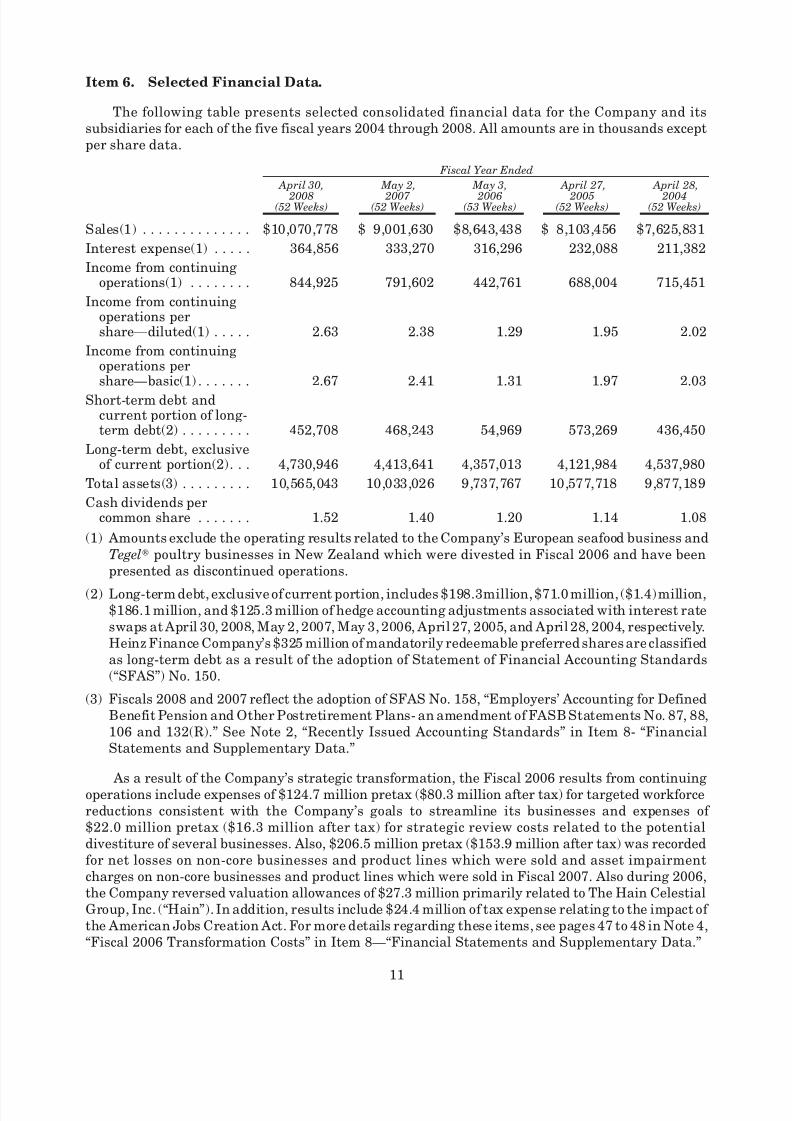
Item 6. Selected Financial Data.
The following table presents selected consolidated financial data for the Company and itssubsidiaries for each of the five fiscal years 2004 through 2008. All amounts are in thousands exceptper share data.
April 30,
2008(52 Weeks)
May 2,
2007 (52 Weeks)
May 3,
2006(53 Weeks)
April 27,
2005(52 Weeks)
April 28,
2004(52 Weeks)
Fiscal Year Ended
Sales(1) . . . . . . . . . . . . . . $10,070,778 $ 9,001,630 $8,643,438 $ 8,103,456 $7,625,831
Interest expense(1) . . . . . 364,856 333,270 316,296 232,088 211,382
Income from continuingoperations(1) . . . . . . . . 844,925 791,602 442,761 688,004 715,451
Income from continuingoperations pershare—diluted(1) . . . . . 2.63 2.38 1.29 1.95 2.02
Income from continuingoperations pershare—basic(1) . . . . . . . 2.67 2.41 1.31 1.97 2.03
Short-term debt andcurrent portion of long-term debt(2) . . . . . . . . . 452,708 468,243 54,969 573,269 436,450
Long-term debt, exclusiveof current portion(2). . . 4,730,946 4,413,641 4,357,013 4,121,984 4,537,980
Total assets(3) . . . . . . . . . 10,565,043 10,033,026 9,737,767 10,577,718 9,877,189
Cash dividends percommon share . . . . . . . 1.52 1.40 1.20 1.14 1.08
(1) Amounts exclude the operating results related to the Company’s European seafood business andTegel» poultry businesses in New Zealand which were divested in Fiscal 2006 and have beenpresented as discontinued operations.
(2) Long-term debt, exclusive of current portion, includes $198.3million, $71.0 million, ($1.4) million,$186.1 million, and $125.3 million of hedge accounting adjustments associated with interest rateswaps at April 30, 2008, May 2, 2007, May 3, 2006, April 27, 2005, and April 28, 2004, respectively.Heinz Finance Company’s $325 million of mandatorily redeemable preferred shares are classifiedas long-term debt as a result of the adoption of Statement of Financial Accounting Standards(“SFAS”) No. 150.
(3) Fiscals 2008 and 2007 reflect the adoption of SFAS No. 158, “Employers’ Accounting for DefinedBenefit Pension and Other Postretirement Plans- an amendment of FASB Statements No. 87, 88,106 and 132(R).” See Note 2, “Recently Issued Accounting Standards” in Item 8- “FinancialStatements and Supplementary Data.”
As a result of the Company’s strategic transformation, the Fiscal 2006 results from continuingoperations include expenses of $124.7 million pretax ($80.3 million after tax) for targeted workforcereductions consistent with the Company’s goals to streamline its businesses and expenses of $22.0 million pretax ($16.3 million after tax) for strategic review costs related to the potentialdivestiture of several businesses. Also, $206.5 million pretax ($153.9 million after tax) was recordedfor net losses on non-core businesses and product lines which were sold and asset impairmentcharges on non-core businesses and product lines which were sold in Fiscal 2007. Also during 2006,the Company reversed valuation allowances of $27.3 million primarily related to The Hain CelestialGroup, Inc. (“Hain”). In addition, results include $24.4 million of tax expense relating to the impact of the American Jobs Creation Act. For more details regarding these items, see pages 47 to 48 in Note 4,“Fiscal 2006 Transformation Costs” in Item 8—“Financial Statements and Supplementary Data.”
11
8/3/2019 2008HeinzAR
http://slidepdf.com/reader/full/2008heinzar 26/108
Fiscal 2005 results from continuing operations include a $64.5 million non-cash impairmentcharge for the Company’s equity investment in Hain and a $9.3 million non-cash charge to recognizethe impairment of a cost-basis investment in a grocery industry sponsored e-commerce business
venture. There was no tax benefit recorded with these impairment charges in Fiscal 2005. Fiscal 2005also includes a $27.0 million pre-tax ($18.0 million after-tax) non-cash asset impairment chargerelated to the anticipated disposition of the HAK vegetable product line in Northern Europe whichoccurred in Fiscal 2006.
Fiscal 2004 results from continuing operations include a gain of $26.3 million ($13.3 millionafter-tax) related to the disposal of a bakery business in Northern Europe, costs of $16.6 millionpretax ($10.6 million after-tax), primarily due to employee termination and severance costs related toon-going efforts to reduce overhead costs, and $4.0 million pretax ($2.8 million after-tax) due to thewrite down of pizza crust assets in the United Kingdom.
12
8/3/2019 2008HeinzAR
http://slidepdf.com/reader/full/2008heinzar 27/108
Item 7. Management’s Discussion and Analysis of Financial Condition and Results of
Operations.
Executive Overview- Fiscal 2008
The H.J. Heinz Company has been a pioneer in the food industry for 139 years and possesses oneof the world’s best and most recognizable brands— Heinz». In the first half of this decade, theCompany was reshaped around three core categories, Ketchup, Condiments and Sauces, Meals and
Snacks and Infant/Nutrition. Beginning with the spin-off of non-core U.S. businesses in December2002 and ending in Fiscal 2006 with the sales of our non-core European Seafood and New ZealandPoultry businesses, we divested over $3 billion of non-core sales from businesses where we lackedscale and competitive advantage. During this same time period, we acquired almost $1.5 billion of new revenue in core categories and faster-growing emerging markets. Consequently, our corecategories now generate almost 96% of our sales and each is showing strong growth. Additionally,our top 15 brands, each of which exceeds $100 million in annual sales, drive approximately 70% of oursales. The Heinz» brand generates almost $4 billion of annual sales and has extraordinary reachacross all of our categories and most of our markets. Our focus on three core categories, our top15 brands and emerging markets has enhanced our growth trajectory and enabled us to achieveimproved productivity.
Performance under the Fiscal 2007-2008 Superior Value and Growth Plan
Unless specifically noted, all amounts in this section represent figures over the two-year time
frame of the Plan (Fiscal 2007-2008). Also, all growth rates represent compounded annual growth
rates (“CAGR”) over this same two-year period, using Fiscal 2006 continuing operations, excluding
special items as the base (see table in “Fiscal 2006 Transformation Costs” which reconciles Fiscal 2006
reported amounts to amounts excluding special items).
On June 1, 2006, the Company presented its Superior Value and Growth Plan for fiscal years2007 and 2008. Under this Plan, the Company set forth three key operational imperatives: grow thecore portfolio, reduce costs to drive margins and generate cash to deliver superior value. Under eachof these imperatives, the Company established financial and operational targets aimed at increasingshareholder value. The Company has met or exceeded virtually all of the targets established in the
two year Plan and believes that it is well positioned for continued growth in Fiscals 2009 and 2010.For the two years ending with Fiscal 2008:
• Net sales grew at a CAGR of 8%, to over $10 billion for the first time in the Company’s history,driven primarily by strong volume and net pricing as well as favorable foreign exchange.
• Operating income grew at a CAGR of 8%, as strong top-line growth and productivity more thanoffset higher commodity costs and incremental marketing investments, which grew at aCAGR of 19%.
• Operating free cash flow in Fiscal 2008 (cash flow from operations of $1,188 million less capitalexpenditures of $302 million plus proceeds from disposals of PP&E of $9 million) grew to$895 million and was nearly $1.8 billion over the two-year Plan period.
• EPS grew to $2.63, an average annual increase of 12%.
The following is a detailed analysis of the Company’s overall performance against the threeimperatives under our Superior Value and Growth Plan.
Grow the Core Portfolio
This imperative focused on a strategy to grow our largest brands in our three core categories.This strategy established targets for average annual increased marketing spending of 17% anddouble digit increases in research and development investment (“R&D”). This strategy also focusedon expansion in various emerging markets, where growth potential was viewed as high. During
13
8/3/2019 2008HeinzAR
http://slidepdf.com/reader/full/2008heinzar 28/108
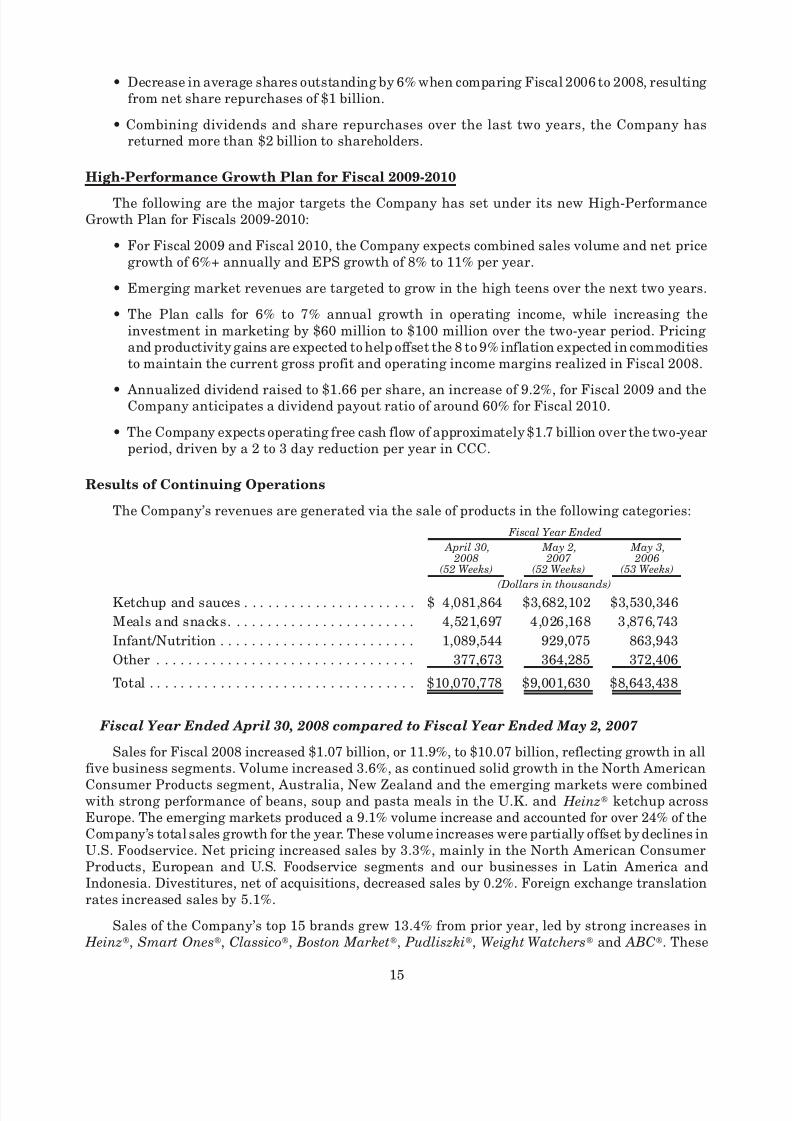
Fiscal 2008 and over the entire two-year Plan period, we delivered excellent results relative to thisimperative as evidenced by the following:
• Our top 15 brands, which generate nearly 70% of total sales, grew at a CAGR of 12%, driven bystrong volume and net price increases as well as favorable impacts from foreign exchange.
• Over the two-year Plan period, we launched a number of new products, which accounted forapproximately 11% of sales and was supported by a 19% average annual increase in
marketing.
• R&D increased at a CAGR of 18% as we increased capabilities in the areas of innovation andconsumer insight.
• Innovation in our emerging markets (Russia, Poland, the Czech Republic, Indonesia, China,India, South Africa, the Middle East and Latin America) drove strong growth, with an averageannual sales increase of 19%, which accounted for 26% of the Company’s total sales growthover the two-year period. These markets accounted for approximately 13% of total Companysales in Fiscal 2008.
Reduce Costs to Drive Margins
The Company’s investment in growth behind the core portfolio has been fueled by the secondpillar of our two-year Plan, Reducing Costs to Drive Margins. Key targets set under this imperativeincluded productivity improvements on deals and allowances (“D&A”), cost of goods sold and selling,general and administrative expenses (“SG&A”). The following summarizes our results relative to thisimperative:
• D&A as a percentage of gross sales was reduced by 170 basis points, 30 basis point ahead of ouroriginal target.
• Total gross profit dollars exceeded target expectations by $200 million, or almost 6%, althoughgross margin was 200 basis points below target due to higher than expected commodityinflation. As a result of new product introductions, volume growth, pricing, productivity and
foreign exchange, the Company has successfully offset commodity costs and achieved stronggross profit growth.
• The Company divested or closed 20 plants around the globe, 4 of which were during Fiscal2008.
• SG&A, excluding marketing, was 17.2% as a percentage of sales in Fiscal 2008, 30 basis pointsbetter than target. As a result of productivity gains in SG&A and despite a 19% averageannual increase in consumer marketing, we delivered consistent operating income growth at aCAGR of 8%.
Generate Cash to Deliver Superior Value
The Company’s growth, cost savings and working capital productivity drove operating free cashflow of almost $1.8 billion, which averaged 9% of revenue and 109% of net income over the two years.This was $123 million, or 7% ahead of the target. A key driver in achieving our strong cash flowresults was the significant reduction in our Cash Conversion Cycle (“CCC”) of 7 days, which is a 12%reduction when comparing Fiscal 2006 to 2008.
Much of this increased cash flow has been returned directly to shareholders, as evidenced by thefollowing:
• Increase in the Company’s dividend by 32 cents, or a CAGR of 12.5%, to $1.52. This increasewas to maintain our target payout ratio of approximately 60%.
14
8/3/2019 2008HeinzAR
http://slidepdf.com/reader/full/2008heinzar 29/108
• Decrease in average shares outstanding by 6% when comparing Fiscal 2006 to 2008, resultingfrom net share repurchases of $1 billion.
• Combining dividends and share repurchases over the last two years, the Company hasreturned more than $2 billion to shareholders.
High-Performance Growth Plan for Fiscal 2009-2010
The following are the major targets the Company has set under its new High-PerformanceGrowth Plan for Fiscals 2009-2010:
• For Fiscal 2009 and Fiscal 2010, the Company expects combined sales volume and net pricegrowth of 6%+ annually and EPS growth of 8% to 11% per year.
• Emerging market revenues are targeted to grow in the high teens over the next two years.
• The Plan calls for 6% to 7% annual growth in operating income, while increasing theinvestment in marketing by $60 million to $100 million over the two-year period. Pricingand productivity gains are expected to help offset the 8 to 9% inflation expected in commoditiesto maintain the current gross profit and operating income margins realized in Fiscal 2008.
• Annualized dividend raised to $1.66 per share, an increase of 9.2%, for Fiscal 2009 and theCompany anticipates a dividend payout ratio of around 60% for Fiscal 2010.
• The Company expects operating free cash flow of approximately $1.7 billion over the two-yearperiod, driven by a 2 to 3 day reduction per year in CCC.
Results of Continuing Operations
The Company’s revenues are generated via the sale of products in the following categories:
April 30, 2008
(52 Weeks)
May 2, 2007
(52 Weeks)
May 3, 2006
(53 Weeks)
Fiscal Year Ended
(Dollars in thousands)Ketchup and sauces . . . . . . . . . . . . . . . . . . . . . . $ 4,081,864 $3,682,102 $3,530,346
Meals and snacks. . . . . . . . . . . . . . . . . . . . . . . . 4,521,697 4,026,168 3,876,743
Infant/Nutrition . . . . . . . . . . . . . . . . . . . . . . . . . 1,089,544 929,075 863,943
Other . . . . . . . . . . . . . . . . . . . . . . . . . . . . . . . . . 377,673 364,285 372,406
Total . . . . . . . . . . . . . . . . . . . . . . . . . . . . . . . . . . $10,070,778 $9,001,630 $8,643,438
Fiscal Year Ended April 30, 2008 compared to Fiscal Year Ended May 2, 2007
Sales for Fiscal 2008 increased $1.07 billion, or 11.9%, to $10.07 billion, reflecting growth in allfive business segments. Volume increased 3.6%, as continued solid growth in the North American
Consumer Products segment, Australia, New Zealand and the emerging markets were combinedwith strong performance of beans, soup and pasta meals in the U.K. and Heinz» ketchup acrossEurope. The emerging markets produced a 9.1% volume increase and accounted for over 24% of theCompany’s total sales growth for the year. These volume increases were partially offset by declines inU.S. Foodservice. Net pricing increased sales by 3.3%, mainly in the North American ConsumerProducts, European and U.S. Foodservice segments and our businesses in Latin America andIndonesia. Divestitures, net of acquisitions, decreased sales by 0.2%. Foreign exchange translationrates increased sales by 5.1%.
Sales of the Company’s top 15 brands grew 13.4% from prior year, led by strong increases in Heinz», Smart Ones», Classico», Boston Market», Pudliszki», Weight Watchers» and ABC». These
15
8/3/2019 2008HeinzAR
http://slidepdf.com/reader/full/2008heinzar 30/108
increases are a result of the Company’s strategy of focused innovation and marketing support behindthese top brands.
Gross profit increased $288 million, or 8.5%, to $3.68 billion, benefiting from favorable volume,pricing and foreign exchange translation rates. The gross profit margin decreased to 36.5% from37.7%, as pricing and productivity improvements were more than offset by increased commoditycosts. The most significant commodity cost increases were for dairy, oils and grains.
SG&A increased $166 million, or 8.5%, to $2.11 billion. As a percentage of sales, SG&A decreasedto 21.0% from 21.6%. The increase in SG&A is due to a 14.9% increase in marketing expense, a 16.9%increase in R&D and higher selling and distribution costs (“S&D”) resulting from increased volume,higher fuel costs and foreign exchange translation rates. Additional investments were also made inthe current year for global task force initiatives, streamlining and system capability improvements.These increases were partially offset by the benefits of effective cost control and prior year workforcereductions and costs related to the proxy contest.
Total marketing support (recorded as a reduction of revenue or as a component of SG&A)increased $177 million, or 8.1%, to $2.36 billion on a gross sales increase of 11.0%. Marketing supportrecorded as a reduction of revenue, typically D&A, increased $127 million, or 6.9%, to $1.98 billion,but decreased as a percentage of gross sales to 16.4% from 17.1%, in line with the Company’s strategyto reduce spending on less efficient promotions and realignment of some list prices. Marketingsupport recorded as a component of SG&A increased $50 million, or 14.9%, to $383 million, as weincreased consumer marketing across the Company’s businesses supporting innovation and our topbrands.
Operating income increased $122 million, or 8.5%, to $1.57 billion, reflecting the strong salesgrowth, productivity improvements and favorable impacts from foreign exchange, partially offset byincreased commodity costs.
Net interest expense increased $32 million, to $323 million, largely as a result of higher debt inFiscal 2008 related to share repurchase activity. Other expenses, net, decreased $3 million to$28 million, primarily due to an insignificant gain recognized on the sale of our business in
Zimbabwe.
The current year effective tax rate was 30.6% compared to 29.6% for the prior year. The currentyear’s tax rate was higher than the prior year’s primarily due to benefits recognized in Fiscal 2007 forreversal of a foreign tax reserve, tax planning completed in a foreign jurisdiction, and R&D taxcredits. Those prior year benefits were partially offset by lower repatriation costs and increasedbenefits from tax audit settlements occurring during Fiscal 2008, along with changes in valuationallowances for foreign losses.
Income from continuing operations was $845 million compared to $792 million in the prior year,an increase of 6.7%, due to the increase in operating income, which was partially offset by higher netinterest expense and a higher effective tax rate. Diluted earnings per share from continuingoperations were $2.63 in the current year compared to $2.38 in the prior year, up 10.5%, whichalso benefited from a 3.2% reduction in fully diluted shares outstanding.
FISCAL YEAR 2008 OPERATING RESULTS BY BUSINESS SEGMENT
During the first quarter of Fiscal 2008, the Company changed its segment reporting to reclassifyits business in India from the Rest of World segment to the Asia/Pacific segment, reflecting orga-nizational changes. Prior periods have been conformed to the current presentation. (See Note 15,“Segments” in Item 8—“Financial Statements and Supplementary Data” for further discussion of theCompany’s reportable segments).
16
8/3/2019 2008HeinzAR
http://slidepdf.com/reader/full/2008heinzar 31/108
North American Consumer Products
Sales of the North American Consumer Products segment increased $272 million, or 9.9%, to$3.01 billion. Volume increased 3.5%, due primarily to Smart Ones» frozen entrees and desserts ,
Boston Market» frozen entrees and Classico» pasta sauces. The Smart Ones» volume improvementwas driven by successful new product introductions like Anytime SelectionsTM, Fruit InspirationsTM
and various dessert items, as well as the impact of the launch of Smart Ones» products into Canada.
The Boston Market»
improvements were mainly driven by new products and increased consumption,and the success of Classico» was primarily due to new products as well as increased promotions inCanada. These volume improvements were partially offset by a decline in Ore-Ida» frozen potatoesreflecting the timing of price increases taken during both the fourth quarter of last year and the thirdquarter of this year. The Ore-Ida» frozen potatoes price increases, along with other commodity costrelated price increases, resulted in overall price gains of 3.5%. The prior year acquisition of Renee’sGourmet Foods in Canada increased sales 0.7% and favorable Canadian exchange translation ratesincreased sales 2.2%.
Gross profit increased $85 million, or 7.5%, to $1.22 billion, due primarily to the sales increasealong with favorable foreign exchange translation rates. The gross profit margin decreased to 40.5%from 41.4%, as increased pricing, favorable mix and productivity improvements only partially offsetincreased commodity costs. Operating income increased $53 million, or 8.4%, to $678 million, due to
the strong increase in sales, partially offset by higher commodity costs and increased S&D due tohigher volume and fuel costs.
Europe
Heinz Europe sales increased $456 million, or 14.8%, to $3.53 billion, driven by new productinnovation and more focus on the key brands in the portfolio. Volume increased 4.5%, principally dueto strong performance of Heinz» ketchup across Europe, soup, beans and pasta meals in the U.K.,
Pudliszki» branded products in Poland, and Heinz» sauces and condiments in Russia. Volume alsobenefited from new product introductions across continental Europe, such as Weight Watchers» BigSoups in Germany, Austria and Switzerland. Net pricing increased sales 3.3%, resulting chiefly fromcommodity-related price increases on Heinz» ketchup and soup, the majority of the products in our
Russian market and Italian infant nutrition products. Pricing was also favorable due to promotionaltiming on Heinz» beans. Divestitures, net of acquisitions, reduced sales 1.4% and favorable foreignexchange translation rates increased sales by 8.5%.
Gross profit increased $135 million, or 10.9%, to $1.37 billion, and the gross profit margindecreased to 38.8% from 40.2%. The 10.9% increase reflects improved pricing and volume and thefavorable impact of foreign exchange translation rates, while the decline in gross profit margin islargely due to increased commodity costs and higher manufacturing costs in our U.K., European frozenand Netherlands businesses. Operating income increased $71 million, or 12.4%, to $637 million, due tohigher sales and reductions in general and administrative expenses (“G&A”), partially offset by highercommodity costs and increased marketing spending in support of our strong brands across Europe.
Asia/Pacific
Heinz Asia/Pacific sales increased $281 million, or 21.3%, to $1.60 billion. Volume increased6.5%, reflecting significant improvements across the majority of the businesses within this segment,particularly Australia, India and China, related primarily to new product introductions supported bya 34.7% increase in marketing. Pricing increased 2.8%, due to increases on soy sauce and beveragesin Indonesia, LongFong» frozen products in China and nutritional products in India. Acquisitions,net of divestitures, increased sales 1.6%, and favorable foreign exchange translation rates increasedsales by 10.4%.
Gross profit increased $101 million, or 23.9%, to $526 million, and the gross profit marginincreased to 32.9% from 32.2%. These increases were due to increased volume, pricing, favorable mix
17
8/3/2019 2008HeinzAR
http://slidepdf.com/reader/full/2008heinzar 32/108
and foreign exchange translation rates, which more than offset increased commodity costs. Oper-ating income increased by $45 million, or 29.8%, to $195 million, primarily reflecting the increase insales and gross margin, partially offset by increased marketing spending and increased S&D due tohigher volume.
U.S. Foodservice
Sales of the U.S. Foodservice segment increased $3 million, or 0.2%, to $1.56 billion. Pricingincreased sales 1.7%, largely due to commodity-related price increases and reduced promotionalspending on Heinz» ketchup, frozen soup and tomato products, partially offset by declines in frozendesserts. Volume decreased by 1.1%, as higher volume from frozen desserts sold to casual diningcustomers was more than offset by declines in the portion control business, tomato products andfrozen appetizers. The volume reflected softness in the U.S. restaurant business as well as increasedcompetition on our non-branded products. Divestitures reduced sales 0.4%.
Gross profit decreased $47 million, or 10.0%, to $419 million, and the gross profit margindecreased to 26.8% from 29.9%, as commodity costs continue to disproportionately impact thefoodservice business, despite gains on commodity derivative contracts. The declines also reflectcosts incurred in the current year in anticipation of a plant closure in the first quarter of Fiscal 2009,partially offset by increased pricing and productivity. Operating income decreased $47 million, or21.5%, to $170 million, all of which is due to the decline in gross profit. The Company is simplifying itsU.S. Foodservice business, while increasing the level of innovation in its foodservice brands, andexpects more profitable growth in this segment as macroeconomic conditions improve.
Rest of World
Sales for Rest of World increased $58 million, or 18.7%, to $368 million. Volume increased 6.3%due primarily to increased demand for the Company’s products in Latin America as well as strongperformance across our Middle East business. Higher pricing increased sales by 13.6%, largely due toprice increases and reduced promotions in Latin America as well as commodity-related priceincreases in South Africa. Divestitures reduced growth 1.7% and favorable foreign exchange trans-lation rates increased sales 0.6%.
Gross profit increased $22 million, or 19.9%, to $133 million, due mainly to increased pricing,higher volume and improved business mix, partially offset by increased commodity costs. Operatingincome increased $6 million, or 15.1%, to $45 million.
Fiscal Year Ended May 2, 2007 compared to Fiscal Year Ended May 3, 2006
Sales for Fiscal 2007 increased $358 million, or 4.1%, to $9.00 billion. Sales were favorablyimpacted by a volume increase of 0.7%, despite one less selling week in Fiscal 2007 compared withFiscal 2006. Volume growth was led by North American Consumer Products, Australia, New Zealandand Germany, and the emerging markets of India, China and Poland. These increases were partiallyoffset by declines in the U.K. and Russian businesses. Pricing increased sales by 2.1%, mainly due toour businesses in North America, the U.K, Indonesia and Latin America. Divestitures, net of acquisitions, decreased sales by 1.6%. Foreign exchange translation rates increased sales by 2.9%.
Gross profit increased $300 million, or 9.7%, to $3.39 billion, and the gross profit marginincreased to 37.7% from 35.8%. These improvements reflect higher volume, increased pricing,productivity improvements and favorable foreign exchange translation rates, partially offset bycommodity cost increases. Also contributing to the favorable comparison are the $92 million of Fiscal2006 strategic transformation costs discussed below.
SG&A decreased $33 million, or 1.7%, to $1.95 billion and decreased as a percentage of sales to21.6% from 22.9%. These decreases are primarily due to the favorable impact of the Fiscal 2006targeted workforce reductions, particularly in Europe and Asia, and the $145 million of Fiscal 2006
18
8/3/2019 2008HeinzAR
http://slidepdf.com/reader/full/2008heinzar 33/108
strategic transformation costs discussed below. These declines were partially offset by increasedmarketing and R&D expenses, costs related to the proxy contest affecting the Company’s 2006election of directors, and higher incentive compensation costs, including the expensing of stockoptions (SFAS No. 123R). S&D was higher as a result of the volume increase; however, as apercentage of sales, S&D declined.
Total marketing support (recorded as a reduction of revenue or as a component of SG&A)
increased $4 million, or 0.2%, to $2.18 billion on a gross sales increase of 2.8%. Marketing supportrecorded as a reduction of revenue, typically D&A, decreased $60 million, or 3.1%, to $1.85 billion.This decrease is largely due to spending reductions on less efficient promotions and a realignment of list prices, partially offset by the impact of foreign exchange translation rates. Marketing supportrecorded as a component of SG&A increased $64 million, or 23.8%, to $334 million, consistent withthe Company’s continued strategy to invest behind its key brands.
Operating income increased $333 million, or 29.9%, to $1.45 billion, which was favorablyimpacted by increased volume, the higher gross profit margin and the $236 million of Fiscal 2006strategic transformation costs discussed below.
Net interest expense increased $8 million, to $291 million, due primarily to higher averageinterest rates and higher average debt in Fiscal 2007. Fiscal 2006 income from continuing operations
was unfavorably impacted by the $111 million write down of the Company’s net investment inZimbabwe. Other expenses, net, increased $5 million, to $31 million, largely due to increasedcurrency losses and minority interest expense, the later of which is a result of improved businessperformance in our joint ventures, partially offset by the $7 million loss on the sale of the Company’sequity investment in The Hain Celestial Group, Inc. (“Hain”) in Fiscal 2006.
The Fiscal 2007 effective tax rate was 29.6% compared to 36.2% in Fiscal 2006. During the firstquarter of Fiscal 2007, a foreign subsidiary of the Company revalued certain of its assets, under locallaw, increasing the local tax basis by approximately $245 million. This revaluation reduced Fiscal2007 tax expense by approximately $35 million. During the third quarter of Fiscal 2007, finalconditions necessary to reverse a foreign tax reserve related to a prior year transaction wereachieved. As a result, the Company realized a non-cash tax benefit of $64 million. At the sametime, the Company modified its plans for repatriation of foreign earnings, ultimately incurring anadditional charge of $90 million. Full year Fiscal 2007 repatriation costs were $108 million, exceedingFiscal 2006’s repatriation costs by approximately $78 million. In addition, Fiscal 2007 tax expensebenefited from the reductions in foreign statutory tax rates and initiatives associated with R&D taxcredits. The Fiscal 2006 tax expense benefited from the reversal of a tax provision of $23 millionrelated to a foreign affiliate along with an additional benefit of $16 million resulting from taxplanning initiatives related to foreign tax credits, which was partially offset by the non-deductibilityof certain asset write-offs.
Income from continuing operations was $792 million compared to $443 million in Fiscal 2006, anincrease of 78.8%, primarily due to the increase in operating income and a lower effective tax rate,partially offset by higher net interest expense. Diluted earnings per share from continuing opera-tions was $2.38 in Fiscal 2007 compared to $1.29 in Fiscal 2006, an increase of 84.5%, which also
benefited from a 2.8% reduction in fully diluted shares outstanding.
FISCAL YEAR 2007 OPERATING RESULTS BY BUSINESS SEGMENT
North American Consumer Products
Sales of the North American Consumer Products segment increased $185 million, or 7.3%, to$2.74 billion. Volume increased 2.6%, largely resulting from strong growth in Smart Ones» and
Boston Market» frozen entrees and desserts, Classico» pasta sauces and Ore-Ida» frozen potatoes.The increases reflect new distribution, increased consumption driven by new product launches and
19
8/3/2019 2008HeinzAR
http://slidepdf.com/reader/full/2008heinzar 34/108
increased marketing support. These increases were partially offset by the expected volume decline in Heinz» ketchup, reflecting a reduction in promotion expense as part of the strategy to increaseconsumption of more profitable larger sizes. Pricing increased 2.1% largely due to Heinz» ketchup,Ore-Ida» frozen potatoes, Smart Ones» frozen entrees and Bagel Bites» and TGI Friday’s» frozensnacks, all resulting primarily from reduced inefficient promotions. Acquisitions increased sales1.9%, primarily from the Fiscal 2006 acquisitions of Nancy’s Specialty Foods and HP Foods as well asthe Fiscal 2007 acquisition of Renée’s Gourmet Foods. Favorable Canadian exchange translation
rates increased sales 0.7%.
Gross profit increased $86 million, or 8.2%, to $1.14 billion, and the gross profit margin increasedto 41.4% from 41.1%. These improvements were due primarily to increased volume, higher pricingand the favorable impact of acquisitions, partially offset by increased commodity costs. Operatingincome increased $42 million, or 7.3%, to $626 million, mainly due to the improvement in gross profitand $7 million of Fiscal 2006 transformation costs discussed below. This increase was partially offsetby a $32 million or 40.4% increase in consumer marketing, primarily for Heinz» ketchup, Smart
Ones» frozen entrees, Ore-Ida» frozen potatoes and frozen snacks, and increased R&D costs. Inaddition, operating income benefited from reduced S&D as a percentage of sales due to reducedtransportation costs resulting from distribution efficiencies.
Europe
Heinz Europe’s sales increased $89 million, or 3.0%, to $3.08 billion. Pricing increased 1.7%,driven primarily by value-added innovation and reduced promotions on Heinz» soup and pasta mealsin the U.K and in the Italian infant nutrition business. Volume declined 2.4% as improvements in
Heinz» ketchup, Heinz» beans, Weight Watchers» branded products and Pudliszki» ketchup andready meals in Poland were more than offset by market softness in non- Heinz» branded products inRussia and the non-branded European frozen business and declines in U.K. ready-to-serve soups andpasta convenience meals. Volume was also unfavorably impacted by one less week in the 2007 fiscalyear compared to the 2006 fiscal year. The acquisition of HP Foods and Petrosoyuz in Fiscal 2006increased sales 1.9%, while divestitures reduced sales 5.6%. Favorable foreign exchange translationrates increased sales by 7.3%.
Gross profit increased $112 million, or 10.0%, to $1.24 billion, and the gross profit marginincreased to 40.2% from 37.6%. These improvements are due to higher pricing, favorable impact of foreign exchange translation rates and $36 million of Fiscal 2006 transformation costs discussedbelow. These improvements were partially offset by reduced volume and increased commodity andmanufacturing costs. Operating income increased $152 million, or 36.7%, to $566 million, due to theincrease in gross profit, the $112 million of Fiscal 2006 transformation costs discussed below, andreduced G&A, partially offset by increased marketing expense. The decrease in G&A is driven by theworkforce reductions, including the elimination of European headquarters.
Asia/Pacific
Sales in Asia/Pacific increased $98 million, or 8.0%, to $1.32 billion. Volume increased sales 4.6%,
reflecting strong volume in Australia, New Zealand and China, largely due to increased marketingand new product introductions, as well as market and share growth in nutritional drinks in India.Higher pricing increased sales 2.3%, mainly due to commodity-related price increases taken onIndonesian sauces and drinks. Divestitures reduced sales 0.3%, and foreign exchange translationrates increased sales by 1.5%.
Gross profit increased $50 million, or 13.4%, to $425 million, and the gross profit marginincreased to 32.2% from 30.7%. These improvements were due to volume increases and higherpricing, partially offset by increased commodity costs, most notably in Indonesia. Fiscal 2006 alsoincluded a $19 million asset impairment charge on an Indonesian noodle business. Operating incomeincreased $49 million, to $150 million, largely reflecting the increase in gross profit and reduced
20
8/3/2019 2008HeinzAR
http://slidepdf.com/reader/full/2008heinzar 35/108
G&A, partially offset by increased marketing. The reduction in G&A is a result of effective costcontrol in our Chinese businesses, targeted workforce reductions, including the elimination of Asianheadquarters in Fiscal 2006, and $10 million of reorganization costs in Fiscal 2006 related to theworkforce reductions discussed below.
U.S. Foodservice
Sales of the U.S. Foodservice segment decreased $14 million, or 0.9%, to $1.56 billion, primarilydue to the impact of divestitures. Divestitures, net of acquisitions, reduced sales 2.1%. Pricingincreased 1.7%, largely due to Heinz» ketchup and tomato products, single serve condiments andfrozen desserts. Volume decreased 0.4%, as higher volume in Heinz» ketchup was offset by declinesresulting primarily from one less week in Fiscal 2007 and a decision to exit certain low marginaccounts.
Gross profit increased $29 million, or 6.6%, to $465 million, and the gross profit margin increasedto 29.9% from 27.8%, due to $8 million of Fiscal 2006 reorganization costs discussed below and a$22 million impairment charge in Fiscal 2006 related to the sale of the Portion Pac Bulk product line.In addition, increased pricing was offset by higher commodity costs. Operating income increased$39 million, or 21.9%, to $216 million, largely due to the increase in gross profit and reduced S&Dexpense as a percentage of sales resulting from productivity initiatives.
Rest of World
Sales for Rest of World decreased $0.9 million, or 0.3%, to $310 million. Volume increased 5.0%due primarily to ketchup and baby food in Latin America and our business in South Africa. Higherpricing increased sales by 8.9%, largely due to reduced promotions on ketchup and price increasestaken on baby food in Latin America. Divestitures reduced sales 11.8% and foreign exchangetranslation rates reduced sales 2.3%.
Gross profit increased $17 million, or 18.4%, to $111 million, as increased volume and higherpricing were partially offset by higher commodity costs and the impact of divestitures. Fiscal 2006also included $8 million of asset impairment charges discussed below. Operating income increased
$38 million, to $39 million, due primarily to the increase in gross profit and the $30 million of Fiscal2006 transformation costs primarily related to divestitures.
As a result of general economic uncertainty, coupled with restrictions on the repatriation of earnings, as of the end of November 2002 the Company deconsolidated its Zimbabwean operationsand classified its remaining net investment of approximately $111 million as a cost investment. Inthe fourth quarter of Fiscal 2006, the Company wrote off its net investment in Zimbabwe. Thedecision to write off the Zimbabwe investment related to management’s determination that thisinvestment was not a core business. Management’s determination was based on an evaluation of political and economic conditions existing in Zimbabwe and the ability for the Company to recover itscost in this investment. This evaluation considered the continued economic turmoil, further insta-bility in the local currency and the uncertainty regarding the ability to source raw material in thefuture.
Discontinued Operations
During fiscal years 2003 through 2006, the Company focused on exiting non-strategic businessoperations. Certain of these businesses which were sold were accounted for as discontinuedoperations.
In the fourth quarter of Fiscal 2006, the Company completed the sale of the European Seafoodbusiness, which included the brands of John West», Petit Navire», Marie Elisabeth» and Mareblu».The Company received net proceeds of $469 million for this disposal and recognized a $200 millionpretax ($123 million after tax) gain which has been recorded in discontinued operations. Also in the
21
8/3/2019 2008HeinzAR
http://slidepdf.com/reader/full/2008heinzar 36/108
fourth quarter of Fiscal 2006, the Company completed the sale of the Tegel» Poultry business in NewZealand and received net proceeds of $150 million, and recognized a $10 million non-taxable gain,which is also recorded in discontinued operations.
In accordance with accounting principles generally accepted in the United States of America, theoperating results related to these businesses have been included in discontinued operations in theCompany’s consolidated statements of income. The Company recorded a loss of $3 million ($6 million
after-tax) from these businesses for the year ended May 2, 2007, primarily resulting from purchaseprice adjustments pursuant to the transaction agreements. These discontinued operations generatedsales of $688 million (partial year) and net income of $169 million (net of $90 million in tax expense)for the year ended May 3, 2006.
In addition, net income from discontinued operations includes amounts related to the favorablesettlement of tax liabilities associated with the businesses spun-off to Del Monte in Fiscal 2003. Suchamounts totaled $34 million for the year ended May 3, 2006.
Fiscal 2006 Transformation Costs
In executing its strategic transformation during Fiscal 2006, the Company incurred the follow-
ing associated costs. These costs were directly linked to the Company’s transformation strategy.
Reorganization Costs
In Fiscal 2006, the Company recorded pretax integration and reorganization charges for tar-geted workforce reductions consistent with the Company’s goals to streamline its businesses totaling$125 million ($80 million after tax). Approximately 1,000 positions were eliminated as a result of thisprogram, primarily in the G&A area. Additionally, pretax costs of $22 million ($16 million after tax)were incurred in Fiscal 2006, primarily as a result of the strategic reviews related to the portfoliorealignment.
The total impact of these initiatives on continuing operations in Fiscal 2006 was $147 million
pre-tax ($97 million after-tax), of which $17 million was recorded as costs of products sold and$129 million in SG&A. In addition, $11 million was recorded in discontinued operations, net of tax.The amount included in accrued expenses related to these initiatives totaled $52 million at May 3,2006, all of which was paid during Fiscal 2007.
Other Divestitures/Impairment Charges
The following (losses)/gains or non-cash asset impairment charges were recorded in continuingoperations during Fiscal 2006:
Business or Product Line Segment Pre-Tax After-Tax
(In millions)
Loss on sale of Seafood business in Israel. . . . . . . . . . . . . . . Rest of World $ (16) $ (16)Impairment charge on Portion Pac Bulk product line . . . . . U.S. Foodservice (22) (13)
Impairment charge on U.K. Frozen and Chilled productlines . . . . . . . . . . . . . . . . . . . . . . . . . . . . . . . . . . . . . . . . . . Europe (15) (15)
Impairment charge on European production assets . . . . . . . Europe (19) (19)
Impairment charge on Noodle product line in Indonesia . . . Asia/Pacific (16) (9)
Impairment charge on investment in Zimbabwe business . . Rest of World (111) (106)
Other . . . . . . . . . . . . . . . . . . . . . . . . . . . . . . . . . . . . . . . . . . . Various (2) 1
Total . . . . . . . . . . . . . . . . . . . . . . . . . . . . . . . . . . . . . . . . . . . $(200) $(177)
22
8/3/2019 2008HeinzAR
http://slidepdf.com/reader/full/2008heinzar 37/108
Of the above pre-tax amounts, $74 million was recorded in cost of products sold, $16 million inSG&A, $111 million in asset impairment charges for cost and equity investments, and $(1) million inother expense.
Also during the third quarter of Fiscal 2006, the Company sold its equity investment in Hain andrecognized a $7 million ($5 million after-tax) loss which is recorded within other expense, net. Netproceeds from the sale of this investment were $116 million. During the third quarter of Fiscal 2005,
the Company recognized a $65 million impairment charge on its equity investment in Hain. Thecharge reduced Heinz’s carrying value in Hain to fair market value as of January 26, 2005, with noresulting impact on cash flows. Due to the uncertainty of realizability and executing possible taxplanning strategies, the Company recorded a valuation allowance of $27 million against the potentialtax benefits primarily related to the Hain impairment. This valuation allowance was subsequentlyreleased in Fiscal 2006 based upon tax planning strategies that are expected to generate sufficientcapital gains that will occur during the capital loss carryforward period. See further discussion inNote 7, “Income Taxes” in Item 8—“Financial Statements and Supplementary Data.”
There were no material gains/(losses) on divested businesses or asset impairment charges inFiscals 2008 or 2007.
Other Non-recurring—American Jobs Creation Act
The American Jobs Creation Act (“AJCA”) provided a deduction of 85% of qualified foreigndividends in excess of a “Base Period” dividend amount. During Fiscal 2006, the Company finalizedplans to repatriate dividends that qualified under the AJCA. The total impact of the AJCA on taxexpense for Fiscal 2006 was $17 million, of which $24 million of expense was recorded in continuingoperations and $7 million was a benefit in discontinued operations.
The Company reports its financial results in accordance with accounting principles generallyaccepted in the United States of America (“GAAP”). However, management believes that certain non-GAAP performance measures and ratios, used in managing the business, may provide users of this
financial information with additional meaningful comparisons between current results and resultsin prior periods. Non-GAAP financial measures should be viewed in addition to, and not as analternative for, the Company’s reported results prepared in accordance with GAAP. The followingtable provides a reconciliation of the Company’s reported results from continuing operations to theresults excluding special items for the fiscal year ended May 3, 2006:
Net Sales
Gross Profit
Operating Income
Income fromContinuingOperations
Earnings Per Share —Diluted
Fiscal Year Ended May 3, 2006
(Amounts in millions, except per share amounts)
Reported results from continuingoperations . . . . . . . . . . . . . . . . . . . . . . . . . $8,643 $3,093 $1,114 $443 $1.29
Separation, downsizing and integration . . — 17 147 97 0.28
Net loss on disposals & impairments . . . . — 74 90 48 0.14
Asset impairment charges for cost andequity investments . . . . . . . . . . . . . . . . — — — 106 0.31
American Jobs Creation Act . . . . . . . . . . . — — — 24 0.07
Results from continuing operationsexcluding special items . . . . . . . . . . . . . . . $8,643 $3,185 $1,350 $718 $2.10
(Note: Totals may not add due to rounding.)
23
8/3/2019 2008HeinzAR
http://slidepdf.com/reader/full/2008heinzar 38/108
Liquidity and Financial Position
For Fiscal 2008, cash provided by operating activities was $1.19 billion, an increase of $126 millionfrom the prior year. The increase in Fiscal 2008 versus Fiscal 2007 is primarily due to favorablemovements in accounts payable and income taxes, and cash paid in the prior year for reorganizationcosts related to workforce reductions in Fiscal 2006. These improvements were partially offset byhigher inventories and receivables. The higher inventory levels were required to support customer
service demands created by the Company’s strong growth. The Company’s cash conversion cycle of 49 days in Fiscal 2008 was consistent with that of Fiscal 2007, as a two day improvement in payableswas offset by a two day increase in inventories. Days in inventory increased this year due to the volumegrowth and related capacity constraints in a number of areas.
During the first quarter of Fiscal 2007, a foreign subsidiary of the Company revalued certain of its assets, under local law, increasing the local tax basis by approximately $245 million. As a result of this revaluation, the Company incurred a foreign income tax liability of approximately $30 millionrelated to this revaluation which was paid during the third quarter of Fiscal 2007. Additionally, cashflow from operations is expected to be improved by approximately $90 million over the five to twentyyear tax amortization period.
Cash used for investing activities totaled $554 million compared to $326 million last year.
Capital expenditures totaled $302 million (3.0% of sales) compared to $245 million (2.7% of sales) lastyear, which reflect capacity-related spending in support of future growth and an ongoing investmentin improved systems. Proceeds from disposals of property, plant and equipment were $9 millioncompared to $61 million in the prior year, representing the disposal of four plants in the current year
versus 16 plants during Fiscal 2007. In Fiscal 2008, cash paid for acquisitions, net of divestitures,required $88 million, primarily related to the acquisition of the license to the Cottee’s» and Rose’s»
premium branded jams, jellies and toppings business in Australia and New Zealand, the Wyko» saucebusiness in the Netherlands and the buy-out of the minority ownership on the Company’s Long Fongbusiness in China, partially offset by the divestiture of a tomato paste business in Portugal. In Fiscal2007, acquisitions, net of divestitures, used $93 million primarily related to the Company’s purchaseof Renée’s Gourmet Foods and the purchase of the minority ownership in our Heinz Petrosoyuzbusiness in Russia. Divestitures in the prior year included the sale of a non-core U.S. Foodservice
product line, a frozen and chilled product line in the U.K. and a pet food business in Argentina. Inaddition, transaction costs related to the European Seafood and Tegel» Poultry divestitures were alsopaid during Fiscal 2007. During Fiscal 2008, the Company terminated the cross currency swaps thatwere previously designated as net investment hedges of foreign operations. The notional amount of these contracts totaled $1.6 billion, and the Company paid $93 million of cash to the counterparties,which is presented in investing activities in the consolidated statements of cash flows. In addition,the Company paid $74 million in the current year and $41 million in the prior year to the counter-parties as a result of cross currency swap contract maturities and such payments are presentedwithin other investing items, net.
The early termination of the net investment hedges described above and interest rate swapsdescribed below were completed in conjunction with the reorganizations of the Company’s foreign
operations and interest rate swap portfolio.
Cash used by financing activities totaled $758 million compared to $621 million last year.Proceeds from commercial paper and short-term debt were $484 million this year compared to$384 million in the prior year. Payments on long-term debt were $368 million in the current yearcompared to $52 million in the prior year, representing the maturity and payment of the $300 million6% U.S. Dollar Notes in the current year as well as the repurchase in Fiscal2008 of a portion of the 6%U.S. Dollar Notes due March 15, 2012. Cash used for the purchases of treasury stock, net of proceedsfrom option exercises, was $502 million this year compared to $501 million in the prior year, in linewith the Company’s plans for repurchasing $1 billion in net shares cumulatively in Fiscals 2007 and2008. Dividend payments totaled $485 million, compared to $461 million in the prior year, reflecting
24
8/3/2019 2008HeinzAR
http://slidepdf.com/reader/full/2008heinzar 39/108
an 8.6% increase in the annualized dividend on common stock. During Fiscal 2008, the Companyterminated certain interest rate swaps that were previously designated as fair value hedges of fixedrate debt obligations. The notional amount of these interest rate contracts totaled $612 million, andthe Company received a total of $104 million of cash from the termination of these contracts, whichhas been presented in the consolidated statements of cash flows within financing activities. The$104 million gain is being amortized to reduce interest expense over the remaining term of thecorresponding debt obligations (average of 22 years).
In Fiscal 2006, the Company divested its European Seafood business and Tegel» Poultrybusiness in New Zealand, and such divestitures were accounted for as discontinued operations.The cash flows from these discontinued operations have been combined with the operating, investingand financing cash flows from continuing operations (i.e., no separate classification of cash flows fromdiscontinued operations) for all periods presented. The absence of the cash flows from these discon-tinued operations will not have a material impact on the Company’s future liquidity and capitalresources.
In Fiscal 2003, the Company spun-off businesses to Del Monte and treated the operating resultsrelated to these businesses as discontinued operations. In Fiscals 2007 and 2006, the Companygenerated cash flows from the favorable settlement of tax liabilities related to these spun-off businesses. These cash flows, which represent solely cash flows from operations, have been classified
separately on the Company’s Consolidated Statements of Cash Flows for Fiscals 2007 and 2006 as“Cash provided by operating activities of discontinued operations spun-off to Del Monte.” There wasno impact on cash flows from investing or financing activities from these spun-off businesses in thesefiscal years.
On May 29, 2008, the Company announced that its Board of Directors approved a 9.2% increasein the dividend on common stock from 38 cents to 41.5 cents quarterly to an annual indicative rate of $1.66 per share for Fiscal 2009, effective with the July 2008 dividend payment. Fiscal 2009 dividendsare expected to be approximately $525 million.
At April 30, 2008, the Company had total debt of $5.18 billion (including $199 million relating tothe SFAS No. 133 hedge accounting adjustments) and cash and cash equivalents of $618 million.
Total debt balances since prior year end increased primarily due to share repurchases.Return on average shareholders’ equity (“ROE”) is calculated by taking net income divided by
average shareholders’ equity. Average shareholders’ equity is a five-point quarterly average. ROEwas 44.0% in Fiscal 2008, 37.4% in Fiscal 2007 and 29.1% in Fiscal 2006. Fiscal 2008 and 2007 ROEwas favorably impacted by higher net income and decreased average equity reflecting the adoption of SFAS No. 158 and share repurchases. Fiscal 2006 ROE was unfavorably impacted by 6.5% due to thepreviously discussed strategic transformation costs.
Return on invested capital (“ROIC”) is calculated by taking net income, plus net interest expensenet of tax, divided by average invested capital. Average invested capital is a five-point quarterlyaverage of debt plus total equity less cash and cash equivalents, short-term investments and theSFAS No. 133 hedge accounting adjustments. ROIC was 16.8% in Fiscal 2008, 15.8% in Fiscal 2007
and 13.1% in Fiscal 2006. Fiscal 2008 and 2007 ROIC was favorably impacted by higher net incomeand lower average equity reflecting effective management of the asset base and the adoption of SFAS No. 158. Fiscal 2006 ROIC was unfavorably impacted by higher average debt and by5.5 percentage points related to the previously discussed strategic transformation costs.
The Company and H.J. Heinz Finance Company maintain a $2 billion credit agreement thatexpires in August 2009. The credit agreement supports the Company’s commercial paper borrowings.
As a result, these borrowings are classified as long-term debt based upon the Company’s intent andability to refinance these borrowings on a long-term basis. The Company maintains in excess of $1 billion of other credit facilities used primarily by the Company’s foreign subsidiaries. Theseresources, the Company’s existing cash balance, strong operating cash flow, and access to the capital
25
8/3/2019 2008HeinzAR
http://slidepdf.com/reader/full/2008heinzar 40/108
markets, if required, should enable the Company to meet its cash requirements for operations,including capital expansion programs, debt maturities, acquisitions, share repurchases anddividends to shareholders.
As of April 30, 2008, the Company’s long-term debt ratings at Moody’s, Standard & Poor’s andFitch Rating were Baa2, BBB and BBB, respectively.
Contractual Obligations and Other Commitments
Contractual Obligations
The Company is obligated to make future payments under various contracts such as debtagreements, lease agreements and unconditional purchase obligations. In addition, the Company haspurchase obligations for materials, supplies, services, and property, plant and equipment as part of the ordinary conduct of business. A few of these obligations are long-term and are based on minimumpurchase requirements. In the aggregate, such commitments are not at prices in excess of currentmarkets. Due to the proprietary nature of some of the Company’s materials and processes, certainsupply contracts contain penalty provisions for early terminations. The Company does not believethat a material amount of penalties is reasonably likely to be incurred under these contracts basedupon historical experience and current expectations.
The following table represents the contractual obligations of the Company as of April 30, 2008.
Less than1 year 1-3 years 3-5 years
More than5 years Total
(Amounts in thousands)
Long Term Debt(1) . . . . . . $ 530,731 $1,778,224 $1,641,220 $3,233,352 $ 7,183,527
Capital LeaseObligations . . . . . . . . . . 10,161 19,475 48,179 32,574 110,389
Operating Leases . . . . . . . 68,752 106,689 87,514 190,984 453,939
Purchase Obligations . . . . 1,254,104 745,641 184,074 25,907 2,209,726
Other Long TermLiabilities Recorded on
the Balance Sheet . . . . . 101,928 236,512 231,383 167,033 736,856
Total . . . . . . . . . . . . . . . $1,965,676 $2,886,541 $2,192,370 $3,649,850 $10,694,437
(1) Amounts include expected cash payments for interest on fixed rate long-term debt. Due to theuncertainty of forecasting expected variable rate interest payments, those amounts are notincluded in the table.
Other long-term liabilities primarily consist of certain specific incentive compensation arrange-ments and pension and postretirement benefit commitments. The following long-term liabilitiesincluded on the consolidated balance sheet are excluded from the table above: income taxes, minorityinterest and insurance accruals. The Company is unable to estimate the timing of the payments forthese items.
The Company adopted Financial Accounting Standards Board Interpretation No. 48,“Accounting for Uncertainty in Income Taxes” (“FIN 48”) as of the beginning of fiscal year 2008.
At April 30, 2008, the total amount of gross unrecognized tax benefits for uncertain tax positions,including an accrual of related interest and penalties along with positions only impacting the timingof tax benefits, was approximately $189 million. However, the net obligation to taxing authoritiesunder FIN 48 was approximately $103 million. The difference relates primarily to outstandingrefund claims. The timing of payments will depend on the progress of examinations with taxauthorities. The Company does not expect a significant tax payment related to these net obligationswithin the next year. The Company is unable to make a reasonably reliable estimate of when cashsettlements with taxing authorities may occur.
26
8/3/2019 2008HeinzAR
http://slidepdf.com/reader/full/2008heinzar 41/108
Off-Balance Sheet Arrangements and Other Commitments
The Company does not have guarantees or other off-balance sheet financing arrangements thatwe believe are reasonably likely to have a current or future effect on our financial condition, changesin financial condition, revenue or expenses, results of operations, liquidity, capital expenditures orcapital resources. In addition, the Company does not have any related party transactions thatmaterially affect the results of operations, cash flow or financial condition.
As of April 30, 2008, the Company was party to an operating lease for buildings and equipment inwhich the Company has guaranteed a supplemental payment obligation of approximately $64 millionat the termination of the lease. The Company believes, based on current facts and circumstances, thatany payment pursuant to this guarantee is remote. In May 2008, the construction of a new frozen foodfactory in South Carolina commenced. It is expected that the factory will be operational in approx-imately 18 to 24 months and that it will be financed by an operating lease.
Market Risk Factors
The Company is exposed to market risks from adverse changes in foreign exchange rates,interest rates, commodity prices and production costs. As a policy, the Company does not engage inspeculative or leveraged transactions, nor does the Company hold or issue financial instruments fortrading purposes.
Foreign Exchange Rate Sensitivity: The Company’s cash flow and earnings are subject tofluctuations due to exchange rate variation. Foreign currency risk exists by nature of the Company’sglobal operations. The Company manufactures and sells its products in a number of locations aroundthe world, and hence foreign currency risk is diversified.
The Company may attempt to limit its exposure to changing foreign exchange rates through bothoperational and financial market actions. These actions may include entering into forward contracts,option contracts, or cross currency swaps to hedge existing exposures, firm commitments andforecasted transactions.
The instruments are used to reduce risk by essentially creating offsetting currency exposures.The following table presents information related to foreign currency contracts held by the Company:
April 30, 2008 May 2, 2007 April 30, 2008 May 2, 2007
Aggregate Notional Amount Net Unrealized Gains/(Losses)
(Dollars in millions)
Purpose of Hedge:
Intercompany cash flows . . . . . $1,110 $1,010 $25 $ (4)
Forecasted purchases of rawmaterials and finishedgoods and foreign currencydenominated obligations . . . 541 360 6 (3)
Forecasted sales and foreign
currency denominatedassets . . . . . . . . . . . . . . . . . . 57 136 — 8
Net investments in foreignoperations. . . . . . . . . . . . . . . — 1,964 — (73)
$1,708 $3,470 $31 $(72)
As of April 30, 2008, the Company’s foreign currency contracts mature within two years.Contracts that meet qualifying criteria are accounted for as either foreign currency cash flow hedgesor net investment hedges of foreign operations. Any gains and losses related to contracts that do notqualify for hedge accounting are recorded in current period earnings in other income and expense.
27
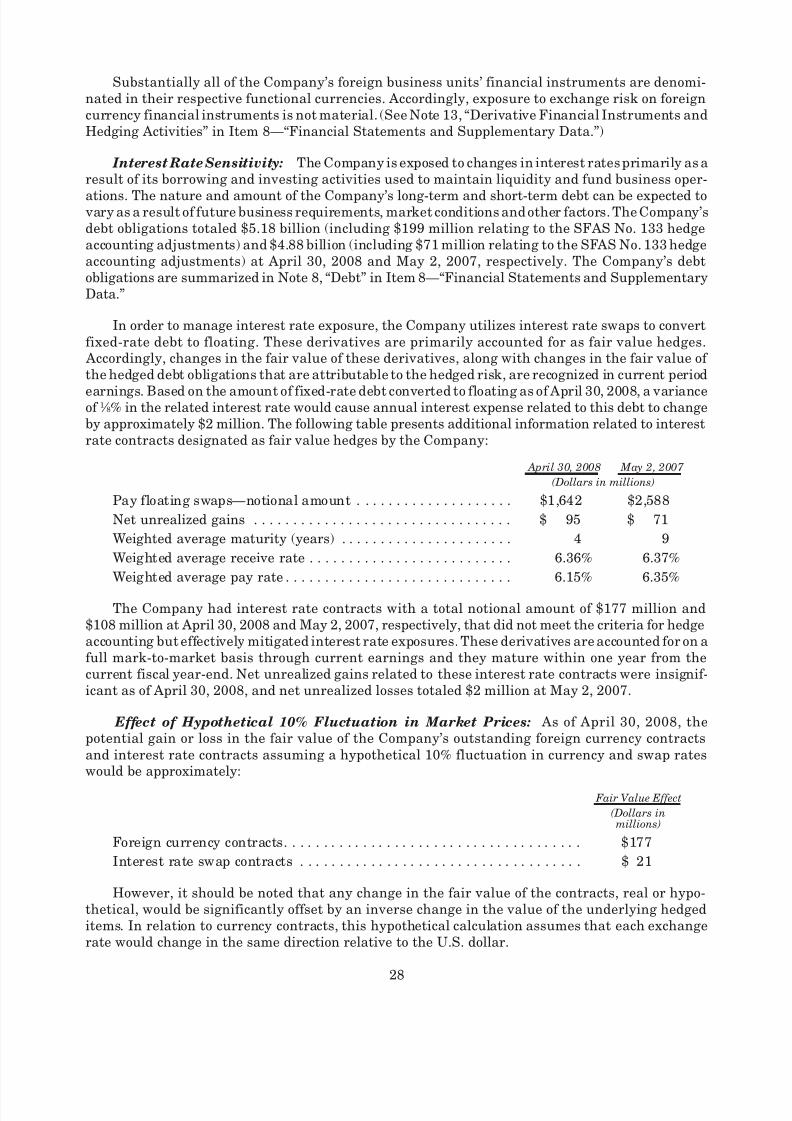
8/3/2019 2008HeinzAR
http://slidepdf.com/reader/full/2008heinzar 42/108
Substantially all of the Company’s foreign business units’ financial instruments are denomi-nated in their respective functional currencies. Accordingly, exposure to exchange risk on foreigncurrency financial instruments is not material. (See Note 13, “Derivative Financial Instruments andHedging Activities” in Item 8—“Financial Statements and Supplementary Data.”)
Interest Rate Sensitivity: The Company is exposed to changes in interest rates primarily as aresult of its borrowing and investing activities used to maintain liquidity and fund business oper-
ations. The nature and amount of the Company’s long-term and short-term debt can be expected to vary as a result of future business requirements, market conditions and other factors. The Company’sdebt obligations totaled $5.18 billion (including $199 million relating to the SFAS No. 133 hedgeaccounting adjustments) and $4.88 billion (including $71 million relating to the SFAS No. 133 hedgeaccounting adjustments) at April 30, 2008 and May 2, 2007, respectively. The Company’s debtobligations are summarized in Note 8, “Debt” in Item 8—“Financial Statements and SupplementaryData.”
In order to manage interest rate exposure, the Company utilizes interest rate swaps to convertfixed-rate debt to floating. These derivatives are primarily accounted for as fair value hedges.
Accordingly, changes in the fair value of these derivatives, along with changes in the fair value of the hedged debt obligations that are attributable to the hedged risk, are recognized in current period
earnings. Based on the amount of fixed-rate debt converted to floating as of April 30, 2008, a varianceof 1 ⁄ 8% in the related interest rate would cause annual interest expense related to this debt to changeby approximately $2 million. The following table presents additional information related to interestrate contracts designated as fair value hedges by the Company:
April 30, 2008 May 2, 2007
(Dollars in millions)
Pay floating swaps—notional amount . . . . . . . . . . . . . . . . . . . . $1,642 $2,588
Net unrealized gains . . . . . . . . . . . . . . . . . . . . . . . . . . . . . . . . . $ 95 $ 71
Weighted average maturity (years) . . . . . . . . . . . . . . . . . . . . . . 4 9
Weighted average receive rate . . . . . . . . . . . . . . . . . . . . . . . . . . 6.36% 6.37%
Weighted average pay rate . . . . . . . . . . . . . . . . . . . . . . . . . . . . . 6.15% 6.35%
The Company had interest rate contracts with a total notional amount of $177 million and$108 million at April 30, 2008 and May 2, 2007, respectively, that did not meet the criteria for hedgeaccounting but effectively mitigated interest rate exposures. These derivatives are accounted for on afull mark-to-market basis through current earnings and they mature within one year from thecurrent fiscal year-end. Net unrealized gains related to these interest rate contracts were insignif-icant as of April 30, 2008, and net unrealized losses totaled $2 million at May 2, 2007.
Effect of Hypothetical 10% Fluctuation in Market Prices: As of April 30, 2008, thepotential gain or loss in the fair value of the Company’s outstanding foreign currency contractsand interest rate contracts assuming a hypothetical 10% fluctuation in currency and swap rateswould be approximately:
Fair Value Effect
(Dollars inmillions)
Foreign currency contracts. . . . . . . . . . . . . . . . . . . . . . . . . . . . . . . . . . . . . . $177
Interest rate swap contracts . . . . . . . . . . . . . . . . . . . . . . . . . . . . . . . . . . . . $ 21
However, it should be noted that any change in the fair value of the contracts, real or hypo-thetical, would be significantly offset by an inverse change in the value of the underlying hedgeditems. In relation to currency contracts, this hypothetical calculation assumes that each exchangerate would change in the same direction relative to the U.S. dollar.
28
8/3/2019 2008HeinzAR
http://slidepdf.com/reader/full/2008heinzar 43/108
Recently Issued Accounting Standards
In July 2006, the Financial Accounting Standards Board (“FASB”) issued FASB InterpretationNo. 48, Accounting for Uncertainty in Income Taxes—an interpretation of FASB Statement No. 109
(“FIN 48”), which clarifies the accounting for uncertainty in income taxes recognized in financialstatements. This Interpretation includes a recognition threshold and measurement attribute for thefinancial statement recognition and measurement of a tax position taken or expected to be taken in a
tax return. FIN 48 also provides guidance on de-recognition, classification, interest and penalties,accounting in interim periods, and disclosures. See Note 7, “Income Taxes” in Item 8—“FinancialStatements and Supplementary Data” for additional information.
In September 2006, the FASB issued SFAS No. 157, “Fair Value Measurements” , which definesfair value, establishes a framework for measuring fair value under generally accepted accountingprinciples, and expands disclosures about fair value measurements. This statement applies when-ever other accounting pronouncements require or permit assets or liabilities to be measured at fair
value, but does not expand the use of fair value to new accounting transactions. SFAS No. 157 iseffective for financial assets and liabilities in fiscal years beginning after November 15, 2007, and fornon-financial assets and liabilities in fiscal years beginning after November 15, 2008. The Companywill adopt SFAS No. 157 for its financial assets and liabilities on May 1, 2008, the first day of Fiscal
2009. The Company’s financial instruments consist primarily of cash and cash equivalents, receiv-ables, accounts payable, short-term and long-term debt, swaps, forward contracts, and optioncontracts. The recorded values of the Company’s financial instruments approximate fair value.The Company is currently evaluating the impact of adopting SFAS No. 157 on its consolidatedfinancial statements.
In September 2006, the FASB issued SFAS No. 158, “Employers’ Accounting for Defined BenefitPension and Other Postretirement Plans, an amendment of FASB Statement Nos. 87, 88, 106 and132(R).” SFAS No. 158 required that the Company recognize the funded status of each of its definedpension and postretirement benefit plans as a net asset or liability in the consolidated balance sheetand to recognize changes in that funded status in the year in which changes occur through com-prehensive income. Effective May 2, 2007, the Company adopted these provisions of SFAS No. 158.
SFAS No. 158 also requires that employers measure plan assets and obligations as of the date of theiryear-end financial statements beginning with the Company’s fiscal year ending April 29, 2009. TheCompany does not expect the impact of the change in measurement date to have a material impact onthe consolidated financial statements.
In December 2007, the FASB issued SFAS No. 141(R), “Business Combinations” andSFAS No. 160, “Noncontrolling Interests in Consolidated Financial Statements—An Amendmentof ARB No. 51.” These new standards will significantly change the accounting for and reporting of business combination transactions and noncontrolling (minority) interests in consolidated financialstatements. SFAS Nos. 141(R) and 160 are required to be adopted simultaneously and are effectivefor fiscal years beginning after December 15, 2008, with early adoption prohibited. Thus, theCompany will be required to adopt these standards on April 30, 2009, the first day of Fiscal
2010. The Company is currently evaluating the impact of adopting SFAS Nos. 141(R) and 160 onits consolidated financial statements.
In March 2008, the FASB issued SFAS No. 161, “Disclosures about Derivative Instruments andHedging Activities—an amendment of FASB Statement No. 133”. This new standard requiresenhanced disclosures about how and why an entity uses derivative instruments, how derivativeinstruments and related hedged items are accounted for under SFAS No. 133 and its relatedinterpretations, and how derivative instruments and related hedged items affect an entity’s financialposition, financial performance, and cash flows. This statement is effective for financial statementsissued for fiscal years and interim periods beginning after November 15, 2008. The Company iscurrently evaluating the impact of adopting SFAS No. 161 in the fourth quarter of Fiscal 2009.
29
8/3/2019 2008HeinzAR
http://slidepdf.com/reader/full/2008heinzar 44/108
Discussion of Significant Accounting Estimates
In the ordinary course of business, the Company has made a number of estimates and assump-tions relating to the reporting of results of operations and financial condition in the preparation of itsfinancial statementsin conformity with accounting principles generally accepted in the United Statesof America. Actual results could differ significantly from those estimates under different assump-tions and conditions. The Company believes that the following discussion addresses its most critical
accounting policies, which are those that are most important to the portrayal of the Company’sfinancial condition and results and require management’s most difficult, subjective and complex
judgments, often as a result of the need to make estimates about the effect of matters that areinherently uncertain.
Marketing Costs—Trade promotions are an important component of the sales and marketing of the Company’s products and are critical to the support of the business. Trade promotion costs includeamounts paid to retailers to offer temporary price reductions for the sale of the Company’s products toconsumers, amounts paid to obtain favorable display positions in retailers’ stores, and amounts paidto customers for shelf space in retail stores. Accruals for trade promotions are initially recorded at thetime of sale of product to the customer based on an estimate of the expected levels of performance of the trade promotion, which is dependent upon factors such as historical trends with similar
promotions, expectations regarding customer participation, and sales and payment trends withsimilar previously offered programs. Our original estimated costs of trade promotions may change inthe future as a result of changes in customer participation, particularly for new programs and forprograms related to the introduction of new products. We perform monthly and quarterly evaluationsof our outstanding trade promotions, making adjustments where appropriate to reflect changes inestimates. Settlement of these liabilities typically occurs in subsequent periods primarily through anauthorization process for deductions taken by a customer from amounts otherwise due to theCompany. As a result, the ultimate cost of a trade promotion program is dependent on the relativesuccess of the events and the actions and level of deductions taken by the Company’s customers foramounts they consider due to them. Final determination of the permissible deductions may takeextended periods of time and could have a significant impact on the Company’s results of operationsdepending on how actual results of the programs compare to original estimates.
We offer coupons to consumers in the normal course of our business. Expenses associated withthis activity, which we refer to as coupon redemption costs, are accrued in the period in which thecoupons are offered. The initial estimates made for each coupon offering are based upon historicalredemption experience rates for similar products or coupon amounts. We perform monthly andquarterly evaluations of outstanding coupon accruals that compare actual redemption rates to theoriginal estimates. We review the assumptions used in the valuation of the estimates and determinean appropriate accrual amount. Adjustments to our initial accrual may be required if actualredemption rates vary from estimated redemption rates.
Investments and Long-lived Assets, including Property, Plant and Equipment—Investments andlong-lived assets are recorded at their respective cost basis on the date of acquisition. Buildings,equipment and leasehold improvements are depreciated on a straight-line basis over the estimateduseful life of such assets. The Company reviews investments and long-lived assets, includingintangibles with finite useful lives, and property, plant and equipment, whenever circumstanceschange such that the indicated recorded value of an asset may not be recoverable or has suffered another-than-temporary impairment. Factors that may affect recoverability include changes inplanned use of equipment or software, the closing of facilities and changes in the underlying financialstrength of investments. The estimate of current value requires significant management judgmentand requires assumptions that can include: future volume trends, revenue and expense growth ratesand foreign exchange rates developed in connection with the Company’s internal projections andannual operating plans, and in addition, external factors such as changes in macroeconomic trendswhich are developed in connection with the Company’s long-term strategic planning. As each is
30
8/3/2019 2008HeinzAR
http://slidepdf.com/reader/full/2008heinzar 45/108
management’s best estimate on then available information, resulting estimates may differ fromactual cash flows.
Goodwill and Indefinite-Lived Intangibles—Carrying values of goodwill and intangible assetswith indefinite lives are reviewed for impairment at least annually, or when circumstances indicatethat a possible impairment may exist. Indicators such as unexpected adverse economic factors,unanticipated technological change or competitive activities, loss of key personnel, and acts by
governments and courts, may signal that an asset has become impaired. All goodwill is assigned toreporting units, which are one level below our operating segments. Goodwill is assigned to thereporting unit that benefits from the synergies arising from each business combination. We performour impairment tests of goodwill at the reporting unit level. The Company’s measure of impairmentfor both goodwill and intangible assets with indefinite lives is based on a discounted cash flow modelthat requires significant judgment and requires assumptions about future volume trends, revenueand expense growth rates and foreign exchange rates developed in connection with the Company’sinternal projections and annual operating plans, and in addition, external factors such as changes inmacroeconomic trends and cost of capital developed in connection with the Company’s long-termstrategic planning. Inherent in estimating future performance, in particular assumptions regardingexternal factors such as capital markets, are uncertainties beyond the Company’s control.
Retirement Benefits—The Company sponsors pension and other retirement plans in variousforms covering substantially all employees who meet eligibility requirements. Several actuarial andother factors that attempt to anticipate future events are used in calculating the expense andobligations related to the plans. These factors include assumptions about the discount rate, expectedreturn on plan assets, turnover rates and rate of future compensation increases as determined by theCompany, within certain guidelines. In addition, the Company uses best estimate assumptions,provided by actuarial consultants, for withdrawal and mortality rates to estimate benefit expense.The financial and actuarial assumptions used by the Company may differ materially from actualresults due to changing market and economic conditions, higher or lower withdrawal rates or longeror shorter life spans of participants. These differences may result in a significant impact to theamount of pension expense recorded by the Company.
The Company recognized pension expense related to defined benefit programs of $7 million,
$32 million and $77 million for fiscal years 2008, 2007 and 2006, respectively, which reflectedexpected return on plan assets of $227 million, $199 million and $169 million, respectively. TheCompany contributed $60 million to its pension plans in Fiscal 2008 compared to $63 million in Fiscal2007 and $65 million in Fiscal 2006. The Company expects to contribute approximately $80 million toits pension plans in Fiscal 2009.
One of the significant assumptions for pension plan accounting is the expected rate of return onpension plan assets. Over time, the expected rate of return on assets should approximate actual long-term returns. In developing the expected rate of return, the Company considers average real historicreturns on asset classes, the investment mix of plan assets, investment manager performance andprojected future returns of asset classes developed by respected consultants. When calculating theexpected return on plan assets, the Company primarily uses a market-related-value of assets that
spreads asset gains and losses (difference between actual return and expected return) uniformly over3 years. The weighted average expected rate of return on plan assets used to calculate annualexpense was 8.2% for the years ended April 30, 2008, May 2, 2007 and May 3, 2006. For purposes of calculating Fiscal 2009 expense, the weighted average rate of return will remain at approximately8.2%.
Another significant assumption used to value benefit plans is the discount rate. The discountrate assumptions used to value pension and postretirement benefit obligations reflect the ratesavailable on high quality fixed income investments available (in each country where the Companyoperates a benefit plan) as of the measurement date. The Company uses bond yields of appropriateduration for each country by matching to the duration of plan liabilities. The weighted average
31
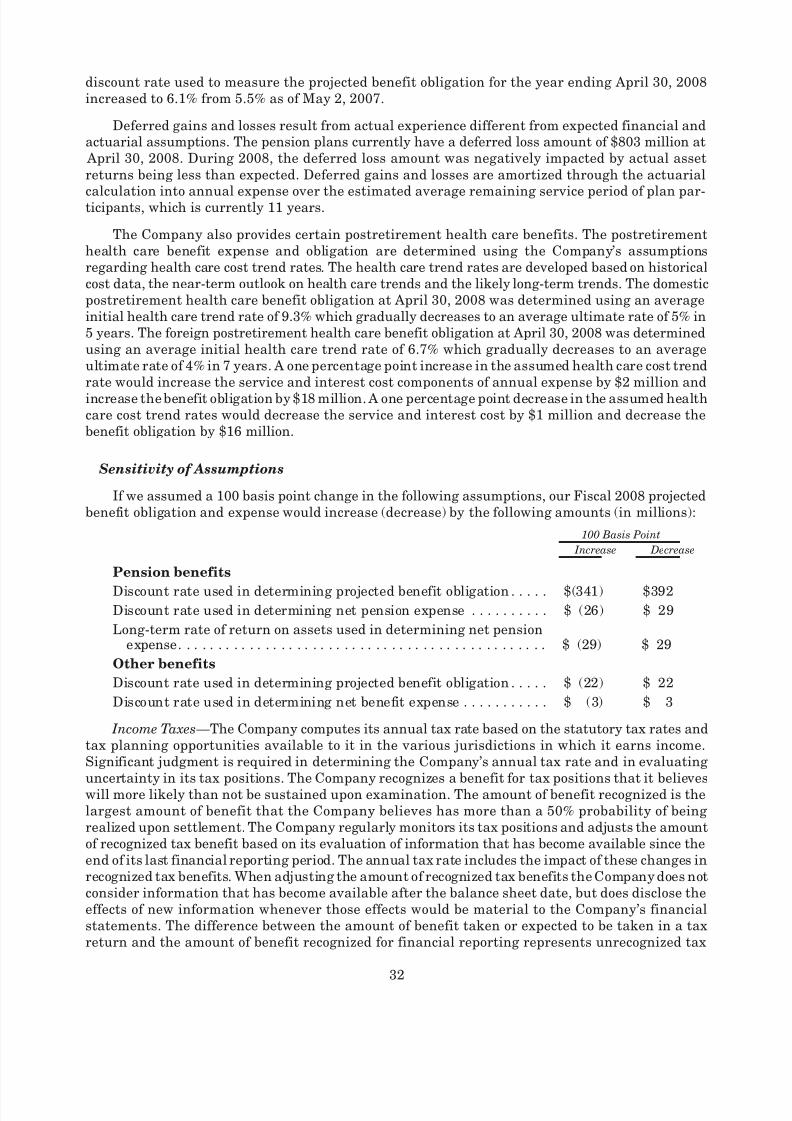
8/3/2019 2008HeinzAR
http://slidepdf.com/reader/full/2008heinzar 46/108
discount rate used to measure the projected benefit obligation for the year ending April 30, 2008increased to 6.1% from 5.5% as of May 2, 2007.
Deferred gains and losses result from actual experience different from expected financial andactuarial assumptions. The pension plans currently have a deferred loss amount of $803 million at
April 30, 2008. During 2008, the deferred loss amount was negatively impacted by actual assetreturns being less than expected. Deferred gains and losses are amortized through the actuarial
calculation into annual expense over the estimated average remaining service period of plan par-ticipants, which is currently 11 years.
The Company also provides certain postretirement health care benefits. The postretirementhealth care benefit expense and obligation are determined using the Company’s assumptionsregarding health care cost trend rates. The health care trend rates are developed based on historicalcost data, the near-term outlook on health care trends and the likely long-term trends. The domesticpostretirement health care benefit obligation at April 30, 2008 was determined using an averageinitial health care trend rate of 9.3% which gradually decreases to an average ultimate rate of 5% in5 years. The foreign postretirement health care benefit obligation at April 30, 2008 was determinedusing an average initial health care trend rate of 6.7% which gradually decreases to an averageultimate rate of 4% in 7 years. A one percentage point increase in the assumed health care cost trendrate would increase the service and interest cost components of annual expense by $2 million andincrease the benefit obligation by $18 million. A one percentage point decrease in the assumed healthcare cost trend rates would decrease the service and interest cost by $1 million and decrease thebenefit obligation by $16 million.
Sensitivity of Assumptions
If we assumed a 100 basis point change in the following assumptions, our Fiscal 2008 projectedbenefit obligation and expense would increase (decrease) by the following amounts (in millions):
Increase Decrease
100 Basis Point
Pension benefits
Discount rate used in determining projected benefit obligation . . . . . $(341) $392Discount rate used in determining net pension expense . . . . . . . . . . $ (26) $ 29
Long-term rate of return on assets used in determining net pensionexpense. . . . . . . . . . . . . . . . . . . . . . . . . . . . . . . . . . . . . . . . . . . . . . . $ (29) $ 29
Other benefits
Discount rate used in determining projected benefit obligation . . . . . $ (22) $ 22
Discount rate used in determining net benefit expense . . . . . . . . . . . $ (3) $ 3
Income Taxes—The Company computes its annual tax rate based on the statutory tax rates andtax planning opportunities available to it in the various jurisdictions in which it earns income.Significant judgment is required in determining the Company’s annual tax rate and in evaluatinguncertainty in its tax positions. The Company recognizes a benefit for tax positions that it believeswill more likely than not be sustained upon examination. The amount of benefit recognized is thelargest amount of benefit that the Company believes has more than a 50% probability of beingrealized upon settlement. The Company regularly monitors its tax positions and adjusts the amountof recognized tax benefit based on its evaluation of information that has become available since theend of its last financial reporting period. The annual tax rate includes the impact of these changes inrecognized tax benefits. When adjusting the amount of recognized tax benefits the Company does notconsider information that has become available after the balance sheet date, but does disclose theeffects of new information whenever those effects would be material to the Company’s financialstatements. The difference between the amount of benefit taken or expected to be taken in a taxreturn and the amount of benefit recognized for financial reporting represents unrecognized tax
32
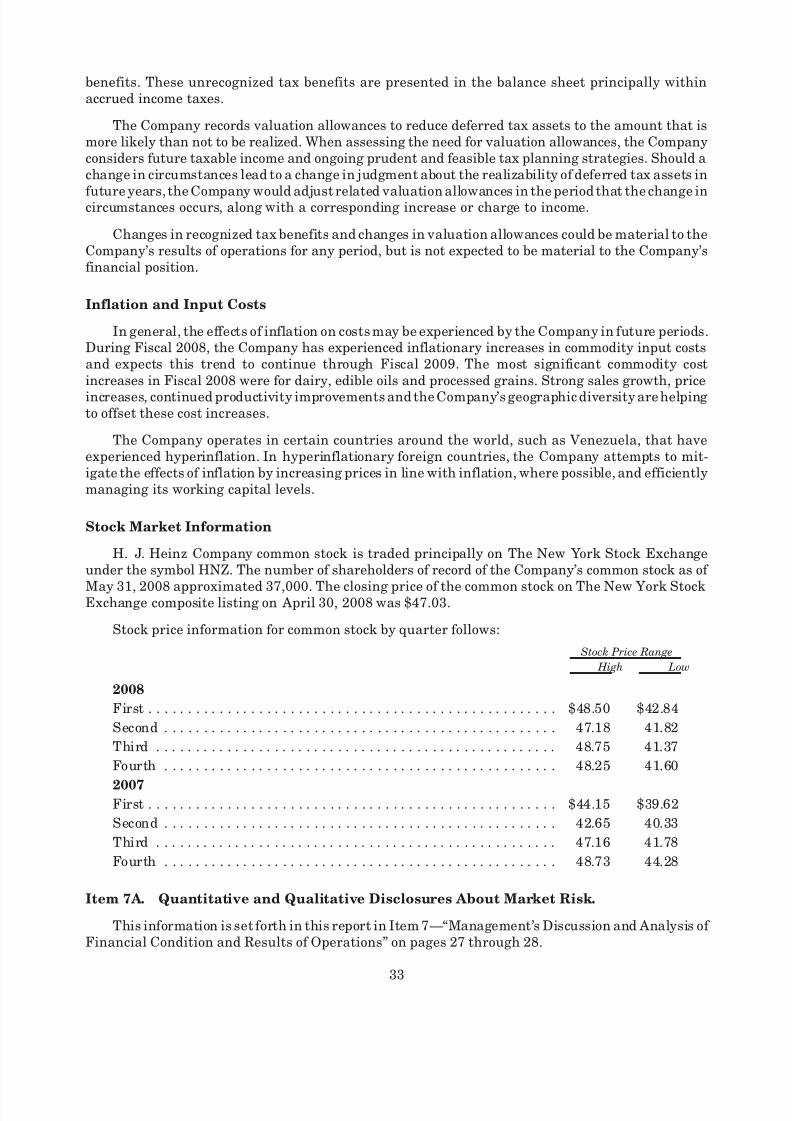
8/3/2019 2008HeinzAR
http://slidepdf.com/reader/full/2008heinzar 47/108
benefits. These unrecognized tax benefits are presented in the balance sheet principally withinaccrued income taxes.
The Company records valuation allowances to reduce deferred tax assets to the amount that ismore likely than not to be realized. When assessing the need for valuation allowances, the Companyconsiders future taxable income and ongoing prudent and feasible tax planning strategies. Should achange in circumstances lead to a change in judgment about the realizability of deferred tax assets in
future years, the Company would adjust related valuation allowances in the period that the change incircumstances occurs, along with a corresponding increase or charge to income.
Changes in recognized tax benefits and changes in valuation allowances could be material to theCompany’s results of operations for any period, but is not expected to be material to the Company’sfinancial position.
Inflation and Input Costs
In general, the effects of inflation on costs may be experienced by the Company in future periods.During Fiscal 2008, the Company has experienced inflationary increases in commodity input costsand expects this trend to continue through Fiscal 2009. The most significant commodity costincreases in Fiscal 2008 were for dairy, edible oils and processed grains. Strong sales growth, price
increases, continued productivity improvements and the Company’s geographic diversity are helpingto offset these cost increases.
The Company operates in certain countries around the world, such as Venezuela, that haveexperienced hyperinflation. In hyperinflationary foreign countries, the Company attempts to mit-igate the effects of inflation by increasing prices in line with inflation, where possible, and efficientlymanaging its working capital levels.
Stock Market Information
H. J. Heinz Company common stock is traded principally on The New York Stock Exchangeunder the symbol HNZ. The number of shareholders of record of the Company’s common stock as of
May 31, 2008 approximated 37,000. The closing price of the common stock on The New York StockExchange composite listing on April 30, 2008 was $47.03.
Stock price information for common stock by quarter follows:
High Low
Stock Price Range
2008
First . . . . . . . . . . . . . . . . . . . . . . . . . . . . . . . . . . . . . . . . . . . . . . . . . . . . $48.50 $42.84
Second . . . . . . . . . . . . . . . . . . . . . . . . . . . . . . . . . . . . . . . . . . . . . . . . . . 47.18 41.82
Third . . . . . . . . . . . . . . . . . . . . . . . . . . . . . . . . . . . . . . . . . . . . . . . . . . . 48.75 41.37
Fourth . . . . . . . . . . . . . . . . . . . . . . . . . . . . . . . . . . . . . . . . . . . . . . . . . . 48.25 41.60
2007First . . . . . . . . . . . . . . . . . . . . . . . . . . . . . . . . . . . . . . . . . . . . . . . . . . . . $44.15 $39.62
Second . . . . . . . . . . . . . . . . . . . . . . . . . . . . . . . . . . . . . . . . . . . . . . . . . . 42.65 40.33
Third . . . . . . . . . . . . . . . . . . . . . . . . . . . . . . . . . . . . . . . . . . . . . . . . . . . 47.16 41.78
Fourth . . . . . . . . . . . . . . . . . . . . . . . . . . . . . . . . . . . . . . . . . . . . . . . . . . 48.73 44.28
Item 7A. Quantitative and Qualitative Disclosures About Market Risk.
This information is set forth in this report in Item 7—“Management’s Discussion and Analysis of Financial Condition and Results of Operations” on pages 27 through 28.
33

8/3/2019 2008HeinzAR
http://slidepdf.com/reader/full/2008heinzar 48/108
Item 8. Financial Statements and Supplementary Data.
TABLE OF CONTENTS
Report of Management on Internal Control over Financial Reporting . . . . . . . . . . . . . . . . . . . . 35
Report of Independent Registered Public Accounting Firm . . . . . . . . . . . . . . . . . . . . . . . . . . . . 36
Consolidated Statements of Income . . . . . . . . . . . . . . . . . . . . . . . . . . . . . . . . . . . . . . . . . . . . . . 37Consolidated Balance Sheets. . . . . . . . . . . . . . . . . . . . . . . . . . . . . . . . . . . . . . . . . . . . . . . . . . . . 38
Consolidated Statements of Shareholders’ Equity . . . . . . . . . . . . . . . . . . . . . . . . . . . . . . . . . . . 40
Consolidated Statements of Cash Flows . . . . . . . . . . . . . . . . . . . . . . . . . . . . . . . . . . . . . . . . . . . 41
Notes to Consolidated Financial Statements . . . . . . . . . . . . . . . . . . . . . . . . . . . . . . . . . . . . . . . 42
34
8/3/2019 2008HeinzAR
http://slidepdf.com/reader/full/2008heinzar 49/108
Report of Management on Internal Control over Financial Reporting
Management is responsible for establishing and maintaining adequate internal control overfinancial reporting for the Company. Internal control over financial reporting refers to the processdesigned by, or under the supervision of, our Chief Executive Officer and Chief Financial Officer, andeffected by our Board of Directors, management and other personnel, to provide reasonable assur-ance regarding the reliability of financial reporting and the preparation of financial statements forexternal purposes in accordance with generally accepted accounting principles, and includes thosepolicies and procedures that:
(1) Pertain to the maintenance of records that, in reasonable detail, accurately and fairly reflectthe transactions and dispositions of the assets of the Company;
(2) Provide reasonable assurance that transactions are recorded as necessary to permit prep-aration of financial statements in accordance with generally accepted accounting principles, and thatreceipts and expenditures of the Company are being made only in accordance with authorizations of management and directors of the Company; and
(3) Provide reasonable assurance regarding prevention or timely detection of unauthorizedacquisition, use or disposition of the Company’s assets that could have a material effect on thefinancial statements.
Because of its inherent limitations, internal control over financial reporting may not prevent ordetect misstatements. Also, projections of any evaluation of effectiveness to future periods are subjectto the risk that controls may become inadequate because of changes in conditions, or that the degreeof compliance with the policies or procedures may deteriorate.
Management has used the framework set forth in the report entitled “Internal Control—IntegratedFramework” published by the Committee of Sponsoring Organizations of the Treadway Commission toevaluate the effectiveness of the Company’s internal control over financial reporting. Management hasconcluded that the Company’s internal control over financial reporting was effective as of the end of themost recent fiscal year. PricewaterhouseCoopers LLP, an independent registered public accounting firm,audited the effectiveness of the Company’s internal control over financial reporting as of April 30, 2008,as stated in their report which appears herein.
/s/ William R. JohnsonChairman, President andChief Executive Officer
/s/ Arthur B. WinkleblackExecutive Vice President andChief Financial Officer
June 19, 2008
35
8/3/2019 2008HeinzAR
http://slidepdf.com/reader/full/2008heinzar 50/108
Report of Independent Registered Public Accounting Firm
To the Board of Directors and Shareholders of H. J. Heinz Company:
In our opinion, the consolidated financial statements listed in the index appearing under Item 15(a)(1)present fairly, in all material respects, the financial position of H. J. Heinz Company and its subsid-iaries at April 30, 2008 and May 2, 2007, and theresults of their operationsand their cash flows for each
of the three years in the period ended April 30, 2008 in conformity with accounting principles generallyaccepted in the United States of America. In addition, in our opinion, the financial statement schedulelisted in the index appearing under Item 15(a)(2) presents fairly, in all material respects, the infor-mation set forth therein when read in conjunction with the related consolidated financial statements.
Also in our opinion, the Company maintained, in all material respects, effective internal control overfinancial reporting as of April 30, 2008, based on criteria established in Internal Control—Integrated
Framework issued by the Committee of Sponsoring Organizations of the Treadway Commission(COSO). The Company’s management is responsible for these financial statements and financialstatement schedule, for maintaining effective internal control over financial reporting and for itsassessment of the effectiveness of internal control over financial reporting, included in the Report of Management on Internal Control over Financial Reporting appearing under Item 8. Our responsibilityis to express opinions on these financial statements, on the financial statement schedule, and on theCompany’s internal control over financial reporting based on our integrated audits. We conducted ouraudits in accordance with the standards of the Public Company Accounting Oversight Board (United
States). Those standards require that we plan and perform the audits to obtain reasonable assuranceabout whether the financial statements are free of material misstatement and whether effectiveinternal control over financial reporting was maintained in all material respects. Our audits of thefinancial statements included examining, on a test basis, evidence supporting the amounts anddisclosures in the financial statements, assessing the accounting principles used and significantestimates made by management, and evaluating the overall financial statement presentation. Ouraudit of internal control over financial reporting included obtaining an understanding of internalcontrol over financial reporting, assessing the risk that a material weakness exists, and testing andevaluating the design and operating effectiveness of internal control based on the assessed risk. Ouraudits also included performing such other procedures as we considered necessary in the circum-stances. We believe that our audits provide a reasonable basis for our opinions.
As discussed in Note 1 to the consolidated financial statements, the Company changed the manner inwhich it accounts for share-based compensation effective May 4, 2006 and as discussed in Note 2 to
the consolidated financial statements, the Company changed the manner in which it accounts fordefined benefit pension and other postretirement plans effective May 2, 2007.
A company’s internal control over financial reporting is a process designed to provide reasonableassurance regarding the reliability of financial reporting and the preparation of financial statementsfor external purposes in accordance with generally accepted accounting principles. A company’sinternal control over financial reporting includes those policies and procedures that (i) pertain to themaintenance of records that, in reasonable detail, accurately and fairly reflect the transactions anddispositions of the assets of the company; (ii) provide reasonable assurance that transactions arerecorded as necessary to permit preparation of financial statements in accordance with generallyaccepted accounting principles, and that receipts and expenditures of the company are being madeonly in accordance with authorizations of management and directors of the company; and (iii) providereasonable assurance regarding prevention or timely detection of unauthorized acquisition, use, ordisposition of the company’s assets that could have a material effect on the financial statements.
Because of its inherent limitations, internal control over financial reporting may not prevent ordetect misstatements. Also, projections of any evaluation of effectiveness to future periods are subjectto the risk that controls may become inadequate because of changes in conditions, or that the degreeof compliance with the policies or procedures may deteriorate.
/s/ PRICEWATERHOUSECOOPERS LLP
Pittsburgh, PennsylvaniaJune 19, 2008
36
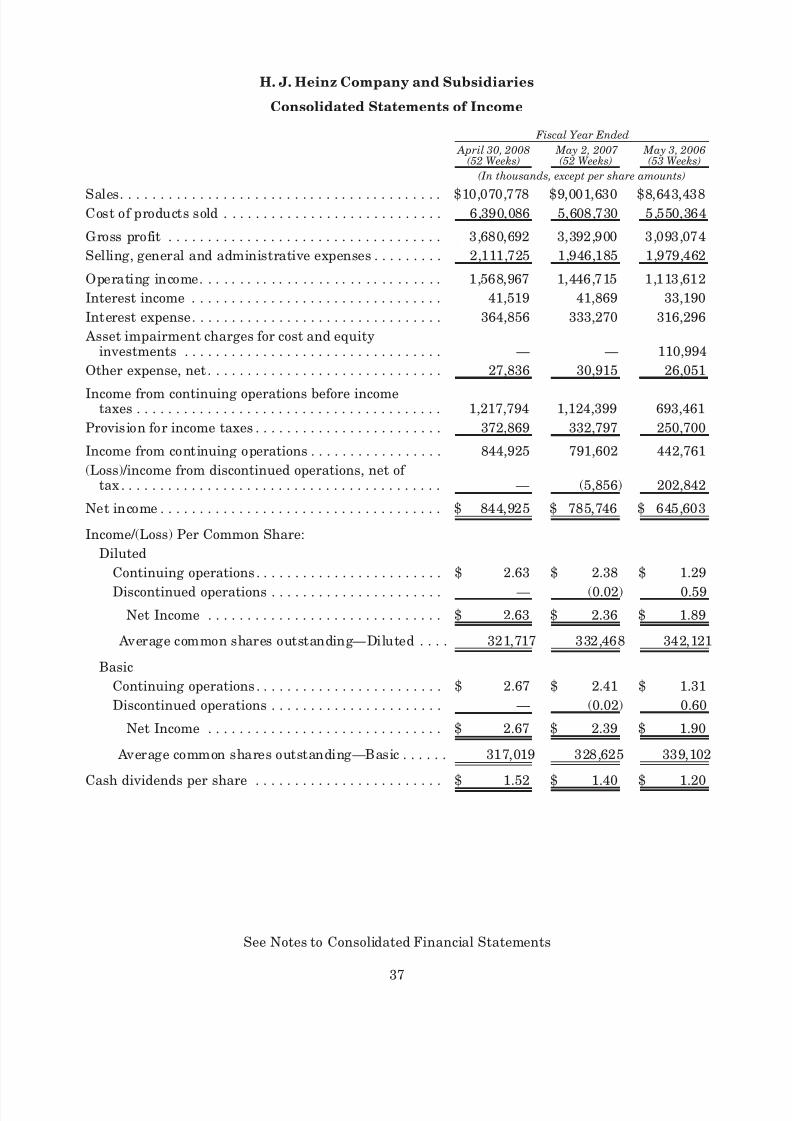
8/3/2019 2008HeinzAR
http://slidepdf.com/reader/full/2008heinzar 51/108
H. J. Heinz Company and Subsidiaries
Consolidated Statements of Income
April 30, 2008(52 Weeks)
May 2, 2007 (52 Weeks)
May 3, 2006(53 Weeks)
Fiscal Year Ended
(In thousands, except per share amounts)
Sales. . . . . . . . . . . . . . . . . . . . . . . . . . . . . . . . . . . . . . . . . $10,070,778 $9,001,630 $8,643,438Cost of products sold . . . . . . . . . . . . . . . . . . . . . . . . . . . . 6,390,086 5,608,730 5,550,364
Gross profit . . . . . . . . . . . . . . . . . . . . . . . . . . . . . . . . . . . 3,680,692 3,392,900 3,093,074
Selling, general and administrative expenses . . . . . . . . . 2,111,725 1,946,185 1,979,462
Operating income. . . . . . . . . . . . . . . . . . . . . . . . . . . . . . . 1,568,967 1,446,715 1,113,612
Interest income . . . . . . . . . . . . . . . . . . . . . . . . . . . . . . . . 41,519 41,869 33,190
Interest expense. . . . . . . . . . . . . . . . . . . . . . . . . . . . . . . . 364,856 333,270 316,296
Asset impairment charges for cost and equityinvestments . . . . . . . . . . . . . . . . . . . . . . . . . . . . . . . . . — — 110,994
Other expense, net. . . . . . . . . . . . . . . . . . . . . . . . . . . . . . 27,836 30,915 26,051
Income from continuing operations before incometaxes . . . . . . . . . . . . . . . . . . . . . . . . . . . . . . . . . . . . . . . 1,217,794 1,124,399 693,461
Provision for income taxes . . . . . . . . . . . . . . . . . . . . . . . . 372,869 332,797 250,700
Income from continuing operations . . . . . . . . . . . . . . . . . 844,925 791,602 442,761
(Loss)/income from discontinued operations, net of tax . . . . . . . . . . . . . . . . . . . . . . . . . . . . . . . . . . . . . . . . . — (5,856) 202,842
Net income . . . . . . . . . . . . . . . . . . . . . . . . . . . . . . . . . . . . $ 844,925 $ 785,746 $ 645,603
Income/(Loss) Per Common Share:
Diluted
Continuing operations . . . . . . . . . . . . . . . . . . . . . . . . $ 2.63 $ 2.38 $ 1.29
Discontinued operations . . . . . . . . . . . . . . . . . . . . . . — (0.02) 0.59
Net Income . . . . . . . . . . . . . . . . . . . . . . . . . . . . . . $ 2.63 $ 2.36 $ 1.89
Average common shares outstanding—Diluted . . . . 321,717 332,468 342,121
Basic
Continuing operations . . . . . . . . . . . . . . . . . . . . . . . . $ 2.67 $ 2.41 $ 1.31
Discontinued operations . . . . . . . . . . . . . . . . . . . . . . — (0.02) 0.60
Net Income . . . . . . . . . . . . . . . . . . . . . . . . . . . . . . $ 2.67 $ 2.39 $ 1.90
Average common shares outstanding—Basic . . . . . . 317,019 328,625 339,102
Cash dividends per share . . . . . . . . . . . . . . . . . . . . . . . . $ 1.52 $ 1.40 $ 1.20
See Notes to Consolidated Financial Statements
37
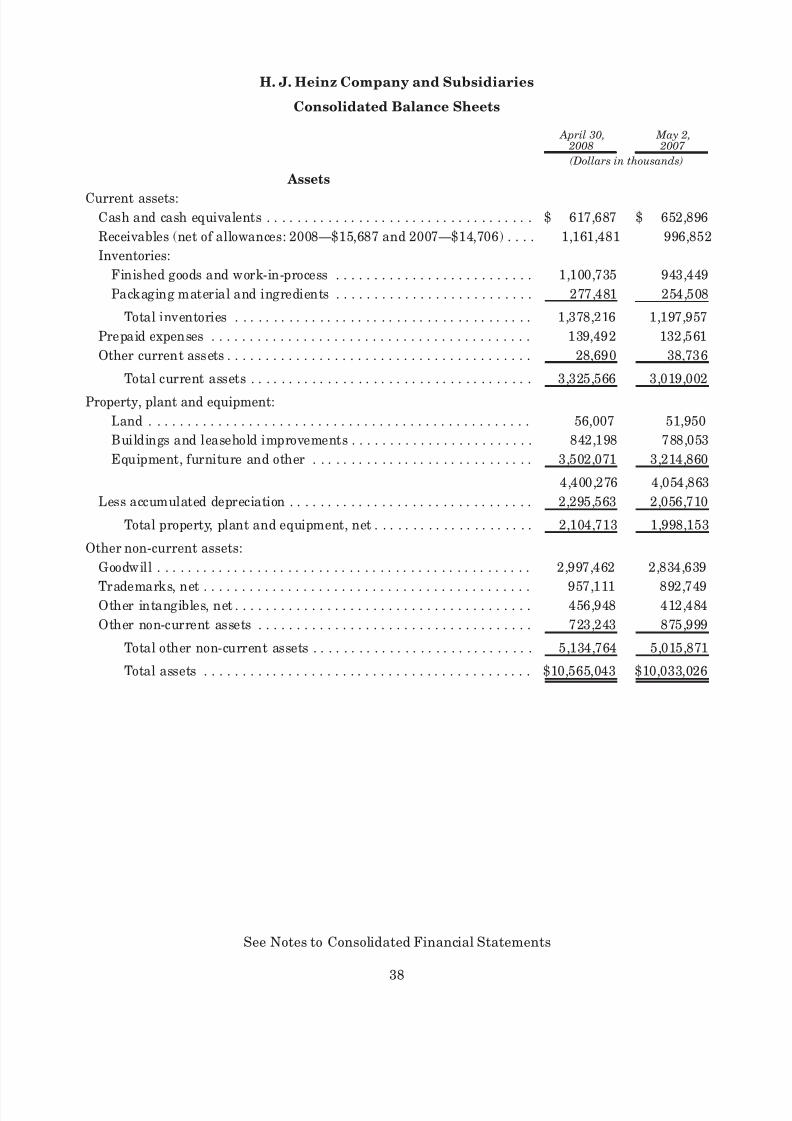
8/3/2019 2008HeinzAR
http://slidepdf.com/reader/full/2008heinzar 52/108
H. J. Heinz Company and Subsidiaries
Consolidated Balance Sheets
April 30, 2008
May 2, 2007
(Dollars in thousands)
Assets
Current assets:Cash and cash equivalents . . . . . . . . . . . . . . . . . . . . . . . . . . . . . . . . . . . $ 617,687 $ 652,896
Receivables (net of allowances: 2008—$15,687 and 2007—$14,706) . . . . 1,161,481 996,852
Inventories:
Finished goods and work-in-process . . . . . . . . . . . . . . . . . . . . . . . . . . 1,100,735 943,449
Packaging material and ingredients . . . . . . . . . . . . . . . . . . . . . . . . . . 277,481 254,508
Total inventories . . . . . . . . . . . . . . . . . . . . . . . . . . . . . . . . . . . . . . . 1,378,216 1,197,957
Prepaid expenses . . . . . . . . . . . . . . . . . . . . . . . . . . . . . . . . . . . . . . . . . . 139,492 132,561
Other current assets . . . . . . . . . . . . . . . . . . . . . . . . . . . . . . . . . . . . . . . . 28,690 38,736
Total current assets . . . . . . . . . . . . . . . . . . . . . . . . . . . . . . . . . . . . . 3,325,566 3,019,002
Property, plant and equipment:
Land . . . . . . . . . . . . . . . . . . . . . . . . . . . . . . . . . . . . . . . . . . . . . . . . . . 56,007 51,950
Buildings and leasehold improvements . . . . . . . . . . . . . . . . . . . . . . . . 842,198 788,053
Equipment, furniture and other . . . . . . . . . . . . . . . . . . . . . . . . . . . . . 3,502,071 3,214,860
4,400,276 4,054,863
Less accumulated depreciation . . . . . . . . . . . . . . . . . . . . . . . . . . . . . . . . 2,295,563 2,056,710
Total property, plant and equipment, net . . . . . . . . . . . . . . . . . . . . . 2,104,713 1,998,153
Other non-current assets:
Goodwill . . . . . . . . . . . . . . . . . . . . . . . . . . . . . . . . . . . . . . . . . . . . . . . . . 2,997,462 2,834,639
Trademarks, net . . . . . . . . . . . . . . . . . . . . . . . . . . . . . . . . . . . . . . . . . . . 957,111 892,749Other intangibles, net . . . . . . . . . . . . . . . . . . . . . . . . . . . . . . . . . . . . . . . 456,948 412,484
Other non-current assets . . . . . . . . . . . . . . . . . . . . . . . . . . . . . . . . . . . . 723,243 875,999
Total other non-current assets . . . . . . . . . . . . . . . . . . . . . . . . . . . . . 5,134,764 5,015,871
Total assets . . . . . . . . . . . . . . . . . . . . . . . . . . . . . . . . . . . . . . . . . . . $10,565,043 $10,033,026
See Notes to Consolidated Financial Statements
38
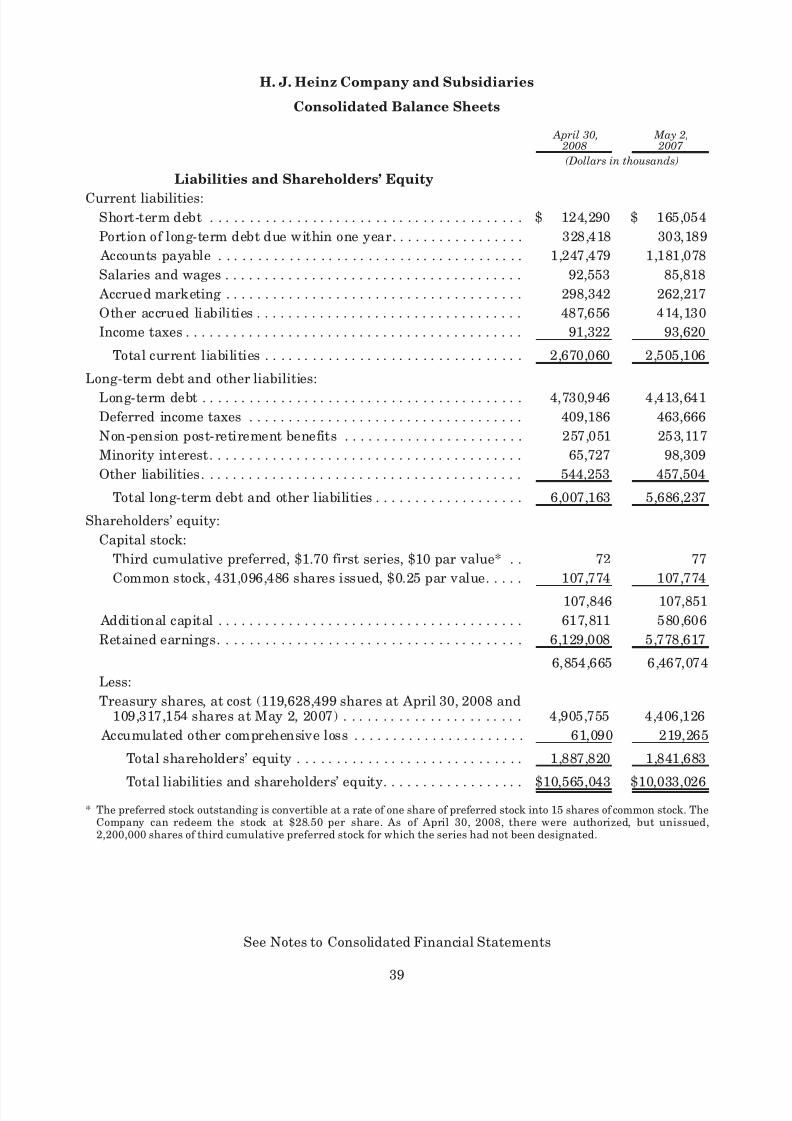
8/3/2019 2008HeinzAR
http://slidepdf.com/reader/full/2008heinzar 53/108
H. J. Heinz Company and Subsidiaries
Consolidated Balance Sheets
April 30, 2008
May 2, 2007
(Dollars in thousands)
Liabilities and Shareholders’ Equity
Current liabilities:Short-term debt . . . . . . . . . . . . . . . . . . . . . . . . . . . . . . . . . . . . . . . . $ 124,290 $ 165,054
Portion of long-term debt due within one year. . . . . . . . . . . . . . . . . 328,418 303,189
Accounts payable . . . . . . . . . . . . . . . . . . . . . . . . . . . . . . . . . . . . . . . 1,247,479 1,181,078
Salaries and wages . . . . . . . . . . . . . . . . . . . . . . . . . . . . . . . . . . . . . . 92,553 85,818
Accrued marketing . . . . . . . . . . . . . . . . . . . . . . . . . . . . . . . . . . . . . . 298,342 262,217
Other accrued liabilities . . . . . . . . . . . . . . . . . . . . . . . . . . . . . . . . . . 487,656 414,130
Income taxes . . . . . . . . . . . . . . . . . . . . . . . . . . . . . . . . . . . . . . . . . . . 91,322 93,620
Total current liabilities . . . . . . . . . . . . . . . . . . . . . . . . . . . . . . . . . 2,670,060 2,505,106
Long-term debt and other liabilities:
Long-term debt . . . . . . . . . . . . . . . . . . . . . . . . . . . . . . . . . . . . . . . . . 4,730,946 4,413,641
Deferred income taxes . . . . . . . . . . . . . . . . . . . . . . . . . . . . . . . . . . . 409,186 463,666
Non-pension post-retirement benefits . . . . . . . . . . . . . . . . . . . . . . . 257,051 253,117
Minority interest. . . . . . . . . . . . . . . . . . . . . . . . . . . . . . . . . . . . . . . . 65,727 98,309
Other liabilities. . . . . . . . . . . . . . . . . . . . . . . . . . . . . . . . . . . . . . . . . 544,253 457,504
Total long-term debt and other liabilities . . . . . . . . . . . . . . . . . . . 6,007,163 5,686,237
Shareholders’ equity:
Capital stock:
Third cumulative preferred, $1.70 first series, $10 par value* . . 72 77
Common stock, 431,096,486 shares issued, $0.25 par value. . . . . 107,774 107,774
107,846 107,851
Additional capital . . . . . . . . . . . . . . . . . . . . . . . . . . . . . . . . . . . . . . . 617,811 580,606
Retained earnings. . . . . . . . . . . . . . . . . . . . . . . . . . . . . . . . . . . . . . . 6,129,008 5,778,617
6,854,665 6,467,074
Less:
Treasury shares, at cost (119,628,499 shares at April 30, 2008 and109,317,154 shares at May 2, 2007) . . . . . . . . . . . . . . . . . . . . . . . 4,905,755 4,406,126
Accumulated other comprehensive loss . . . . . . . . . . . . . . . . . . . . . . 61,090 219,265
Total shareholders’ equity . . . . . . . . . . . . . . . . . . . . . . . . . . . . . 1,887,820 1,841,683
Total liabilities and shareholders’ equity. . . . . . . . . . . . . . . . . . $10,565,043 $10,033,026* The preferred stock outstanding is convertible at a rate of one share of preferred stock into 15 shares of common stock. The
Company can redeem the stock at $28.50 per share. As of April 30, 2008, there were authorized, but unissued,2,200,000 shares of third cumulative preferred stock for which the series had not been designated.
See Notes to Consolidated Financial Statements
39
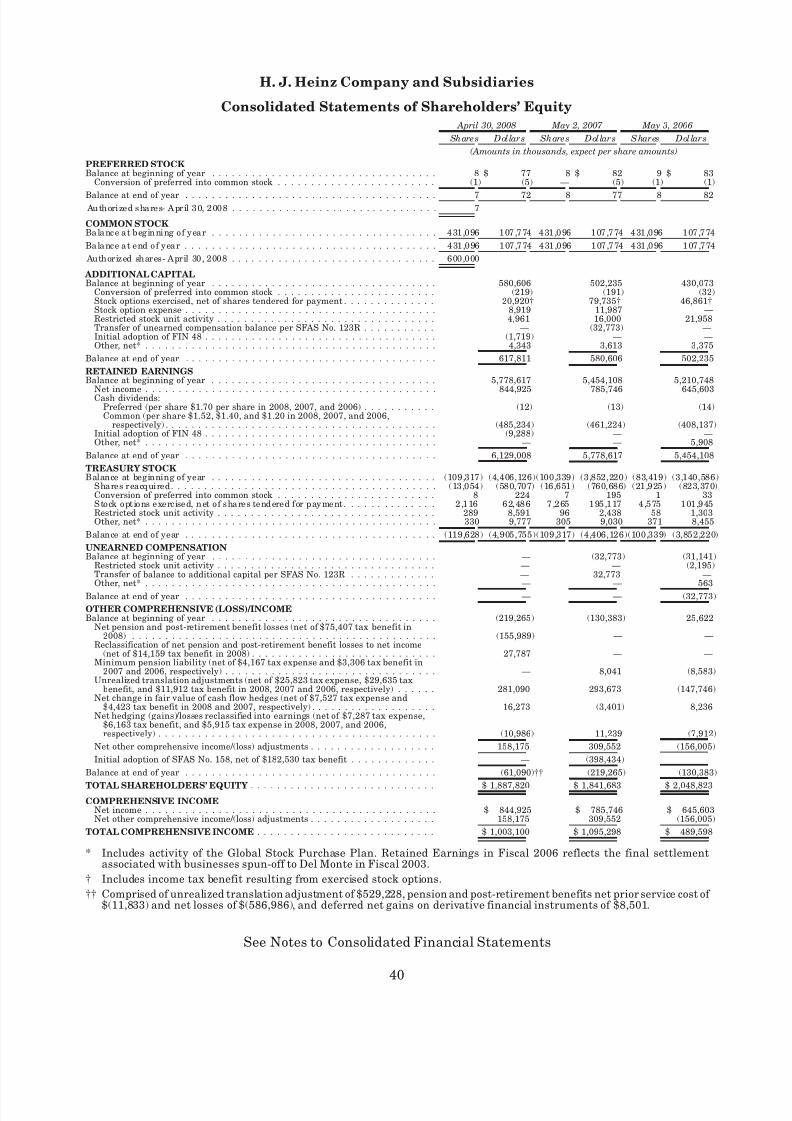
8/3/2019 2008HeinzAR
http://slidepdf.com/reader/full/2008heinzar 54/108
H. J. Heinz Company and Subsidiaries
Consolidated Statements of Shareholders’ Equity
Share s D ollar s Share s D ollar s Shar es D ollar s
April 30, 2008 May 2, 2007 May 3, 2006
(Amounts in thousands, expect per share amounts)
PREFERRED STOCKBalance at beginning of year . . . . . . . . . . . . . . . . . . . . . . . . . . . . . . . . . . 8 $ 77 8 $ 82 9 $ 83
Conversion of preferred into common stock . . . . . . . . . . . . . . . . . . . . . . . . (1) (5) — (5) (1) (1)
Balance at end of year . . . . . . . . . . . . . . . . . . . . . . . . . . . . . . . . . . . . . . 7 72 8 77 8 82 Authorized s hares- A pr il 30, 2008 . . . . . . . . . . . . . . . . . . . . . . . . . . . . . . . 7
COMMON STOCKBalanc e at beginning of year . . . . . . . . . . . . . . . . . . . . . . . . . . . . . . . . . . 431,096 107,774 431,096 107,774 431,096 107,774
Balanc e at end of year . . . . . . . . . . . . . . . . . . . . . . . . . . . . . . . . . . . . . . 431,096 107,774 431,096 107,774 431,096 107,774
Authorized shares- April 30, 2008 . . . . . . . . . . . . . . . . . . . . . . . . . . . . . . . 600,000
ADDITIONAL CAPITALBalance at beginning of year . . . . . . . . . . . . . . . . . . . . . . . . . . . . . . . . . . 580,606 502,235 430,073
Conversion of preferred into common stock . . . . . . . . . . . . . . . . . . . . . . . . (219) (191) (32)Stock options exercised, net of shares tendered for payment . . . . . . . . . . . . . . 20,920† 79,735† 46,861†Stock option expense . . . . . . . . . . . . . . . . . . . . . . . . . . . . . . . . . . . . . . 8,919 11,987 —Restricted stock unit activity . . . . . . . . . . . . . . . . . . . . . . . . . . . . . . . . . 4,961 16,000 21,958Transfer of unearned compensation balance per SFAS No. 123R . . . . . . . . . . . — (32,773) —Initial adoption of FIN 48 . . . . . . . . . . . . . . . . . . . . . . . . . . . . . . . . . . . (1,719) — —Other, net* . . . . . . . . . . . . . . . . . . . . . . . . . . . . . . . . . . . . . . . . . . . . 4,343 3,613 3,375
Balance at end of year . . . . . . . . . . . . . . . . . . . . . . . . . . . . . . . . . . . . . . 617,811 580,606 502,235
RETAINED EARNINGSBalance at beginning of year . . . . . . . . . . . . . . . . . . . . . . . . . . . . . . . . . . 5,778,617 5,454,108 5,210,748
Net income . . . . . . . . . . . . . . . . . . . . . . . . . . . . . . . . . . . . . . . . . . . . 844,925 785,746 645,603Cash dividends:Preferred (per share $1.70 per share in 2008, 2007, and 2006) . . . . . . . . . . . (12) (13) (14)Common (per share $1.52, $1.40, and $1.20 in 2008, 2007, and 2006,
respectively) . . . . . . . . . . . . . . . . . . . . . . . . . . . . . . . . . . . . . . . . . (485,234) (461,224) (408,137)Initial adoption of FIN 48 . . . . . . . . . . . . . . . . . . . . . . . . . . . . . . . . . . . (9,288) — —Other, net* . . . . . . . . . . . . . . . . . . . . . . . . . . . . . . . . . . . . . . . . . . . . — — 5,908
Balance at end of year . . . . . . . . . . . . . . . . . . . . . . . . . . . . . . . . . . . . . . 6,129,008 5,778,617 5,454,108
TREASURY STOCKBalance at beginning of year . . . . . . . . . . . . . . . . . . . . . . . . . . . . . . . . . . (109,317) (4,406,126)(100,339) (3,852,220) (83,419) (3,140,586)
Shares reacquired. . . . . . . . . . . . . . . . . . . . . . . . . . . . . . . . . . . . . . . . (13,054) (580,707) (16,651) (760,686) (21,925) (823,370)Conversion of preferred into common stock . . . . . . . . . . . . . . . . . . . . . . . . 8 224 7 195 1 33Stock opt ions exerc ised, net of s hares tendered for payment . . . . . . . . . . . . . . 2,116 62,486 7,265 195,117 4,575 101,945Restricted stock unit activity . . . . . . . . . . . . . . . . . . . . . . . . . . . . . . . . . 289 8,591 96 2,438 58 1,303Other, net* . . . . . . . . . . . . . . . . . . . . . . . . . . . . . . . . . . . . . . . . . . . . 330 9,777 305 9,030 371 8,455
Balance at end of year . . . . . . . . . . . . . . . . . . . . . . . . . . . . . . . . . . . . . . (119,628) (4,905,755)(109,317) (4,406,126)(100,339) (3,852,220)
UNEARNED COMPENSATIONBalance at beginning of year . . . . . . . . . . . . . . . . . . . . . . . . . . . . . . . . . . — (32,773) (31,141)
Restricted stock unit activity . . . . . . . . . . . . . . . . . . . . . . . . . . . . . . . . . — — (2,195)Transfer of balance to additional capital per SFAS No. 123R . . . . . . . . . . . . . — 32,773 —Other, net* . . . . . . . . . . . . . . . . . . . . . . . . . . . . . . . . . . . . . . . . . . . . — — 563
Balance at end of year . . . . . . . . . . . . . . . . . . . . . . . . . . . . . . . . . . . . . . — — (32,773)
OTHER COMPREHENSIVE (LOSS)/INCOMEBalance at beginning of year . . . . . . . . . . . . . . . . . . . . . . . . . . . . . . . . . . (219,265) (130,383) 25,622
Net pension and post-retirement benefit losses (net of $75,407 tax benefit in2008) . . . . . . . . . . . . . . . . . . . . . . . . . . . . . . . . . . . . . . . . . . . . . . (155,989) — —
Reclassification of net pension and post-retirement benefit losses to net income(net of $14,159 tax benefit in 2008) . . . . . . . . . . . . . . . . . . . . . . . . . . . . 27,787 — —
Minimum pension liability (net of $4,167 tax expense and $3,306 tax benefit in2007 and 2006, respectively) . . . . . . . . . . . . . . . . . . . . . . . . . . . . . . . . — 8,041 (8,583)
Unrealized translation adjustments (net of $25,823 tax expense, $29,635 taxbenefit, and $11,912 tax benefit in 2008, 2007 and 2006, respectively) . . . . . . 281,090 293,673 (147,746)
Net change in fair value of cash flow hedges (net of $7,527 tax expense and$4,423 tax benefit in 2008 and 2007, respectively) . . . . . . . . . . . . . . . . . . . 16,273 (3,401) 8,236
Net hedging (gains)/losses reclassified into earnings (net of $7,287 tax expense,$6,163 tax benefit, and $5,915 tax expense in 2008, 2007, and 2006,respectively) . . . . . . . . . . . . . . . . . . . . . . . . . . . . . . . . . . . . . . . . . . (10,986) 11,239 (7,912)
Net other comprehensive income/(loss) adjustments . . . . . . . . . . . . . . . . . . . 158,175 309,552 (156,005)
Initial adoption of SFAS No. 158, net of $182,530 tax benefit . . . . . . . . . . . . . — (398,434) —
Balance at end of year . . . . . . . . . . . . . . . . . . . . . . . . . . . . . . . . . . . . . . (61,090)†† (219,265) (130,383)
TOTAL SHAREHOLDERS’ EQUITY . . . . . . . . . . . . . . . . . . . . . . . . . . . . $ 1,887,820 $ 1,841,683 $ 2,048,823COMPREHENSIVE INCOME
Net income . . . . . . . . . . . . . . . . . . . . . . . . . . . . . . . . . . . . . . . . . . . . $ 844,925 $ 785,746 $ 645,603Net other comprehensive income/(loss) adjustments . . . . . . . . . . . . . . . . . . . 158,175 309,552 (156,005)
TOTAL COMPREHENSIVE INCOME . . . . . . . . . . . . . . . . . . . . . . . . . . . $ 1,003,100 $ 1,095,298 $ 489,598
* Includes activity of the Global Stock Purchase Plan. Retained Earnings in Fiscal 2006 reflects the final settlementassociated with businesses spun-off to Del Monte in Fiscal 2003.
† Includes income tax benefit resulting from exercised stock options.
†† Comprised of unrealized translation adjustment of $529,228, pension and post-retirement benefits net prior service cost of $(11,833) and net losses of $(586,986), and deferred net gains on derivative financial instruments of $8,501.
See Notes to Consolidated Financial Statements
40
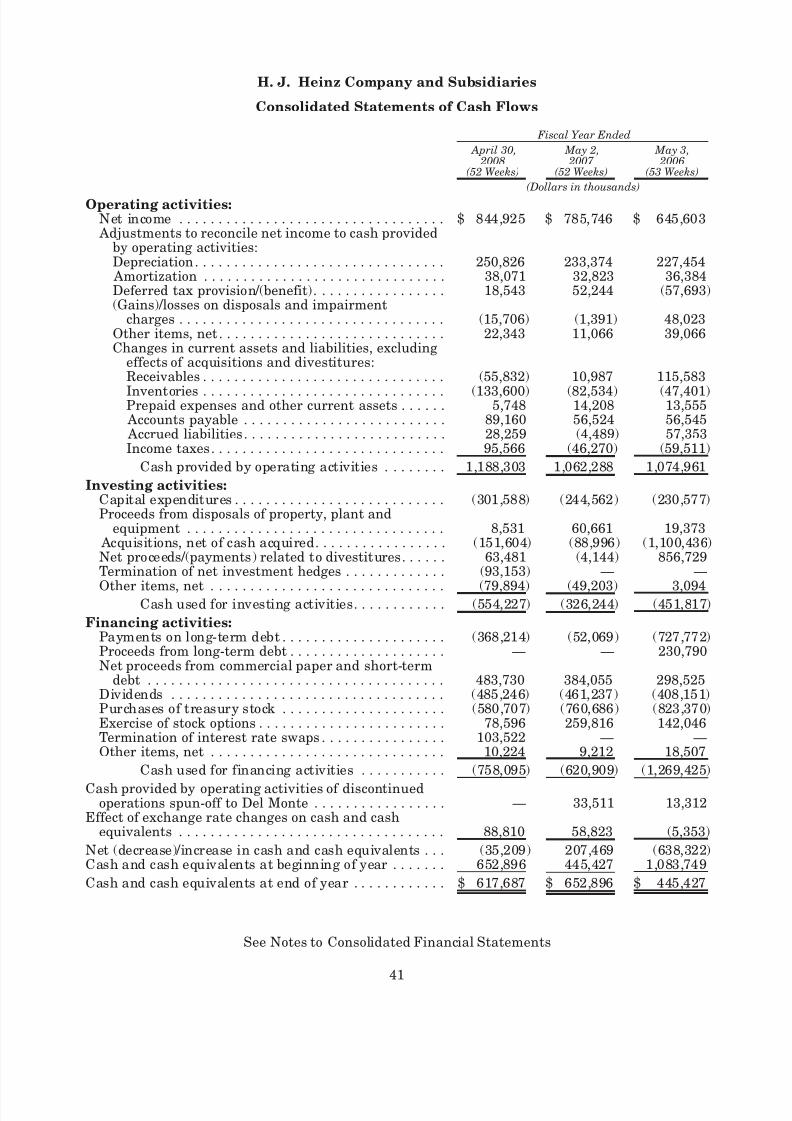
8/3/2019 2008HeinzAR
http://slidepdf.com/reader/full/2008heinzar 55/108
H. J. Heinz Company and Subsidiaries
Consolidated Statements of Cash Flows
April 30, 2008
(52 Weeks)
May 2, 2007
(52 Weeks)
May 3, 2006
(53 Weeks)
Fiscal Year Ended
(Dollars in thousands)
Operating activities:Net income . . . . . . . . . . . . . . . . . . . . . . . . . . . . . . . . . . $ 844,925 $ 785,746 $ 645,603
Adjustments to reconcile net income to cash providedby operating activities:Depreciation. . . . . . . . . . . . . . . . . . . . . . . . . . . . . . . . 250,826 233,374 227,454
Amortization . . . . . . . . . . . . . . . . . . . . . . . . . . . . . . . 38,071 32,823 36,384Deferred tax provision/(benefit). . . . . . . . . . . . . . . . . 18,543 52,244 (57,693)(Gains)/losses on disposals and impairment
charges . . . . . . . . . . . . . . . . . . . . . . . . . . . . . . . . . . (15,706) (1,391) 48,023Other items, net. . . . . . . . . . . . . . . . . . . . . . . . . . . . . 22,343 11,066 39,066Changes in current assets and liabilities, excluding
effects of acquisitions and divestitures:Receivables . . . . . . . . . . . . . . . . . . . . . . . . . . . . . . . (55,832) 10,987 115,583
Inventories . . . . . . . . . . . . . . . . . . . . . . . . . . . . . . . (133,600) (82,534) (47,401)Prepaid expenses and other current assets . . . . . . 5,748 14,208 13,555 Accounts payable . . . . . . . . . . . . . . . . . . . . . . . . . . 89,160 56,524 56,545 Accrued liabilities. . . . . . . . . . . . . . . . . . . . . . . . . . 28,259 (4,489) 57,353Income taxes. . . . . . . . . . . . . . . . . . . . . . . . . . . . . . 95,566 (46,270) (59,511)
Cash provided by operating activities . . . . . . . . 1,188,303 1,062,288 1,074,961
Investing activities:Capital expenditures . . . . . . . . . . . . . . . . . . . . . . . . . . . (301,588) (244,562) (230,577)Proceeds from disposals of property, plant and
equipment . . . . . . . . . . . . . . . . . . . . . . . . . . . . . . . . . 8,531 60,661 19,373 Acquisitions, net of cash acquired. . . . . . . . . . . . . . . . . (151,604) (88,996) (1,100,436)Net proceeds/(payments) related to divestitures. . . . . . 63,481 (4,144) 856,729Termination of net investment hedges . . . . . . . . . . . . . (93,153) — —
Other items, net . . . . . . . . . . . . . . . . . . . . . . . . . . . . . . (79,894) (49,203) 3,094Cash used for investing activities. . . . . . . . . . . . (554,227) (326,244) (451,817)
Financing activities:Payments on long-term debt . . . . . . . . . . . . . . . . . . . . . (368,214) (52,069) (727,772)Proceeds from long-term debt . . . . . . . . . . . . . . . . . . . . — — 230,790Net proceeds from commercial paper and short-term
debt . . . . . . . . . . . . . . . . . . . . . . . . . . . . . . . . . . . . . . 483,730 384,055 298,525Dividends . . . . . . . . . . . . . . . . . . . . . . . . . . . . . . . . . . . (485,246) (461,237) (408,151)Purchases of treasury stock . . . . . . . . . . . . . . . . . . . . . (580,707) (760,686) (823,370)Exercise of stock options . . . . . . . . . . . . . . . . . . . . . . . . 78,596 259,816 142,046Termination of interest rate swaps . . . . . . . . . . . . . . . . 103,522 — —Other items, net . . . . . . . . . . . . . . . . . . . . . . . . . . . . . . 10,224 9,212 18,507
Cash used for financing activities . . . . . . . . . . . (758,095) (620,909) (1,269,425)
Cash provided by operating activities of discontinuedoperations spun-off to Del Monte . . . . . . . . . . . . . . . . . — 33,511 13,312
Effect of exchange rate changes on cash and cashequivalents . . . . . . . . . . . . . . . . . . . . . . . . . . . . . . . . . . 88,810 58,823 (5,353)
Net (decrease)/increase in cash and cash equivalents . . . (35,209) 207,469 (638,322)Cash and cash equivalents at beginning of year . . . . . . . 652,896 445,427 1,083,749
Cash and cash equivalents at end of year . . . . . . . . . . . . $ 617,687 $ 652,896 $ 445,427
See Notes to Consolidated Financial Statements
41
8/3/2019 2008HeinzAR
http://slidepdf.com/reader/full/2008heinzar 56/108
H. J. Heinz Company and Subsidiaries
Notes to Consolidated Financial Statements
1. Significant Accounting Policies
Fiscal Year:
H. J. Heinz Company (the “Company”) operates on a 52-week or 53-week fiscal year ending theWednesday nearest April 30. However, certain foreign subsidiaries have earlier closing dates tofacilitate timely reporting. Fiscal years for the financial statements included herein ended April 30,2008, May 2, 2007, and May 3, 2006.
Principles of Consolidation:
The consolidated financial statements include the accounts of the Company and entities in whichthe Company maintains a controlling financial interest. Control is generally determined based on themajority ownership of an entity’s voting interests. In certain situations, control is based on partic-ipation in the majority of an entity’s economic risks and rewards. Investments in certain companiesover which the Company exerts significant influence, but does not control the financial and operating
decisions, are accounted for as equity method investments. All intercompany accounts and trans-actions are eliminated.
As a result of general economic uncertainty, coupled with restrictions on the repatriation of earnings, as of the end of November 2002 the Company deconsolidated its Zimbabwean operationsand classified its remaining net investment of approximately $111 million as a cost investment. Inthe fourth quarter of Fiscal 2006, the Company wrote off its net investment in Zimbabwe. Thedecision to write off the Zimbabwe investment related to management’s determination that thisinvestment was not a core business. Management’s determination was based on an evaluation of political and economic conditions existing in Zimbabwe and the ability for the Company to recover itscost in this investment. This evaluation considered the continued economic turmoil, further insta-bility in the local currency and the uncertainty regarding the ability to source raw material in the
future. In Fiscal 2008, the Company sold this business resulting in an insignificant gain.
Use of Estimates:
The preparation of financial statements, in conformity with accounting principles generallyaccepted in the United States of America, requires management to make estimates and assumptionsthat affect the reported amounts of assets and liabilities, the disclosure of contingent assets andliabilities at the date of the financial statements, and the reported amounts of revenues and expensesduring the reporting period. Actual results could differ from these estimates.
Translation of Foreign Currencies:
For all significant foreign operations, the functional currency is the local currency. Assets andliabilities of these operations are translated at the exchange rate in effect at each year-end. Incomestatement accounts are translated at the average rate of exchange prevailing during the year.Translation adjustments arising from the use of differing exchange rates from period to period areincluded as a component of other comprehensive income/(loss) within shareholders’ equity. Gains andlosses from foreign currency transactions are included in net income for the period.
Cash Equivalents:
Cash equivalents are defined as highly liquid investments with original maturities of 90 days orless.
42
8/3/2019 2008HeinzAR
http://slidepdf.com/reader/full/2008heinzar 57/108
Inventories:
Inventories are stated at the lower of cost or market. Cost is determined principally under theaverage cost method.
Property, Plant and Equipment:
Land, buildings and equipment are recorded at cost. For financial reporting purposes, depre-ciation is provided on the straight-line method over the estimated useful lives of the assets, whichgenerally have the following ranges: buildings—40 years or less, machinery and equipment—15 years or less, computer software—3 to 7 years, and leasehold improvements—over the life of the lease, not to exceed 15 years. Accelerated depreciation methods are generally used for income taxpurposes. Expenditures for new facilities and improvements that substantially extend the capacityor useful life of an asset are capitalized. Ordinary repairs and maintenance are expensed as incurred.When property is retired or otherwise disposed, the cost and related depreciation are removed fromthe accounts and any related gains or losses are included in income. Property, plant and equipment
are reviewed for possible impairment when appropriate. The Company’s impairment review is basedon an undiscounted cash flow analysis at the lowest level for which identifiable cash flows exist.Impairment occurs when the carrying value of the asset exceeds the future undiscounted cash flows.When an impairment is indicated, the asset is written down to its fair value.
Intangibles:
Intangible assets with finite useful lives are amortized on a straight-line basis over the estimatedperiods benefited, and are reviewed when appropriate for possible impairment, similar to property,plant and equipment. Goodwill and intangible assets with indefinite useful lives are not amortized.The carrying values of goodwill and other intangible assets with indefinite useful lives are tested atleast annually for impairment.
Revenue Recognition:
The Company recognizes revenue when title, ownership and risk of loss pass to the customer.This occurs upon delivery of the product to the customer. Customers generally do not have the right toreturn products unless damaged or defective. Revenue is recorded, net of sales incentives, andincludes shipping and handling charges billed to customers. Shipping and handling costs areprimarily classified as part of selling, general and administrative expenses.
Marketing Costs:
The Company promotes its products with advertising, consumer incentives and trade promo-tions. Such programs include, but are not limited to, discounts, coupons, rebates, in-store display
incentives and volume-based incentives. Advertising costs are expensed as incurred. Consumerincentive and trade promotion activities are recorded as a reduction of revenue or as a component of cost of products sold based on amounts estimated as being due to customers and consumers at the endof a period, based principally on historical utilization and redemption rates. For interim reportingpurposes, advertising, consumer incentive and product placement expenses are charged to opera-tions as a percentage of volume, based on estimated volume and related expense for the full year.
Income Taxes:
Deferred income taxes result primarily from temporary differences between financial and taxreporting. If it is more likely than not that some portion or all of a deferred tax asset will not be
43
H. J. Heinz Company and Subsidiaries
Notes to Consolidated Financial Statements — (Continued)
8/3/2019 2008HeinzAR
http://slidepdf.com/reader/full/2008heinzar 58/108
realized, a valuation allowance is recognized. When assessing the need for valuation allowances, theCompany considers future taxable income and ongoing prudent and feasible tax planning strategies.Should a change in circumstances lead to a change in judgment about the realizability of deferred tax
assets in future years, the Company would adjust related valuation allowances in the period that thechange in circumstances occurs, along with a corresponding increase or charge to income.
The Company has not provided for possible U.S. taxes on the undistributed earnings of foreignsubsidiaries that are considered to be reinvested indefinitely. Calculation of the unrecognizeddeferred tax liability for temporary differences related to these earnings is not practicable.
Stock-Based Employee Compensation Plans:
Prior to May 4, 2006, the Company accounted for its stock-based compensation plans under themeasurement and recognition provisions of Accounting Principles Board Opinion No. (“APB”) 25,
Accounting for Stock Issued to Employees, and related Interpretations, as permitted by Statement of Financial Accounting Standards (“SFAS”) No. 123, Accounting for Stock-Based Compensation
(“ SFAS 123”). Under the intrinsic-value method prescribed by APB 25, compensation cost for stockoptions was measured at the grant date as the excess, if any, of the quoted market price of theCompany’s stock over the exercise price of the options. Generally employee stock options weregranted at or above the grant date market price, therefore, no compensation cost was recognized forstock option grants in prior periods; however, stock-based compensation was included as a pro-formadisclosure in the Notes to Consolidated Financial Statements. Compensation cost for restricted stockunits was determined as the fair value of the Company’s stock at the grant date and was amortizedover the vesting period and recognized as a component of general and administrative expenses.
Effective May 4, 2006, the Company adopted SFAS No. 123R, Share-Based Payment
(“SFAS 123R”), which requires all stock-based payments to employees, including grants of employeestock options, to be recognized in the Consolidated Statements of Income based on their fair values.Determining the fair value of share-based awards at the grant date requires judgment in estimating
the expected term that the stock options will be outstanding prior to exercise as well as the volatilityand dividends over the expected term. Judgment is also required in estimating the amount of stock-based awards expected to be forfeited prior to vesting. If actual forfeitures differ significantly fromthese estimates, stock-based compensation expense could be materially impacted.
44
H. J. Heinz Company and Subsidiaries
Notes to Consolidated Financial Statements — (Continued)
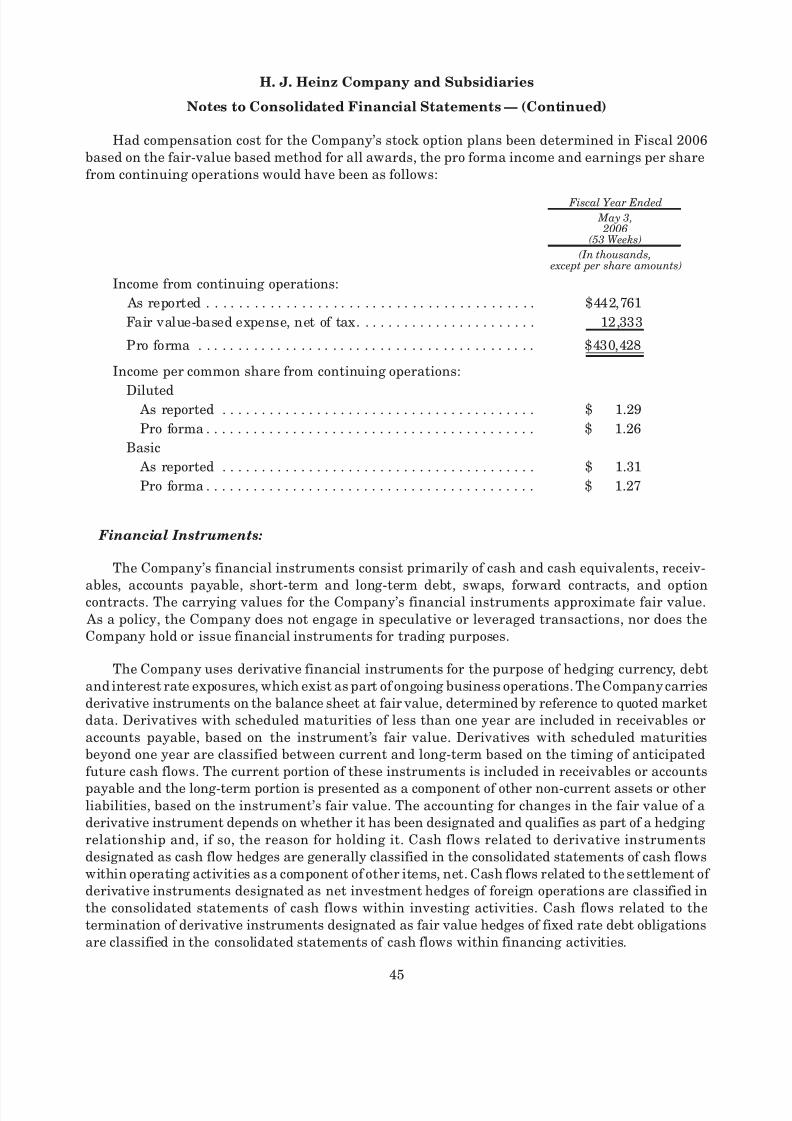
8/3/2019 2008HeinzAR
http://slidepdf.com/reader/full/2008heinzar 59/108
Had compensation cost for the Company’s stock option plans been determined in Fiscal 2006based on the fair-value based method for all awards, the pro forma income and earnings per sharefrom continuing operations would have been as follows:
May 3, 2006
(53 Weeks)
Fiscal Year Ended
(In thousands, except per share amounts)
Income from continuing operations:
As reported . . . . . . . . . . . . . . . . . . . . . . . . . . . . . . . . . . . . . . . . . . $442,761
Fair value-based expense, net of tax. . . . . . . . . . . . . . . . . . . . . . . 12,333
Pro forma . . . . . . . . . . . . . . . . . . . . . . . . . . . . . . . . . . . . . . . . . . . $430,428
Income per common share from continuing operations:
Diluted As reported . . . . . . . . . . . . . . . . . . . . . . . . . . . . . . . . . . . . . . . . $ 1.29
Pro forma . . . . . . . . . . . . . . . . . . . . . . . . . . . . . . . . . . . . . . . . . . $ 1.26
Basic
As reported . . . . . . . . . . . . . . . . . . . . . . . . . . . . . . . . . . . . . . . . $ 1.31
Pro forma . . . . . . . . . . . . . . . . . . . . . . . . . . . . . . . . . . . . . . . . . . $ 1.27
Financial Instruments:
The Company’s financial instruments consist primarily of cash and cash equivalents, receiv-
ables, accounts payable, short-term and long-term debt, swaps, forward contracts, and optioncontracts. The carrying values for the Company’s financial instruments approximate fair value. As a policy, the Company does not engage in speculative or leveraged transactions, nor does theCompany hold or issue financial instruments for trading purposes.
The Company uses derivative financial instruments for the purpose of hedging currency, debtand interest rate exposures, which exist as part of ongoing business operations. The Company carriesderivative instruments on the balance sheet at fair value, determined by reference to quoted marketdata. Derivatives with scheduled maturities of less than one year are included in receivables oraccounts payable, based on the instrument’s fair value. Derivatives with scheduled maturitiesbeyond one year are classified between current and long-term based on the timing of anticipatedfuture cash flows. The current portion of these instruments is included in receivables or accounts
payable and the long-term portion is presented as a component of other non-current assets or otherliabilities, based on the instrument’s fair value. The accounting for changes in the fair value of aderivative instrument depends on whether it has been designated and qualifies as part of a hedgingrelationship and, if so, the reason for holding it. Cash flows related to derivative instrumentsdesignated as cash flow hedges are generally classified in the consolidated statements of cash flowswithin operating activities as a component of other items, net. Cash flows related to the settlement of derivative instruments designated as net investment hedges of foreign operations are classified inthe consolidated statements of cash flows within investing activities. Cash flows related to thetermination of derivative instruments designated as fair value hedges of fixed rate debt obligationsare classified in the consolidated statements of cash flows within financing activities.
45
H. J. Heinz Company and Subsidiaries
Notes to Consolidated Financial Statements — (Continued)
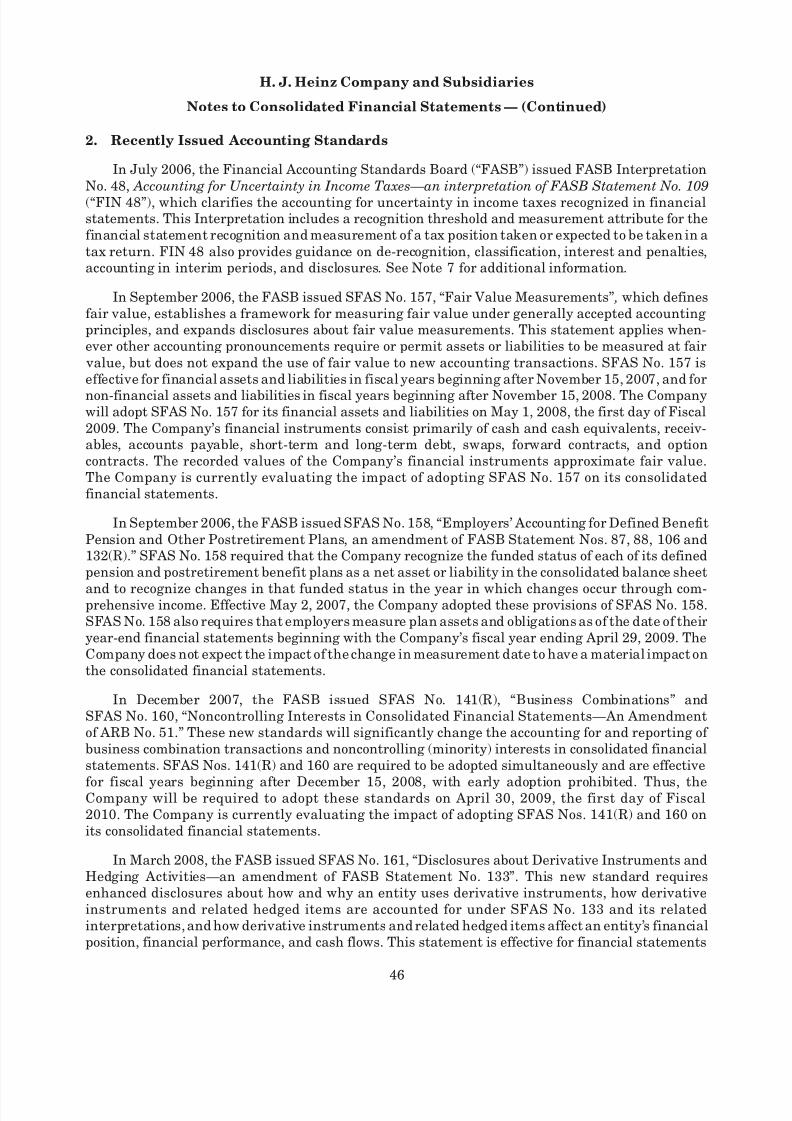
8/3/2019 2008HeinzAR
http://slidepdf.com/reader/full/2008heinzar 60/108
2. Recently Issued Accounting Standards
In July 2006, the Financial Accounting Standards Board (“FASB”) issued FASB InterpretationNo. 48, Accounting for Uncertainty in Income Taxes—an interpretation of FASB Statement No. 109
(“FIN 48”), which clarifies the accounting for uncertainty in income taxes recognized in financialstatements. This Interpretation includes a recognition threshold and measurement attribute for thefinancial statement recognition and measurement of a tax position taken or expected to be taken in atax return. FIN 48 also provides guidance on de-recognition, classification, interest and penalties,accounting in interim periods, and disclosures. See Note 7 for additional information.
In September 2006, the FASB issued SFAS No. 157, “Fair Value Measurements” , which definesfair value, establishes a framework for measuring fair value under generally accepted accountingprinciples, and expands disclosures about fair value measurements. This statement applies when-ever other accounting pronouncements require or permit assets or liabilities to be measured at fair
value, but does not expand the use of fair value to new accounting transactions. SFAS No. 157 iseffective for financial assets and liabilities in fiscal years beginning after November 15, 2007, and for
non-financial assets and liabilities in fiscal years beginning after November 15, 2008. The Companywill adopt SFAS No. 157 for its financial assets and liabilities on May 1, 2008, the first day of Fiscal2009. The Company’s financial instruments consist primarily of cash and cash equivalents, receiv-ables, accounts payable, short-term and long-term debt, swaps, forward contracts, and optioncontracts. The recorded values of the Company’s financial instruments approximate fair value.The Company is currently evaluating the impact of adopting SFAS No. 157 on its consolidatedfinancial statements.
In September 2006, the FASB issued SFAS No. 158, “Employers’ Accounting for Defined BenefitPension and Other Postretirement Plans, an amendment of FASB Statement Nos. 87, 88, 106 and132(R).” SFAS No. 158 required that the Company recognize the funded status of each of its definedpension and postretirement benefit plans as a net asset or liability in the consolidated balance sheet
and to recognize changes in that funded status in the year in which changes occur through com-prehensive income. Effective May 2, 2007, the Company adopted these provisions of SFAS No. 158.SFAS No. 158 also requires that employers measure plan assets and obligations as of the date of theiryear-end financial statements beginning with the Company’s fiscal year ending April 29, 2009. TheCompany does not expect the impact of the change in measurement date to have a material impact onthe consolidated financial statements.
In December 2007, the FASB issued SFAS No. 141(R), “Business Combinations” andSFAS No. 160, “Noncontrolling Interests in Consolidated Financial Statements—An Amendmentof ARB No. 51.” These new standards will significantly change the accounting for and reporting of business combination transactions and noncontrolling (minority) interests in consolidated financialstatements. SFAS Nos. 141(R) and 160 are required to be adopted simultaneously and are effective
for fiscal years beginning after December 15, 2008, with early adoption prohibited. Thus, theCompany will be required to adopt these standards on April 30, 2009, the first day of Fiscal2010. The Company is currently evaluating the impact of adopting SFAS Nos. 141(R) and 160 onits consolidated financial statements.
In March 2008, the FASB issued SFAS No. 161, “Disclosures about Derivative Instruments andHedging Activities—an amendment of FASB Statement No. 133”. This new standard requiresenhanced disclosures about how and why an entity uses derivative instruments, how derivativeinstruments and related hedged items are accounted for under SFAS No. 133 and its relatedinterpretations, and how derivative instruments and related hedged items affect an entity’s financialposition, financial performance, and cash flows. This statement is effective for financial statements
46
H. J. Heinz Company and Subsidiaries
Notes to Consolidated Financial Statements — (Continued)
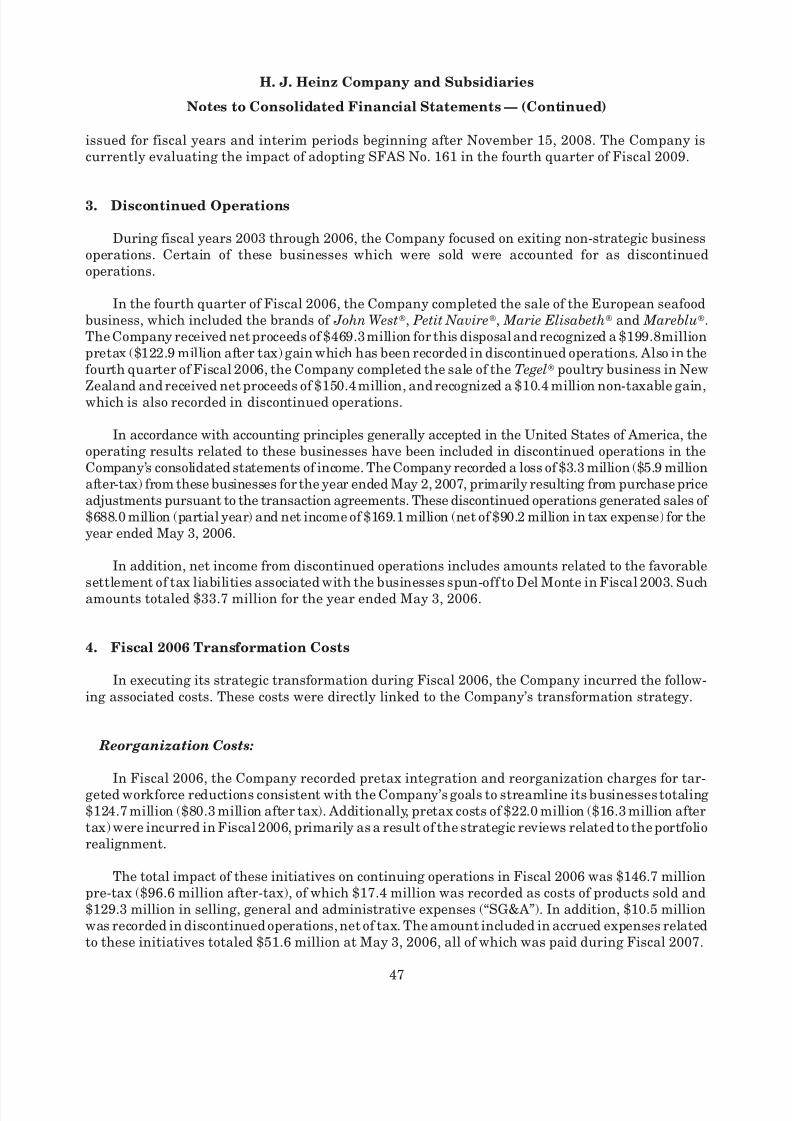
8/3/2019 2008HeinzAR
http://slidepdf.com/reader/full/2008heinzar 61/108
issued for fiscal years and interim periods beginning after November 15, 2008. The Company iscurrently evaluating the impact of adopting SFAS No. 161 in the fourth quarter of Fiscal 2009.
3. Discontinued Operations
During fiscal years 2003 through 2006, the Company focused on exiting non-strategic businessoperations. Certain of these businesses which were sold were accounted for as discontinuedoperations.
In the fourth quarter of Fiscal 2006, the Company completed the sale of the European seafoodbusiness, which included the brands of John West», Petit Navire», Marie Elisabeth» and Mareblu».The Company received net proceeds of $469.3 million for this disposal and recognized a $199.8millionpretax ($122.9 million after tax) gain which has been recorded in discontinued operations. Also in thefourth quarter of Fiscal 2006, the Company completed the sale of the Tegel» poultry business in New
Zealand and received net proceeds of $150.4 million, and recognized a $10.4 million non-taxable gain,which is also recorded in discontinued operations.
In accordance with accounting principles generally accepted in the United States of America, theoperating results related to these businesses have been included in discontinued operations in theCompany’s consolidated statements of income. The Company recorded a loss of $3.3 million ($5.9 millionafter-tax) from these businesses for the year ended May 2, 2007, primarily resulting from purchase priceadjustments pursuant to the transaction agreements. These discontinued operations generated sales of $688.0 million (partial year) and net income of $169.1 million (net of $90.2 million in tax expense) for theyear ended May 3, 2006.
In addition, net income from discontinued operations includes amounts related to the favorable
settlement of tax liabilities associated with the businesses spun-off to Del Monte in Fiscal 2003. Suchamounts totaled $33.7 million for the year ended May 3, 2006.
4. Fiscal 2006 Transformation Costs
In executing its strategic transformation during Fiscal 2006, the Company incurred the follow-ing associated costs. These costs were directly linked to the Company’s transformation strategy.
Reorganization Costs:
In Fiscal 2006, the Company recorded pretax integration and reorganization charges for tar-geted workforce reductions consistent with the Company’s goals to streamline its businesses totaling$124.7 million ($80.3 million after tax). Additionally, pretax costs of $22.0 million ($16.3 million aftertax) were incurred in Fiscal 2006, primarily as a result of the strategic reviews related to the portfoliorealignment.
The total impact of these initiatives on continuing operations in Fiscal 2006 was $146.7 millionpre-tax ($96.6 million after-tax), of which $17.4 million was recorded as costs of products sold and$129.3 million in selling, general and administrative expenses (“SG&A”). In addition, $10.5 millionwas recorded in discontinued operations, net of tax. The amount included in accrued expenses relatedto these initiatives totaled $51.6 million at May 3, 2006, all of which was paid during Fiscal 2007.
47
H. J. Heinz Company and Subsidiaries
Notes to Consolidated Financial Statements — (Continued)
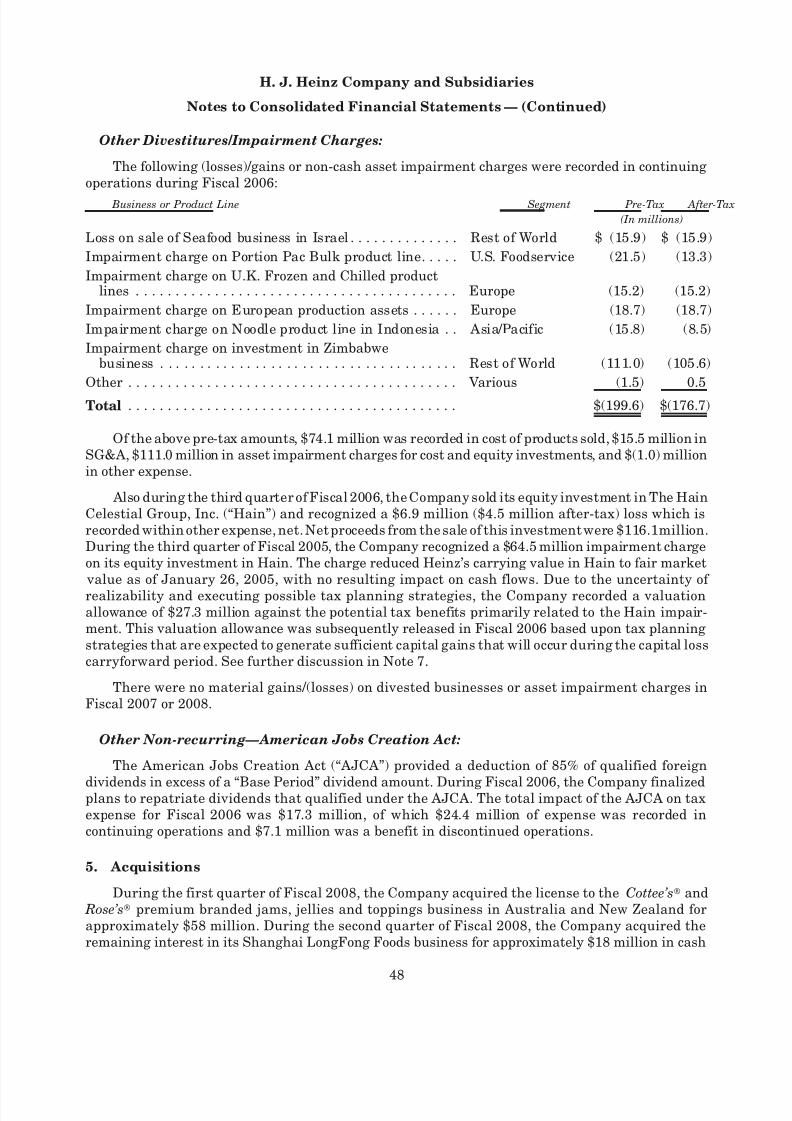
8/3/2019 2008HeinzAR
http://slidepdf.com/reader/full/2008heinzar 62/108
Other Divestitures/Impairment Charges:
The following (losses)/gains or non-cash asset impairment charges were recorded in continuingoperations during Fiscal 2006:
Business or Product Line Segment Pre-Tax After-Tax
(In millions)
Loss on sale of Seafood business in Israel . . . . . . . . . . . . . . Rest of World $ (15.9) $ (15.9)
Impairment charge on Portion Pac Bulk product line. . . . . U.S. Foodservice (21.5) (13.3)
Impairment charge on U.K. Frozen and Chilled productlines . . . . . . . . . . . . . . . . . . . . . . . . . . . . . . . . . . . . . . . . . Europe (15.2) (15.2)
Impairment charge on European production assets . . . . . . Europe (18.7) (18.7)
Impairment charge on Noodle product line in Indonesia . . Asia/Pacific (15.8) (8.5)
Impairment charge on investment in Zimbabwebusiness . . . . . . . . . . . . . . . . . . . . . . . . . . . . . . . . . . . . . . Rest of World (111.0) (105.6)
Other . . . . . . . . . . . . . . . . . . . . . . . . . . . . . . . . . . . . . . . . . . Various (1.5) 0.5
Total . . . . . . . . . . . . . . . . . . . . . . . . . . . . . . . . . . . . . . . . . . $(199.6) $(176.7)
Of the above pre-tax amounts, $74.1 million was recorded in cost of products sold, $15.5 million inSG&A, $111.0 million in asset impairment charges for cost and equity investments, and $(1.0) millionin other expense.
Also during the third quarter of Fiscal 2006, the Company sold its equity investment in The HainCelestial Group, Inc. (“Hain”) and recognized a $6.9 million ($4.5 million after-tax) loss which isrecorded within other expense, net. Net proceeds from the sale of this investment were $116.1million.During the third quarter of Fiscal 2005, the Company recognized a $64.5 million impairment chargeon its equity investment in Hain. The charge reduced Heinz’s carrying value in Hain to fair market
value as of January 26, 2005, with no resulting impact on cash flows. Due to the uncertainty of realizability and executing possible tax planning strategies, the Company recorded a valuationallowance of $27.3 million against the potential tax benefits primarily related to the Hain impair-ment. This valuation allowance was subsequently released in Fiscal 2006 based upon tax planningstrategies that are expected to generate sufficient capital gains that will occur during the capital losscarryforward period. See further discussion in Note 7.
There were no material gains/(losses) on divested businesses or asset impairment charges inFiscal 2007 or 2008.
Other Non-recurring—American Jobs Creation Act:
The American Jobs Creation Act (“AJCA”) provided a deduction of 85% of qualified foreign
dividends in excess of a “Base Period” dividend amount. During Fiscal 2006, the Company finalizedplans to repatriate dividends that qualified under the AJCA. The total impact of the AJCA on taxexpense for Fiscal 2006 was $17.3 million, of which $24.4 million of expense was recorded incontinuing operations and $7.1 million was a benefit in discontinued operations.
5. Acquisitions
During the first quarter of Fiscal 2008, the Company acquired the license to the Cottee’s» and Rose’s» premium branded jams, jellies and toppings business in Australia and New Zealand forapproximately $58 million. During the second quarter of Fiscal 2008, the Company acquired theremaining interest in its Shanghai LongFong Foods business for approximately $18 million in cash
48
H. J. Heinz Company and Subsidiaries
Notes to Consolidated Financial Statements — (Continued)
8/3/2019 2008HeinzAR
http://slidepdf.com/reader/full/2008heinzar 63/108
and $15 million of deferred consideration. During the fourth quarter of Fiscal 2008, the Companyacquired the Wyko» sauce business in the Netherlands for approximately $66 million. The Companyalso made payments during Fiscal 2008 related to acquisitions completed in prior fiscal years, none of
which were significant.During Fiscal 2007, the Company acquired Renée’s Gourmet Foods, a Canadian manufacturer of
premium chilled salad dressings, sauces, dips, marinades and mayonnaise, for approximately$68 million. In addition, during Fiscal 2007, the Company acquired the remaining interest in itsPetrosoyuz joint venture for approximately $15 million. The Company also made payments duringFiscal 2007 related to acquisitions completed in prior fiscal years, none of which were significant.
The Company acquired the following businesses during Fiscal 2006 for a total purchase price of $1.1 billion:
• In August 2005, the Company acquired HP Foods Limited, HP Foods Holdings Limited, andHP Foods International Limited (collectively referred to as “HPF”) for a purchase price of approximately $877 million. HPF is a manufacturer and marketer of sauces which are
primarily sold in the United Kingdom, the United States, and Canada. The Company acquiredHPF’s brands including HP» and Lea & Perrins» and a perpetual license to market Amoy»
brand Asian sauces and products in Europe. During the fourth quarter of Fiscal 2006, theCompany divested the Ethnic Foods division of HPF for net proceeds totaling approximately$43 million. In March 2006, the British Competition Commission formally cleared thisacquisition, concluding that the acquisition may not be expected to result in a substantiallessening of competition within the markets for tomato ketchup, brown sauce, barbeque sauce,canned baked beans and canned pasta in the United Kingdom.
• On April 28, 2005, the Company acquired a controlling interest in Petrosoyuz, a leadingRussian maker of ketchup, condiments and sauces. Petrosoyuz’s business includes brandssuch as Pikador», Derevenskoye», Mechta Hoziajki» and Moya Sem’ya».
• In July 2005, the Company acquired Nancy’s Specialty Foods, Inc., which produces premiumappetizers, quiche entrees and desserts in the United States and Canada.
• In March 2006, the Company acquired Kabobs, Inc., which produces premium hors d’oeuvresin the United States.
In addition, the Company made payments during Fiscal 2006 related to acquisitions completedin prior fiscal years, none of which were significant.
All of the above-mentioned acquisitions have been accounted for as purchases and, accordingly,the respective purchase prices have been allocated to the respective assets and liabilities based upontheir estimated fair values as of the acquisition date. Operating results of the businesses acquiredhave been included in the consolidated statements of income from the respective acquisition dates
forward. Pro forma results of the Company, assuming all of the acquisitions had occurred at thebeginning of each period presented, would not be materially different from the results reported.There are no significant contingent payments, options or commitments associated with any of theacquisitions, except as disclosed above.
49
H. J. Heinz Company and Subsidiaries
Notes to Consolidated Financial Statements — (Continued)
8/3/2019 2008HeinzAR
http://slidepdf.com/reader/full/2008heinzar 64/108
6. Goodwill and Other Intangible Assets
Changes in the carrying amount of goodwill for the fiscal year ended April 30, 2008, by reportablesegment, are as follows:
North AmericanConsumer Products Europe
Asia/ Pacific
U.S. Foodservice
Restof
World Total
(Thousands of dollars)
Balance at May 2, 2007 . . . $1,081,673 $1,259,514 $214,964 $262,823 $15,665 $2,834,639
Acquisitions . . . . . . . . . . . . — 15,259 47,603 — — 62,862
Purchase accountingadjustments . . . . . . . . . . 2,820 (2,155) — — — 665
Disposals . . . . . . . . . . . . . . — (1,239) — — — (1,239)
Translation adjustments . . 11,795 69,549 19,852 — (661) 100,535
Balance at April 30,2008 . . . . . . . . . . . . . . . . $1,096,288 $1,340,928 $282,419 $262,823 $15,004 $2,997,462
The annual impairment tests are performed as of the last day of the third quarter of each fiscalyear unless events suggest an impairment may have occurred in the interim.
The Company finalized the purchase price allocation for the Cottee’s» and Rose’s» acquisitionduring the fourth quarter of Fiscal 2008. The Company also recorded a preliminary purchase priceallocation related to the Wyko» acquisition, which is expected to be finalized upon completion of
valuation procedures.
Trademarks and other intangible assets at April 30, 2008 and May 2, 2007, subject to amor-tization expense, are as follows:
Gross Accum Amort Net Gross Accum Amort Net April 30, 2008 May 2, 2007
(Thousands of dollars)
Trademarks . . . . . . . . $200,966 $ (69,104) $131,862 $196,703 $ (63,110) $133,593
Licenses . . . . . . . . . . . 208,186 (141,070) 67,116 208,186 (135,349) 72,837
Recipes/processes . . . . 71,495 (19,306) 52,189 64,315 (15,779) 48,536
Customer relatedassets . . . . . . . . . . . 183,204 (31,418) 151,786 152,668 (19,183) 133,485
Other . . . . . . . . . . . . . 73,848 (59,639) 14,209 70,386 (56,344) 14,042
$737,699 $(320,537) $417,162 $692,258 $(289,765) $402,493
Amortization expense for trademarks and other intangible assets subject to amortization was$27.7 million, $25.7 million and $27.6 million for the fiscal years ended April 30, 2008, May 2, 2007and May 3, 2006, respectively. The finalization of the purchase price allocation for the HP Foodsacquisition resulted in a $5.3 million adjustment to amortization expense during the second quarterof Fiscal 2007. Based upon the amortizable intangible assets recorded on the balance sheet as of
April 30, 2008, amortization expense for each of the next five fiscal years is estimated to beapproximately $28 million.
Intangible assets not subject to amortization at April 30, 2008 totaled $996.9 million andconsisted of $825.2 million of trademarks, $135.3 million of recipes/processes, and $36.4 million of licenses. Intangibles assets not subject to amortization at May 2, 2007 totaled $902.7 million and
50
H. J. Heinz Company and Subsidiaries
Notes to Consolidated Financial Statements — (Continued)
8/3/2019 2008HeinzAR
http://slidepdf.com/reader/full/2008heinzar 65/108
consisted of $759.2 million of trademarks, $126.6 million of recipes/processes, and $16.9 million of licenses.
7. Income Taxes
The following table summarizes the provision/(benefit) for U.S. federal, state and foreign taxeson income from continuing operations.
2008 2007 2006
(Dollars in thousands)
Current:
U.S. federal . . . . . . . . . . . . . . . . . . . . . . . . . . . . . . . . $ 80,638 $ 89,020 $ 71,533
State . . . . . . . . . . . . . . . . . . . . . . . . . . . . . . . . . . . . . 15,323 9,878 14,944
Foreign . . . . . . . . . . . . . . . . . . . . . . . . . . . . . . . . . . . 258,365 181,655 225,498
354,326 280,553 311,975
Deferred:
U.S. federal . . . . . . . . . . . . . . . . . . . . . . . . . . . . . . . . 14,975 104,113 (54,957)
State . . . . . . . . . . . . . . . . . . . . . . . . . . . . . . . . . . . . . 2,381 5,444 3,015
Foreign . . . . . . . . . . . . . . . . . . . . . . . . . . . . . . . . . . . 1,187 (57,313) (9,333)
18,543 52,244 (61,275)
Provision for income taxes . . . . . . . . . . . . . . . . . . . . $372,869 $332,797 $250,700
Tax benefits related to stock options and other equity instruments recorded directly to additionalcapital totaled $6.2 million in Fiscal 2008, $15.5 million in Fiscal 2007 and $6.7 million in Fiscal 2006.
The components of income from continuing operations before income taxes consist of thefollowing:
2008 2007 2006
(Dollars in thousands)
Domestic . . . . . . . . . . . . . . . . . . . . . . . . . . . . . . . . . $ 268,450 $ 293,580 $ 87,409
Foreign . . . . . . . . . . . . . . . . . . . . . . . . . . . . . . . . . . 949,344 830,819 606,052
From continuing operations . . . . . . . . . . . . . . . . . . $1,217,794 $1,124,399 $693,461
The differences between the U.S. federal statutory tax rate and the Company’s consolidatedeffective tax rate on continuing operations are as follows:
2008 2007 2006
U.S. federal statutory tax rate. . . . . . . . . . . . . . . . . . . . . . . . . . . . . . . 35.0% 35.0% 35.0%
Tax on income of foreign subsidiaries . . . . . . . . . . . . . . . . . . . . . . . . . (4.5) (5.4) (3.6)
State income taxes (net of federal benefit) . . . . . . . . . . . . . . . . . . . . . 0.7 1.0 1.8
Earnings repatriation . . . . . . . . . . . . . . . . . . . . . . . . . . . . . . . . . . . . . 3.3 9.6 4.3
Reduction of tax reserves for statute of limitations expiration . . . . . (0.1) (5.9) —
Effects of revaluation of tax basis of foreign assets . . . . . . . . . . . . . . (2.4) (4.6) (2.3)
Other . . . . . . . . . . . . . . . . . . . . . . . . . . . . . . . . . . . . . . . . . . . . . . . . . . (1.4) (0.1) 1.0
Effective tax rate . . . . . . . . . . . . . . . . . . . . . . . . . . . . . . . . . . . . . . . . . 30.6% 29.6% 36.2%
51
H. J. Heinz Company and Subsidiaries
Notes to Consolidated Financial Statements — (Continued)
8/3/2019 2008HeinzAR
http://slidepdf.com/reader/full/2008heinzar 66/108
The increase in the effective tax rate in Fiscal 2008 is primarily the result of benefits recognized
in Fiscal 2007 for reversal of a foreign tax reserve, tax planning completed in a foreign jurisdiction,
and R&D tax credits. Those prior year benefits were partially offset by lower repatriation costs and
increased benefits from tax audit settlements occurring during Fiscal 2008, along with changes in valuation allowances for foreign losses. The decrease in the effective tax rate in Fiscal 2007 was
primarily the result of an increase in benefits associated with tax planning, a reduction in foreign tax
reserves, a prior year write-off of investment in affiliates for which no tax benefit could be recognized,a decrease in costs associated with tax audit settlements and decreases to foreign statutory tax rates,
partially offset by increased costs of repatriation and changes in valuation allowances. The Fiscal
2006 effective tax rate was unfavorably impacted by increased costs of repatriation including the
effects of the AJCA, a reduction in tax benefits associated with tax planning, increased costs
associated with audit settlements and the write-off of investment in affiliates for which no tax
benefit could be recognized, partially offset by the reversal of valuation allowances, the benefit of increased profits in lower tax rate jurisdictions and a reduction in tax reserves.
The following table and note summarize deferred tax (assets) and deferred tax liabilities as of
April 30, 2008 and May 2, 2007.
2008 2007
(Dollars in thousands)
Depreciation/amortization . . . . . . . . . . . . . . . . . . . . . . . . . . . . . . . $ 689,112 $ 634,192
Benefit plans . . . . . . . . . . . . . . . . . . . . . . . . . . . . . . . . . . . . . . . . . 33,719 43,632
Deferred income. . . . . . . . . . . . . . . . . . . . . . . . . . . . . . . . . . . . . . . 30,145 —
Other . . . . . . . . . . . . . . . . . . . . . . . . . . . . . . . . . . . . . . . . . . . . . . . 56,160 39,377
Deferred tax liabilities . . . . . . . . . . . . . . . . . . . . . . . . . . . . . . . 809,136 717,201
Operating loss carryforwards . . . . . . . . . . . . . . . . . . . . . . . . . . . . (40,852) (41,210)Benefit plans . . . . . . . . . . . . . . . . . . . . . . . . . . . . . . . . . . . . . . . . . (248,808) (198,011)
Depreciation/amortization . . . . . . . . . . . . . . . . . . . . . . . . . . . . . . . (69,909) (53,722)
Tax credit carryforwards . . . . . . . . . . . . . . . . . . . . . . . . . . . . . . . . (12,998) (851)
Deferred income. . . . . . . . . . . . . . . . . . . . . . . . . . . . . . . . . . . . . . . (39,942) —
Other . . . . . . . . . . . . . . . . . . . . . . . . . . . . . . . . . . . . . . . . . . . . . . . (96,618) (72,593)
Deferred tax assets . . . . . . . . . . . . . . . . . . . . . . . . . . . . . . . . . . (509,127) (366,387)
Valuation allowance . . . . . . . . . . . . . . . . . . . . . . . . . . . . . . . . . . . . 52,008 44,935
Net deferred tax liabilities . . . . . . . . . . . . . . . . . . . . . . . . . . . . $ 352,017 $ 395,749
The Company also has foreign deferred tax assets and valuation allowances of $143.0 million,each related to statutory increases in the capital tax bases of certain internally generated intangible
assets for which the probability of realization is remote.
The Company records valuation allowances to reduce deferred tax assets to the amount that ismore likely than not to be realized. When assessing the need for valuation allowances, the Company
considers future taxable income and ongoing prudent and feasible tax planning strategies. Should a
change in circumstances lead to a change in judgment about the realizability of deferred tax assets in
future years, the Company would adjust related valuation allowances in the period that the change in
circumstances occurs, along with a corresponding increase or charge to income.
52
H. J. Heinz Company and Subsidiaries
Notes to Consolidated Financial Statements — (Continued)
8/3/2019 2008HeinzAR
http://slidepdf.com/reader/full/2008heinzar 67/108
The resolution of tax reserves and changes in valuation allowances could be material to theCompany’s results of operations for any period, but is not expected to be material to the Company’sfinancial position.
The net change in the Fiscal 2008 valuation allowance shown above is an increase of $7.0 million.The increase was primarily due to the recording of additional valuation allowance for state deferredtax assets that are not expected to be utilized prior to their expiration date. The net change in theFiscal 2007 valuation allowance was an increase of $14.0 million. The increase was primarily due tothe recording of additional valuation allowance for state and foreign loss carryforwards that were notexpected to be utilized prior to their expiration date. The net change in the Fiscal 2006 valuationallowance wasa decrease of $39.3 million. The decrease was primarily due to the reversal of valuationallowances of $27.3 million in continuing operations related to the non-cash asset impairmentcharges recorded in Fiscal 2005 on cost and equity investments.
At the end of Fiscal 2008, foreign operating loss carryforwards totaled $125.2 million. Of thatamount, $70.9 million expire between 2009 and 2018; the other $54.3 million do not expire. Deferred
tax assets of $10.3 million have been recorded for state operating loss carryforwards. These lossesexpire between 2009 and 2028.
The Company adopted FIN 48 on May 3, 2007. As a result of adoption, the Company recognized a$9.3 million decrease to retained earnings and a $1.7 million decrease to additional capital from thecumulative effect of adoption.
Changes in the total amount of gross unrecognized tax benefits are as follows:
(Dollars inmillions)
Balance at May 3, 2007 . . . . . . . . . . . . . . . . . . . . . . . . . . . . . . . . . . . . . . . . . . . . $183.7
Increases for tax positions of prior years. . . . . . . . . . . . . . . . . . . . . . . . . . . . . . . 10.6
Decreases for tax positions of prior years . . . . . . . . . . . . . . . . . . . . . . . . . . . . . . (31.0)
Increases based on tax positions related to the current year . . . . . . . . . . . . . . . 9.9
Decreases due to settlements with taxing authorities . . . . . . . . . . . . . . . . . . . . (41.0)
Decreases due to lapse of statute of limitations . . . . . . . . . . . . . . . . . . . . . . . . . (3.1)
Balance at April 30, 2008 . . . . . . . . . . . . . . . . . . . . . . . . . . . . . . . . . . . . . . . . . . $129.1
The amount of unrecognized tax benefits that, if recognized, would impact the effective tax ratewas $55.7 million and $71.2 million, on April 30, 2008 and May 3, 2007, respectively.
The Company classifies interest and penalties on tax uncertainties as a component of theprovision for income taxes. For Fiscal 2008, the approximate amount of interest and penaltiesincluded in the provision for income taxes was $10.7 million and $0.6 million, respectively. The total
amount of interest and penalties accrued as of May 3, 2007 was $55.9 million and $2.2 million,respectively. The corresponding amounts of accrued interest and penalties at April 30, 2008 were$57.2 million and $2.8 million, respectively.
It is reasonably possible that the amount of unrecognized tax benefits will decrease by as muchas $24 million in the next 12 months primarily due to the progression of federal, state, and foreignaudits in process. In addition, it is also reasonably possible that during the next 12 months theCompany may reach a conclusion regarding its appeal, filed October 15, 2007, of a U.S. Court of Federal Claims decision regarding a refund claim resulting from a Fiscal 1995 transaction. Uponconclusion of the appeal, the amount of unrecognized tax benefits will decrease by approximately$43 million the benefit of which, if any, would be reflected through additional capital.
53
H. J. Heinz Company and Subsidiaries
Notes to Consolidated Financial Statements — (Continued)
8/3/2019 2008HeinzAR
http://slidepdf.com/reader/full/2008heinzar 68/108
The provision for income taxes consists of provisions for federal, state and foreign income taxes.The Company operates in an international environment with significant operations in variouslocations outside the U.S. Accordingly, the consolidated income tax rate is a composite rate reflecting
the earnings in various locations and the applicable tax rates. In the normal course of business theCompany is subject to examination by taxing authorities throughout the world, including such major jurisdictions as Canada, Italy, the United Kingdom and the United States. The Company hassubstantially concluded all U.S. federal income tax matters for years through Fiscal 2005, withthe exception of the Company’s appeal of a U.S. Court of Federal Claims decision regarding a refundclaim. In the Company’s major non-U.S. jurisdictions, the Company has substantially concluded allincome tax matters for years through Fiscal 2002.
Undistributed earnings of foreign subsidiaries considered to be indefinitely reinvestedamounted to $3.3 billion at April 30, 2008.
During the first quarter of Fiscal 2007, a foreign subsidiary of the Company revalued certain of its assets, under local law, increasing the local tax basis by approximately $245 million. As a result of
this revaluation, the Company incurred a foreign tax liability of approximately $30 million related tothis revaluation which was paid during the third quarter of Fiscal 2007. This revaluation is expectedto benefit cash flow from operations by approximately $90 million over the five to twenty year taxamortization period.
8. Debt
Short-term debt consisted of bank debt and other borrowings of $124.3million and $165.1 millionas of April 30, 2008 and May 2, 2007, respectively. The weighted average interest rate was 6.9% and5.4% for Fiscal 2008 and Fiscal 2007, respectively.
The Company maintains a $2 billion credit agreement that expires in August 2009. The creditagreement supports the Company’s commercial paper borrowings. As a result, the commercial paper
borrowings are classified as long-term debt based upon the Company’s intent and ability to refinancethese borrowings on a long-term basis. In addition, the Company has $1.1 billion of foreign lines of credit available at April 30, 2008.
54
H. J. Heinz Company and Subsidiaries
Notes to Consolidated Financial Statements — (Continued)
8/3/2019 2008HeinzAR
http://slidepdf.com/reader/full/2008heinzar 69/108
Long-term debt was comprised of the following as of April 30, 2008 and May 2, 2007:
2008 2007
(Dollars in thousands)
Commercial Paper (variable rate) . . . . . . . . . . . . . . . . . . . . . . . $1,223,367 $ 673,6046.00% U.S. Dollar Notes due March 2008 . . . . . . . . . . . . . . . . . — 299,824
6.226% Heinz Finance Preferred Stock due July 2008 . . . . . . . 325,000 325,000
6.625% U.S. Dollar Notes due July 2011 . . . . . . . . . . . . . . . . . . 749,668 749,563
6.00% U.S. Dollar Notes due March 2012 . . . . . . . . . . . . . . . . . 598,301 632,201
U.S. Dollar Remarketable Securities due December 2020 . . . . . 800,000 800,000
6.375% U.S. Dollar Debentures due July 2028 . . . . . . . . . . . . . 230,101 229,842
6.25% British Pound Notes due February 2030. . . . . . . . . . . . . 246,386 247,089
6.75% U.S. Dollar Notes due March 2032 . . . . . . . . . . . . . . . . . 449,855 449,779
Canadian Dollar Credit Agreement due October 2010 . . . . . . . 144,669 157,842
Other U.S. Dollar due May 2008—November 2034(3.00—7.97)% . . . . . . . . . . . . . . . . . . . . . . . . . . . . . . . . . . . . . 56,136 59,216
Other Non-U.S. Dollar due May 2008—March 2022(7.00—11.00)% . . . . . . . . . . . . . . . . . . . . . . . . . . . . . . . . . . . . 37,360 21,675
4,860,843 4,645,635
SFAS No. 133 Hedge Accounting Adjustments (See Note 13) . . 198,521 71,195
Less portion due within one year. . . . . . . . . . . . . . . . . . . . . . . . (328,418) (303,189)
Total long-term debt . . . . . . . . . . . . . . . . . . . . . . . . . . . . . . . . . . $4,730,946 $4,413,641
Weighted-average interest rate on long-term debt, includingthe impact of applicable interest rate swaps . . . . . . . . . . . . . 5.90% 6.14%
During the fourth quarter of Fiscal 2008, the Company paid off $300 million of notes whichmatured on March 15, 2008. During Fiscal 2008 the Company also repurchased $34.5 million of its6.0% notes due 2012 and effectively terminated the corresponding interest rate swaps.
During Fiscal 2007, the Company repurchased $3.2 million of its 6.375% notes due 2028 and$23.3 million of its 6.75% notes due 2032 and terminated the corresponding interest rate swaps.
The fair value of the debt obligations approximated the recorded value as of April 30, 2008 andMay 2, 2007. Annual maturities of long-term debt during the next five fiscal years are $328.4 millionin 2009, $1,226.5 million in 2010, $160.8 million in 2011, $1,389.7 million in 2012 and $1.3 million in2013.
As of April 30, 2008, the Company had $800 million of remarketable securities due December
2020. On December 1, 2005, the Company remarketed the $800 million remarketable securities at acoupon of 6.428% and amended the terms of the securities so that the securities will be remarketedevery third year rather than annually. The next remarketing is scheduled for December 1, 2008. If the securities are not remarketed, then the Company is required to repurchase all of the securities at100% of the principal amount plus accrued interest. The Company intends to remarket the securitiesin 2008; therefore, the debt is classified as long-term at April 30, 2008.
H.J. Heinz Finance Company’s 3,250 mandatorily redeemable preferred shares are classified aslong-term debt as a result of the adoption of SFAS No. 150. Each share of preferred stock is entitled toannual cash dividends at a rate of 6.226% or $6,226 per share. On July 15, 2008, each share will beredeemed for $100,000 in cash for a total redemption price of $325 million.
55
H. J. Heinz Company and Subsidiaries
Notes to Consolidated Financial Statements — (Continued)
8/3/2019 2008HeinzAR
http://slidepdf.com/reader/full/2008heinzar 70/108
9. Supplemental Cash Flows Information
2008 2007 2006
(Dollars in thousands)
Cash Paid During the Year For:Interest . . . . . . . . . . . . . . . . . . . . . . . . . . . . . . . . . . . $360,698 $268,781 $ 292,285
Income taxes . . . . . . . . . . . . . . . . . . . . . . . . . . . . . . . $261,283 $283,431 $ 326,370
Details of Acquisitions:
Fair value of assets . . . . . . . . . . . . . . . . . . . . . . . . . . $165,093 $108,438 $1,296,379
Liabilities* . . . . . . . . . . . . . . . . . . . . . . . . . . . . . . . . . 13,489 19,442 192,486
Cash paid . . . . . . . . . . . . . . . . . . . . . . . . . . . . . . . . . . 151,604 88,996 1,103,893
Less cash acquired . . . . . . . . . . . . . . . . . . . . . . . . . . . — — 3,457
Net cash paid for acquisitions . . . . . . . . . . . . . . . . . . $151,604 $ 88,996 $1,100,436
* Includes obligations to sellers of $11.5 million, $2.0 million and $5.7 million in 2008, 2007 and 2006,respectively.
A capital lease obligation of $51.0 million was incurred when the Company entered into a leasefor equipment during the first quarter of Fiscal 2007. This equipment was previously under anoperating lease. This non-cash transaction has been excluded from the consolidated statement of cash flows for the year ended May 2, 2007.
10. Employees’ Stock Incentive Plans and Management Incentive Plans
As of April 30, 2008, the Company had outstanding stock option awards, restricted stock unitsand restricted stock awards issued pursuant to various shareholder-approved plans and ashareholder-authorized employee stock purchase plan. The compensation cost related to these plansrecognized in general and administrative expenses, and the related tax benefit was $31.7 million and$11.1 million for the fiscal year ended April 30, 2008, respectively and $32.0 million and $11.1 millionfor the fiscal year ended May 2, 2007, respectively.
The Company has two plans from which it can issue equity based awards, the Fiscal Year 2003Stock Incentive Plan (the “2003 Plan”), which was approved by shareholders on September 12, 2002,and the 2000 Stock Option Plan (the “2000 Plan”), which was approved by shareholders onSeptember 12, 2000. The Company’s primary means for issuing equity-based awards is the 2003Plan. Pursuant to the 2003 Plan, the Management Development & Compensation Committee isauthorized to grant a maximum of 9.4 million shares for issuance as restricted stock units orrestricted stock. Any available shares may be issued as stock options. The maximum number of
shares that may be granted under this plan is 18.9 million shares. Shares issued under these plansare sourced from available treasury shares.
On May 4, 2006, the Company adoptedSFAS 123R and began recognizing the cost of all employeestock options on a straight-line basis over their respective requisite service periods (generally equalto an award’s vesting period), net of estimated forfeitures, using the modified-prospective transitionmethod. Under this transition method, Fiscal 2008 and 2007 results include stock-based compen-sation expense related to stock options granted on or prior to, but not vested as of, May 3, 2006, basedon the grant date fair value originally estimated and disclosed in a pro-forma manner in prior periodfinancial statements in accordance with the original provisions of SFAS 123. All stock-based pay-ments granted subsequent to May 3, 2006, will be expensed based on the grant date fair value
56
H. J. Heinz Company and Subsidiaries
Notes to Consolidated Financial Statements — (Continued)
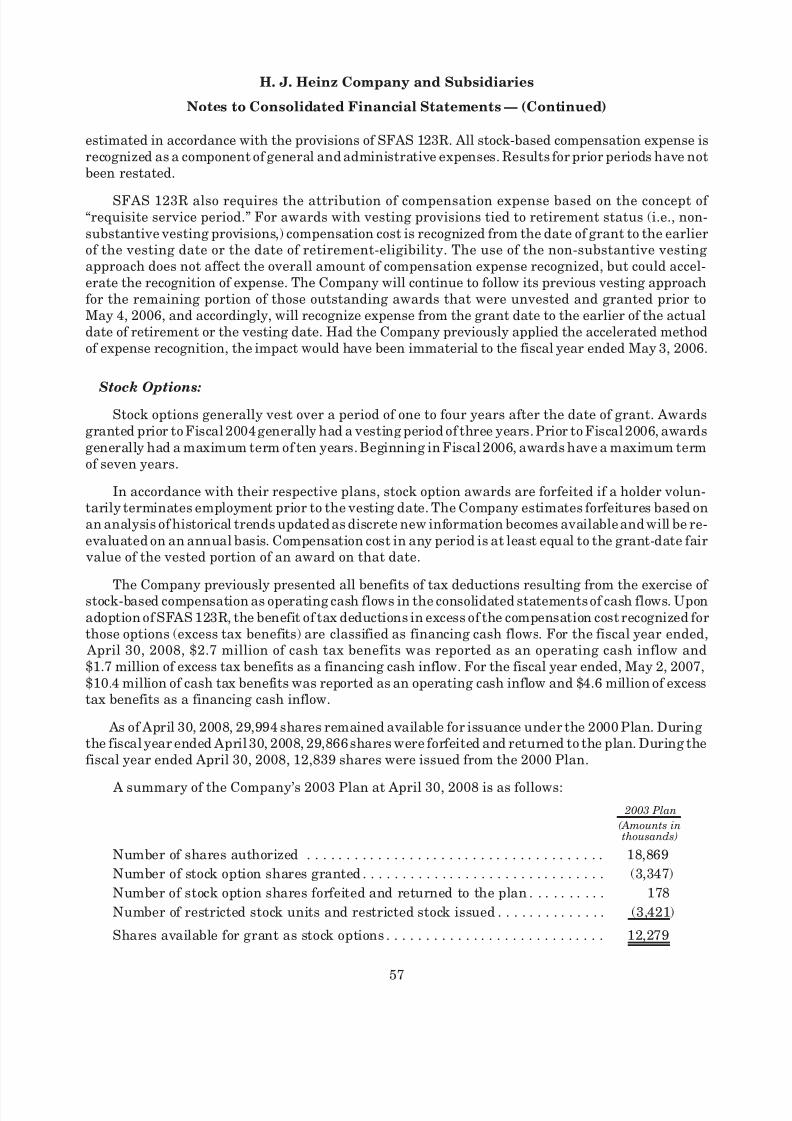
8/3/2019 2008HeinzAR
http://slidepdf.com/reader/full/2008heinzar 71/108
estimated in accordance with the provisions of SFAS 123R. All stock-based compensation expense isrecognized as a component of general and administrative expenses. Results for prior periods have notbeen restated.
SFAS 123R also requires the attribution of compensation expense based on the concept of “requisite service period.” For awards with vesting provisions tied to retirement status (i.e., non-substantive vesting provisions,) compensation cost is recognized from the date of grant to the earlierof the vesting date or the date of retirement-eligibility. The use of the non-substantive vestingapproach does not affect the overall amount of compensation expense recognized, but could accel-erate the recognition of expense. The Company will continue to follow its previous vesting approachfor the remaining portion of those outstanding awards that were unvested and granted prior toMay 4, 2006, and accordingly, will recognize expense from the grant date to the earlier of the actualdate of retirement or the vesting date. Had the Company previously applied the accelerated methodof expense recognition, the impact would have been immaterial to the fiscal year ended May 3, 2006.
Stock Options:Stock options generally vest over a period of one to four years after the date of grant. Awards
granted prior to Fiscal 2004 generally had a vesting period of three years. Prior to Fiscal 2006, awardsgenerally had a maximum term of ten years. Beginning in Fiscal 2006, awards have a maximum termof seven years.
In accordance with their respective plans, stock option awards are forfeited if a holder volun-tarily terminates employment prior to the vesting date. The Company estimates forfeitures based onan analysis of historical trends updated as discrete new information becomes available and will be re-evaluated on an annual basis. Compensation cost in any period is at least equal to the grant-date fair
value of the vested portion of an award on that date.
The Company previously presented all benefits of tax deductions resulting from the exercise of stock-based compensation as operating cash flows in the consolidated statements of cash flows. Uponadoption of SFAS 123R, the benefit of tax deductions in excess of the compensation cost recognized forthose options (excess tax benefits) are classified as financing cash flows. For the fiscal year ended,
April 30, 2008, $2.7 million of cash tax benefits was reported as an operating cash inflow and$1.7 million of excess tax benefits as a financing cash inflow. For the fiscal year ended, May 2, 2007,$10.4 million of cash tax benefits was reported as an operating cash inflow and $4.6 million of excesstax benefits as a financing cash inflow.
As of April 30, 2008, 29,994 shares remained available for issuance under the 2000 Plan. Duringthe fiscal year ended April 30, 2008, 29,866 shares were forfeited and returned to the plan. During thefiscal year ended April 30, 2008, 12,839 shares were issued from the 2000 Plan.
A summary of the Company’s 2003 Plan at April 30, 2008 is as follows: 2003 Plan
(Amounts inthousands)
Number of shares authorized . . . . . . . . . . . . . . . . . . . . . . . . . . . . . . . . . . . . . . 18,869
Number of stock option shares granted . . . . . . . . . . . . . . . . . . . . . . . . . . . . . . . (3,347)
Number of stock option shares forfeited and returned to the plan . . . . . . . . . . 178
Number of restricted stock units and restricted stock issued . . . . . . . . . . . . . . (3,421)
Shares available for grant as stock options . . . . . . . . . . . . . . . . . . . . . . . . . . . . 12,279
57
H. J. Heinz Company and Subsidiaries
Notes to Consolidated Financial Statements — (Continued)
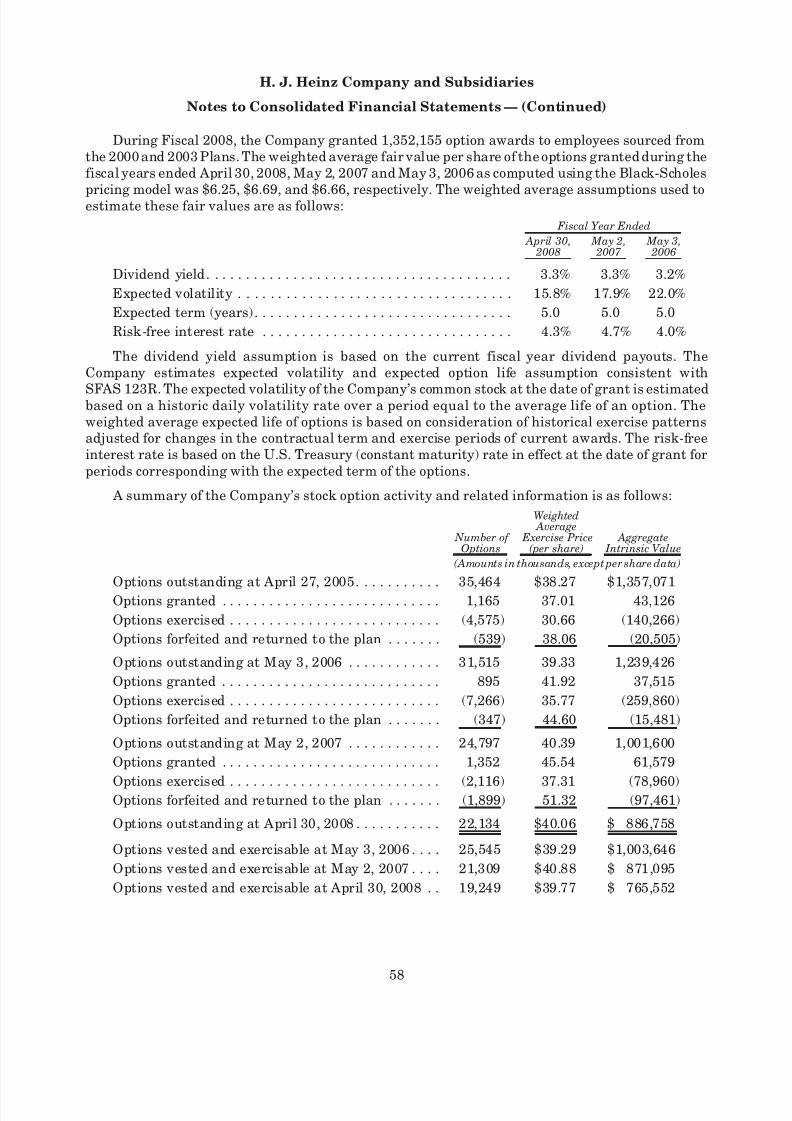
8/3/2019 2008HeinzAR
http://slidepdf.com/reader/full/2008heinzar 72/108
During Fiscal 2008, the Company granted 1,352,155 option awards to employees sourced fromthe 2000 and 2003 Plans. The weighted average fair value per share of the options granted during thefiscal years ended April 30, 2008, May 2, 2007 and May 3, 2006 as computed using the Black-Scholes
pricing model was $6.25, $6.69, and $6.66, respectively. The weighted average assumptions used toestimate these fair values are as follows:
April 30, 2008
May 2, 2007
May 3, 2006
Fiscal Year Ended
Dividend yield. . . . . . . . . . . . . . . . . . . . . . . . . . . . . . . . . . . . . . . 3.3% 3.3% 3.2%
Expected volatility . . . . . . . . . . . . . . . . . . . . . . . . . . . . . . . . . . . 15.8% 17.9% 22.0%
Expected term (years). . . . . . . . . . . . . . . . . . . . . . . . . . . . . . . . . 5.0 5.0 5.0
Risk-free interest rate . . . . . . . . . . . . . . . . . . . . . . . . . . . . . . . . 4.3% 4.7% 4.0%
The dividend yield assumption is based on the current fiscal year dividend payouts. TheCompany estimates expected volatility and expected option life assumption consistent with
SFAS 123R. The expected volatility of the Company’s common stock at the date of grant is estimatedbased on a historic daily volatility rate over a period equal to the average life of an option. Theweighted average expected life of options is based on consideration of historical exercise patternsadjusted for changes in the contractual term and exercise periods of current awards. The risk-freeinterest rate is based on the U.S. Treasury (constant maturity) rate in effect at the date of grant forperiods corresponding with the expected term of the options.
A summary of the Company’s stock option activity and related information is as follows:
Number of Options
Weighted Average
Exercise Price(per share)
Aggregate Intrinsic Value
(Amounts in thousands, except per share data)
Options outstanding at April 27, 2005. . . . . . . . . . . 35,464 $38.27 $1,357,071
Options granted . . . . . . . . . . . . . . . . . . . . . . . . . . . . 1,165 37.01 43,126
Options exercised . . . . . . . . . . . . . . . . . . . . . . . . . . . (4,575) 30.66 (140,266)
Options forfeited and returned to the plan . . . . . . . (539) 38.06 (20,505)
Options outstanding at May 3, 2006 . . . . . . . . . . . . 31,515 39.33 1,239,426
Options granted . . . . . . . . . . . . . . . . . . . . . . . . . . . . 895 41.92 37,515
Options exercised . . . . . . . . . . . . . . . . . . . . . . . . . . . (7,266) 35.77 (259,860)
Options forfeited and returned to the plan . . . . . . . (347) 44.60 (15,481)
Options outstanding at May 2, 2007 . . . . . . . . . . . . 24,797 40.39 1,001,600
Options granted . . . . . . . . . . . . . . . . . . . . . . . . . . . . 1,352 45.54 61,579
Options exercised . . . . . . . . . . . . . . . . . . . . . . . . . . . (2,116) 37.31 (78,960)Options forfeited and returned to the plan . . . . . . . (1,899) 51.32 (97,461)
Options outstanding at April 30, 2008 . . . . . . . . . . . 22,134 $40.06 $ 886,758
Options vested and exercisable at May 3, 2006 . . . . 25,545 $39.29 $1,003,646
Options vested and exercisable at May 2, 2007 . . . . 21,309 $40.88 $ 871,095
Options vested and exercisable at April 30, 2008 . . 19,249 $39.77 $ 765,552
58
H. J. Heinz Company and Subsidiaries
Notes to Consolidated Financial Statements — (Continued)
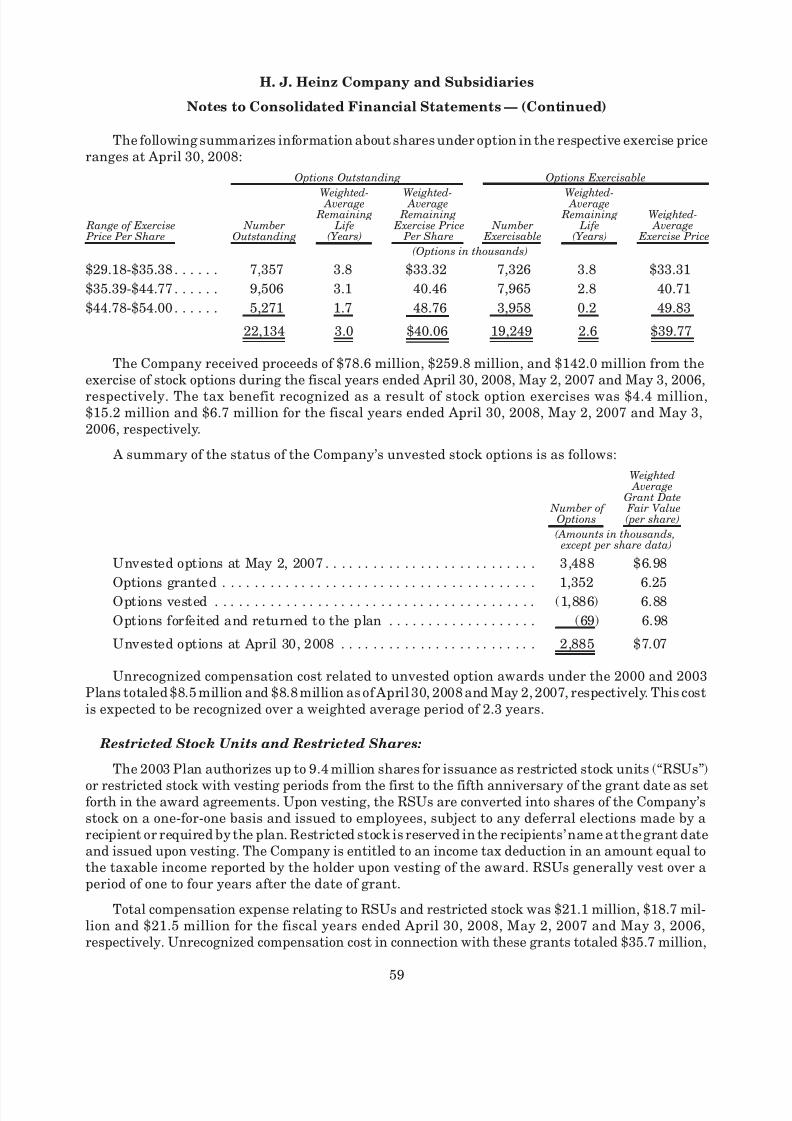
8/3/2019 2008HeinzAR
http://slidepdf.com/reader/full/2008heinzar 73/108
The following summarizes information about shares under option in the respective exercise priceranges at April 30, 2008:
Range of Exercise Price Per Share
NumberOutstanding
Weighted- Average Remaining
Life(Years)
Weighted- Average Remaining
Exercise Price Per Share
Number Exercisable
Weighted- Average Remaining
Life(Years)
Weighted- Average
Exercise Price
Options Outstanding Options Exercisable
(Options in thousands)
$29.18-$35.38 . . . . . . 7,357 3.8 $33.32 7,326 3.8 $33.31
$35.39-$44.77 . . . . . . 9,506 3.1 40.46 7,965 2.8 40.71
$44.78-$54.00 . . . . . . 5,271 1.7 48.76 3,958 0.2 49.83
22,134 3.0 $40.06 19,249 2.6 $39.77
The Company received proceeds of $78.6 million, $259.8 million, and $142.0 million from theexercise of stock options during the fiscal years ended April 30, 2008, May 2, 2007 and May 3, 2006,
respectively. The tax benefit recognized as a result of stock option exercises was $4.4 million,$15.2 million and $6.7 million for the fiscal years ended April 30, 2008, May 2, 2007 and May 3,2006, respectively.
A summary of the status of the Company’s unvested stock options is as follows:
Number of Options
Weighted Average
Grant Date Fair Value(per share)
(Amounts in thousands, except per share data)
Unvested options at May 2, 2007 . . . . . . . . . . . . . . . . . . . . . . . . . . . 3,488 $6.98
Options granted . . . . . . . . . . . . . . . . . . . . . . . . . . . . . . . . . . . . . . . . 1,352 6.25Options vested . . . . . . . . . . . . . . . . . . . . . . . . . . . . . . . . . . . . . . . . . (1,886) 6.88
Options forfeited and returned to the plan . . . . . . . . . . . . . . . . . . . (69) 6.98
Unvested options at April 30, 2008 . . . . . . . . . . . . . . . . . . . . . . . . . 2,885 $7.07
Unrecognized compensation cost related to unvested option awards under the 2000 and 2003Plans totaled $8.5 million and $8.8 million as of April 30, 2008 and May 2, 2007, respectively. This costis expected to be recognized over a weighted average period of 2.3 years.
Restricted Stock Units and Restricted Shares:
The 2003 Plan authorizes up to 9.4 million shares for issuance as restricted stock units (“RSUs”)
or restricted stock with vesting periods from the first to the fifth anniversary of the grant date as setforth in the award agreements. Upon vesting, the RSUs are converted into shares of the Company’sstock on a one-for-one basis and issued to employees, subject to any deferral elections made by arecipient or required by the plan. Restricted stock is reserved in the recipients’ name at the grant dateand issued upon vesting. The Company is entitled to an income tax deduction in an amount equal tothe taxable income reported by the holder upon vesting of the award. RSUs generally vest over aperiod of one to four years after the date of grant.
Total compensation expense relating to RSUs and restricted stock was $21.1 million, $18.7 mil-lion and $21.5 million for the fiscal years ended April 30, 2008, May 2, 2007 and May 3, 2006,respectively. Unrecognized compensation cost in connection with these grants totaled $35.7 million,
59
H. J. Heinz Company and Subsidiaries
Notes to Consolidated Financial Statements — (Continued)
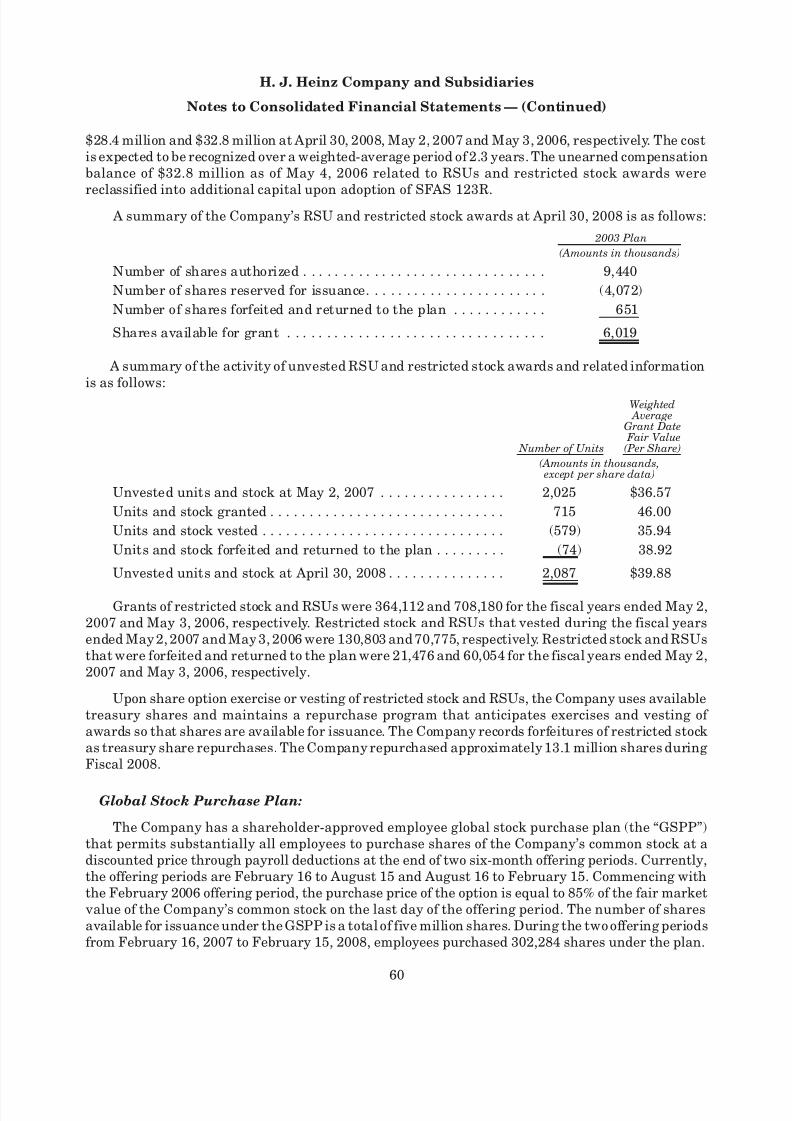
8/3/2019 2008HeinzAR
http://slidepdf.com/reader/full/2008heinzar 74/108
$28.4 million and $32.8 million at April 30, 2008, May 2, 2007 and May 3, 2006, respectively. The costis expected to be recognized over a weighted-average period of 2.3 years. The unearned compensationbalance of $32.8 million as of May 4, 2006 related to RSUs and restricted stock awards were
reclassified into additional capital upon adoption of SFAS 123R. A summary of the Company’s RSU and restricted stock awards at April 30, 2008 is as follows:
2003 Plan
(Amounts in thousands)
Number of shares authorized . . . . . . . . . . . . . . . . . . . . . . . . . . . . . . . 9,440
Number of shares reserved for issuance. . . . . . . . . . . . . . . . . . . . . . . (4,072)
Number of shares forfeited and returned to the plan . . . . . . . . . . . . 651
Shares available for grant . . . . . . . . . . . . . . . . . . . . . . . . . . . . . . . . . 6,019
A summary of the activity of unvested RSU and restricted stock awards and related informationis as follows:
Number of Units
Weighted Average
Grant Date Fair Value(Per Share)
(Amounts in thousands, except per share data)
Unvested units and stock at May 2, 2007 . . . . . . . . . . . . . . . . 2,025 $36.57
Units and stock granted . . . . . . . . . . . . . . . . . . . . . . . . . . . . . . 715 46.00
Units and stock vested . . . . . . . . . . . . . . . . . . . . . . . . . . . . . . . (579) 35.94
Units and stock forfeited and returned to the plan . . . . . . . . . (74) 38.92
Unvested units and stock at April 30, 2008 . . . . . . . . . . . . . . . 2,087 $39.88
Grants of restricted stock and RSUs were 364,112 and 708,180 for the fiscal years ended May 2,2007 and May 3, 2006, respectively. Restricted stock and RSUs that vested during the fiscal yearsended May 2, 2007 and May 3, 2006 were 130,803 and 70,775, respectively. Restricted stock and RSUsthat were forfeited and returned to the plan were 21,476 and 60,054 for the fiscal years ended May 2,2007 and May 3, 2006, respectively.
Upon share option exercise or vesting of restricted stock and RSUs, the Company uses availabletreasury shares and maintains a repurchase program that anticipates exercises and vesting of awards so that shares are available for issuance. The Company records forfeitures of restricted stockas treasury share repurchases. The Company repurchased approximately 13.1 million shares duringFiscal 2008.
Global Stock Purchase Plan:
The Company has a shareholder-approved employee global stock purchase plan (the “GSPP”)that permits substantially all employees to purchase shares of the Company’s common stock at adiscounted price through payroll deductions at the end of two six-month offering periods. Currently,the offering periods are February 16 to August 15 and August 16 to February 15. Commencing withthe February 2006 offering period, the purchase price of the option is equal to 85% of the fair market
value of the Company’s common stock on the last day of the offering period. The number of sharesavailable for issuance under the GSPP is a total of five million shares. During the two offering periodsfrom February 16, 2007 to February 15, 2008, employees purchased 302,284 shares under the plan.
60
H. J. Heinz Company and Subsidiaries
Notes to Consolidated Financial Statements — (Continued)
8/3/2019 2008HeinzAR
http://slidepdf.com/reader/full/2008heinzar 75/108
During the two offering periods from February 16, 2006 to February 15, 2007, employees purchased268,224 shares under the plan.
Annual Incentive Bonus:The Company’s management incentive plans cover officers and other key employees. Partici-
pants may elect to be paid on a current or deferred basis. The aggregate amount of all awards may notexceed certain limits in any year. Compensation under the management incentive plans wasapproximately $45 million, $41 million and $37 million in Fiscal years 2008, 2007 and 2006respectively.
Long-Term Performance Program:
In Fiscal 2008, the Company granted performance awards as permitted in the 2003 Plan, subjectto the achievement of certain performance goals. These performance awards are tied to theCompany’s relative Total Shareholder Return (“TSR”) Ranking within the defined Long-term Per-
formance Program (“LTPP”) peer group and the 2-year average after-tax Return on Invested Capital(“ROIC”) metrics. The Relative TSR metric is based on the two-year cumulative return to share-holders from the change in stock price and dividends between the starting and ending dates. Thestarting value was based on the average of each LTPP peer group Company stock price for the 60trading days prior to and including May 2, 2007. The ending value will be based on the average stockprice for the 60 trading days prior to and including the close of the Fiscal 2009 year end, plusdividends paid over the 2 year performance period. The Fiscal 2008-2009 LTPP will be fully funded if 2-year cumulative EPS equals or exceeds the predetermined level. The Company also grantedperformance awards in Fiscal 2007 under the 2007-2008 LTPP. The compensation cost related toLTPP awards recognized in general and administrative expenses (“G&A”) was $23.8 million, and therelated tax benefit was $8.1 million for the fiscal year ended April 30, 2008. The compensation costrelated to these plans, recognized in G&A was $14.2 million, and the related tax benefit was
$5.5 million for the fiscal year ended May 2, 2007.
11. Retirement Plans
The Company maintains retirement plans for the majority of its employees. Current definedbenefit plans are provided primarily for domestic union and foreign employees. Defined contributionplans are provided for the majority of its domestic non-union hourly and salaried employees as well ascertain employees in foreign locations. The Company uses an April 30 measurement date for itsdomestic plans and a March 31 measurement date for foreign plans.
61
H. J. Heinz Company and Subsidiaries
Notes to Consolidated Financial Statements — (Continued)
8/3/2019 2008HeinzAR
http://slidepdf.com/reader/full/2008heinzar 76/108
The following table sets forth the funded status of the Company’s principal defined benefit plansat April 30, 2008 and May 2, 2007.
2008 2007
(Dollars in thousands)
Change in Benefit Obligation:Benefit obligation at the beginning of the year . . . . . . . . . . . . . . . . . . . $2,794,722 $2,601,229Service cost . . . . . . . . . . . . . . . . . . . . . . . . . . . . . . . . . . . . . . . . . . . . . 39,832 42,886Interest cost. . . . . . . . . . . . . . . . . . . . . . . . . . . . . . . . . . . . . . . . . . . . . 152,073 135,984Participants’ contributions . . . . . . . . . . . . . . . . . . . . . . . . . . . . . . . . . . 13,090 10,347 Amendments . . . . . . . . . . . . . . . . . . . . . . . . . . . . . . . . . . . . . . . . . . . . 14,907 4,046 Actuarial (gain)/loss . . . . . . . . . . . . . . . . . . . . . . . . . . . . . . . . . . . . . . . (89,838) 21,301Divestitures . . . . . . . . . . . . . . . . . . . . . . . . . . . . . . . . . . . . . . . . . . . . . — (459)Settlement. . . . . . . . . . . . . . . . . . . . . . . . . . . . . . . . . . . . . . . . . . . . . . — (10,664)Special termination benefits . . . . . . . . . . . . . . . . . . . . . . . . . . . . . . . . . — 3,188Benefits paid . . . . . . . . . . . . . . . . . . . . . . . . . . . . . . . . . . . . . . . . . . . . (149,048) (143,298)Exchange/other . . . . . . . . . . . . . . . . . . . . . . . . . . . . . . . . . . . . . . . . . . 67,437 130,162
Benefit obligation at the end of the year . . . . . . . . . . . . . . . . . . . . . . $2,843,175 $2,794,722Change in Plan Assets:
Fair value of plan assets at the beginning of the year . . . . . . . . . . . . . . $2,888,780 $2,621,220 Actual (loss)/return on plan assets . . . . . . . . . . . . . . . . . . . . . . . . . . . . (79,759) 207,470Divestitures . . . . . . . . . . . . . . . . . . . . . . . . . . . . . . . . . . . . . . . . . . . . . — (172)Settlement. . . . . . . . . . . . . . . . . . . . . . . . . . . . . . . . . . . . . . . . . . . . . . — (10,664)Employer contribution . . . . . . . . . . . . . . . . . . . . . . . . . . . . . . . . . . . . . 59,799 62,505Participants’ contributions . . . . . . . . . . . . . . . . . . . . . . . . . . . . . . . . . . 13,090 10,347Benefits paid . . . . . . . . . . . . . . . . . . . . . . . . . . . . . . . . . . . . . . . . . . . . (149,048) (143,298)Exchange. . . . . . . . . . . . . . . . . . . . . . . . . . . . . . . . . . . . . . . . . . . . . . . 60,261 141,372
Fair value of plan assets at the end of the year . . . . . . . . . . . . . . . . . 2,793,123 2,888,780
Funded status . . . . . . . . . . . . . . . . . . . . . . . . . . . . . . . . . . . . . . . . . . . . . $ (50,052) $ 94,058
Amount recognized in the consolidated balance sheet consists of:Noncurrent assets . . . . . . . . . . . . . . . . . . . . . . . . . . . . . . . . . . . . . . . . . . $ 191,079 $ 284,619Current liabilities . . . . . . . . . . . . . . . . . . . . . . . . . . . . . . . . . . . . . . . . . . (19,826) (8,545)Noncurrent liabilities . . . . . . . . . . . . . . . . . . . . . . . . . . . . . . . . . . . . . . . (221,305) (182,016)
Net amount recognized . . . . . . . . . . . . . . . . . . . . . . . . . . . . . . . . . . . $ (50,052) $ 94,058
Amounts recognized in accumulated other comprehensive loss consist of:Net actuarial loss. . . . . . . . . . . . . . . . . . . . . . . . . . . . . . . . . . . . . . . . . $ 802,738 $ 633,461Prior service cost . . . . . . . . . . . . . . . . . . . . . . . . . . . . . . . . . . . . . . . . . 25,572 11,746
Net amount recognized . . . . . . . . . . . . . . . . . . . . . . . . . . . . . . . . . . . $ 828,310 $ 645,207
Amounts in accumulated other comprehensive loss expected to berecognized as components of net periodic pension costs in the followingfiscal year are as follows:Net actuarial loss. . . . . . . . . . . . . . . . . . . . . . . . . . . . . . . . . . . . . . . . . $ 36,512 $ 42,921
Prior service cost . . . . . . . . . . . . . . . . . . . . . . . . . . . . . . . . . . . . . . . . . 3,567 (1,093)Net amount recognized . . . . . . . . . . . . . . . . . . . . . . . . . . . . . . . . . . . $ 40,079 $ 41,828
The accumulated benefit obligation for all defined benefit pension plans was $2,600.2 million at April 30, 2008 and $2,561.1 million at May 2, 2007. The projected benefit obligation, accumulatedbenefit obligation and fair value of plan assets for plans with accumulated benefit obligations inexcess of plan assets were $656.7 million, $173.0 million and $430.5 million respectively, as of
April 30, 2008 and $607.4 million, $551.2 million and $437.8 million, respectively, as of May 2, 2007.The change in other comprehensive loss related to pension benefit losses arising during the period is$236.0 million at April 30, 2008. The change in other comprehensive loss related to the
62
H. J. Heinz Company and Subsidiaries
Notes to Consolidated Financial Statements — (Continued)
8/3/2019 2008HeinzAR
http://slidepdf.com/reader/full/2008heinzar 77/108
reclassification of pension benefit losses to net income is $42.1 million at April 30, 2008. The changein minimum liability included in other comprehensive loss was a decrease of $12.2 million at May 2,2007.
The weighted-average rates used for the years ended April 30, 2008 and May 2, 2007 indetermining the projected benefit obligations for defined benefit plans were as follows:
2008 2007
Discount rate . . . . . . . . . . . . . . . . . . . . . . . . . . . . . . . . . . . . . . . . . . . . . . . . . . 6.1% 5.5%
Compensation increase rate . . . . . . . . . . . . . . . . . . . . . . . . . . . . . . . . . . . . . . . 5.2% 5.0%
Total pension cost of the Company’s principal pension plans consisted of the following:
2008 2007 2006
(Dollars in thousands)
Components of defined benefit net periodic benefitcost:
Service cost . . . . . . . . . . . . . . . . . . . . . . . . . . . . . . $ 39,832 $ 42,886 $ 42,081Interest cost . . . . . . . . . . . . . . . . . . . . . . . . . . . . . . 152,073 135,984 124,064
Expected return on assets . . . . . . . . . . . . . . . . . . . (227,373) (198,470) (168,990)
Amortization of:
Net initial asset . . . . . . . . . . . . . . . . . . . . . . . . . — — (21)
Prior service cost . . . . . . . . . . . . . . . . . . . . . . . . (1,403) (3,465) 2,207
Net actuarial loss . . . . . . . . . . . . . . . . . . . . . . . . 44,121 52,302 58,869
Loss due to curtailment, settlement and specialtermination benefits . . . . . . . . . . . . . . . . . . . . . . — 2,335 18,846
Net periodic benefit cost . . . . . . . . . . . . . . . . . . . . . . 7,250 31,572 77,056
Defined contribution plans . . . . . . . . . . . . . . . . . . . . 34,027 34,940 28,139Total pension cost . . . . . . . . . . . . . . . . . . . . . . . . . . . 41,277 66,512 105,195
Less pension cost associated with discontinuedoperations . . . . . . . . . . . . . . . . . . . . . . . . . . . . . . . — — 375
Pension cost associated with continuingoperations . . . . . . . . . . . . . . . . . . . . . . . . . . . . . . . $ 41,277 $ 66,512 $ 104,820
The weighted-average rates used for the fiscal years ended April 30, 2008, May 2, 2007 andMay 3, 2006 in determining the defined benefit plans’ net pension costs were as follows:
2008 2007 2006
Expected rate of return . . . . . . . . . . . . . . . . . . . . . . . . . . . . . . . . . . . . . 8.2% 8.2% 8.2%Discount rate. . . . . . . . . . . . . . . . . . . . . . . . . . . . . . . . . . . . . . . . . . . . . 5.5% 5.3% 5.5%
Compensation increase rate . . . . . . . . . . . . . . . . . . . . . . . . . . . . . . . . . 5.0% 4.0% 4.0%
The Company’s expected rate of return is determined based on a methodology that considersinvestment real returns for certain asset classes over historic periods of various durations, inconjunction with the long-term outlook for inflation (i.e. “building block” approach). This method-ology is applied to the actual asset allocation, which is in line with the investment policy guidelinesfor each plan. The Company also considers long-term rates of return for each asset class based onprojections from consultants and investment advisers regarding the expectations of future invest-ment performance of capital markets.
63
H. J. Heinz Company and Subsidiaries
Notes to Consolidated Financial Statements — (Continued)
8/3/2019 2008HeinzAR
http://slidepdf.com/reader/full/2008heinzar 78/108
Plan Assets:
The Company’s defined benefit pension plans’ weighted average asset allocation at April 30,2008 and May 2, 2007 and weighted average target allocation were as follows:
Asset Category 2008 2007 Target
Allocation
Plan Assets at
Equity securities. . . . . . . . . . . . . . . . . . . . . . . . . . . . . . . . 65% 68% 65%
Debt securities . . . . . . . . . . . . . . . . . . . . . . . . . . . . . . . . . 32% 29% 33%
Real estate . . . . . . . . . . . . . . . . . . . . . . . . . . . . . . . . . . . . 1% 1% 1%
Other . . . . . . . . . . . . . . . . . . . . . . . . . . . . . . . . . . . . . . . 2% 2% 1%
100% 100% 100%
The underlying basis of the investment strategy of the Company’s defined benefit plans is toensure that pension funds are available to meet the plans’ benefit obligations when they are due. The
Company’s investment objectives include: prudently investing plan assets in a high-quality, diver-sified manner in order to maintain the security of the funds; achieving an optimal return on planassets within specified risk tolerances; and investing according to local regulations and requirementsspecific to each country in which a defined benefit plan operates. The investment strategy expectsequity investments to yield a higher return over the long term than fixed income securities, whilefixed income securities are expected to provide certain matching characteristics to the plans’ benefitpayment cash flow requirements. Company common stock held as part of the equity securitiesamounted to less than one percent of plan assets at April 30, 2008 and May 2, 2007.
Cash Flows:
The Company contributed approximately $60 million to the defined benefit plans in Fiscal 2008.
The Company funds its U.S. defined benefit plans in accordance with IRS regulations, while foreigndefined benefit plans are funded in accordance with local laws and regulations in each respectivecountry. Discretionary contributions to the pension funds may also be made by the Company fromtime to time. Defined benefit plan contributions for the next fiscal year are expected to be approx-imately $80 million, however actual contributions may be affected by pension asset and liability
valuations during the year.
Benefit payments expected in future years are as follows (dollars in thousands):
2009 . . . . . . . . . . . . . . . . . . . . . . . . . . . . . . . . . . . . . . . . . . . . . . . . . . . . . . . . . . . $168,750
2010 . . . . . . . . . . . . . . . . . . . . . . . . . . . . . . . . . . . . . . . . . . . . . . . . . . . . . . . . . . . $166,008
2011 . . . . . . . . . . . . . . . . . . . . . . . . . . . . . . . . . . . . . . . . . . . . . . . . . . . . . . . . . . . $168,318
2012 . . . . . . . . . . . . . . . . . . . . . . . . . . . . . . . . . . . . . . . . . . . . . . . . . . . . . . . . . . . $172,486
2013 . . . . . . . . . . . . . . . . . . . . . . . . . . . . . . . . . . . . . . . . . . . . . . . . . . . . . . . . . . . $171,284
Years 2014-2018 . . . . . . . . . . . . . . . . . . . . . . . . . . . . . . . . . . . . . . . . . . . . . . . . . $879,329
12. Postretirement Benefits Other Than Pensions and Other Post Employment
Benefits
The Company and certain of its subsidiaries provide health care and life insurance benefits forretired employees and their eligible dependents. Certain of the Company’s U.S. and Canadianemployees may become eligible for such benefits. The Company currently does not fund these benefitarrangements until claims occur and may modify plan provisions or terminate plans at its discretion.
64
H. J. Heinz Company and Subsidiaries
Notes to Consolidated Financial Statements — (Continued)
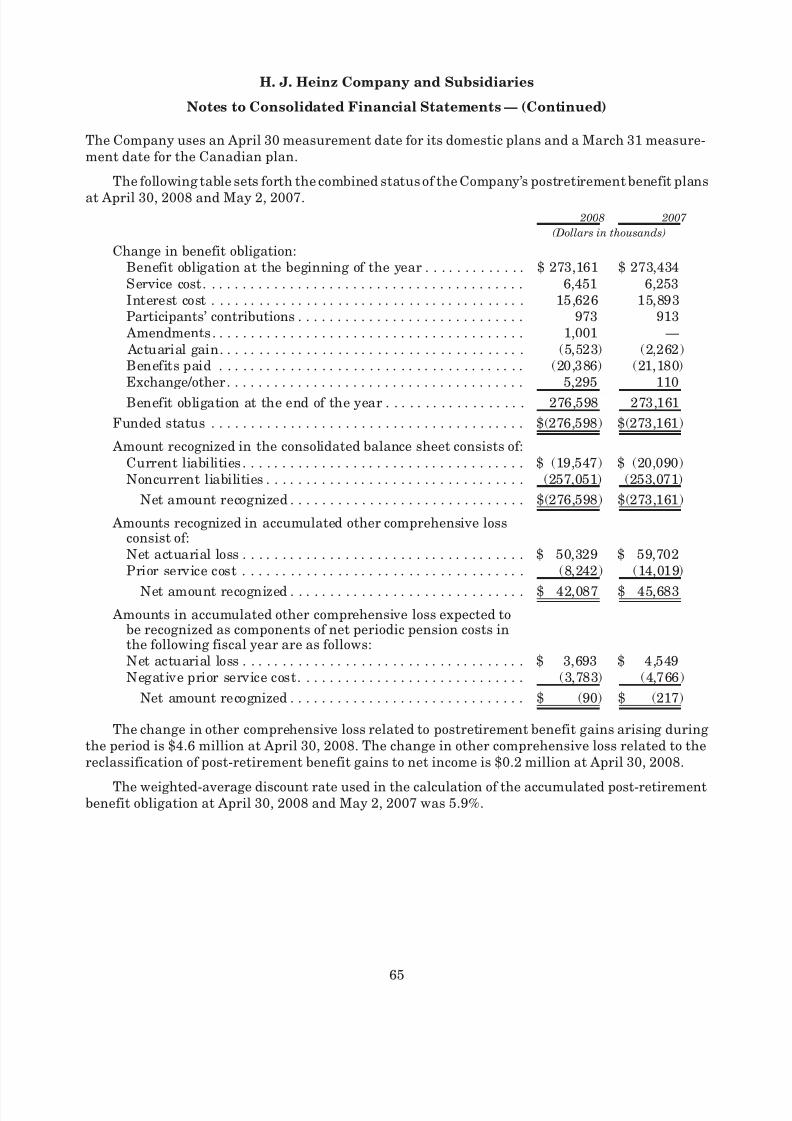
8/3/2019 2008HeinzAR
http://slidepdf.com/reader/full/2008heinzar 79/108
The Company uses an April 30 measurement date for its domestic plans and a March 31 measure-ment date for the Canadian plan.
The following table sets forth the combined status of the Company’s postretirement benefit plans
at April 30, 2008 and May 2, 2007. 2008 2007
(Dollars in thousands)
Change in benefit obligation:Benefit obligation at the beginning of the year . . . . . . . . . . . . . $ 273,161 $ 273,434Service cost. . . . . . . . . . . . . . . . . . . . . . . . . . . . . . . . . . . . . . . . . 6,451 6,253Interest cost . . . . . . . . . . . . . . . . . . . . . . . . . . . . . . . . . . . . . . . . 15,626 15,893Participants’ contributions . . . . . . . . . . . . . . . . . . . . . . . . . . . . . 973 913
Amendments. . . . . . . . . . . . . . . . . . . . . . . . . . . . . . . . . . . . . . . . 1,001 — Actuarial gain. . . . . . . . . . . . . . . . . . . . . . . . . . . . . . . . . . . . . . . (5,523) (2,262)Benefits paid . . . . . . . . . . . . . . . . . . . . . . . . . . . . . . . . . . . . . . . (20,386) (21,180)Exchange/other. . . . . . . . . . . . . . . . . . . . . . . . . . . . . . . . . . . . . . 5,295 110
Benefit obligation at the end of the year . . . . . . . . . . . . . . . . . . 276,598 273,161
Funded status . . . . . . . . . . . . . . . . . . . . . . . . . . . . . . . . . . . . . . . . $(276,598) $(273,161)
Amount recognized in the consolidated balance sheet consists of:Current liabilities . . . . . . . . . . . . . . . . . . . . . . . . . . . . . . . . . . . . $ (19,547) $ (20,090)Noncurrent liabilities . . . . . . . . . . . . . . . . . . . . . . . . . . . . . . . . . (257,051) (253,071)
Net amount recognized . . . . . . . . . . . . . . . . . . . . . . . . . . . . . . $(276,598) $(273,161)
Amounts recognized in accumulated other comprehensive lossconsist of:Net actuarial loss . . . . . . . . . . . . . . . . . . . . . . . . . . . . . . . . . . . . $ 50,329 $ 59,702Prior service cost . . . . . . . . . . . . . . . . . . . . . . . . . . . . . . . . . . . . (8,242) (14,019)
Net amount recognized . . . . . . . . . . . . . . . . . . . . . . . . . . . . . . $ 42,087 $ 45,683
Amounts in accumulated other comprehensive loss expected tobe recognized as components of net periodic pension costs inthe following fiscal year are as follows:Net actuarial loss . . . . . . . . . . . . . . . . . . . . . . . . . . . . . . . . . . . . $ 3,693 $ 4,549Negative prior service cost. . . . . . . . . . . . . . . . . . . . . . . . . . . . . (3,783) (4,766)
Net amount recognized . . . . . . . . . . . . . . . . . . . . . . . . . . . . . . $ (90) $ (217)
The change in other comprehensive loss related to postretirement benefit gains arising duringthe period is $4.6 million at April 30, 2008. The change in other comprehensive loss related to thereclassification of post-retirement benefit gains to net income is $0.2 million at April 30, 2008.
The weighted-average discount rate used in the calculation of the accumulated post-retirementbenefit obligation at April 30, 2008 and May 2, 2007 was 5.9%.
65
H. J. Heinz Company and Subsidiaries
Notes to Consolidated Financial Statements — (Continued)
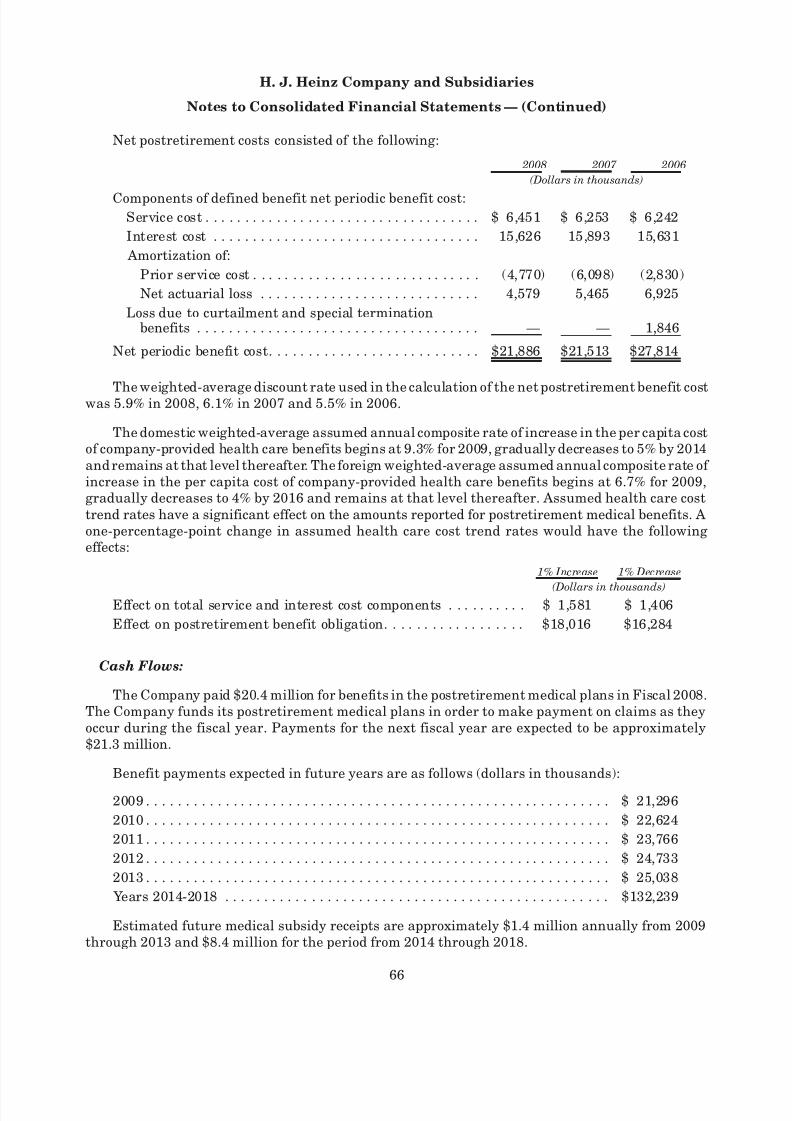
8/3/2019 2008HeinzAR
http://slidepdf.com/reader/full/2008heinzar 80/108
Net postretirement costs consisted of the following:
2008 2007 2006
(Dollars in thousands)
Components of defined benefit net periodic benefit cost:Service cost . . . . . . . . . . . . . . . . . . . . . . . . . . . . . . . . . . . $ 6,451 $ 6,253 $ 6,242
Interest cost . . . . . . . . . . . . . . . . . . . . . . . . . . . . . . . . . . 15,626 15,893 15,631
Amortization of:
Prior service cost . . . . . . . . . . . . . . . . . . . . . . . . . . . . . (4,770) (6,098) (2,830)
Net actuarial loss . . . . . . . . . . . . . . . . . . . . . . . . . . . . 4,579 5,465 6,925
Loss due to curtailment and special terminationbenefits . . . . . . . . . . . . . . . . . . . . . . . . . . . . . . . . . . . . — — 1,846
Net periodic benefit cost. . . . . . . . . . . . . . . . . . . . . . . . . . . $21,886 $21,513 $27,814
The weighted-average discount rate used in the calculation of the net postretirement benefit costwas 5.9% in 2008, 6.1% in 2007 and 5.5% in 2006.
The domestic weighted-average assumed annual composite rate of increase in the per capita costof company-provided health care benefits begins at 9.3% for 2009, gradually decreases to 5% by 2014and remains at that level thereafter. The foreign weighted-average assumed annual composite rate of increase in the per capita cost of company-provided health care benefits begins at 6.7% for 2009,gradually decreases to 4% by 2016 and remains at that level thereafter. Assumed health care costtrend rates have a significant effect on the amounts reported for postretirement medical benefits. Aone-percentage-point change in assumed health care cost trend rates would have the followingeffects:
1% Increase 1% Decrease
(Dollars in thousands)Effect on total service and interest cost components . . . . . . . . . . $ 1,581 $ 1,406
Effect on postretirement benefit obligation. . . . . . . . . . . . . . . . . . $18,016 $16,284
Cash Flows:
The Company paid $20.4 million for benefits in the postretirement medical plans in Fiscal 2008.The Company funds its postretirement medical plans in order to make payment on claims as theyoccur during the fiscal year. Payments for the next fiscal year are expected to be approximately$21.3 million.
Benefit payments expected in future years are as follows (dollars in thousands):
2009 . . . . . . . . . . . . . . . . . . . . . . . . . . . . . . . . . . . . . . . . . . . . . . . . . . . . . . . . . . . $ 21,296
2010 . . . . . . . . . . . . . . . . . . . . . . . . . . . . . . . . . . . . . . . . . . . . . . . . . . . . . . . . . . . $ 22,624
2011 . . . . . . . . . . . . . . . . . . . . . . . . . . . . . . . . . . . . . . . . . . . . . . . . . . . . . . . . . . . $ 23,766
2012 . . . . . . . . . . . . . . . . . . . . . . . . . . . . . . . . . . . . . . . . . . . . . . . . . . . . . . . . . . . $ 24,733
2013 . . . . . . . . . . . . . . . . . . . . . . . . . . . . . . . . . . . . . . . . . . . . . . . . . . . . . . . . . . . $ 25,038
Years 2014-2018 . . . . . . . . . . . . . . . . . . . . . . . . . . . . . . . . . . . . . . . . . . . . . . . . . $132,239
Estimated future medical subsidy receipts are approximately $1.4 million annually from 2009through 2013 and $8.4 million for the period from 2014 through 2018.
66
H. J. Heinz Company and Subsidiaries
Notes to Consolidated Financial Statements — (Continued)
8/3/2019 2008HeinzAR
http://slidepdf.com/reader/full/2008heinzar 81/108
13. Derivative Financial Instruments and Hedging Activities
The Company operates internationally, with manufacturing and sales facilities in variouslocations around the world, and utilizes certain derivative financial instruments to manage its
foreign currency, debt and interest rate exposures.
At April 30, 2008, the Company had outstanding currency exchange and interest rate derivativecontracts with notional amounts of $1.71 billion and $1.82 billion, respectively. At May 2, 2007, theCompany had outstanding currency exchange and interest rate derivative contracts with notionalamounts of $3.47 billion and $2.70 billion, respectively. The fair value of derivative financialinstruments was a net asset of $126.0 million at April 30, 2008, and a net liability of $2.0 millionat May 2, 2007.
Foreign Currency Hedging:
The Company uses forward contracts and to a lesser extent, option contracts to mitigate itsforeign currency exchange rate exposure due to forecasted purchases of raw materials and sales of finished goods, and future settlement of foreign currency denominated assets and liabilities. Deriv-atives used to hedge forecasted transactions and specific cash flows associated with foreign currencydenominated financial assets and liabilities that meet the criteria for hedge accounting are desig-nated as cash flow hedges. Consequently, the effective portion of gains and losses is deferred as acomponent of accumulated other comprehensive loss and is recognized in earnings at the time thehedged item affects earnings, in the same line item as the underlying hedged item.
The Company had outstanding cross currency swaps with a total notional amount of $1.96 billionas of May 2, 2007, which were designated as net investment hedges of foreign operations. DuringFiscal 2008, the Company made cash payments to the counterparties totaling $74.5 million as aresult of contract maturities and $93.2 million as a result of early termination of contracts. As of
April 30, 2008 there are no outstanding cross currency swaps. The Company assessed hedge
effectiveness for these contracts based on changes in fair value attributable to changes in spotprices. Net losses of $95.8 million ($72.0 million after-tax) and $72.9 million ($43.9 million after-tax)which represented effective hedges of net investments, were reported as a component of accumulatedother comprehensive loss within unrealized translation adjustment for Fiscal 2008 and Fiscal 2007,respectively. Gains of $3.6 million and $15.9 million, which represented the changes in fair valueexcluded from the assessment of hedge effectiveness, were included in current period earnings as acomponent of interest expense for Fiscal 2008 and Fiscal 2007, respectively.
The early termination of the net investment hedges described above and interest rate swapsdescribed below were completed in conjunction with the reorganizations of the Company’s foreignoperations and interest rate swap portfolio.
Interest Rate Hedging:
The Company uses interest rate swaps to manage debt and interest rate exposures. Derivativesused to hedge risk associated with changes in the fair value of certain fixed-rate debt obligations areprimarily designated as fair value hedges. Consequently, changes in the fair value of these deriv-atives, along with changes in the fair value of the hedged debt obligations that are attributable to thehedged risk, are recognized in current period earnings. During Fiscal 2008, the Company terminatedcertain interest rate swaps that were previously designated as fair value hedges of fixed rate debtobligations. The notional amount of these interest rate contracts totaled $612.0 million and theCompany received a total of $103.5 million of cash from the termination of these contracts. The$103.5 million gain is being amortized to reduce interest expense over the remaining term of the
67
H. J. Heinz Company and Subsidiaries
Notes to Consolidated Financial Statements — (Continued)
8/3/2019 2008HeinzAR
http://slidepdf.com/reader/full/2008heinzar 82/108
corresponding debt obligations (average of 22 years). SFAS No. 133 hedge accounting adjustmentsrelated to hedged debt obligations totaled $198.5 million and $71.2 million as of April 30, 2008 andMay 2, 2007, respectively.
Hedge Ineffectiveness:
Hedge ineffectiveness related to cash flow hedges, which is reported in current period earningsas other income and expense, was not significant for the years ended April 30, 2008, May 2, 2007 andMay 3, 2006. The Company excludes the time value component of option contracts from theassessment of hedge effectiveness.
Deferred Hedging Gains and Losses:
As of April 30, 2008, the Company is hedging forecasted transactions for periods not exceedingtwo years. During the next 12 months, the Company expects $8.7 million of net deferred gainsreported in accumulated other comprehensive loss to be reclassified to earnings, assuming market
rates remain constant through contract maturities. Amounts reclassified to earnings because thehedge transaction was no longer expected to occur were not significant for the years ended April 30,2008, May 2, 2007 and May 3, 2006.
Other Activities:
The Company enters into certain derivative contracts in accordance with its risk managementstrategy that do not meet the criteria for hedge accounting. Although these derivatives do not qualifyas hedges, they have the economic impact of largely mitigating foreign currency or interest rateexposures. These derivative financial instruments are accounted for on a full mark-to-market basisthrough current earnings even though they were not acquired for trading purposes.
Concentration of Credit Risk:
Counterparties to currency exchange and interest rate derivatives consist of major internationalfinancial institutions. The Company continually monitors its positions and the credit ratings of thecounterparties involved and, by policy, limits the amount of credit exposure to any one party. Whilethe Company may be exposed to potential losses due to the credit risk of non-performance by thesecounterparties, losses are not anticipated. During Fiscal 2008, one customer represented 10.4% of theCompany’s sales. The Company closely monitors the credit risk associated with its customers and todate has not experienced material losses.
68
H. J. Heinz Company and Subsidiaries
Notes to Consolidated Financial Statements — (Continued)
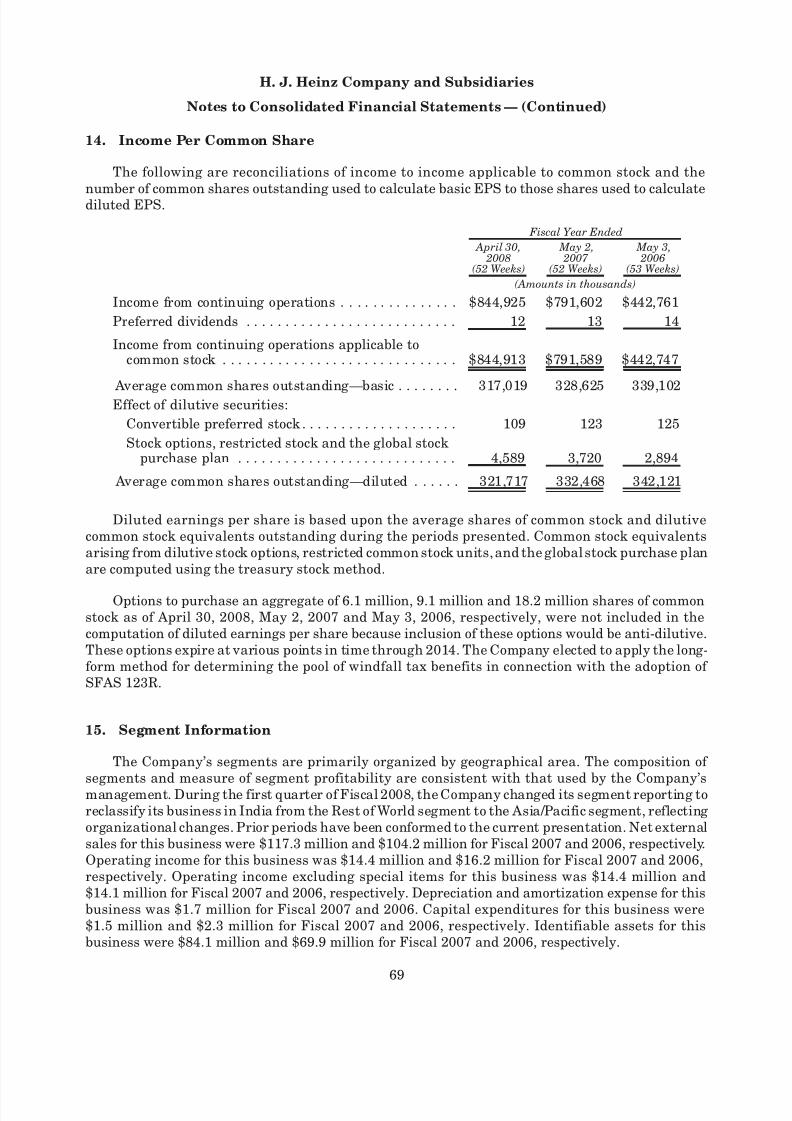
8/3/2019 2008HeinzAR
http://slidepdf.com/reader/full/2008heinzar 83/108
14. Income Per Common Share
The following are reconciliations of income to income applicable to common stock and thenumber of common shares outstanding used to calculate basic EPS to those shares used to calculatediluted EPS.
April 30, 2008
(52 Weeks)
May 2, 2007
(52 Weeks)
May 3, 2006
(53 Weeks)
Fiscal Year Ended
(Amounts in thousands)
Income from continuing operations . . . . . . . . . . . . . . . $844,925 $791,602 $442,761
Preferred dividends . . . . . . . . . . . . . . . . . . . . . . . . . . . 12 13 14
Income from continuing operations applicable tocommon stock . . . . . . . . . . . . . . . . . . . . . . . . . . . . . . $844,913 $791,589 $442,747
Average common shares outstanding—basic . . . . . . . . 317,019 328,625 339,102Effect of dilutive securities:
Convertible preferred stock . . . . . . . . . . . . . . . . . . . . 109 123 125
Stock options, restricted stock and the global stockpurchase plan . . . . . . . . . . . . . . . . . . . . . . . . . . . . 4,589 3,720 2,894
Average common shares outstanding—diluted . . . . . . 321,717 332,468 342,121
Diluted earnings per share is based upon the average shares of common stock and dilutivecommon stock equivalents outstanding during the periods presented. Common stock equivalentsarising from dilutive stock options, restricted common stock units, and the global stock purchase planare computed using the treasury stock method.
Options to purchase an aggregate of 6.1 million, 9.1 million and 18.2 million shares of commonstock as of April 30, 2008, May 2, 2007 and May 3, 2006, respectively, were not included in thecomputation of diluted earnings per share because inclusion of these options would be anti-dilutive.These options expire at various points in time through 2014. The Company elected to apply the long-form method for determining the pool of windfall tax benefits in connection with the adoption of SFAS 123R.
15. Segment Information
The Company’s segments are primarily organized by geographical area. The composition of segments and measure of segment profitability are consistent with that used by the Company’smanagement. During the first quarter of Fiscal 2008, the Company changed its segment reporting toreclassify its business in India from the Rest of World segment to the Asia/Pacific segment, reflectingorganizational changes. Prior periods have been conformed to the current presentation. Net externalsales for this business were $117.3 million and $104.2 million for Fiscal 2007 and 2006, respectively.Operating income for this business was $14.4 million and $16.2 million for Fiscal 2007 and 2006,respectively. Operating income excluding special items for this business was $14.4 million and$14.1 million for Fiscal 2007 and 2006, respectively. Depreciation and amortization expense for thisbusiness was $1.7 million for Fiscal 2007 and 2006. Capital expenditures for this business were$1.5 million and $2.3 million for Fiscal 2007 and 2006, respectively. Identifiable assets for thisbusiness were $84.1 million and $69.9 million for Fiscal 2007 and 2006, respectively.
69
H. J. Heinz Company and Subsidiaries
Notes to Consolidated Financial Statements — (Continued)
8/3/2019 2008HeinzAR
http://slidepdf.com/reader/full/2008heinzar 84/108
Descriptions of the Company’s reportable segments are as follows:
• North American Consumer Products—This segment primarily manufactures, marketsand sells ketchup, condiments, sauces, pasta meals, and frozen potatoes, entrees, snacks, and
appetizers to the grocery channels in the United States of America and includes our Canadianbusiness.
• Europe—This segment includes the Company’s operations in Europe, including EasternEurope and Russia, and sells products in all of the Company’s categories.
• Asia/Pacific—This segment includes the Company’s operations in New Zealand, Australia,India, Japan, China, South Korea, Indonesia, and Singapore. This segment’s operationsinclude products in all of the Company’s categories.
• U.S. Foodservice—This segment primarily manufactures, markets and sells branded andcustomized products to commercial and non-commercial food outlets and distributors in theUnited States of America including ketchup, condiments, sauces, and frozen soups, desserts
and appetizers.• Rest of World—This segment includes the Company’s operations in Africa, Latin America,
and the Middle East that sell products in all of the Company’s categories.
The Company’s management evaluates performance based on several factors including netsales, operating income, operating income excluding special items, and the use of capital resources.Intersegment revenues and items below the operating income line of the consolidated statements of income are not presented by segment, since they are excluded from the measure of segmentprofitability reviewed by the Company’s management.
70
H. J. Heinz Company and Subsidiaries
Notes to Consolidated Financial Statements — (Continued)
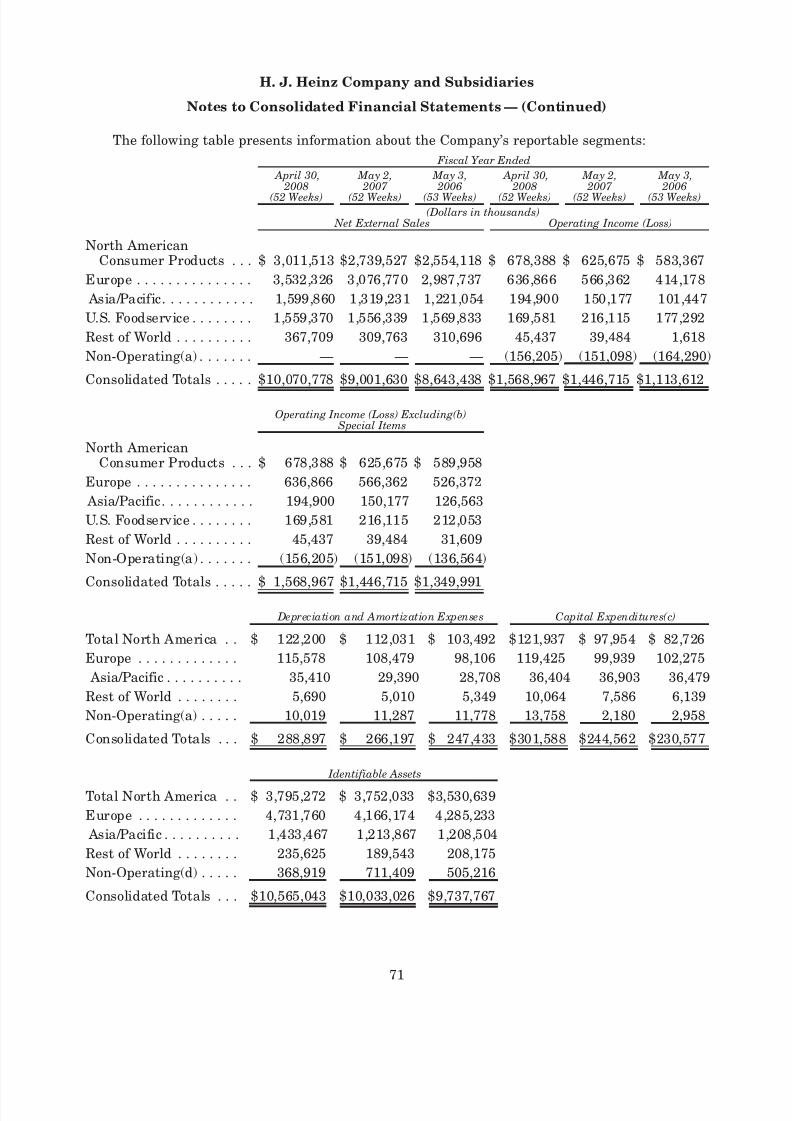
8/3/2019 2008HeinzAR
http://slidepdf.com/reader/full/2008heinzar 85/108
The following table presents information about the Company’s reportable segments:
April 30, 2008
(52 Weeks)
May 2, 2007
(52 Weeks)
May 3, 2006
(53 Weeks)
April 30, 2008
(52 Weeks)
May 2, 2007
(52 Weeks)
May 3, 2006
(53 Weeks)
Fiscal Year Ended
(Dollars in thousands) Net External Sales Operating Income (Loss)
North AmericanConsumer Products . . . $ 3,011,513 $2,739,527 $2,554,118 $ 678,388 $ 625,675 $ 583,367
Europe . . . . . . . . . . . . . . . 3,532,326 3,076,770 2,987,737 636,866 566,362 414,178
Asia/Pacific. . . . . . . . . . . . 1,599,860 1,319,231 1,221,054 194,900 150,177 101,447
U.S. Foodservice . . . . . . . . 1,559,370 1,556,339 1,569,833 169,581 216,115 177,292
Rest of World . . . . . . . . . . 367,709 309,763 310,696 45,437 39,484 1,618
Non-Operating(a) . . . . . . . — — — (156,205) (151,098) (164,290)
Consolidated Totals . . . . . $10,070,778 $9,001,630 $8,643,438 $1,568,967 $1,446,715 $1,113,612
Operating Income (Loss) Excluding(b) Special Items
North AmericanConsumer Products . . . $ 678,388 $ 625,675 $ 589,958
Europe . . . . . . . . . . . . . . . 636,866 566,362 526,372
Asia/Pacific. . . . . . . . . . . . 194,900 150,177 126,563
U.S. Foodservice . . . . . . . . 169,581 216,115 212,053
Rest of World . . . . . . . . . . 45,437 39,484 31,609
Non-Operating(a) . . . . . . . (156,205) (151,098) (136,564)
Consolidated Totals . . . . . $ 1,568,967 $1,446,715 $1,349,991
Depreciation and Amortization Expenses Capital Expenditures(c)
Total North America . . $ 122,200 $ 112,031 $ 103,492 $121,937 $ 97,954 $ 82,726
Europe . . . . . . . . . . . . . 115,578 108,479 98,106 119,425 99,939 102,275
Asia/Pacific . . . . . . . . . . 35,410 29,390 28,708 36,404 36,903 36,479
Rest of World . . . . . . . . 5,690 5,010 5,349 10,064 7,586 6,139
Non-Operating(a) . . . . . 10,019 11,287 11,778 13,758 2,180 2,958
Consolidated Totals . . . $ 288,897 $ 266,197 $ 247,433 $301,588 $244,562 $230,577
Identifiable Assets
Total North America . . $ 3,795,272 $ 3,752,033 $3,530,639
Europe . . . . . . . . . . . . . 4,731,760 4,166,174 4,285,233
Asia/Pacific . . . . . . . . . . 1,433,467 1,213,867 1,208,504
Rest of World . . . . . . . . 235,625 189,543 208,175
Non-Operating(d) . . . . . 368,919 711,409 505,216
Consolidated Totals . . . $10,565,043 $10,033,026 $9,737,767
71
H. J. Heinz Company and Subsidiaries
Notes to Consolidated Financial Statements — (Continued)
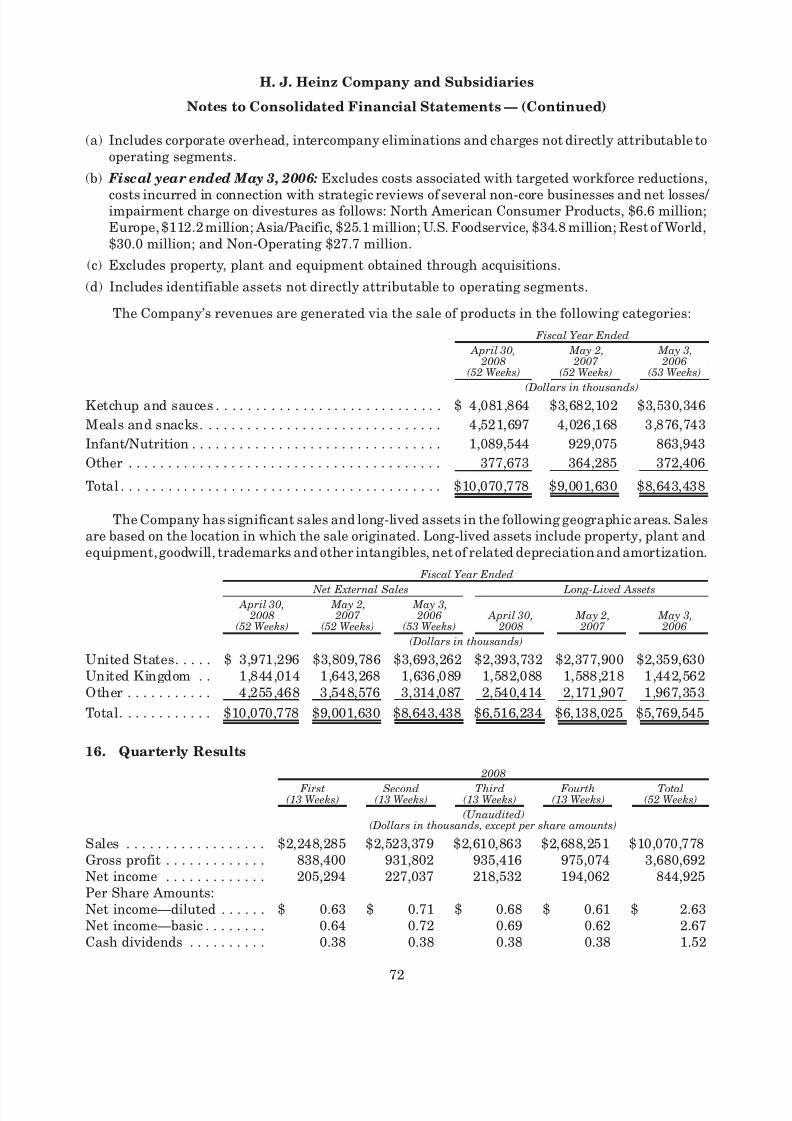
8/3/2019 2008HeinzAR
http://slidepdf.com/reader/full/2008heinzar 86/108
(a) Includes corporate overhead, intercompany eliminations and charges not directly attributable tooperating segments.
(b) Fiscal year ended May 3, 2006: Excludes costs associated with targeted workforce reductions,
costs incurred in connection with strategic reviews of several non-core businesses and net losses/ impairment charge on divestures as follows: North American Consumer Products, $6.6 million;Europe, $112.2 million; Asia/Pacific, $25.1 million; U.S. Foodservice, $34.8 million; Rest of World,$30.0 million; and Non-Operating $27.7 million.
(c) Excludes property, plant and equipment obtained through acquisitions.
(d) Includes identifiable assets not directly attributable to operating segments.
The Company’s revenues are generated via the sale of products in the following categories:
April 30, 2008
(52 Weeks)
May 2, 2007
(52 Weeks)
May 3, 2006
(53 Weeks)
Fiscal Year Ended
(Dollars in thousands)Ketchup and sauces . . . . . . . . . . . . . . . . . . . . . . . . . . . . . $ 4,081,864 $3,682,102 $3,530,346
Meals and snacks. . . . . . . . . . . . . . . . . . . . . . . . . . . . . . . 4,521,697 4,026,168 3,876,743
Infant/Nutrition . . . . . . . . . . . . . . . . . . . . . . . . . . . . . . . . 1,089,544 929,075 863,943
Other . . . . . . . . . . . . . . . . . . . . . . . . . . . . . . . . . . . . . . . . 377,673 364,285 372,406
Total . . . . . . . . . . . . . . . . . . . . . . . . . . . . . . . . . . . . . . . . . $10,070,778 $9,001,630 $8,643,438
The Company has significant sales and long-lived assets in the following geographic areas. Salesare based on the location in which the sale originated. Long-lived assets include property, plant andequipment, goodwill, trademarks and other intangibles, net of related depreciation and amortization.
April 30, 2008
(52 Weeks)
May 2, 2007
(52 Weeks)
May 3, 2006
(53 Weeks) April 30,
2008 May 2,
2007 May 3,
2006
Net External Sales Long-Lived Assets
Fiscal Year Ended
(Dollars in thousands)
United States. . . . . $ 3,971,296 $3,809,786 $3,693,262 $2,393,732 $2,377,900 $2,359,630United Kingdom . . 1,844,014 1,643,268 1,636,089 1,582,088 1,588,218 1,442,562Other . . . . . . . . . . . 4,255,468 3,548,576 3,314,087 2,540,414 2,171,907 1,967,353
Total. . . . . . . . . . . . $10,070,778 $9,001,630 $8,643,438 $6,516,234 $6,138,025 $5,769,545
16. Quarterly Results
First(13 Weeks)
Second(13 Weeks)
Third(13 Weeks)
Fourth(13 Weeks)
Total(52 Weeks)
2008
(Unaudited)(Dollars in thousands, except per share amounts)
Sales . . . . . . . . . . . . . . . . . . $2,248,285 $2,523,379 $2,610,863 $2,688,251 $10,070,778Gross profit . . . . . . . . . . . . . 838,400 931,802 935,416 975,074 3,680,692Net income . . . . . . . . . . . . . 205,294 227,037 218,532 194,062 844,925Per Share Amounts:Net income—diluted . . . . . . $ 0.63 $ 0.71 $ 0.68 $ 0.61 $ 2.63Net income—basic . . . . . . . . 0.64 0.72 0.69 0.62 2.67Cash dividends . . . . . . . . . . 0.38 0.38 0.38 0.38 1.52
72
H. J. Heinz Company and Subsidiaries
Notes to Consolidated Financial Statements — (Continued)
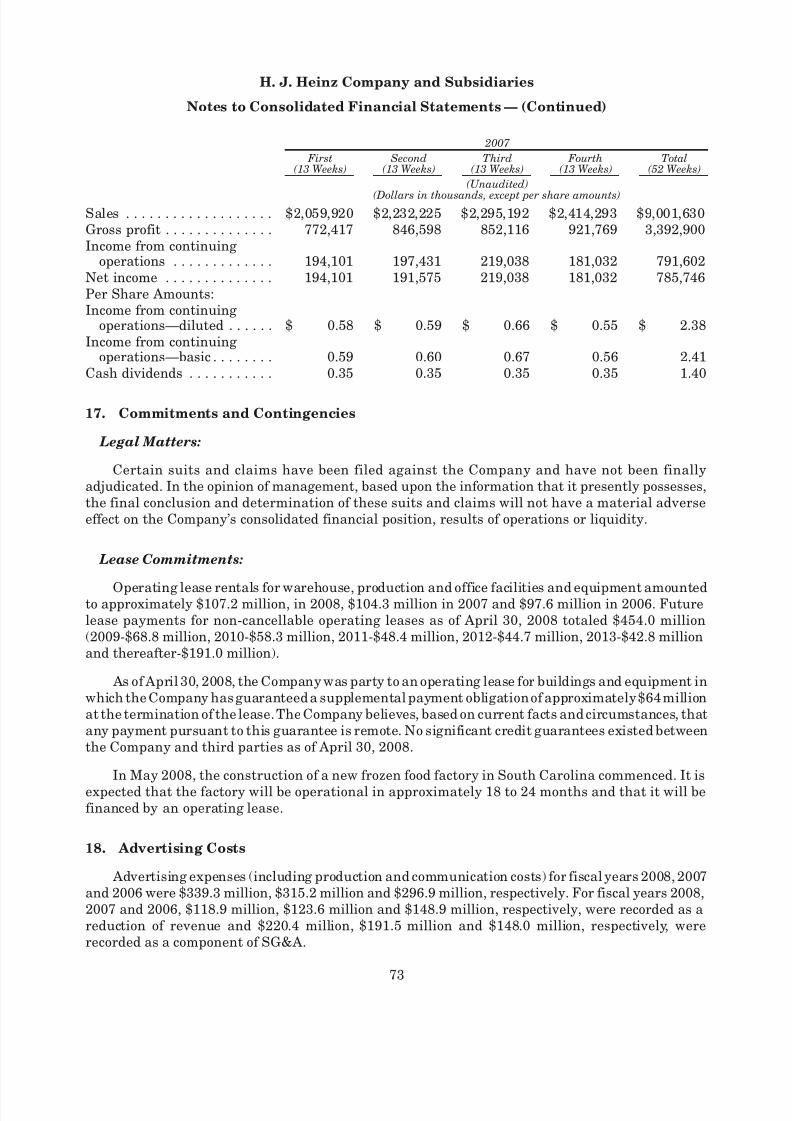
8/3/2019 2008HeinzAR
http://slidepdf.com/reader/full/2008heinzar 87/108
First(13 Weeks)
Second(13 Weeks)
Third(13 Weeks)
Fourth(13 Weeks)
Total(52 Weeks)
2007
(Unaudited)
(Dollars in thousands, except per share amounts)
Sales . . . . . . . . . . . . . . . . . . . $2,059,920 $2,232,225 $2,295,192 $2,414,293 $9,001,630Gross profit . . . . . . . . . . . . . . 772,417 846,598 852,116 921,769 3,392,900Income from continuing
operations . . . . . . . . . . . . . 194,101 197,431 219,038 181,032 791,602Net income . . . . . . . . . . . . . . 194,101 191,575 219,038 181,032 785,746Per Share Amounts:Income from continuing
operations—diluted . . . . . . $ 0.58 $ 0.59 $ 0.66 $ 0.55 $ 2.38Income from continuing
operations—basic . . . . . . . . 0.59 0.60 0.67 0.56 2.41Cash dividends . . . . . . . . . . . 0.35 0.35 0.35 0.35 1.40
17. Commitments and Contingencies
Legal Matters:
Certain suits and claims have been filed against the Company and have not been finallyadjudicated. In the opinion of management, based upon the information that it presently possesses,the final conclusion and determination of these suits and claims will not have a material adverseeffect on the Company’s consolidated financial position, results of operations or liquidity.
Lease Commitments:
Operating lease rentals for warehouse, production and office facilities and equipment amountedto approximately $107.2 million, in 2008, $104.3 million in 2007 and $97.6 million in 2006. Futurelease payments for non-cancellable operating leases as of April 30, 2008 totaled $454.0 million(2009-$68.8 million, 2010-$58.3 million, 2011-$48.4 million, 2012-$44.7 million, 2013-$42.8 millionand thereafter-$191.0 million).
As of April 30, 2008, the Company was party to an operating lease for buildings and equipment inwhich the Company has guaranteed a supplemental payment obligation of approximately$64 millionat the termination of the lease. The Company believes, based on current facts and circumstances, thatany payment pursuant to this guarantee is remote. No significant credit guarantees existed betweenthe Company and third parties as of April 30, 2008.
In May 2008, the construction of a new frozen food factory in South Carolina commenced. It isexpected that the factory will be operational in approximately 18 to 24 months and that it will befinanced by an operating lease.
18. Advertising Costs
Advertising expenses (including production and communication costs) for fiscal years 2008, 2007and 2006 were $339.3 million, $315.2 million and $296.9 million, respectively. For fiscal years 2008,2007 and 2006, $118.9 million, $123.6 million and $148.9 million, respectively, were recorded as areduction of revenue and $220.4 million, $191.5 million and $148.0 million, respectively, wererecorded as a component of SG&A.
73
H. J. Heinz Company and Subsidiaries
Notes to Consolidated Financial Statements — (Continued)
8/3/2019 2008HeinzAR
http://slidepdf.com/reader/full/2008heinzar 88/108
Item 9. Changes in and Disagreements with Accountants on Accounting and Finan-
cial Disclosure.
There is nothing to be reported under this item.
Item 9A. Controls and Procedures.
(a) Evaluation of Disclosure Controls and Procedures
The Company’s management, with the participation of the Company’s Chief Executive Officerand Chief Financial Officer, evaluated the effectiveness of the Company’s disclosure controls andprocedures as of the end of the period covered by this report. Based on that evaluation, the Chief Executive Officer and Chief Financial Officer concluded that the Company’s disclosure controls andprocedures, as of the end of the period covered by this report, were effective and provided reasonableassurance that the information required to be disclosed by the Company in reports filed under theSecurities Exchange Act of 1934 is (i) recorded, processed, summarized and reported within the timeperiods specified in the SEC’s rules and forms, and (ii) accumulated and communicated to ourmanagement, including the Chief Executive Officer and Chief Financial Officer, as appropriate toallow timely decisions regarding required disclosure. See also “Report of Management on InternalControl over Financial Reporting.”
(b) Management’s Report on Internal Control Over Financial Reporting.
Our management’s report on Internal Control Over Financial Reporting is set forth in Item 8 andincorporated herein by reference.
PricewaterhouseCoopers LLP, an independent registered public accounting firm, audited theeffectiveness of the Company’s internal control over financial reporting as of April 30, 2008, as statedin their report as set forth in Item 8.
(c) Changes in Internal Control over Financial Reporting
During the fourth quarter of Fiscal 2008, the Company continued its implementation of SAPsoftware across its U.K., Ireland, and Poland operations. As appropriate, the Company is modifyingthe design and documentation of internal control processes and procedures relating to the new
systems to supplement and complement existing internal controls over financial reporting. Therewere no additional changes in the Company’s internal control over financial reporting during theCompany’s most recent fiscal quarter that have materially affected, or are reasonably likely tomaterially affect, the Company’s internal control over financial reporting.
Item 9B. Other Information.
There is nothing to be reported under this item.
74
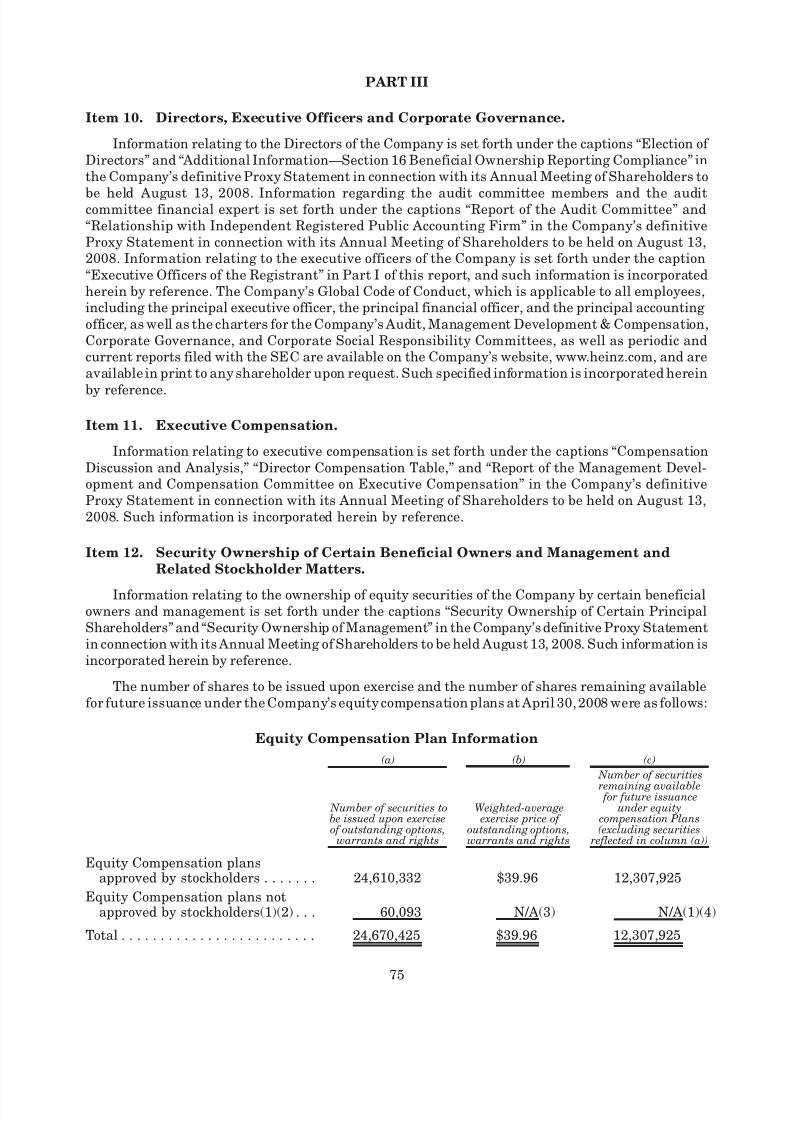
8/3/2019 2008HeinzAR
http://slidepdf.com/reader/full/2008heinzar 89/108
PART III
Item 10. Directors, Executive Officers and Corporate Governance.
Information relating to the Directors of the Company is set forth under the captions “Election of Directors” and “Additional Information—Section 16 Beneficial Ownership Reporting Compliance” inthe Company’s definitive Proxy Statement in connection with its Annual Meeting of Shareholders to
be held August 13, 2008. Information regarding the audit committee members and the auditcommittee financial expert is set forth under the captions “Report of the Audit Committee” and“Relationship with Independent Registered Public Accounting Firm” in the Company’s definitiveProxy Statement in connection with its Annual Meeting of Shareholders to be held on August 13,2008. Information relating to the executive officers of the Company is set forth under the caption“Executive Officers of the Registrant” in Part I of this report, and such information is incorporatedherein by reference. The Company’s Global Code of Conduct, which is applicable to all employees,including the principal executive officer, the principal financial officer, and the principal accountingofficer, as well as the charters for the Company’s Audit, Management Development & Compensation,Corporate Governance, and Corporate Social Responsibility Committees, as well as periodic andcurrent reports filed with the SEC are available on the Company’s website, www.heinz.com, and areavailable in print to any shareholder upon request. Such specified information is incorporated herein
by reference.
Item 11. Executive Compensation.
Information relating to executive compensation is set forth under the captions “CompensationDiscussion and Analysis,” “Director Compensation Table,” and “Report of the Management Devel-opment and Compensation Committee on Executive Compensation” in the Company’s definitiveProxy Statement in connection with its Annual Meeting of Shareholders to be held on August 13,2008. Such information is incorporated herein by reference.
Item 12. Security Ownership of Certain Beneficial Owners and Management and
Related Stockholder Matters.
Information relating to the ownership of equity securities of the Company by certain beneficialowners and management is set forth under the captions “Security Ownership of Certain PrincipalShareholders” and “Security Ownership of Management” in the Company’s definitive Proxy Statementin connection with its Annual Meeting of Shareholders to be held August 13, 2008. Such information isincorporated herein by reference.
The number of shares to be issued upon exercise and the number of shares remaining availablefor future issuance under the Company’s equity compensation plans at April 30, 2008 were as follows:
Equity Compensation Plan Information
Number of securities tobe issued upon exerciseof outstanding options,
warrants and rights
Weighted-average exercise price of
outstanding options,warrants and rights
Number of securities
remaining available for future issuance
under equitycompensation Plans(excluding securities
reflected in column (a))
(a) (b) (c)
Equity Compensation plansapproved by stockholders . . . . . . . 24,610,332 $39.96 12,307,925
Equity Compensation plans notapproved by stockholders(1)(2) . . . 60,093 N/A(3) N/A(1)(4)
Total . . . . . . . . . . . . . . . . . . . . . . . . . 24,670,425 $39.96 12,307,925
75
8/3/2019 2008HeinzAR
http://slidepdf.com/reader/full/2008heinzar 90/108
(1) The H. J. Heinz Company Restricted Stock Recognition Plan for Salaried Employees (the“Restricted Stock Plan”) was designed to provide recognition and reward in the form of awardsof restricted stock to employees who have a history of outstanding accomplishment and who,because of their experience and skills, are expected to continue to contribute significantly to thesuccess of the Company. Eligible employees were those full-time salaried employees not partic-ipating in the shareholder-approved H. J. Heinz Company Incentive Compensation Plan in effectas of May 1, 2002, and who have not been awarded an option to purchase Company Common
Stock. The Company has ceased issuing shares from this Restricted Stock Plan, and it is theCompany’s intention to terminate the Restricted Stock Plan once all restrictions on previouslyissued shares are lifted. All awards of this type are now made under the Fiscal Year 2003 StockIncentive Plan.
(2) The Executive Deferred Compensation Plan, as amended and restated on December 27, 2001 andthe Deferred Compensation Plan for Non-Employee Directors as amended and restated onJanuary 1, 2004, permit full-time salaried personnel based in the U.S. who have been identifiedas key employees and non-employee directors, to defer all or part of his or her cash compensationinto either a cash account that accrues interest, or into a Heinz stock account. The election todefer is irrevocable. The Management Development & Compensation Committee of the Board of Directors administers the Plan. All amounts are payable at the times and in the amounts electedby the executives at the time of the deferral. The deferral period shall be at least one year andshall be no greater than the date of retirement or other termination, whichever is earlier.
Amounts deferred into cash accounts are payable in cash, and all amounts deferred into theHeinz stock account are payable in Heinz Common Stock. Compensation deferred into the Heinzstock account appreciates or depreciates according to the fair market value of Heinz CommonStock.
(3) The grants made under the Restricted Stock Plan, the Executive Deferred Compensation Planand the Deferred Compensation Plan for Non-Employee Directors are restricted or reservedshares of Common Stock, and therefore there is no exercise price.
(4) The maximum number of shares of Common Stock that the Chief Executive Officer was autho-rized to grant under the Restricted Stock Plan was established annually by the ExecutiveCommittee of the Board of Directors; provided, however, that such number of shares did notexceed in any plan year 1% of all then outstanding shares of Common Stock.
Item 13. Certain Relationships and Related Transactions, and Director
Independence.
Information relating to the Company’s policy on related person transactions and certain rela-tionships with a beneficial shareholder is set forth under the caption “Related Person TransactionPolicy” in the Company’s definitive Proxy Statement in connection with its Annual Meeting of Shareholders to be held on August 13, 2008. Such information is incorporated herein by reference.
Information relating to director independence is set forth under the caption “Director Indepen-
dence Standards” in the Company’s definitive Proxy Statement in connection with its AnnualMeeting of Shareholders to be held on August 13, 2008. Such information is incorporated hereinby reference.
Item 14. Principal Accountant Fees and Services.
Information relating to the principal auditor’s fees and services is set forth under the caption“Relationship With Independent Registered Public Accounting Firm” in the Company’s definitiveProxy Statement in connection with its Annual Meeting of Shareholders to be held on August 13,2008. Such information is incorporated herein by reference.
76
8/3/2019 2008HeinzAR
http://slidepdf.com/reader/full/2008heinzar 91/108
PART IV
Item 15. Exhibits and Financial Statement Schedules.
(a)(1) The following financial statements and reports are filed as part of this report underItem 8—“Financial Statements and Supplementary Data”:
Consolidated Balance Sheets as of April 30, 2008 and May 2, 2007
Consolidated Statements of Income for the fiscal years ended April 30, 2008,May 2, 2007 and May 3, 2006
Consolidated Statements of Shareholders’ Equity for the fiscal years ended April 30, 2008, May 2, 2007 and May 3, 2006
Consolidated Statements of Cash Flows for the fiscal years ended April 30, 2008,May 2, 2007 and May 3, 2006
Notes to Consolidated Financial Statements
Report of Independent Registered Public Accounting Firm of PricewaterhouseCoopers LLP dated June 19, 2008, on the Company’s consolidatedfinancial statements and financial statement schedule filed as a part hereof for thefiscal years ended April 30, 2008, May 2, 2007 and May 3, 2006
(2) The following report and schedule is filed herewith as a part hereof:
Schedule II (Valuation and Qualifying Accounts and Reserves) for the three fiscalyears ended April 30, 2008, May 2, 2007 and May 3, 2006
All other schedules are omitted because they are not applicable or the requiredinformation is included herein or is shown in the consolidated financial statementsor notes thereto filed as part of this report incorporated herein by reference.
(3) Exhibits required to be filed by Item 601 of Regulation S-K are listed below. Documentsnot designated as being incorporated herein by reference are filed herewith. Theparagraph numbers correspond to the exhibit numbers designated in Item 601 of Regulation S-K.
3(i) Second Amended and Restated Articles of Incorporation of H.J. Heinz Companydated August 15, 2007, amending and restating the amended and restated Articlesof Amendment in their entirety.
3(ii) The Company’s By-Laws, as amended effective August 15, 2007, are incorporatedherein by reference to Exhibit 3(ii) of the Company’s Quarterly Report onForm 10-Q for the quarterly period ended August 1, 2007.
4. Except as set forth below, there are no instruments with respect to long-term debtof the Company that involve indebtedness or securities authorized thereunder inamounts that exceed 10 percent of the total assets of the Company on aconsolidated basis. The Company agrees to file a copy of any instrument oragreement defining the rights of holders of long-term debt of the Company uponrequest of the Securities and Exchange Commission.
(a) The Indenture among the Company, H. J. Heinz Finance Company, andBank One, National Association dated as of July 6, 2001 relating to theH. J. Heinz Finance Company’s $750,000,000 6.625% Guaranteed Notes due
2011, $700,000,000 6.00% Guaranteed Notes due 2012 and $550,000,0006.75% Guaranteed Notes due 2032 is incorporated herein by reference toExhibit 4 of the Company’s Annual Report on Form 10-K for the fiscal yearended May 1, 2002.
(b) The Certificate of Designations, Preferences and Rights of VotingCumulative Preferred Stock, Series A of H. J. Heinz Finance Company isincorporated herein by reference to Exhibit 4 of the Company’s QuarterlyReport on Form 10-Q for the three months ended August 1, 2001.
77
8/3/2019 2008HeinzAR
http://slidepdf.com/reader/full/2008heinzar 92/108
(c) Amended and Restated Five-Year Credit Agreement dated as of September 6, 2001 and amended and restated as of August 4, 2004 amongH.J. Heinz Company, H.J. Heinz Finance Company, the Banks listed on thesignature pages thereto and JP Morgan Chase Bank, as Administrative
Agent, is incorporated herein by reference to Exhibit 4 to the Company’squarterly report on Form 10-Q for the period ended January 25, 2006.
10(a) Management contracts and compensatory plans:
(i) 1986 Deferred Compensation Program for H. J. Heinz Companyand affiliated companies, as amended and restated in its entiretyeffective December 6, 1995, is incorporated herein by reference toExhibit 10(c)(i) to the Company’s Annual Report on Form 10-K forthe fiscal year ended May 1, 1995.
(ii) H. J. Heinz Company 1990 Stock Option Plan is incorporatedherein by reference to Appendix A to the Company’s ProxyStatement dated August 3, 1990.
(iii) H. J. Heinz Company 1994 Stock Option Plan is incorporatedherein by reference to Appendix A to the Company’s ProxyStatement dated August 5, 1994.
(iv) H. J. Heinz Company Supplemental Executive Retirement Plan, as
amended, is incorporated herein by reference to Exhibit 10(c)(ix) tothe Company’s Annual Report on Form 10-K for the fiscal yearended April 28, 1993.
(v) H. J. Heinz Company Executive Deferred Compensation Plan (asamended and restated on December 27, 2001) is incorporated byreference to Exhibit 10(a)(vii) of the Company’s Annual Report onForm 10-K for the fiscal year ended May 1, 2002.
(vi) H. J. Heinz Company Incentive Compensation Plan is incorporatedherein by reference to Appendix B to the Company’s ProxyStatement dated August 5, 1994.
(vii) H. J. Heinz Company Stock Compensation Plan for Non-EmployeeDirectors is incorporated herein by reference to Appendix A to the
Company’s Proxy Statement dated August 3, 1995.(viii) H. J. Heinz Company 1996 Stock Option Plan is incorporated
herein by reference to Appendix A to the Company’s ProxyStatement dated August 2, 1996.
(ix) H. J. Heinz Company Deferred Compensation Plan for Directors isincorporated herein by reference to Exhibit 10(a)(xiii) to theCompany’s Annual Report on Form 10-K for the fiscal year ended
April 29, 1998.
(x) H. J. Heinz Company 2000 Stock Option Plan is incorporatedherein by reference to Appendix A to the Company’s ProxyStatement dated August 4, 2000.
(xi) H. J. Heinz Company Executive Estate Life Insurance Program is
incorporated herein by reference to Exhibit 10(a)(xv) to theCompany’s Annual Report on Form 10-K for the fiscal year endedMay 1, 2002.
(xii) H. J. Heinz Company Restricted Stock Recognition Plan forSalaried Employees is incorporated herein by reference toExhibit 10(a)(xvi) to the Company’s Annual Report on Form 10-K for the fiscal year ended May 1, 2002.
(xiii) H. J. Heinz Company Senior Executive Incentive CompensationPlan is incorporated by reference to the Company’s ProxyStatement dated August 2, 2002.
78
8/3/2019 2008HeinzAR
http://slidepdf.com/reader/full/2008heinzar 93/108
(xiv) Deferred Compensation Plan for Non-Employee Directors of H. J. Heinz Company (as amended and restated effectiveJanuary 1, 2004), is incorporated herein by reference to Exhibit 10to the Company’s Quarterly Report on Form 10-Q for the quarterlyperiod ended January 28, 2004.
(xv) Form of Stock Option Award and Agreement for U.S. Employees isincorporated herein by reference to Exhibit 10(a) to the Company’s
Quarterly Report on Form 10-Q for the quarterly period endedJanuary 26, 2005.
(xvi) Form of Stock Option Award and Agreement for U.S. EmployeesBased in the U.K. on International Assignment is incorporatedherein by reference to Exhibit 10(a) to the Company’s QuarterlyReport on Form 10-Q for the quarterly period ended January 26,2005.
(xvii) Form of Restricted Stock Unit Award and Agreement forU.S. Employees is incorporated herein by reference to Exhibit 10(a)to the Company’s Quarterly Report on Form 10-Q for the quarterlyperiod ended January 26, 2005.
(xviii) Form of Restricted Stock Unit Award and Agreement for
Non-U.S. Based Employees is incorporated herein by reference toExhibit 10(a) to the Company’s Quarterly Report on Form 10-Q forthe quarterly period ended January 26, 2005.
(xix) Form of Five-Year Restricted Stock Unit Retention Award and Agreement for U.S. Employees is incorporated herein by referenceto Exhibit 10(a) to the Company’s Quarterly Report on Form 10-Qfor the quarterly period ended January 26, 2005.
(xx) Form of Five-Year Restricted Stock Unit Retention Award and Agreement for Non-U.S. Based Employees is incorporated herein byreference to Exhibit 10(a) to the Company’s Quarterly Report onForm 10-Q for the quarterly period ended January 26, 2005.
(xxi) Form of Three-Year Restricted Stock Unit Retention Award and
Agreement for U.S. Employees is incorporated herein by referenceto Exhibit 10(a) to the Company’s Quarterly Report on Form 10-Qfor the quarterly period ended January 26, 2005.
(xxii) Form of Three-Year Restricted Stock Unit Retention Award and Agreement for Non-U.S. Based Employees is incorporated herein byreference to Exhibit 10(a) to the Company’s Quarterly Report onForm 10-Q for the quarterly period ended January 26, 2005.
(xxiii) Named Executive Officer and Director Compensation
(xxiv) Form of Fiscal Year 2006 Restricted Stock Unit Award and Agreement for U.S. Employees is incorporated herein by referenceto the Company’s Annual Report on Form 10-K for the fiscal yearended April 27, 2005.
(xxv) Form of Fiscal Year 2006 Restricted Stock Unit Award and Agreement for non-U.S. Based Employees is incorporated herein byreference to the Company’s Annual Report on Form 10-K for thefiscal year ended April 27, 2005.
(xxvi) Amendment Number One to the H.J. Heinz Company 2000 StockOption Plan is incorporated herein by reference to the Company’s
Annual Report on Form 10-K for the fiscal year ended April 27,2005.
79
8/3/2019 2008HeinzAR
http://slidepdf.com/reader/full/2008heinzar 94/108
(xxvii) Amendment Number One to the H.J. Heinz Company 1996 StockOption Plan is incorporated herein by reference to the Company’s
Annual Report on Form 10-K for the fiscal year ended April 27,2005.
(xxviii) Form of Fiscal Year 2006 Severance Protection Agreement isincorporated herein by reference to the Company’s Annual Reporton Form 10-K for the fiscal year ended April 27, 2005.
(xxix) Form of Long-Term Performance Program Award Agreement ishereby incorporated by reference to Exhibit 99 of the Company’sForm 8-K filed on June 12, 2006.
(xxx) Form of Fiscal Year 2007 Restricted Stock Unit Award and Agreement is incorporated herein by reference to the Company’sQuarterly Report on Form 10-Q for the quarterly period endedNovember 1, 2006.
(xxxi) Form of Fiscal Year 2008 Stock Option Award and Agreement(U.S. Employees) is hereby incorporated by reference to theCompany’s Quarterly Report on Form 10-Q for the quarterly periodended August 1, 2007.
(xxxii) Form of Stock Option Award and Agreement is hereby incorporated
by reference to the Company’s Quarterly Report on Form 10-Q forthe quarterly period ended August 1, 2007.
(xxxiii) Form of Restricted Stock Unit Award and Agreement is herebyincorporated by reference to the Company’s Quarterly Report onForm 10-Q for the quarterly period ended August 1, 2007.
(xxxiv) Form of Revised Fiscal Year 2008 Restricted Stock Unit Award and Agreement is hereby incorporated by reference to the Company’sQuarterly Report on Form 10-Q for the quarterly period ended
August 1, 2007.
(xxxv) Form of Restricted Stock Unit Award and Agreement(U.S. Employees Retention) is hereby incorporated by reference tothe Company’s Quarterly Report on Form 10-Q for the quarterly
period ended August 1, 2007.(xxxvi) Second Amended and Restated Fiscal Year 2003 Stock Incentive
Plan is hereby incorporated herein by reference to the Company’sQuarterly Report on Form 10-Q for the quarterly period ended
August 1, 2007.
(xxxvii) Second Amended and Restated Global Stock Purchase Plan ishereby incorporated herein by reference to the Company’sQuarterly Report on Form 10-Q for the quarterly period ended
August 1, 2007.
(xxxviii) Time Sharing Agreement dated as of September 14, 2007, betweenH.J. Heinz Company and William R. Johnson incorporated hereinby reference to Exhibit 10.1 of the Company’s Form 8-K dated
September 14, 2007.(xxxix) Retirement and Consulting Agreement and a Non-Competition andNon-Solicitation Agreement dated January 30, 2008 betweenH. J. Heinz Company and Jeffrey P. Berger are hereby incorporatedby reference to Exhibit 10.1 of the Company’s Form 8-K datedFebruary 1, 2008.
12. Computation of Ratios of Earnings to Fixed Charges.
21. Subsidiaries of the Registrant.
23. Consent of PricewaterhouseCoopers LLP.
24. Powers-of-attorney of the Company’s directors.
80

8/3/2019 2008HeinzAR
http://slidepdf.com/reader/full/2008heinzar 95/108
31(a) Rule 13a-14(a)/15d-14(a) Certification by William R. Johnson.
31(b) Rule 13a-14(a)/15d-14(a) Certification by Arthur B. Winkleblack.
32(a) Certification by the Chief Executive Officer Relating to the Annual ReportContaining Financial Statements.
32(b) Certification by the Chief Financial Officer Relating to the Annual ReportContaining Financial Statements.
Copies of the exhibits listed above will be furnished upon request to holders or beneficial holders of any class of the Company’s stock, subject to payment in advance of the cost of reproducing theexhibits requested.
81

8/3/2019 2008HeinzAR
http://slidepdf.com/reader/full/2008heinzar 96/108
SIGNATURES
Pursuant to the requirements of Section 13 or 15(d) of the Securities Exchange Act of 1934, theRegistrant has duly caused this Report to be signed on its behalf by the undersigned, thereunto dulyauthorized, on June 19, 2008.
H. J. HEINZ COMPANY(Registrant)
By: /s/ ARTHUR B. WINKLEBLACK . . . . . . . . . . . . . . . . . . . . . . . . . . . . . . . . . . . . . . . . Arthur B. Winkleblack
Executive Vice President and Chief Financial Officer
Pursuant to the requirements of the Securities Exchange Act of 1934, this Report has beensigned below by the following persons on behalf of the Registrant and in the capacities indicated, onJune 19, 2008.
Signature Capacity
/s/ WILLIAM R. JOHNSON
. . . . . . . . . . . . . . . . . . . . . . . . . . . . . . . . . . .William R. Johnson
Chairman, President andChief Executive Officer(Principal Executive Officer)
/s/ ARTHUR B. WINKLEBLACK . . . . . . . . . . . . . . . . . . . . . . . . . . . . . . . . . . . Arthur B. Winkleblack
Executive Vice President and(Principal Financial Officer)
/s/ EDWARD J. MCMENAMIN. . . . . . . . . . . . . . . . . . . . . . . . . . . . . . . . . . .Edward J. McMenamin
Senior Vice President-Finance andCorporate Controller(Principal Accounting Officer)
William R. JohnsonCharles E. BunchLeonard S. Coleman, Jr.
John G. DrosdickEdith E. HolidayCandace KendleDean R. O’HareNelson PeltzDennis H. ReilleyLynn C. SwannThomas J. UsherMichael F. Weinstein
DirectorDirectorDirector
DirectorDirectorDirectorDirectorDirectorDirectorDirectorDirectorDirector
By: /s/ ARTHUR B. WINKLEBLACK . . . . . . . . . . . . . . . . . . . . . . . . . . . . . . . Arthur B. Winkleblack
Attorney-in-Fact
SIGNATURES
Pursuant to the requirements of Section 13 or 15(d) of the Securities Exchange Act of 1934, theRegistrant has duly caused this Report to be signed on its behalf by the undersigned, thereunto dulyauthorized, on June 19, 2008.
H. J. HEINZ COMPANY(Registrant)
By: /s/ ARTHUR B. WINKLEBLACK . . . . . . . . . . . . . . . . . . . . . . . . . . . . . . . . . . . . . . . . Arthur B. Winkleblack
Executive Vice President and Chief Financial Officer
Pursuant to the requirements of the Securities Exchange Act of 1934, this Report has beensigned below by the following persons on behalf of the Registrant and in the capacities indicated, onJune 19, 2008.
Signature Capacity
/s/ WILLIAM R. JOHNSON
. . . . . . . . . . . . . . . . . . . . . . . . . . . . . . . . . . .William R. Johnson
Chairman, President andChief Executive Officer(Principal Executive Officer)
/s/ ARTHUR B. WINKLEBLACK . . . . . . . . . . . . . . . . . . . . . . . . . . . . . . . . . . . Arthur B. Winkleblack
Executive Vice President and(Principal Financial Officer)
/s/ EDWARD J. MCMENAMIN. . . . . . . . . . . . . . . . . . . . . . . . . . . . . . . . . . .Edward J. McMenamin
Senior Vice President-Finance andCorporate Controller(Principal Accounting Officer)
William R. JohnsonCharles E. BunchLeonard S. Coleman, Jr.
John G. DrosdickEdith E. HolidayCandace KendleDean R. O’HareNelson PeltzDennis H. ReilleyLynn C. SwannThomas J. UsherMichael F. Weinstein
DirectorDirectorDirector
DirectorDirectorDirectorDirectorDirectorDirectorDirectorDirector
Director
By: /s/ ARTHUR B. WINKLEBLACK . . . . . . . . . . . . . . . . . . . . . . . . . . . . . . . Arthur B. Winkleblack
Attorney-in-Fact
82
8/3/2019 2008HeinzAR
http://slidepdf.com/reader/full/2008heinzar 97/108
[THIS P AGE INTENTIONALLY LEFT BLANK ]
8/3/2019 2008HeinzAR
http://slidepdf.com/reader/full/2008heinzar 98/108
Exhibit 31(a)
I, William R. Johnson, certify that:
1. I have reviewed this annual report on Form 10-K of H. J. Heinz Company;
2. Based on my knowledge, this report does not contain any untrue statement of a material factor omit to state a material fact necessary to make the statements made, in light of the circumstances
under which such statements were made, not misleading with respect to the period covered by thisreport;
3. Based on my knowledge, the financial statements, and other financial information included inthis report, fairly present in all material respects the financial condition, results of operations andcash flows of the registrant as of, and for, the periods presented in this report;
4. The registrant’s other certifying officer and I are responsible for establishing and maintainingdisclosure controls and procedures (as defined in Exchange Act Rules 13a-15(e) and 15d-15(e)) andinternal control over financial reporting (as defined in Exchange Act Rules 13a-15(f) and 15d-15(f))for the registrant and have:
a) Designed such disclosure controls and procedures, or caused such disclosure controls and
procedures to be designed under our supervision, to ensure that material information relating tothe registrant, including its consolidated subsidiaries, is made known to us by others withinthose entities, particularly during the period in which this report is being prepared;
b) Designed such internal control over financial reporting, or caused such internal controlover financial reporting to be designed under our supervision, to provide reasonable assuranceregarding the reliability of financial reporting and the preparation of financial statements forexternal purposes in accordance with generally accepted accounting principles;
c) Evaluated the effectiveness of the registrant’s disclosure controls and procedures andpresented in this report our conclusions about the effectiveness of the disclosure controls andprocedures, as of the end of the period covered by this report based on such evaluation; and
d) Disclosed in this report any change in the registrant’s internal control over financialreporting that occurred during the registrant’s fourth fiscal quarter that has materially affected,or is reasonably likely to materially affect, the registrant’s internal control over financialreporting; and
5. The registrant’s other certifying officer and I have disclosed, based on our most recentevaluation of internal control over financial reporting, to the registrant’s auditors and the auditcommittee of the registrant’s board of directors (or persons fulfilling the equivalent functions):
a) All significant deficiencies and material weaknesses in the design or operation of internalcontrol over financial reporting which are reasonably likely to adversely affect the registrant’sability to record, process, summarize, and report financial information; and
b) Any fraud, whether or not material, that involves management or other employees whohave a significant role in the registrant’s internal control over financial reporting.
Date: June 19, 2008
By: /s/ WILLIAM R. JOHNSON
Name: William R. JohnsonTitle: Chairman, President and
Chief Executive Officer
A-1
8/3/2019 2008HeinzAR
http://slidepdf.com/reader/full/2008heinzar 99/108
Exhibit 31(b)
I, Arthur B. Winkleblack, certify that:
1. I have reviewed this annual report on Form 10-K of H. J. Heinz Company;
2. Based on my knowledge, this report does not contain any untrue statement of a material factor omit to state a material fact necessary to make the statements made, in light of the circumstances
under which such statements were made, not misleading with respect to the period covered by thisreport;
3. Based on my knowledge, the financial statements, and other financial information included inthis report, fairly present in all material respects the financial condition, results of operations andcash flows of the registrant as of, and for, the periods presented in this report;
4. The registrant’s other certifying officer and I are responsible for establishing and maintainingdisclosure controls and procedures (as defined in Exchange Act Rules 13a-15(e) and 15d-15(e)) andinternal control over financial reporting (as defined in Exchange Act Rules 13a-15(f) and 15d-15(f) forthe registrant and have:
a) Designed such disclosure controls and procedures, or caused such disclosure controls and
procedures to be designed under our supervision, to ensure that material information relating tothe registrant, including its consolidated subsidiaries, is made known to us by others withinthose entities, particularly during the period in which this report is being prepared;
b) Designed such internal control over financial reporting, or caused such internal controlover financial reporting to be designed under our supervision, to provide reasonable assuranceregarding the reliability of financial reporting and the preparation of financial statements forexternal purposes in accordance with generally accepted accounting principles;
c) Evaluated the effectiveness of the registrant’s disclosure controls and procedures andpresented in this report our conclusions about the effectiveness of the disclosure controls andprocedures, as of the end of the period covered by this report based on such evaluation; and
d) Disclosed in this report any change in the registrant’s internal control over financialreporting that occurred during the registrant’s fourth fiscal quarter that has materially affected,or is reasonably likely to materially affect, the registrant’s internal control over financialreporting; and
5. The registrant’s other certifying officer and I have disclosed, based on our most recentevaluation of such internal control over financial reporting, to the registrant’s auditors and theaudit committee of the registrant’s board of directors (or persons fulfilling the equivalent functions):
a) All significant deficiencies and material weaknesses in the design or operation of internalcontrol over financial reporting which are reasonably likely to adversely affect the registrant’sability to record, process, summarize, and report financial information; and
b) Any fraud, whether or not material, that involves management or other employees whohave a significant role in the registrant’s internal control over financial reporting.
Date: June 19, 2008
By: /s/ ARTHUR B. WINKLEBLACK
Name: Arthur B. WinkleblackTitle: Executive Vice President and
Chief Financial Officer
A-2
8/3/2019 2008HeinzAR
http://slidepdf.com/reader/full/2008heinzar 100/108
Exhibit 32(a)
Certification by the Chief Executive Officer Relating to
the Annual Report Containing Financial Statements
I, William R. Johnson, Chairman, President and Chief Executive Officer, of H. J. Heinz Company,a Pennsylvania corporation (the “Company”), hereby certify that, to my knowledge:
1. The Company’s annual report on Form 10-K for the fiscal year ended April 30, 2008 (the“Form 10-K”) fully complies with the requirements of Section 13(a) or 15(d) of the SecuritiesExchange Act of 1934, as amended; and
2. The information contained in the Form 10-K fairly presents, in all material respects, thefinancial condition and results of operations of the Company.
Date: June 19, 2008
By: /s/ WILLIAM R. JOHNSON
Name: William R. Johnson
Title: Chairman, President andChief Executive Officer
A-3
8/3/2019 2008HeinzAR
http://slidepdf.com/reader/full/2008heinzar 101/108
Exhibit 32(b)
Certification by the Chief Financial Officer Relating to
the Annual Report Containing Financial Statements
I, Arthur B. Winkleblack, Executive Vice President and Chief Financial Officer of H. J. HeinzCompany, a Pennsylvania corporation (the “Company”), hereby certify that, to my knowledge:
1. The Company’s annual report on Form 10-K for the fiscal year ended April 30, 2008 (the“Form 10-K”) fully complies with the requirements of Section 13(a) or 15(d) of the SecuritiesExchange Act of 1934, as amended; and
2. The information contained in the Form 10-K fairly presents, in all material respects, thefinancial condition and results of operations of the Company.
Date: June 19, 2008
By: /s/ ARTHUR B. WINKLEBLACK
Name: Arthur B. Winkleblack
Title: Executive Vice President andChief Financial Officer
A-4
8/3/2019 2008HeinzAR
http://slidepdf.com/reader/full/2008heinzar 102/108
DIRECTORS AND OFFICERS*H. J. Heinz Company
DirectorsWilliam R. Johnson
Chairman, President andChief Executive OfficerDirector since 1993. (1)
Charles E. BunchChairman andChief Executive Officer,PPG Industries, Inc.Pittsburgh, Pennsylvania.Director since 2003. (1,2,4)
Leonard S. Coleman, Jr.
Former President of the NationalLeague of Professional BaseballClubs;Middletown, NJ.Director since 1998. (1,3,5)
John G. Drosdick
Chairman, President andChief Executive Officer,Sunoco, Inc.Philadelphia, Pennsylvania.Director since 2005. (4,5)
Edith E. Holiday
Attorney and Director, Various Corporations.Director since 1994. (2,5)
Candace Kendle
Chairman and Chief ExecutiveOfficer,Kendle International Inc.,Cincinnati, Ohio.Director since 1998. (3,4)
Dean R. O’Hare
Former Chairman and Chief Executive Officer,The Chubb Corporation,Warren, New Jersey.Director since 2000. (1,2,4,5)
Nelson Peltz
Chief Executive Officer andfounding partner of TrianFund Management, L.P.New York, NYDirector since 2006. (3,5)
Dennis H. Reilley
Chairman CovidienFormer Chairman andChief Executive Officer, PraxairDanbury, Connecticut.
Director since 2005. (2,3,4)Lynn C. Swann
President, Swann, Inc.Managing Director, Diamond EdgeCapital Partners, LLC inNew York.Pittsburgh, Pennsylvania.Director since 2003. (3,5)
Thomas J. Usher
Chairman of Marathon Oil Com-pany and Retired Chairman of United States Steel Corporation,Pittsburgh, Pennsylvania.Director since 2000. (1,2,3,5)
Michael F. Weinstein
Chairman and Co-founder, INOV8Beverage Co., L.L.C.Rye, New YorkDirector since 2006 (2,4)
Committees of the Board
(1) Executive Committee(2) Management Development and
Compensation Committee(3) Corporate Governance
Committee(4) Audit Committee
(5) Corporate Social ResponsibilityCommittee
Officers
William R. Johnson
Chairman, President andChief Executive Officer
David C. Moran
Executive Vice President andPresident and Chief ExecutiveOfficer of Heinz North America
C. Scott O’Hara
Executive Vice President —President and Chief ExecutiveOfficerHeinz Europe
Arthur B. WinkleblackExecutive Vice President and Chief Financial Officer
Theodore N. Bobby
Executive Vice President andGeneral Counsel
Edward J. McMenamin
Senior Vice President —Finance and Corporate Controller
Michael D. Milone
Senior Vice PresidentHeinz Pacific, Rest of World,and Enterprise Risk Management
D. Edward I. Smyth
Senior Vice President —Corporate and Government
Affairs and Chief Administrative Officer
Mitchell A. Ring
Senior Vice President —Business Development
Christopher J. Warmoth
Senior Vice President —Heinz Asia
Rene D. Biedzinski
Corporate Secretary
Leonard A. Cullo, Jr.
Vice President — Treasurer
* As of June 2008
A-5
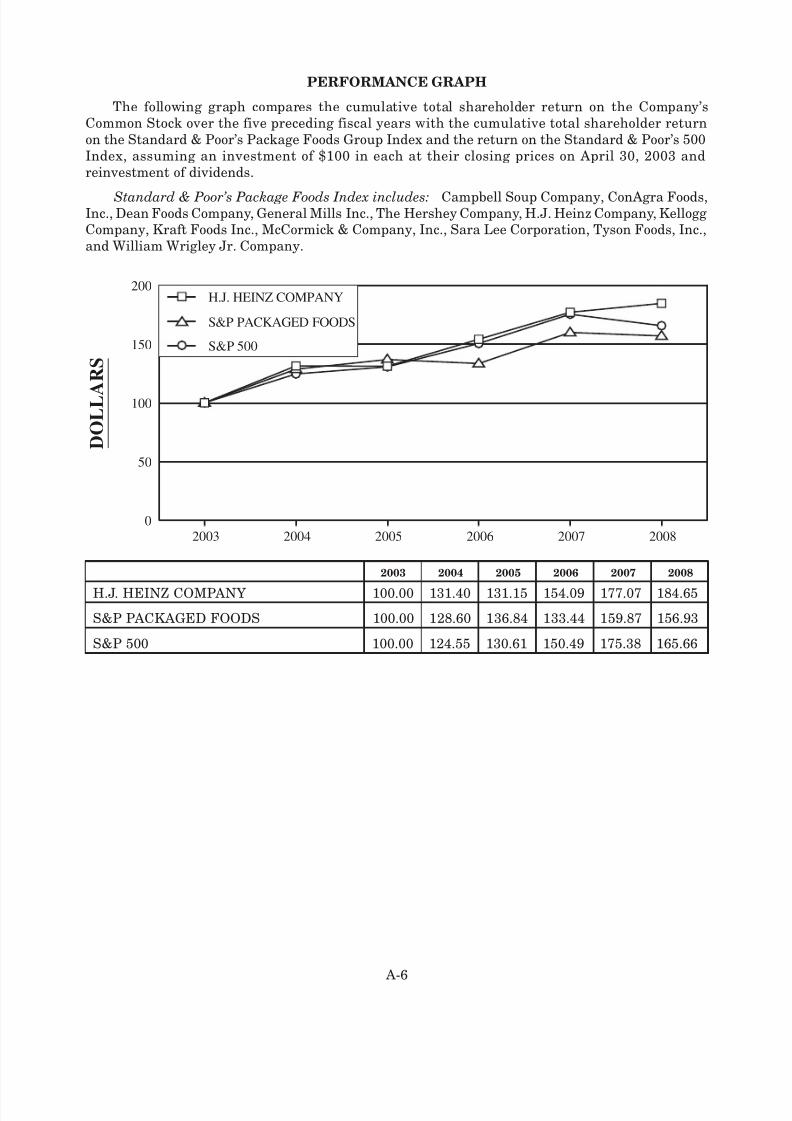
8/3/2019 2008HeinzAR
http://slidepdf.com/reader/full/2008heinzar 103/108
PERFORMANCE GRAPH
The following graph compares the cumulative total shareholder return on the Company’sCommon Stock over the five preceding fiscal years with the cumulative total shareholder returnon the Standard & Poor’s Package Foods Group Index and the return on the Standard & Poor’s 500Index, assuming an investment of $100 in each at their closing prices on April 30, 2003 andreinvestment of dividends.
Standard & Poor’s Package Foods Index includes: Campbell Soup Company, ConAgra Foods,Inc., Dean Foods Company, General Mills Inc., The Hershey Company, H.J. Heinz Company, KelloggCompany, Kraft Foods Inc., McCormick & Company, Inc., Sara Lee Corporation, Tyson Foods, Inc.,and William Wrigley Jr. Company.
200820072006200520042003
D O L L A
R S
H.J. HEINZ COMPANY
S&P PACKAGED FOODS
S&P 500
0
50
100
150
200
2003 2004 2005 2006 2007 2008
H.J. HEINZ COMPANY 100.00 131.40 131.15 154.09 177.07 184.65
S&P PACKAGED FOODS 100.00 128.60 136.84 133.44 159.87 156.93
S&P 500 100.00 124.55 130.61 150.49 175.38 165.66
A-6
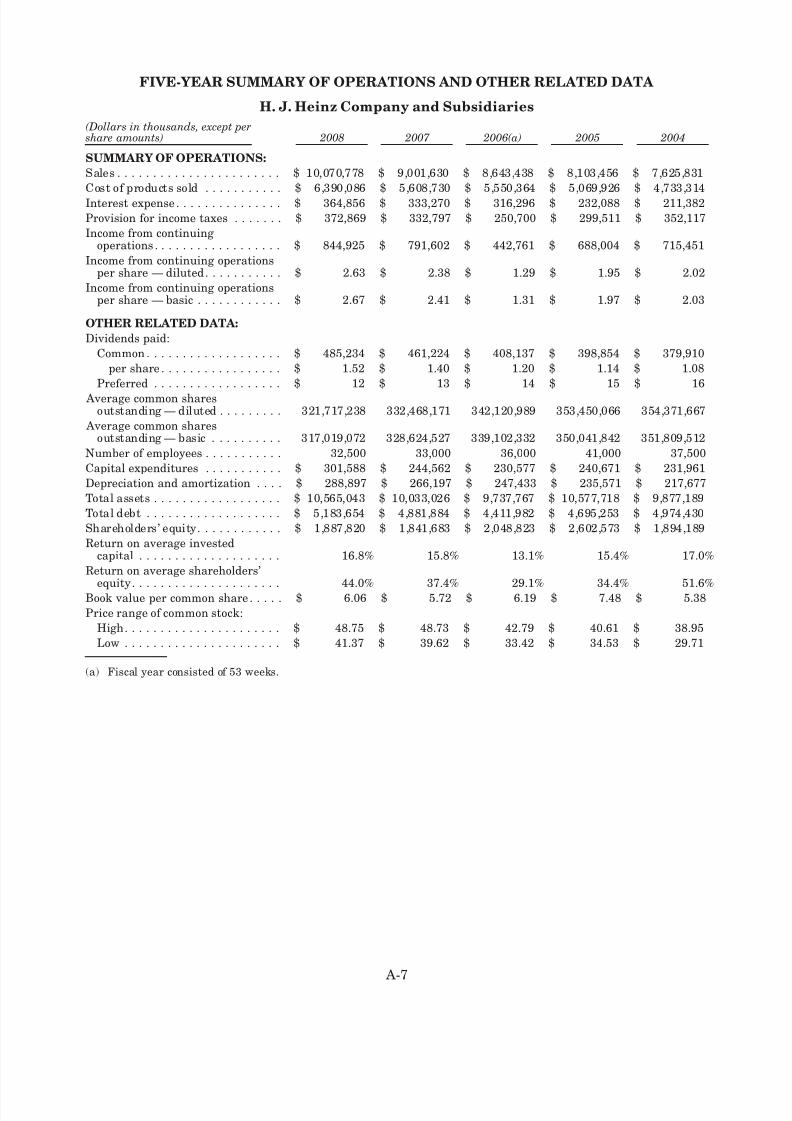
8/3/2019 2008HeinzAR
http://slidepdf.com/reader/full/2008heinzar 104/108
FIVE-YEAR SUMMARY OF OPERATIONS AND OTHER RELATED DATA
H. J. Heinz Company and Subsidiaries
(Dollars in thousands, except pershare amounts) 2008 2007 2006(a) 2005 2004
SUMMARY OF OPERATIONS:
Sales . . . . . . . . . . . . . . . . . . . . . . . $ 10,070,778 $ 9,001,630 $ 8,643,438 $ 8,103,456 $ 7,625,831
Cost of products sold . . . . . . . . . . . $ 6,390,086 $ 5,608,730 $ 5,550,364 $ 5,069,926 $ 4,733,314
Interest expense . . . . . . . . . . . . . . . $ 364,856 $ 333,270 $ 316,296 $ 232,088 $ 211,382
Provision for income taxes . . . . . . . $ 372,869 $ 332,797 $ 250,700 $ 299,511 $ 352,117
Income from continuingoperations . . . . . . . . . . . . . . . . . . $ 844,925 $ 791,602 $ 442,761 $ 688,004 $ 715,451
Income from continuing operationsper share — diluted. . . . . . . . . . . $ 2.63 $ 2.38 $ 1.29 $ 1.95 $ 2.02
Income from continuing operationsper share — basic . . . . . . . . . . . . $ 2.67 $ 2.41 $ 1.31 $ 1.97 $ 2.03
OTHER RELATED DATA:
Dividends paid:
Common . . . . . . . . . . . . . . . . . . . $ 485,234 $ 461,224 $ 408,137 $ 398,854 $ 379,910
per share . . . . . . . . . . . . . . . . . $ 1.52 $ 1.40 $ 1.20 $ 1.14 $ 1.08
Preferred . . . . . . . . . . . . . . . . . . $ 12 $ 13 $ 14 $ 15 $ 16
Average common sharesoutstanding — diluted . . . . . . . . . 321,717,238 332,468,171 342,120,989 353,450,066 354,371,667
Average common sharesoutstanding — basic . . . . . . . . . . 317,019,072 328,624,527 339,102,332 350,041,842 351,809,512
Number of employees . . . . . . . . . . . 32,500 33,000 36,000 41,000 37,500
Capital expenditures . . . . . . . . . . . $ 301,588 $ 244,562 $ 230,577 $ 240,671 $ 231,961
Depreciation and amortization . . . . $ 288,897 $ 266,197 $ 247,433 $ 235,571 $ 217,677
Total assets . . . . . . . . . . . . . . . . . . $ 10,565,043 $ 10,033,026 $ 9,737,767 $ 10,577,718 $ 9,877,189
Total debt . . . . . . . . . . . . . . . . . . . $ 5,183,654 $ 4,881,884 $ 4,411,982 $ 4,695,253 $ 4,974,430
Shareholders’ equity. . . . . . . . . . . . $ 1,887,820 $ 1,841,683 $ 2,048,823 $ 2,602,573 $ 1,894,189
Return on average investedcapital . . . . . . . . . . . . . . . . . . . . 16.8% 15.8% 13.1% 15.4% 17.0%
Return on average shareholders’equity. . . . . . . . . . . . . . . . . . . . . 44.0% 37.4% 29.1% 34.4% 51.6%
Book value per common share . . . . . $ 6.06 $ 5.72 $ 6.19 $ 7.48 $ 5.38
Price range of common stock:
High. . . . . . . . . . . . . . . . . . . . . . $ 48.75 $ 48.73 $ 42.79 $ 40.61 $ 38.95
Low . . . . . . . . . . . . . . . . . . . . . . $ 41.37 $ 39.62 $ 33.42 $ 34.53 $ 29.71
(a) Fiscal year consisted of 53 weeks.
A-7

8/3/2019 2008HeinzAR
http://slidepdf.com/reader/full/2008heinzar 105/108
There were no special items in Fiscal 2008 or Fiscal 2007.
The 2006 resultsinclude $124.7 million pre-tax ($80.3 million after tax) for targeted workforce reductions consistent withthe Company’s goals to streamline its businesses and $22.0 million pre-tax ($16.3 million after tax) for strategic review costsrelatedto the potential divestiture of several businesses. Also, $206.5million pre-tax($153.9 million after tax) wasrecorded fornet losses on non-core businessesand product lines which were sold and asset impairmentcharges on non-core businesses andproduct lines anticipated to be sold in Fiscal 2007. Also during 2006, the Company reversed valuation allowances of $27.3 million primarily related to the Hain Celestial Group, Inc. (“Hain”). In addition, results include $24.4 million of taxexpense relating to the impact of the American Jobs Creation Act.
The 2005 results include a $64.5 million non-cash impairment charge for the Company’s equity investment in Hain and a$9.3 million non-cash charge to recognize the impairment of a cost-basis investment in a grocery industry sponsorede-commerce business venture. There was no tax benefit recorded with these impairment charges in Fiscal 2005. Fiscal2005 also includes a $27.0 million pre-tax ($18.0million after-tax) non-cash asset impairmentcharge relatedto the anticipateddisposition of the HAK vegetable product line in Northern Europe which occurred in Fiscal 2006.
The 2004 resultsinclude, on a pretax basis, the gain on the sale of the bakerybusiness in Northern Europe of $26.3 million,reorganization costs of $16.6 million and the write down of pizza crust assets in the United Kingdom of $4.0 million.
A-8
8/3/2019 2008HeinzAR
http://slidepdf.com/reader/full/2008heinzar 106/108
CORPORATE DATA
Heinz: H. J. Heinz Company is one of the world’s leadingmarketers of branded foods to retail and foodservicechannels. Heinz has number-one or number-two brandedbusinesses in more than 50 world markets.
Among the Company’s famous brands are Heinz, Ore-
Ida, Smart Ones, Classico, Wyler’s, Delimex, Bagel Bites,
Lea & Perrins, HP, Wattie’s, Farley’s, Plasmon, BioDie-
terba, Greenseas, Orlando, ABC, Honig, De Ruijter, and
Pudliszki. Heinz also uses the famous brands Weight
Watchers, Boston Market, T.G.I. Friday’s, Jack Daniel’s,
Amoy, Cottee’s and Rose’s under license.
Heinz provides employment for approximately32,500 people full time, plus thousands of others on apart-time basis and during seasonal peaks.
Annual Meeting The annual meeting of the Company’sshareholders will be held at 9:00 a.m. on August13, 2008,
in Pittsburgh at The Westin Convention Center Hotel.The meeting will be Webcast live at www.heinz.com.
Copies of This Publication and Others Mentioned in
This Report are available without charge from the Cor-porate Affairs Department at the Heinz World Headquar-ters address or by calling (412) 456-6000.
Form 10-K The Company submits an annual report to theSecuritiesand Exchange Commission on Form 10-K. Cop-ies of this Form 10-K and exhibits are available withoutcharge from the Corporate Affairs Department.
Investor Information Securities analysts and investorsseeking additional information about the Companyshould contact Margaret Nollen, Vice President-Investor
Relations, at (412) 456-1048.
Media Information Journalists seeking additional infor-mationabout the CompanyshouldcontactMichael Mullen,Director of Corporate Affairs, at (412) 456-5751.
Equal Employment Opportunity H. J. Heinz Com-pany hires, trains, promotes, compensates and makesall other employment decisions without regard to race,color, sex, age, religion, national origin, disability or otherprotected conditions or characteristics. It has affirmativeaction programs in place at all domestic locations toensure equal opportunity for every employee.
The H. J. Heinz Company Equal Opportunity Review is
available from the Corporate Affairs Department.Environmental Policy H. J. Heinz Company is committed
to protecting the environment. Each affiliate has estab-lished programs to review its environmental impact, tosafeguard the environment and to train employees.
The H. J. Heinz Company Environmental, Health &Safety Report is available from the Corporate AffairsDepartment and is accessible on www.heinz.com.
Corporate Data Transfer Agent, Registrar and Disburs-ing Agent (for inquiries and changes in shareholderaccounts or to arrange for the direct deposit of dividends):
BNY Mellon Shareowner Services, 480 Washington Bou-levard, Jersey City, NJ 07310. (800) 253-3399 (withinU.S.A.) or (201) 680-6578 or www.bnymellon.com/share-owner/isd.
Auditors: PricewaterhouseCoopers LLP, 600 GrantStreet, Pittsburgh, Pennsylvania 15219
Stock Listings:
New York Stock Exchange, Inc.Ticker Symbols: Common-HNZ; Third CumulativePreferred-HNZ PRThe Annual Written Affirmation and the Annual CEO
Affirmation were submittedon August 21,2007.
TDD Services BNY Mellon Shareowner Services can beaccessed through telecommunications devices for thehearing impaired by dialing (800) 231-5469 (within
U.S.A.) and by dialing 201-680-6610 (outside of U.S.A.).
H. J. Heinz CompanyP.O. Box 57Pittsburgh, Pennsylvania 15230-0057(412) 456-5700www.heinz.com
Weight Watchers on foods and beverages is the registered trademark of WW
Foods, LLC. Weight Watchers for services and POINTS are the registered
trademarks of Weight Watchers International, Inc. Boston Market is a regis-
teredtrademarkof BostonMarket Corporation.T.G.I. Friday’s isa trademarkof
TGI Friday’s of Minnesota, Inc. Jack Daniel’s is the registered trademark of
JackDaniel’sProperties, Inc. Amoy is a trademarkof Danone Asia PteLimited.
Cottee’s and Rose’s are registered trademarks of Cadbury Enterprises Pte Ltd.
K This entire report is printed on recycled paper.
A-9

8/3/2019 2008HeinzAR
http://slidepdf.com/reader/full/2008heinzar 107/108
Executive Management
Office of the ChairmanWilliam R. Johnson
Chairman, President & Chief Executive Officer
Theodore N. Bobby
Executive Vice President & General CounselMichael D. Milone
Senior Vice President, Heinz Pacific, Rest of World & Enterprise Risk Management
David C. Moran
Executive Vice President, President & Chief Executive Officer, Heinz North America
C. Scott O’Hara
Executive Vice President, President & Chief Executive Officer, Heinz Europe
D. Edward I. Smyth
Chief Administrative Officer & Senior Vice President, Corporate & Government Affairs
Christopher J. Warmoth
Senior Vice President, Heinz Asia
Arthur B. Winkleblack
Executive Vice President & Chief Financial Officer
Presidents’ Council
Karen L. Alber
Vice President & Chief Information Officer
Stephen S. Clark
Chief People Officer
Stefano Clini
President, Heinz Italy
Nigel P. Comer
Managing Director, Heinz Watties New Zealand
Beth A. Eckenrode
Vice President & Chief Strategy Officer
Brendan M. FoleyPresident, U.S. Foodservice
Peter T. Luik
President & Chief Executive Officer, Heinz Canada
Jennifer K. McGurrin
Director, Office of the Chairman
Edward J. McMenamin
Senior Vice President, Finance & Corporate Controller
Daniel G. Milich
Vice President, Global Business Development
Margaret R. Nollen
Vice President, Investor Relations
Robert P. OstryniecGlobal Supply Chain Officer
Diane B. Owen
Vice President, Corporate Audit
Fernando Pocaterra
Area Director, Latin America & Caribbean
Mitchell A. Ring
Senior Vice President, Business Development
Roel van Neerbos
President, Heinz Continental Europe
Peter Widdows
Managing Director, Heinz Australia
David C. Woodward
President, Heinz UK & Ireland

8/3/2019 2008HeinzAR
http://slidepdf.com/reader/full/2008heinzar 108/108