Embed Size (px)
Citation preview
Estructura y dinámica dE la matEria orgánica dEl suElo En EcosistEmas forEstalEs tEmplados:
dE lo particular a lo gEnEral
TESIS DOCTORALES N.º 61
Vitoria-Gasteiz, 2009
Nahia Gartzia Bengoetxea
Universidad del País vasco
Edición: 1.ª julio 2009
Tirada: 40 ejemplares
© Administración de la Comunidad Autónoma del País Vasco Departamento de Agricultura, Pesca y Alimentación
Internet: www.euskadi.net
Edita: Eusko Jaurlaritzaren Argitalpen Zerbitzu Nagusia Servicio Central de Publicaciones del Gobierno Vasco Donostia-San Sebastián, 1 - 01010 Vitoria-Gasteiz
Impresión: Eusko Printing Service, S.L. www.eps-grupo.com
ISBN: 978-84-457-2960-1
D. L.: VI 275-2009
Un registro bibliográfico de esta obra puede consultarse en el catálogo de la Biblioteca General del Gobierno Vasco: <http://www.euskadi.net/ejgvbiblioteka>.
Zuzendaria: ANDER GONZALEZ ARIAS doktorea Baso-ekosistemetan ikertzailea Landare Babesa eta Ekoizpena Saila NEIKER-Tecnalia
EUSKAL HERRIKO UNIBERTSITATEA Zientzia eta Teknologia Falkultatea
Leioa, 2008

Etxekoentzat Mendian lar artean aurkitzen da loretxo bat, aurrian umetxo bat loretxoari begira, loreak esan nahi dio, umetxo aska nazazu, jaio naiz libre izateko eta ez loturik egoteko. Umetxoak ikusirik lorea ezin bizirik, arantzak kendu nahi dizkio bizi berri bat eman, orduan izango bait du indarra eta kemena, orduan emango bait du ugari bere fruitua.
Benito Lertxundi

Esker ona
Eskerrak helmugara iritsi naizen! Mendi maratoi hau hasi nuenean helmuga non zegoen ere ez nekien eta berau aurkitzeko jende askok GPS moduan funtzionatu izan du. Lehendabizi, Ander eta Inaziori bide luze honetan, hasieratik amaierara nire ondoan egotea eskertzen diet eta mendi malkartsuenetan motxilako pisua elkarbanatzen laguntzea. Eta noski, DAPAri motxila janariz betetzea ere eskertu behar diot. Mendi martxa honetan, jende askok bidearen zati bat egiten lagundu izan dit eta egia esan, beraien laguntza behar-beharrezkoa izan da etapa bat bestearekin lotzeko. NEIKEReko lantalde osoari eskerrak zientziaren mundu zabala lurreratzen laguntzearren, eta batez ere Martari eskerrak lurzoru kimika pixkat ulergarriagoa egiten saiatzearren. Nafarroako Edafologia saileko Marijo, Iñigo, Paloma eta Albertori ere mila esker lurzoru fisikaren ateak zabaltzearren, Hohenheim unibertsitateko biologia saileko guztientzat nire esker ona lurzoru biologiaren mamia erakustearren, eta Macaulay Institute-ko Clare Cameroni eskerrak nire arazo guztiak konpontzeko beti prest egotearren. Honelako bideetan, egunerokotasuna batzutan gogorra izaten da, eta nire bulegokokideek eta baita laborategikideek ere pisu hau arintasunez eta sarri alaitasunez eramaten lagundu didate. Horregatik, mila esker Oscar, Ainara, Lur, Iker, Goio, Arrate, Aitor, Lidia eta Estiri batik bat, nahiz eta ziur beste hainbeste ahazten ditudan. Baina, Fernandok egunerokotasuna baino beste gauza batzuk ere erraztu izan dizkit eta bere izateko era berezi horrek ikuspuntu ezberdinak ulertzen lagundu izan dit, dena ez da beltza edo zuria, ezta Fernando? Baina mendiko botek egin dizkidaten babak eta eguzkiak egin dizkidan erredurak osatzen lagundu didatenak etxekoak izan dira. Aita, ama, Aiora eta Axier, eskerrak zauri guzti horiek osatuta dauden gaur, nahiz eta orbain bat baino gehiago utzi duten. Eta noski, Haritz zu niretzat etxekoa zara, baba bat baino gehiago osatu duzulako. Zuek, nik bezain besteko poztasuna sentitzen duzue helmugara iritsi garen egun honetan. Baina hitzez adierazi ezin dudan eskerrona zuretzat da Aitzol, sarri nire pisu osoa eutsi behar izan duzulako eta beti zutitzen lagundu izan nauzulako. Beraz, gaur denontzat da kamiseta, lortu dugu!

1. INTRODUCCIÓN ...........................................................................................................21
1.2. LOS BOSQUES DE ZONAS DE CLIMA TEMPLADO DEL PAÍS VASCO .................................23 1.2.1. CARACTERÍSTICAS EDÁFICAS DE LOS BOSQUES DE ZONAS DE CLIMA TEMPLADO DEL PAÍS VASCO .......................................................................................................................................24 1.2.2. GESTIÓN FORESTAL EN LA ZONA DE CLIMA TEMPLADO DEL PAÍS VASCO......................26 1.2.3. EFECTO DE LOS DISTINTOS TIPOS DE GESTIÓN FORESTAL EN EL SISTEMA EDÁFICO .......28 1.3. LA SOSTENIBILIDAD DE LOS SUELOS FORESTALES .........................................................30 1.3.1. FERTILIDAD, CALIDAD Y SALUD DEL SUELO..................................................................30 1.3.2. INDICADORES DE CALIDAD DEL SUELO ..........................................................................31 1.3.3. LA MATERIA ORGÁNICA DEL SUELO: LA ESENCIA DE LA CALIDAD DEL SUELO ............32 1.3.4. CANTIDAD Y CALIDAD DE LA MATERIA ORGÁNICA.......................................................33 1.3.5. ESTABILIZACIÓN DE LA MATERIA ORGÁNICA ................................................................34 1.3.6. LAS FRACCIONES DE LA MATERIA ORGÁNICA COMO INDICADORES DE SOSTENIBILIDAD DE LOS SUELOS FORESTALES. .........................................................................................................37 1.3.7. PERSPECTIVA PRACTICA: INFLUENCIA DE LAS ACTIVIDADES FORESTALES EN LA MO...38 1.4. BIBLIOGRAFÍA...................................................................................................................41
2. OBJETIVES.....................................................................................................................51
3. CHARACTERIZATION OF FOREST FLOOR IN ADJACENT TEMPERATE FORESTS: EFFECTS OF FOREST ACTIVITIES ............................................................57
3.1. INTRODUCTION .................................................................................................................59 3.2. MATERIALS AND METHODS ..............................................................................................60 3.2.1. FOREST FLOOR SAMPLING ...............................................................................................60 3.2.2. FOREST FLOOR CHEMICAL, BIOCHEMICAL AND MOISTURE ANALYSIS ............................61 3.2.3. SOLID-STATE 13CP MASS NMR SPECTROSCOPY ...........................................................62 3.2.4. FOREST FLOOR MICROBIAL COMMUNITY ACTIVITY AND QUANTITY...............................62 3.2.5. FOREST FLOOR MICROBIAL COMMUNITY DIVERSITY ......................................................63 3.2.6. STATISTICAL ANALYSIS...................................................................................................63 3.3. RESULTS ............................................................................................................................64 3.3.1. FOREST FLOOR MASS, CHEMICAL AND BIOCHEMICAL PROPERTIES.................................64 3.3.2. SOLID-STATE 13CPMASS NMR SPECTROSCOPY ............................................................65 3.3.3. FOREST FLOOR MICROBIAL BIOMASS AND C MINERALIZATION......................................69 3.3.4. DIVERSITY OF FOREST FLOOR MICROBIAL COMMUNITY .................................................70 3.3.5. RELATIONSHIP BETWEEN CARBON MINERALIZATION RATES, LITTER QUALITY AND MICROBIAL COMMUNITY ...........................................................................................................74 3.4. DISCUSSION .......................................................................................................................75 3.4.1. EFFECT OF TREE SPECIES ON FOREST FLOOR DYNAMICS .................................................75 3.4.2. EFFECT OF MANAGEMENT IN PINE FORESTS ....................................................................76 3.5. CONCLUSIONS ...................................................................................................................77 3.6. REFERENCES .....................................................................................................................78
4. POTENTIAL INDICATORS OF SOIL QUALITY FOR TEMPERATE FOREST ECOSYSTEMS: A CASE STUDY IN THE BASQUE COUNTRY...................................83
4.1. INTRODUCTION .................................................................................................................85 4.2. MATERIALS AND METHODS .............................................................................................87 4.2.1. SITE DESCRIPTION ...........................................................................................................87 4.2.2. SOIL SAMPLING................................................................................................................88
4.2.3. CHEMICAL PROPERTIES ...................................................................................................88 4.2.4. BIOLOGICAL PROPERTIES ................................................................................................89 4.2.5. PHYSICAL PROPERTIES ....................................................................................................90 4.2.6. STATISTICAL ANALYSIS...................................................................................................91 4.3. RESULTS ............................................................................................................................91 4.3.1. CHEMICAL SOIL PROPERTIES ...........................................................................................91 4.3.2.BIOLOGICAL SOIL PROPERTIES .........................................................................................93 4.3.3. PHYSICAL SOIL PROPERTIES ............................................................................................95 4.3.4. IDENTIFYING SOIL KEY PROPERTIES ................................................................................98 4.4. DISCUSSION .....................................................................................................................100 4.4.1. DEPTH EFFECT ON SOIL PROPERTIES..............................................................................100 4.4.2. EFFECT OF TREE SPECIES ON SOIL PROPERTIES .............................................................100 4.4.3. LOGGING EFFECT ON SOIL PROPERTIES .........................................................................101 4.4.4. IDENTIFYING SOIL KEY PROPERTIES ..............................................................................103 4.5. CONCLUSIONS .................................................................................................................103 4.6. REFERENCES ...................................................................................................................104
5. SOIL ORGANIC MATTER IN SOIL PHYSICAL FRACTIONS IN ADJACENT SEMINATURAL AND CULTIVATED FORESTS IN THE BASQUE COUNTRY .....111
5.1. INTRODUCTION ...............................................................................................................113 5.2. MATERIALS AND METHODS ............................................................................................114 5.2.1. SITE DESCRIPTION .........................................................................................................114 5.2.2. SOIL SAMPLING..............................................................................................................113 5.2.3. SOIL ANALYSIS ..............................................................................................................114 5.2.4. AGGREGATE-SIZE DISTRIBUTION ..................................................................................115 5.2.5. SOIL ORGANIC MATTER AND PARTICULATE ORGANIC MATTER..................................115 5.2.6. MINERALIZABLE C AND N ............................................................................................116 5.2.7. MICROBIAL BIOMASS CARBON ......................................................................................116 5.2.8. STATISTICAL ANALYSES................................................................................................116 5.3. RESULTS ..........................................................................................................................117 5.3.1. DISTRIBUTION OF SOIL AGGREGATE FRACTIONS...........................................................117 5.3.2. SOIL ORGANIC MATTER IN SOIL PHYSICAL FRACTIONS ................................................118 5.3.3. PARTICULATE ORGANIC MATTER IN SOIL PHYSICAL FRACTIONS .................................121 5.3.4. MINERALIZABLE C AND N AND MICROBIAL BIOMASS C IN SOIL PHYSICAL FRACTIONS121 5.4. DISCUSSION .....................................................................................................................124 5.4.1. SOIL AGGREGATES AND SOIL ORGANIC MATTER...........................................................124 5.4.2. SOIL AGGREGATE C AND DYNAMICS.............................................................................125 5.5. CONCLUSIONS .................................................................................................................126 5.6. REFERENCES ...................................................................................................................127
6. LANDSCAPE-LEVEL PATTERNS OF SOIL MICROBIAL COMMUNITY LEVEL PHYSIOLOGICAL PROFILES IN TEMPERATE FOREST ECOSYSTEMS.............131
6.1. INTRODUCTION ...............................................................................................................133 6.2. MATERIALS AND METHODS ...........................................................................................134 6.2.1. SITES AND SAMPLING ....................................................................................................134 6.2.2. FOREST FLOOR ANALYSES.............................................................................................135 6.2.3. SOIL CHEMICAL AND PHYSICAL ANALYSES...................................................................135 6.2.4. MICRORESPTM ASSAY....................................................................................................136 6.2.5. STATISTICAL ANALYSES ................................................................................................137 6.3. RESULTS ..........................................................................................................................138

6.3.1. SOIL CHARACTERISTICS.................................................................................................138 6.3.2. FOREST FLOOR CHARACTERISTICS ................................................................................140 6.3.3. COMMUNITY LEVEL PHYSIOLOGICAL PROFILES (CLPP)...............................................141 6.3.4. RELATIONSHIPS BETWEEN FOREST FLOOR, SOIL AND MICROBIAL UTILIZATION PATTERNS.................................................................................................................................................144 6.4. DISCUSSION .....................................................................................................................144 6.5. CONCLUSIONS .................................................................................................................147 6.6. REFERENCES ...................................................................................................................148
7. CONCLUSIONES GENERALES................................................................................153
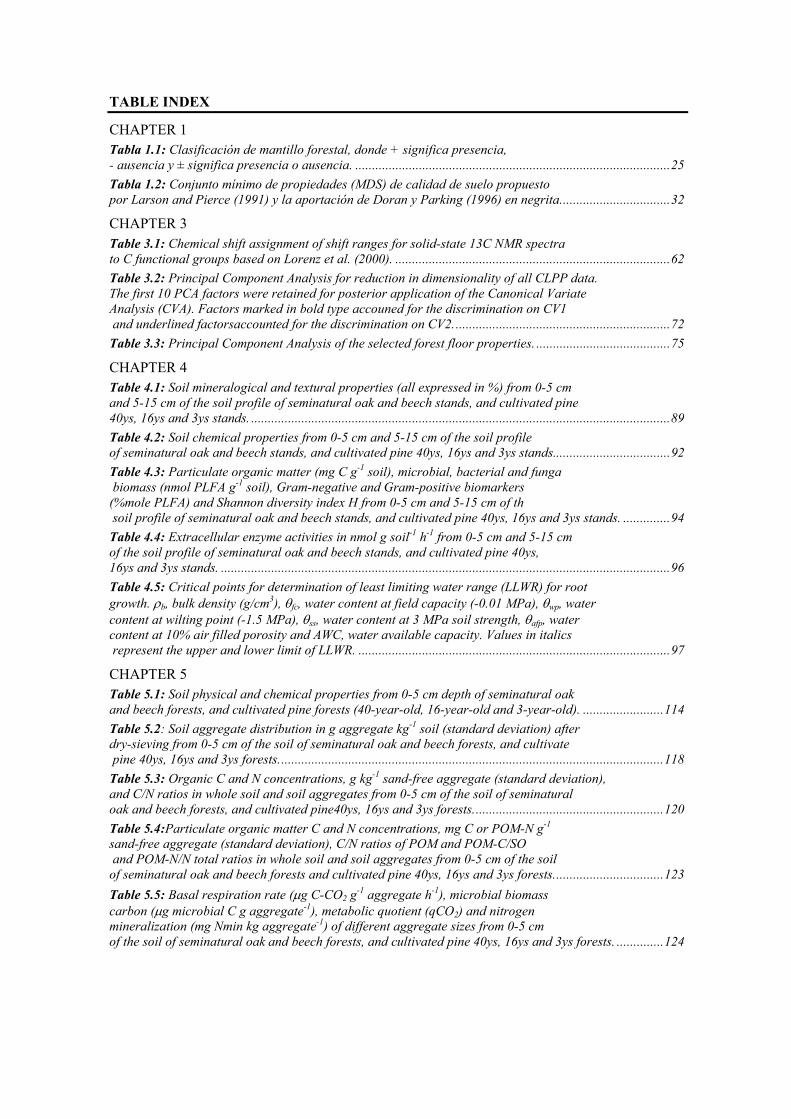
TABLE INDEX
CHAPTER 1 Tabla 1.1: Clasificación de mantillo forestal, donde + significa presencia, - ausencia y ± significa presencia o ausencia. ..............................................................................................25 Tabla 1.2: Conjunto mínimo de propiedades (MDS) de calidad de suelo propuesto por Larson and Pierce (1991) y la aportación de Doran y Parking (1996) en negrita.................................32 CHAPTER 3 Table 3.1: Chemical shift assignment of shift ranges for solid-state 13C NMR spectra to C functional groups based on Lorenz et al. (2000). ..................................................................................62 Table 3.2: Principal Component Analysis for reduction in dimensionality of all CLPP data. The first 10 PCA factors were retained for posterior application of the Canonical Variate Analysis (CVA). Factors marked in bold type accouned for the discrimination on CV1 and underlined factorsaccounted for the discrimination on CV2.................................................................72 Table 3.3: Principal Component Analysis of the selected forest floor properties. ........................................75 CHAPTER 4 Table 4.1: Soil mineralogical and textural properties (all expressed in %) from 0-5 cm and 5-15 cm of the soil profile of seminatural oak and beech stands, and cultivated pine 40ys, 16ys and 3ys stands. .............................................................................................................................89 Table 4.2: Soil chemical properties from 0-5 cm and 5-15 cm of the soil profile of seminatural oak and beech stands, and cultivated pine 40ys, 16ys and 3ys stands...................................92 Table 4.3: Particulate organic matter (mg C g-1 soil), microbial, bacterial and funga biomass (nmol PLFA g-1 soil), Gram-negative and Gram-positive biomarkers (%mole PLFA) and Shannon diversity index H from 0-5 cm and 5-15 cm of th soil profile of seminatural oak and beech stands, and cultivated pine 40ys, 16ys and 3ys stands. ..............94 Table 4.4: Extracellular enzyme activities in nmol g soil-1 h-1 from 0-5 cm and 5-15 cm of the soil profile of seminatural oak and beech stands, and cultivated pine 40ys, 16ys and 3ys stands. ......................................................................................................................................96 Table 4.5: Critical points for determination of least limiting water range (LLWR) for root growth. ρb, bulk density (g/cm3), θfc, water content at field capacity (-0.01 MPa), θwp, water content at wilting point (-1.5 MPa), θss, water content at 3 MPa soil strength, θafp, water content at 10% air filled porosity and AWC, water available capacity. Values in italics represent the upper and lower limit of LLWR. .............................................................................................97 CHAPTER 5 Table 5.1: Soil physical and chemical properties from 0-5 cm depth of seminatural oak and beech forests, and cultivated pine forests (40-year-old, 16-year-old and 3-year-old). ........................114 Table 5.2: Soil aggregate distribution in g aggregate kg-1 soil (standard deviation) after dry-sieving from 0-5 cm of the soil of seminatural oak and beech forests, and cultivate pine 40ys, 16ys and 3ys forests...................................................................................................................118 Table 5.3: Organic C and N concentrations, g kg-1 sand-free aggregate (standard deviation), and C/N ratios in whole soil and soil aggregates from 0-5 cm of the soil of seminatural oak and beech forests, and cultivated pine40ys, 16ys and 3ys forests.........................................................120 Table 5.4:Particulate organic matter C and N concentrations, mg C or POM-N g-1 sand-free aggregate (standard deviation), C/N ratios of POM and POM-C/SO and POM-N/N total ratios in whole soil and soil aggregates from 0-5 cm of the soil of seminatural oak and beech forests and cultivated pine 40ys, 16ys and 3ys forests.................................123 Table 5.5: Basal respiration rate (μg C-CO2 g-1 aggregate h-1), microbial biomass carbon (μg microbial C g aggregate-1), metabolic quotient (qCO2) and nitrogen mineralization (mg Nmin kg aggregate-1) of different aggregate sizes from 0-5 cm of the soil of seminatural oak and beech forests, and cultivated pine 40ys, 16ys and 3ys forests. ..............124

CHAPTER 6 Table 6.1: Analysis of variance results for the effects of tree species on physical and chemical properties of soil layers (0-30 cm and 30-60 cm depth). Values are means ± standard error. ........................................................................................................................139 Table 6.2: Analysis of variance results for the effects of tree species on forest floor properties. Values are means ± standard error. ............................................................................................................140 Table 6.3: Correlation matrix between CLPP responses (C substrate groups), forest floor properties and soil physico-chemical properties in 0-30 cm soillayer........................................................................................................................................................ 184
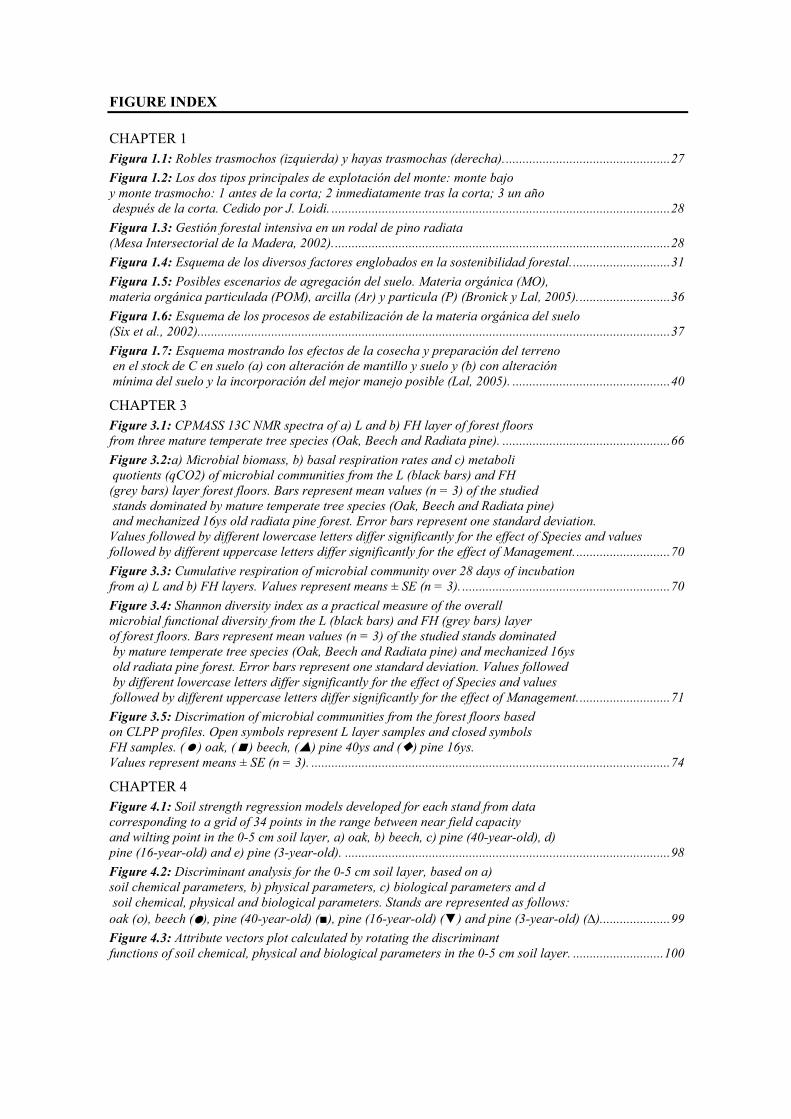
FIGURE INDEX CHAPTER 1 Figura 1.1: Robles trasmochos (izquierda) y hayas trasmochas (derecha)..................................................27 Figura 1.2: Los dos tipos principales de explotación del monte: monte bajo y monte trasmocho: 1 antes de la corta; 2 inmediatamente tras la corta; 3 un año después de la corta. Cedido por J. Loidi. .....................................................................................................28 Figura 1.3: Gestión forestal intensiva en un rodal de pino radiata (Mesa Intersectorial de la Madera, 2002).....................................................................................................28 Figura 1.4: Esquema de los diversos factores englobados en la sostenibilidad forestal..............................31 Figura 1.5: Posibles escenarios de agregación del suelo. Materia orgánica (MO), materia orgánica particulada (POM), arcilla (Ar) y particula (P) (Bronick y Lal, 2005)............................36 Figura 1.6: Esquema de los procesos de estabilización de la materia orgánica del suelo (Six et al., 2002).............................................................................................................................................37 Figura 1.7: Esquema mostrando los efectos de la cosecha y preparación del terreno en el stock de C en suelo (a) con alteración de mantillo y suelo y (b) con alteración mínima del suelo y la incorporación del mejor manejo posible (Lal, 2005). ...............................................40 CHAPTER 3 Figure 3.1: CPMASS 13C NMR spectra of a) L and b) FH layer of forest floors from three mature temperate tree species (Oak, Beech and Radiata pine). ..................................................66 Figure 3.2:a) Microbial biomass, b) basal respiration rates and c) metaboli quotients (qCO2) of microbial communities from the L (black bars) and FH (grey bars) layer forest floors. Bars represent mean values (n = 3) of the studied stands dominated by mature temperate tree species (Oak, Beech and Radiata pine) and mechanized 16ys old radiata pine forest. Error bars represent one standard deviation. Values followed by different lowercase letters differ significantly for the effect of Species and values followed by different uppercase letters differ significantly for the effect of Management.............................70 Figure 3.3: Cumulative respiration of microbial community over 28 days of incubation from a) L and b) FH layers. Values represent means ± SE (n = 3). ..............................................................70 Figure 3.4: Shannon diversity index as a practical measure of the overall microbial functional diversity from the L (black bars) and FH (grey bars) layer of forest floors. Bars represent mean values (n = 3) of the studied stands dominated by mature temperate tree species (Oak, Beech and Radiata pine) and mechanized 16ys old radiata pine forest. Error bars represent one standard deviation. Values followed by different lowercase letters differ significantly for the effect of Species and values followed by different uppercase letters differ significantly for the effect of Management............................71 Figure 3.5: Discrimation of microbial communities from the forest floors based on CLPP profiles. Open symbols represent L layer samples and closed symbols FH samples. ( ) oak, ( ) beech, ( ) pine 40ys and ( ) pine 16ys. Values represent means ± SE (n = 3). ...........................................................................................................74 CHAPTER 4 Figure 4.1: Soil strength regression models developed for each stand from data corresponding to a grid of 34 points in the range between near field capacity and wilting point in the 0-5 cm soil layer, a) oak, b) beech, c) pine (40-year-old), d) pine (16-year-old) and e) pine (3-year-old). .................................................................................................98 Figure 4.2: Discriminant analysis for the 0-5 cm soil layer, based on a) soil chemical parameters, b) physical parameters, c) biological parameters and d soil chemical, physical and biological parameters. Stands are represented as follows: oak (ο), beech (●), pine (40-year-old) (■), pine (16-year-old) (▼) and pine (3-year-old) (∆).....................99 Figure 4.3: Attribute vectors plot calculated by rotating the discriminant functions of soil chemical, physical and biological parameters in the 0-5 cm soil layer. ...........................100
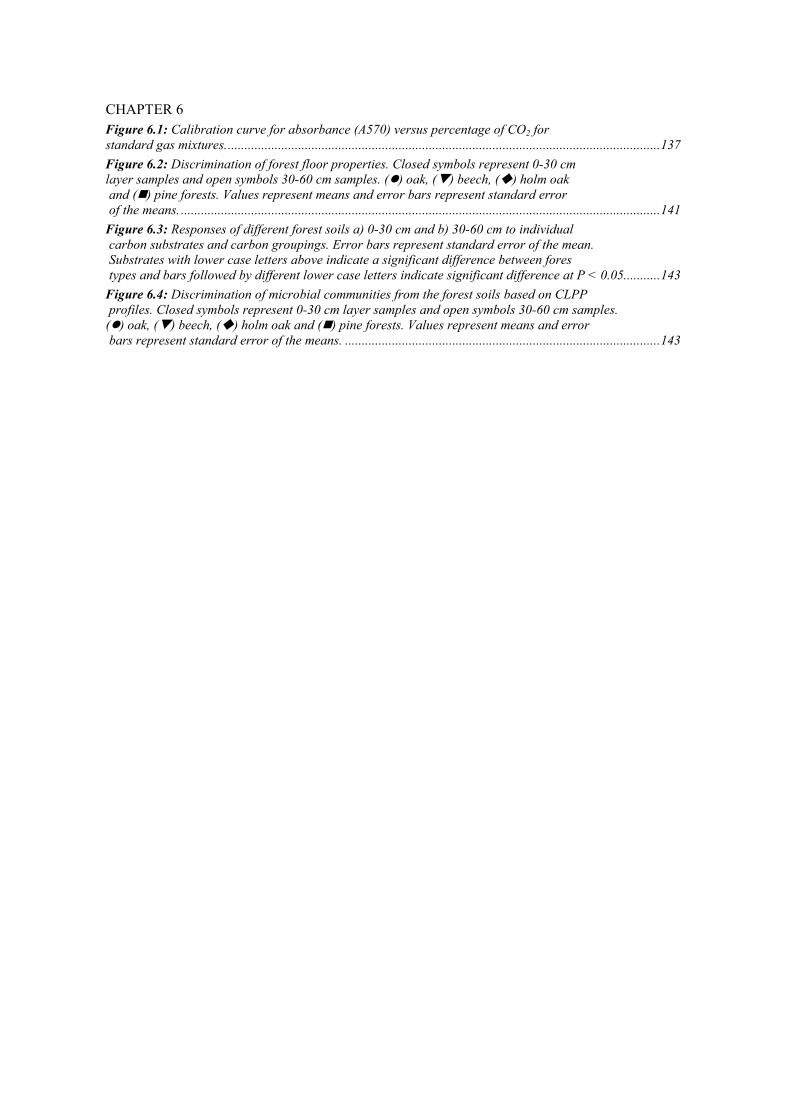
CHAPTER 6 Figure 6.1: Calibration curve for absorbance (A570) versus percentage of CO2 for standard gas mixtures..................................................................................................................................137 Figure 6.2: Discrimination of forest floor properties. Closed symbols represent 0-30 cm layer samples and open symbols 30-60 cm samples. ( ) oak, ( ) beech, ( ) holm oak and ( ) pine forests. Values represent means and error bars represent standard error of the means. ...............................................................................................................................................141 Figure 6.3: Responses of different forest soils a) 0-30 cm and b) 30-60 cm to individual carbon substrates and carbon groupings. Error bars represent standard error of the mean. Substrates with lower case letters above indicate a significant difference between fores types and bars followed by different lower case letters indicate significant difference at P < 0.05...........143 Figure 6.4: Discrimination of microbial communities from the forest soils based on CLPP profiles. Closed symbols represent 0-30 cm layer samples and open symbols 30-60 cm samples. ( ) oak, ( ) beech, ( ) holm oak and ( ) pine forests. Values represent means and error bars represent standard error of the means. ..............................................................................................143


1. Introducción

21
1.1. Background La conferencia de las Naciones Unidas sobre Medio Ambiente y Desarrollo Sostenible celebrada
en Río de Janeiro en 1992 conocida como Cumbre de la Tierra hizo hincapié en que el desarrollo
sostenible y la gestión sostenible del medio ambiente marchaban a la par. La Declaración de los
principios para la ordenación sostenible de los bosques, sin fuerza jurídica obligatoria, constituyó
el primer intento global en el logro de criterios para el consenso sobre el manejo, conservación y
desarrollo sostenible de los bosques.
En relación a esta declaración, las naciones se comprometieron a promover la gestión forestal
sostenible en sus países. Esto incluye la identificación y la monitorización de funciones
ecosistémicas relacionadas con la producción, biodiversidad, capacidad de regeneración, vitalidad
y protección de suelo y agua, siendo objetivo de la sostenibilidad el mantenimiento de estas
funciones ahora y en el futuro a escala local, nacional y global, sin causar perjuicios a otros
ecosistemas (MCPFE, 1993).
Basados en este compromiso, el instituto europeo del bosque cultivado (IEFC), en colaboración
con los diferentes gobiernos regionales, centros de desarrollo regional y centros de investigación,
inicia un programa de investigación en 2003 titulado Red de zonas piloto para evaluar y mejorar a
nivel regional los indicadores de gestión forestal sostenible en los bosques atlánticos del sur de
Europa (FORSEE) (http://www.iefc.net).
El objetivo era el estudio interdisciplinar de las metodologías y capacidades para la evaluación,
seguimiento y la promoción de la gestión sostenible de los bosques del sur de Europa. Uno de los
objetivos específicos de esta investigación era la aportación de nuevos conocimientos para la
mejora de indicadores de gestión forestal sostenible adaptados a las necesidades de las diferentes
regiones.
En el País Vasco, la gestión forestal intensiva de plantaciones de coníferas puede incidir
fuertemente en los ecosistemas edáficos, por lo que se planteó un estudio específico sobre la
gestión del suelo. El suelo es un recurso no renovable que soporta el desarrollo de la vegetación,
provee nutrientes, agua y aire a las raíces de las plantas y determina fuertemente la productividad.
La productividad es un componente básico de los ecosistemas, que condiciona su funcionamiento
y el conjunto de bienes y servicios que puede proveer. Condiciona así su dinámica natural y su
respuesta a los modelos de gestión. Por ello, el uso sostenible del suelo es un elemento central de
la gestión forestal sostenible.
La estrategia temática europea para la protección del suelo considera la materia orgánica del suelo
como factor clave en el mantenimiento de las funciones del suelo a largo plazo, ya que cumple
ESTRUCTURA Y DINÁMICA DE LA MATERIA ORGÁNICA DEL SUELO EN ECOSISTEMAS FORESTALES TEMPLADOS…
22
funciones esenciales en la estructura y estabilidad del suelo, en su fertilidad y su capacidad de
retención de agua, además de aumentar su resistencia a la erosión y de contribuir a evitar la
contaminación de los cursos de agua, gracias a su papel de filtro natural (EC, 2006).
El trabajo presentado en esta tesis es parte del estudio específico del FORSEE focalizado en la
caracterización de la estructura y dinámica de la materia orgánica en ecosistemas forestales
seminaturales y cultivados, la evaluación de los efectos de las prácticas silvícolas intensivas en las
diferentes fracciones de la materia orgánica y la exploración de nuevos parámetros como
indicadores sensibles de los cambios en el funcionamiento del los suelos. La tesis se titula:
"Estructura y dinámica de la materia orgánica en ecosistemas forestales templados: de lo
particular a lo general”.
1. INTRODUCCIÓN
23
1.2. Los bosques de zonas de clima templado del País Vasco
El País Vasco se caracteriza por tener dos regiones biogeográficas; en el norte la eurosiberiana y
en el sur la mediterránea. La zona eurosiberiana, que coincide con la vertiente atlántica del país,
es un territorio bajo un clima templado húmedo según la clasificación de Koeppen-Geiger-Pohl,
situado en el extremo sur del bioma de los bosques templados. Presenta unas condiciones
climáticas de extrema atlanticidad con veranos poco calurosos e inviernos poco fríos (la variación
anual es de 8 y 13 ºC) y unas altas precipitaciones (900-2000 mm) que se distribuyen por todas las
estaciones del año con un mínimo en verano que no llega a causar un déficit severo de agua o
sequía. La constante entrada de borrascas atlánticas, con sus frentes asociados, y la proximidad de
la corriente del Golfo de Bizkaia que caldea las aguas, determinan las condiciones básicas que
gobiernan el clima de la zona templada del País Vasco. Es un clima con poca severidad.
Este clima que permite aproximadamente 6 meses de estación de crecimiento desarrolla una
vegetación natural dominada por bosques de robles y hayas con notas puntuales de encinas o
marojos (Aseginolaza et al., 1996). Los bosques de roble pedunculado (Quercus robur L.) pueden
ser acidófilos o éutrofos y se desarrollan en todo el piso colino, hasta 600 m de altitud. Tienen una
transpiración elevada por lo que requieren una precipitación superior a 600 mm anuales de los
cuales 200 mm han de ser en verano. El robledal acidófilo que ocupa preferentemente suelos de
ladera comparte su presencia con el castaño (Castanea sativa L.) cediendo el paso a la aliseda
(Alnus glutinosa L.) en los fondos de valle. El robledal éutrofo, por otro lado, ocupa las vegas de
los valles con suelos profundos, ricos en nutrientes y que se encharcan temporalmente. Los
robledales comparten el piso colino con los encinares (Quercus ilex L.) que siendo bosques
típicamente mediterráneos destacan puntualmente en los valles atlánticos. El encinar cantábrico es
un relicto del terciario, con climas muy próximos al del litoral mediterráneo actual. Sin embargo,
en épocas desfavorables se ha acantonado en los ambientes más próximos a aquellas condiciones
y donde no ha encontrado competidores: laderas calizas soleadas con fuertes pendientes y suelos
esqueléticos, secos por escorrentía y fácil drenaje. La zona baja del piso montano (600-900 m) por
otra parte, es pleno dominio del hayedo (Fagus sylvatica L.), acidófilo sobre montañas silíceas y
calcícola sobre montes calizos. Las hayas requieren además de una elevada pluviosidad una
humedad ambiental también elevada por lo que en sitios menos propicios son sustituidos por el
marojo (Quercus pyrenaica L.).
Sin embargo, para satisfacer la demanda de las poblaciones, la mayor parte de los países
templados incluido el País Vasco han modelado su paisaje convirtiendo sus bosques naturales a
usos agrícolas, a plantaciones forestales productivas, a viviendas o a infraestructuras.
Actualmente, las plantaciones de coníferas y en particular de pino insigne juegan un papel de
ESTRUCTURA Y DINÁMICA DE LA MATERIA ORGÁNICA DEL SUELO EN ECOSISTEMAS FORESTALES TEMPLADOS…
24
primer orden en la zona de clima templado del País Vasco. Según el Inventario Forestal Nacional
del 2005 el pino insigne ocupa alrededor de 140.000 ha en la vertiente atlántica de la Comunidad
Autónoma del País Vasco, es decir, el 55 % de la superficie forestal de dicha vertiente. Los
bosques de vegetación natural tales como el roble o el haya han sido relegados a enclaves
dispersos y ocupan actualmente 20.000 y 15.000 ha respectivamente (IFN, 2005).
1.2.1. Características edáficas de los bosques de zonas de clima templado del País Vasco
El suelo es un medio heterogéneo y dinámico que acoge una gran variedad de nichos ecológicos
que difieren en propiedades físicas, químicas y biológicas. Sus características y propiedades
dependen de la acción de agentes abióticos y bióticos actuando sobre un material litológico,
acondicionado por el relieve y drenaje durante un periodo de tiempo. Los componentes primarios
del suelo son (1) compuestos inorgánicos, principalmente aluminosilicatos, oxi-hidróxidos de Fe,
y carbonatos, (2) materia orgánica viva y muerta, raíces de las plantas y la biomasa de
microorganismos y animales, y residuos orgánicos en diferentes fases de descomposición, (3)
disolución del suelo y (4) una fase gaseosa (Killham, 1994). El material litológico puede estar
presente debajo del perfil como lecho rocoso (suelo residual) o puede ser originario de otro sitio
distinto al lugar donde se ha formado el suelo (suelo alóctono), estos últimos suelen ser muy
habituales en zonas montañosas con fuertes pendientes como la zona atlántica del País Vasco.
Los procesos que forman el suelo a partir de este material litológico son (i) meteorización
(alteración del material original) y (ii) edafogénesis (reorganización de los constituyentes del
suelo), siendo el agua uno de los factores más importantes que incide en dichos procesos
formativos (Camps-Arbestain et al., 2008). Dependiendo del comportamiento del agua se
diferencian tres tendencias de evolución de suelos: la tendencia ácida en condiciones percolantes,
la tendencia alcalina en ambientes con un déficit de agua debido a la elevada evapotranspiración y
la tendencia reductora en condiciones anaeróbicas (Chesworth, 2000). Dentro de la tendencia
ácida, los procesos de meteorización químicos predominantes en zonas de clima templado
húmedo son acidólisis, hidrólisis y descarbonatación (Macías y Chesworth, 1992).
Sin embargo, en este punto, el suelo forestal tiene unas características propias ya que la
vegetación arbórea incide en los procesos formativos del suelo mediante la actividad biológica. La
actividad radicular de los árboles ejerce una importante acción de meteorización física sobre el
material litológico para extraer los nutrientes necesarios para su ciclo vital. Además, en los suelos
forestales, la capa de mantillo (Horizonte O) desarrollada gracias a la densa cubierta vegetal y el
clima templado y húmedo cobra especial importancia ya que incorpora la mayor parte de los
compuestos orgánicos para los procesos edafogénicos del suelo y regula el régimen hídrico y
1. INTRODUCCIÓN
25
térmico gracias a su mulch natural. El mantillo desarrollado sobre los suelos forestales de este
clima puede clasificarse como mor, moder o mull según el grado de interacción organo-mineral y
la diversidad biológica (European Humus Research Group, 2004). En líneas generales, el mantillo
Mull (horizontes OL y OF) se caracteriza por tener un pH más alto que moder o mor por lo que
favorece un pH superior a 4.2 en el suelo. Estos valores por otra parte, favorecen la presencia de
la comunidad de lombrices que tiene una función incorporadora y mezcladora de la materia
orgánica y el suelo mineral. Bajo estas condiciones, se forma un horizonte Ah rico en materia
orgánica y complejos organo-minerales primarios (arcilla-humus) y secundarios (agregados) y
desaparece el horizonte OH del mantillo. La transición entre el horizonte orgánico y el suelo
mineral suele ser gradual. Al contrario, el mantillo Mor se caracteriza por su alto contenido de
ácidos orgánicos (e.g. ácidos fenólicos) por lo que suele ser habitual encontrar valores de pH
inferiores a 4.2 en el suelo y por debajo de estos valores la mayoría de los organismos evitan el
contacto con el suelo mineral por sus propiedades tóxicas (Graefe et al., 2002). De esta forma,
Mor se caracteriza por desarrollar un horizonte donde se acumulan los residuos vegetales sin
descomponer con escasa presencia de animales (horizontes OL y OM) y una transición abrupta
entre el horizonte orgánico y el suelo mineral. El mantillo Moder presenta unas características
intermedias, presenta una acumulación de la materia orgánica por la menor actividad de la fauna y
la biomasa microbiana es predominantemente fúngica por unas condiciones más ácidas que en el
mull que genera una biomasa microbiana predominantemente bacteriana (horizontes OL, OF y
OH) (Ponge et al., 2003). Comparándolo con mull y moder, la conservación de la materia
orgánica en mor está en su máximo y la disponibilidad de nutrientes en su mínimo (Aerts, 1995).
Los mantillos mull se encuentran principalmente en pastos y bosques caducifolios con un
sotobosque muy diverso, los moder principalmente en bosque caducifolios y coníferas con un
sotobosque menos diverso y los mor en prados de montaña con ericáceas. Sin embargo, algunas
coníferas pueden desarrollar un mantillo mor principalmente en severas condiciones climáticas
(Northup et al., 1998) o cuando han sido introducidos como especies exóticas (Nihlgard, 1971).
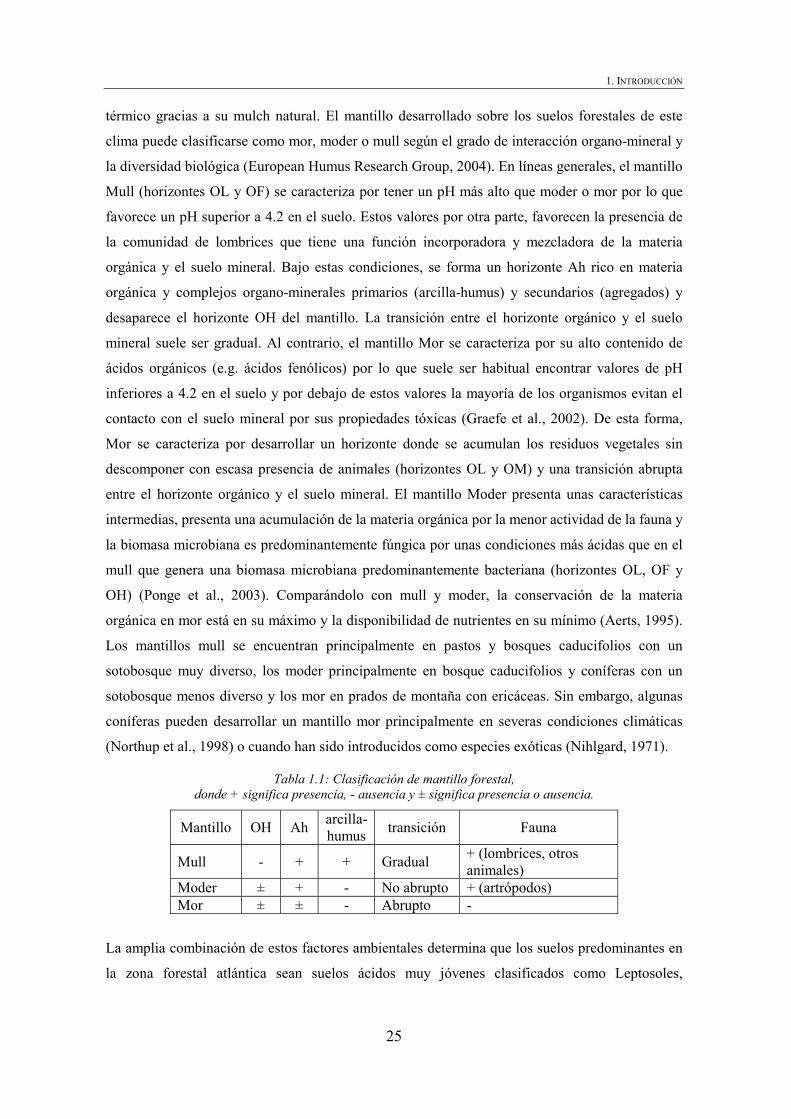
Tabla 1.1: Clasificación de mantillo forestal, donde + significa presencia, - ausencia y ± significa presencia o ausencia.
Mantillo OH Ah arcilla-humus transición Fauna
Mull - + + Gradual + (lombrices, otros animales)
Moder ± + - No abrupto + (artrópodos) Mor ± ± - Abrupto -
La amplia combinación de estos factores ambientales determina que los suelos predominantes en
la zona forestal atlántica sean suelos ácidos muy jóvenes clasificados como Leptosoles,
ESTRUCTURA Y DINÁMICA DE LA MATERIA ORGÁNICA DEL SUELO EN ECOSISTEMAS FORESTALES TEMPLADOS…
26
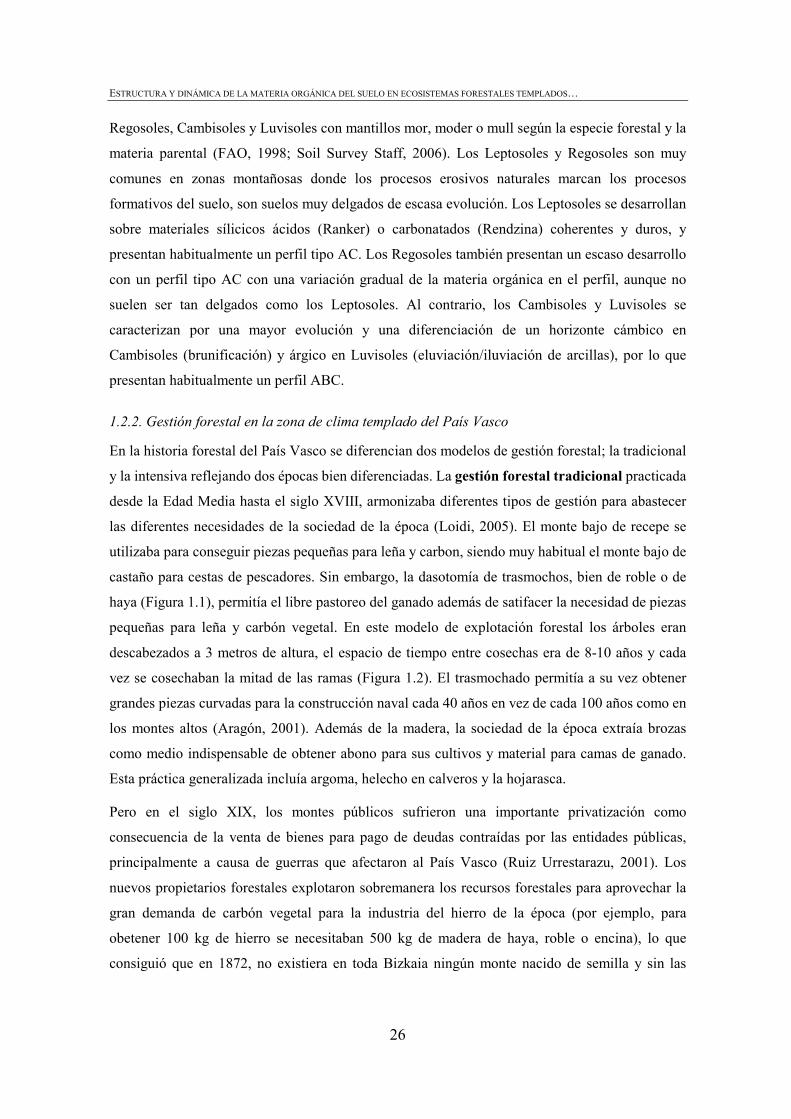
Regosoles, Cambisoles y Luvisoles con mantillos mor, moder o mull según la especie forestal y la
materia parental (FAO, 1998; Soil Survey Staff, 2006). Los Leptosoles y Regosoles son muy
comunes en zonas montañosas donde los procesos erosivos naturales marcan los procesos
formativos del suelo, son suelos muy delgados de escasa evolución. Los Leptosoles se desarrollan
sobre materiales sílicicos ácidos (Ranker) o carbonatados (Rendzina) coherentes y duros, y
presentan habitualmente un perfil tipo AC. Los Regosoles también presentan un escaso desarrollo
con un perfil tipo AC con una variación gradual de la materia orgánica en el perfil, aunque no
suelen ser tan delgados como los Leptosoles. Al contrario, los Cambisoles y Luvisoles se
caracterizan por una mayor evolución y una diferenciación de un horizonte cámbico en
Cambisoles (brunificación) y árgico en Luvisoles (eluviación/iluviación de arcillas), por lo que
presentan habitualmente un perfil ABC.
1.2.2. Gestión forestal en la zona de clima templado del País Vasco
En la historia forestal del País Vasco se diferencian dos modelos de gestión forestal; la tradicional
y la intensiva reflejando dos épocas bien diferenciadas. La gestión forestal tradicional practicada
desde la Edad Media hasta el siglo XVIII, armonizaba diferentes tipos de gestión para abastecer
las diferentes necesidades de la sociedad de la época (Loidi, 2005). El monte bajo de recepe se
utilizaba para conseguir piezas pequeñas para leña y carbon, siendo muy habitual el monte bajo de
castaño para cestas de pescadores. Sin embargo, la dasotomía de trasmochos, bien de roble o de
haya (Figura 1.1), permitía el libre pastoreo del ganado además de satifacer la necesidad de piezas
pequeñas para leña y carbón vegetal. En este modelo de explotación forestal los árboles eran
descabezados a 3 metros de altura, el espacio de tiempo entre cosechas era de 8-10 años y cada
vez se cosechaban la mitad de las ramas (Figura 1.2). El trasmochado permitía a su vez obtener
grandes piezas curvadas para la construcción naval cada 40 años en vez de cada 100 años como en
los montes altos (Aragón, 2001). Además de la madera, la sociedad de la época extraía brozas
como medio indispensable de obtener abono para sus cultivos y material para camas de ganado.
Esta práctica generalizada incluía argoma, helecho en calveros y la hojarasca.
Pero en el siglo XIX, los montes públicos sufrieron una importante privatización como
consecuencia de la venta de bienes para pago de deudas contraídas por las entidades públicas,
principalmente a causa de guerras que afectaron al País Vasco (Ruiz Urrestarazu, 2001). Los
nuevos propietarios forestales explotaron sobremanera los recursos forestales para aprovechar la
gran demanda de carbón vegetal para la industria del hierro de la época (por ejemplo, para
obetener 100 kg de hierro se necesitaban 500 kg de madera de haya, roble o encina), lo que
consiguió que en 1872, no existiera en toda Bizkaia ningún monte nacido de semilla y sin las
1. INTRODUCCIÓN
27
copas sin desmochar (Michel, 2003). Además, los bosques sufrían una crisis funcional por la
morfología de los árboles, tenían una escasa regeneración y estaban sometidos a servidumbres.
Estos hechos dieron paso a una alternativa a la actividad forestal tradicional en crisis.
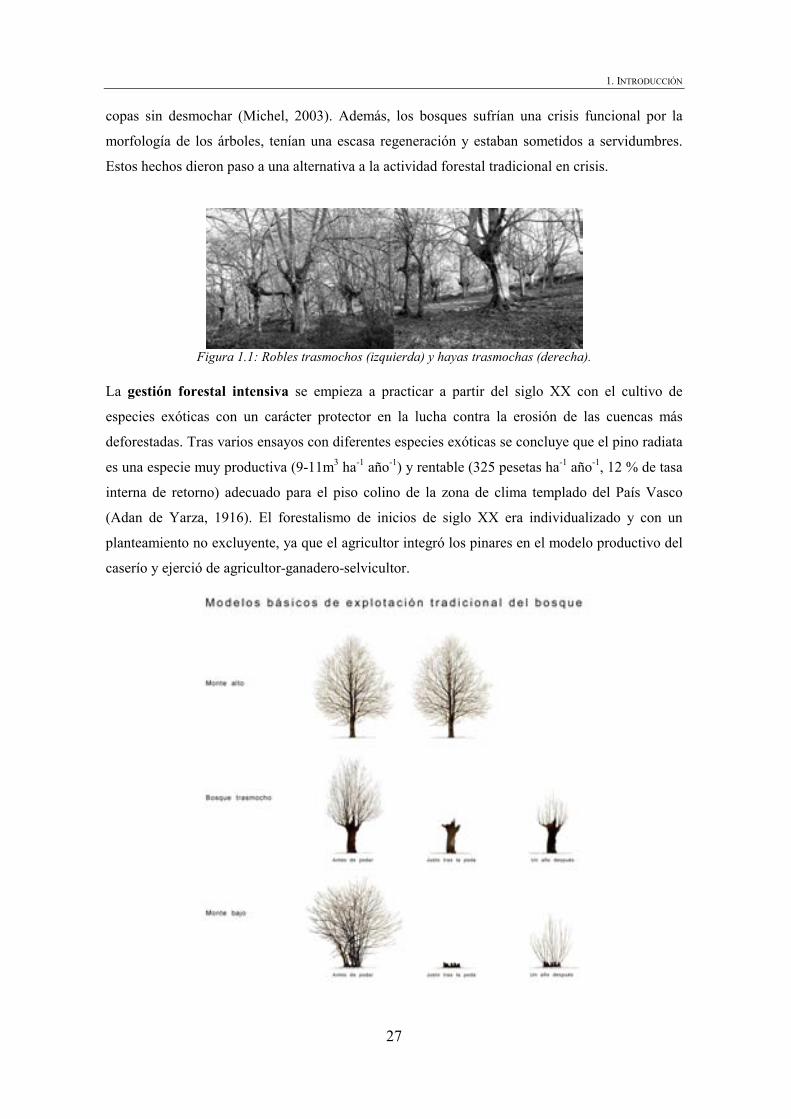
Figura 1.1: Robles trasmochos (izquierda) y hayas trasmochas (derecha).
La gestión forestal intensiva se empieza a practicar a partir del siglo XX con el cultivo de
especies exóticas con un carácter protector en la lucha contra la erosión de las cuencas más
deforestadas. Tras varios ensayos con diferentes especies exóticas se concluye que el pino radiata
es una especie muy productiva (9-11m3 ha-1 año-1) y rentable (325 pesetas ha-1 año-1, 12 % de tasa
interna de retorno) adecuado para el piso colino de la zona de clima templado del País Vasco
(Adan de Yarza, 1916). El forestalismo de inicios de siglo XX era individualizado y con un
planteamiento no excluyente, ya que el agricultor integró los pinares en el modelo productivo del
caserío y ejerció de agricultor-ganadero-selvicultor.
ESTRUCTURA Y DINÁMICA DE LA MATERIA ORGÁNICA DEL SUELO EN ECOSISTEMAS FORESTALES TEMPLADOS…
28
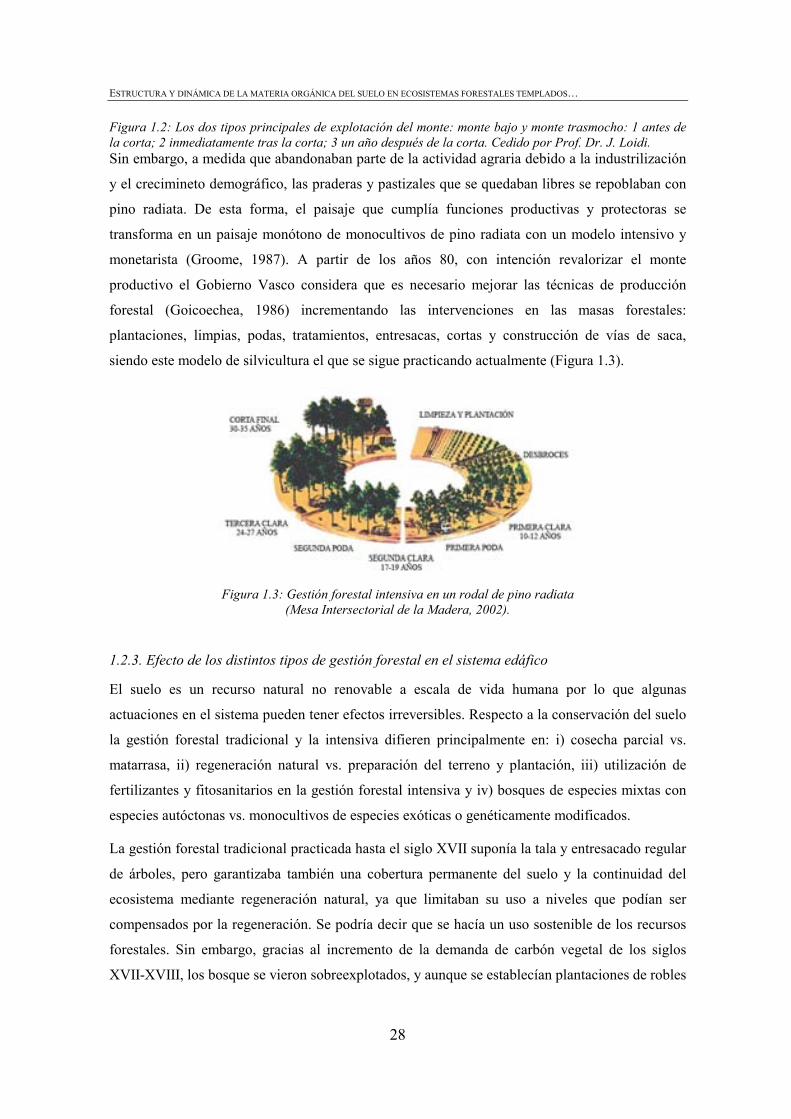
Figura 1.2: Los dos tipos principales de explotación del monte: monte bajo y monte trasmocho: 1 antes de la corta; 2 inmediatamente tras la corta; 3 un año después de la corta. Cedido por Prof. Dr. J. Loidi. Sin embargo, a medida que abandonaban parte de la actividad agraria debido a la industrilización
y el crecimineto demográfico, las praderas y pastizales que se quedaban libres se repoblaban con
pino radiata. De esta forma, el paisaje que cumplía funciones productivas y protectoras se
transforma en un paisaje monótono de monocultivos de pino radiata con un modelo intensivo y
monetarista (Groome, 1987). A partir de los años 80, con intención revalorizar el monte
productivo el Gobierno Vasco considera que es necesario mejorar las técnicas de producción
forestal (Goicoechea, 1986) incrementando las intervenciones en las masas forestales:
plantaciones, limpias, podas, tratamientos, entresacas, cortas y construcción de vías de saca,
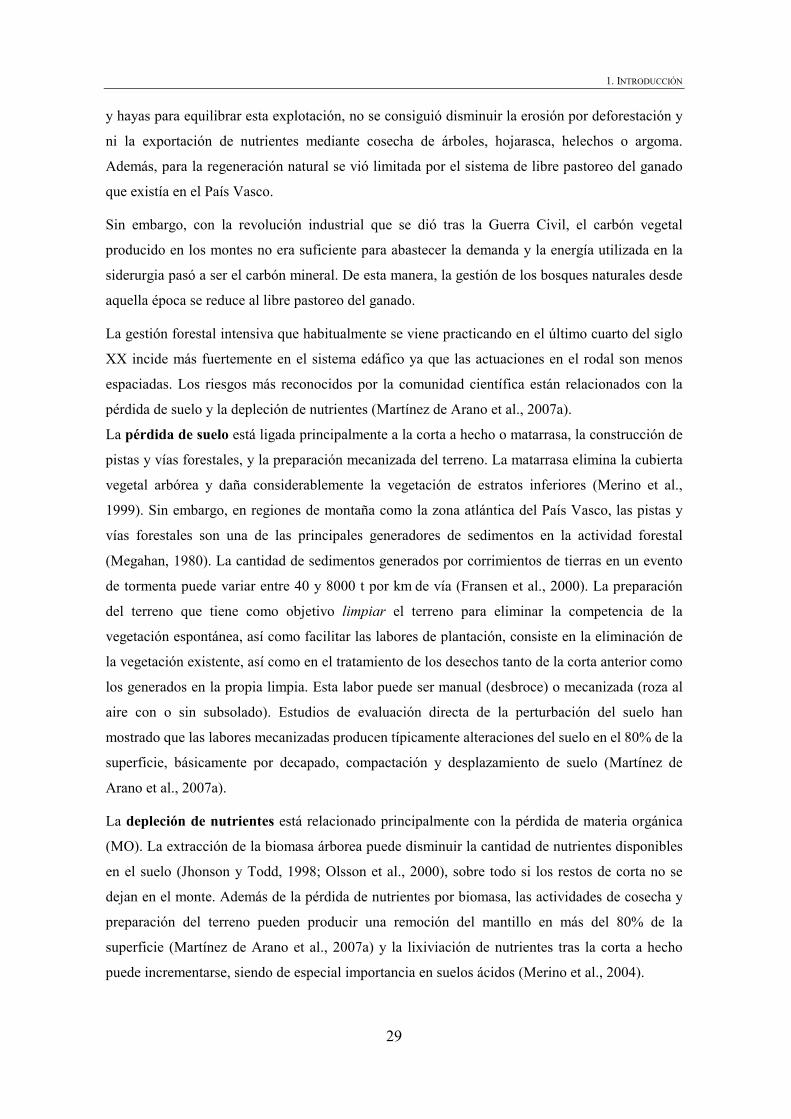
siendo este modelo de silvicultura el que se sigue practicando actualmente (Figura 1.3).
Figura 1.3: Gestión forestal intensiva en un rodal de pino radiata
(Mesa Intersectorial de la Madera, 2002).
1.2.3. Efecto de los distintos tipos de gestión forestal en el sistema edáfico
El suelo es un recurso natural no renovable a escala de vida humana por lo que algunas
actuaciones en el sistema pueden tener efectos irreversibles. Respecto a la conservación del suelo
la gestión forestal tradicional y la intensiva difieren principalmente en: i) cosecha parcial vs.
matarrasa, ii) regeneración natural vs. preparación del terreno y plantación, iii) utilización de
fertilizantes y fitosanitarios en la gestión forestal intensiva y iv) bosques de especies mixtas con
especies autóctonas vs. monocultivos de especies exóticas o genéticamente modificados.
La gestión forestal tradicional practicada hasta el siglo XVII suponía la tala y entresacado regular
de árboles, pero garantizaba también una cobertura permanente del suelo y la continuidad del
ecosistema mediante regeneración natural, ya que limitaban su uso a niveles que podían ser
compensados por la regeneración. Se podría decir que se hacía un uso sostenible de los recursos
forestales. Sin embargo, gracias al incremento de la demanda de carbón vegetal de los siglos
XVII-XVIII, los bosque se vieron sobreexplotados, y aunque se establecían plantaciones de robles
1. INTRODUCCIÓN
29
y hayas para equilibrar esta explotación, no se consiguió disminuir la erosión por deforestación y
ni la exportación de nutrientes mediante cosecha de árboles, hojarasca, helechos o argoma.
Además, para la regeneración natural se vió limitada por el sistema de libre pastoreo del ganado
que existía en el País Vasco.
Sin embargo, con la revolución industrial que se dió tras la Guerra Civil, el carbón vegetal
producido en los montes no era suficiente para abastecer la demanda y la energía utilizada en la
siderurgia pasó a ser el carbón mineral. De esta manera, la gestión de los bosques naturales desde
aquella época se reduce al libre pastoreo del ganado.
La gestión forestal intensiva que habitualmente se viene practicando en el último cuarto del siglo
XX incide más fuertemente en el sistema edáfico ya que las actuaciones en el rodal son menos
espaciadas. Los riesgos más reconocidos por la comunidad científica están relacionados con la
pérdida de suelo y la depleción de nutrientes (Martínez de Arano et al., 2007a).
La pérdida de suelo está ligada principalmente a la corta a hecho o matarrasa, la construcción de
pistas y vías forestales, y la preparación mecanizada del terreno. La matarrasa elimina la cubierta
vegetal arbórea y daña considerablemente la vegetación de estratos inferiores (Merino et al.,
1999). Sin embargo, en regiones de montaña como la zona atlántica del País Vasco, las pistas y
vías forestales son una de las principales generadores de sedimentos en la actividad forestal
(Megahan, 1980). La cantidad de sedimentos generados por corrimientos de tierras en un evento
de tormenta puede variar entre 40 y 8000 t por km de vía (Fransen et al., 2000). La preparación
del terreno que tiene como objetivo limpiar el terreno para eliminar la competencia de la
vegetación espontánea, así como facilitar las labores de plantación, consiste en la eliminación de
la vegetación existente, así como en el tratamiento de los desechos tanto de la corta anterior como
los generados en la propia limpia. Esta labor puede ser manual (desbroce) o mecanizada (roza al
aire con o sin subsolado). Estudios de evaluación directa de la perturbación del suelo han
mostrado que las labores mecanizadas producen típicamente alteraciones del suelo en el 80% de la
superficie, básicamente por decapado, compactación y desplazamiento de suelo (Martínez de
Arano et al., 2007a).
La depleción de nutrientes está relacionado principalmente con la pérdida de materia orgánica
(MO). La extracción de la biomasa árborea puede disminuir la cantidad de nutrientes disponibles
en el suelo (Jhonson y Todd, 1998; Olsson et al., 2000), sobre todo si los restos de corta no se
dejan en el monte. Además de la pérdida de nutrientes por biomasa, las actividades de cosecha y
preparación del terreno pueden producir una remoción del mantillo en más del 80% de la
superficie (Martínez de Arano et al., 2007a) y la lixiviación de nutrientes tras la corta a hecho
puede incrementarse, siendo de especial importancia en suelos ácidos (Merino et al., 2004).
ESTRUCTURA Y DINÁMICA DE LA MATERIA ORGÁNICA DEL SUELO EN ECOSISTEMAS FORESTALES TEMPLADOS…
30
Por lo tanto, el efecto de estas actuaciones en el sistema edáfico puede incidir en el buen
funcionamineto del mismo, disminuyendo la fertilidad del suelo, incrementando las exportaciones
de nutrientes y sedimentos a los cursos de agua y reduciendo el reservorio de C, es decir pueden
poner en entredicho la sostenibilidad del suelo (Nambiar, 1996).
1.3. La sostenibilidad de los suelos forestales
Los suelos desarrollados bajo bosques naturales son el patrón de referencia tanto en términos
funcionales como en términos de naturalidad e integridad ecológica. Las especies ocupan el lugar
y se desarrollan en función de la capacidad del suelo para aportar agua y nutrientes y estos se
conservan en un ciclo eficiente suelo-planta intermediado por la materia orgánica. La exportación
de sedimentos hacia los cursos de agua es generalmente bajo puesto que los sistemas forestales
naturales se caracterizan por presentar una alta cobertura vegetal y una alta capacidad de
intercepción de la precipitación, un mulch natural de hojarasca y un buen desarrollo del horizonte
superficial del suelo, relativamente rico en materia orgánica y bien estructurado (Pritchett, 1987).
Todo ello, favorece la infiltración y reduce tanto la escorrentía superficial, como el impacto
directo de las gotas de lluvia sobre el suelo, por lo que se reconoce su papel en la regulación del
ciclo hidrológico, así como en la mitigación de la erosión y de la exportación de sedimentos a los
cursos de agua (Morin et al., 1981; Ben-Hur et al., 1992; Franzluebbers, 2002; Lado et al., 2004).
Los suelos, por otra parte, son el nicho de una substancial, si no de la mayor porción de la
biodiversidad de los ecosistemas terrestres (Bauhus et al., 2002).
Por lo tanto, mantener o incrementar la capacidad del suelo para proveer de esas funciones debería
ser uno de los objetivos primordiales del uso sostenible del suelo, es decir la mantener o
incrementar la Calidad del Suelo.
1.3.1. Fertilidad, Calidad y Salud del Suelo
La Calidad del Suelo no es un término nuevo (Warkentin y Fletcher, 1977), aunque
tradicionalmente se ha relacionado con el mantenimiento de la productividad a lo largo del tiempo
(Carter et al., 1997), por lo que mantener la calidad del suelo era sinónimo de mantener la
fertilidad. Sin embargo, el reconocimiento global de la necesidad de entender el suelo de una
manera holística, en un marco de calidad medioambiental, ha ampliado la definición del término
Calidad del Suelo, que actualmente se entiende esencialmente como la capacidad del suelo para
mantener todas sus funciones (Larson y Pierce, 1991; Doran y Parking, 1994; Karlen et al., 1997).
Una definición más amplia de la calidad del suelo se refiere a su capacidad para sostener el
desarrollo de la vegetación, su habilidad para actuar como filtro y proteger otros compartimentos
1. INTRODUCCIÓN
31
del ecosistema, notablemente las aguas continentales y la calidad del aire, para contribuir a regular
los ciclos globales de los elementos y para salvaguardar la salud animal y humana (Harris, 1996).
Ligado al concepto de Calidad del Suelo aparece habitualmente el concepto de Salud del Suelo
que aunque es equivalente al primero, no siempre es considerado como su sinónimo (Doran y
Parkin, 1994). Numerosos autores emplean simultaneamente los dos conceptos y hacen referencia
a calidad/salud del suelo (e.g., Harris y Bezdicek 1994). Sin embargo, la calidad podría hacer
referencia a la capacidad intrínseca que tiene el suelo para desempeñar las funciones
anteriormente citadas y que díficilmente se vería afectada por el manejo ya que dependen de los
factores formadores del suelo (materia parental, clima, vegetación y relieve) y la salud podría
hacer referencia a las propiedades más dinámicas que podrían versse afectadas por el cambio de
uso o manejo (Carter, 1997). Generalmente, cuando se hace referencia al estado del suelo o
cambios del mismo debido a una actividad se utiliza el término calidad, aunque quizás se trate de
la salud del suelo. Hoy por hoy, la comunidad científica mantiene abierto el debate sobre la
definición y aplicación del concepto “Calidad de Suelo” frente al de “Salud del Suelo”. De
cualquier manera, en este trabajo, utilizaremos “Calidad del Suelo” en el marco de la definición
de Harris (1996).
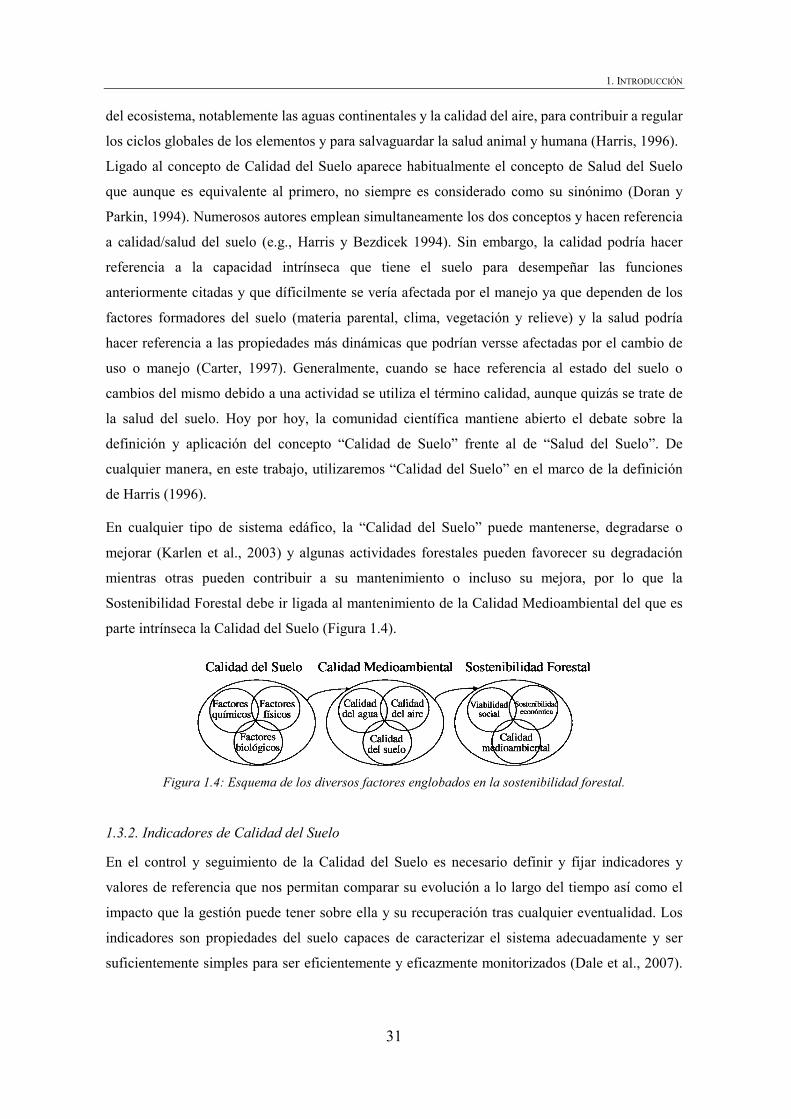
En cualquier tipo de sistema edáfico, la “Calidad del Suelo” puede mantenerse, degradarse o
mejorar (Karlen et al., 2003) y algunas actividades forestales pueden favorecer su degradación
mientras otras pueden contribuir a su mantenimiento o incluso su mejora, por lo que la
Sostenibilidad Forestal debe ir ligada al mantenimiento de la Calidad Medioambiental del que es
parte intrínseca la Calidad del Suelo (Figura 1.4).
Figura 1.4: Esquema de los diversos factores englobados en la sostenibilidad forestal.
1.3.2. Indicadores de Calidad del Suelo
En el control y seguimiento de la Calidad del Suelo es necesario definir y fijar indicadores y
valores de referencia que nos permitan comparar su evolución a lo largo del tiempo así como el
impacto que la gestión puede tener sobre ella y su recuperación tras cualquier eventualidad. Los
indicadores son propiedades del suelo capaces de caracterizar el sistema adecuadamente y ser
suficientemente simples para ser eficientemente y eficazmente monitorizados (Dale et al., 2007).
ESTRUCTURA Y DINÁMICA DE LA MATERIA ORGÁNICA DEL SUELO EN ECOSISTEMAS FORESTALES TEMPLADOS…
32
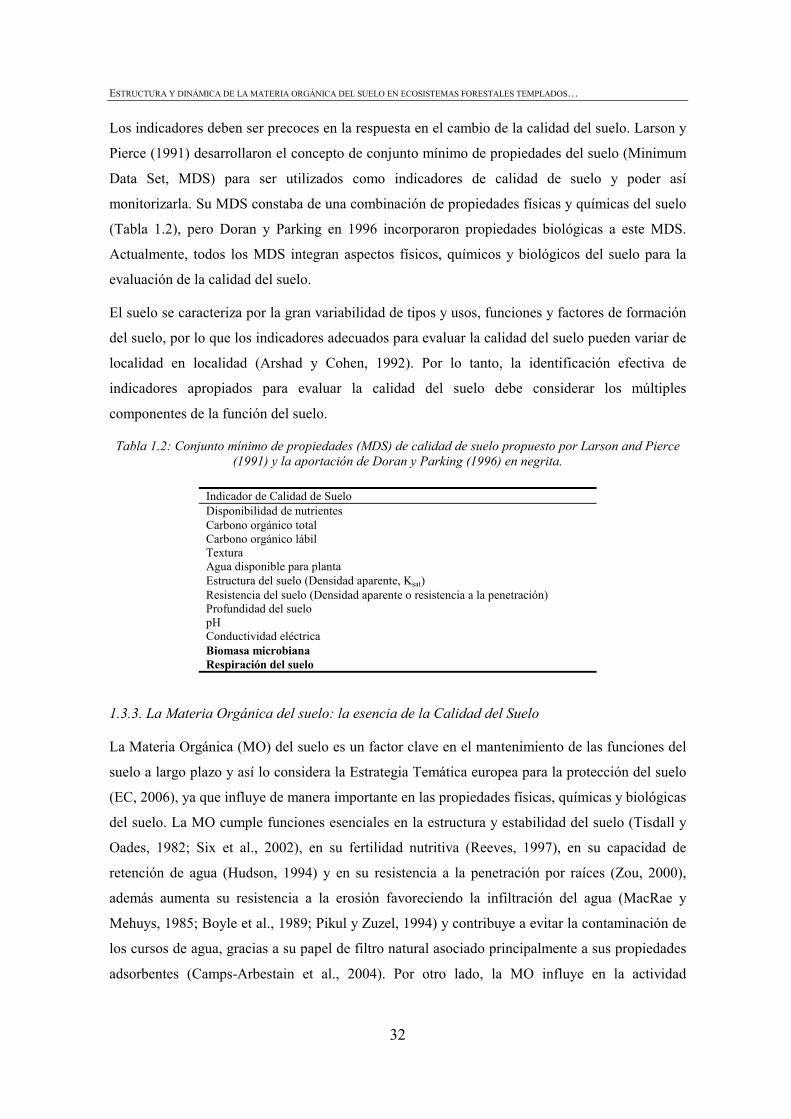
Los indicadores deben ser precoces en la respuesta en el cambio de la calidad del suelo. Larson y
Pierce (1991) desarrollaron el concepto de conjunto mínimo de propiedades del suelo (Minimum
Data Set, MDS) para ser utilizados como indicadores de calidad de suelo y poder así
monitorizarla. Su MDS constaba de una combinación de propiedades físicas y químicas del suelo
(Tabla 1.2), pero Doran y Parking en 1996 incorporaron propiedades biológicas a este MDS.
Actualmente, todos los MDS integran aspectos físicos, químicos y biológicos del suelo para la
evaluación de la calidad del suelo.
El suelo se caracteriza por la gran variabilidad de tipos y usos, funciones y factores de formación
del suelo, por lo que los indicadores adecuados para evaluar la calidad del suelo pueden variar de
localidad en localidad (Arshad y Cohen, 1992). Por lo tanto, la identificación efectiva de
indicadores apropiados para evaluar la calidad del suelo debe considerar los múltiples
componentes de la función del suelo.
Tabla 1.2: Conjunto mínimo de propiedades (MDS) de calidad de suelo propuesto por Larson and Pierce (1991) y la aportación de Doran y Parking (1996) en negrita.
Indicador de Calidad de Suelo Disponibilidad de nutrientes Carbono orgánico total Carbono orgánico lábil Textura Agua disponible para planta Estructura del suelo (Densidad aparente, Ksat) Resistencia del suelo (Densidad aparente o resistencia a la penetración) Profundidad del suelo pH Conductividad eléctrica Biomasa microbiana Respiración del suelo
1.3.3. La Materia Orgánica del suelo: la esencia de la Calidad del Suelo
La Materia Orgánica (MO) del suelo es un factor clave en el mantenimiento de las funciones del
suelo a largo plazo y así lo considera la Estrategia Temática europea para la protección del suelo
(EC, 2006), ya que influye de manera importante en las propiedades físicas, químicas y biológicas
del suelo. La MO cumple funciones esenciales en la estructura y estabilidad del suelo (Tisdall y
Oades, 1982; Six et al., 2002), en su fertilidad nutritiva (Reeves, 1997), en su capacidad de
retención de agua (Hudson, 1994) y en su resistencia a la penetración por raíces (Zou, 2000),
además aumenta su resistencia a la erosión favoreciendo la infiltración del agua (MacRae y
Mehuys, 1985; Boyle et al., 1989; Pikul y Zuzel, 1994) y contribuye a evitar la contaminación de
los cursos de agua, gracias a su papel de filtro natural asociado principalmente a sus propiedades
adsorbentes (Camps-Arbestain et al., 2004). Por otro lado, la MO influye en la actividad
1. INTRODUCCIÓN
33
enzimática del suelo (Dick, 1984; Kandeler, 2005) y en la composición de la comunidad
microbiana (Grayston y Presscott, 2005).
Por otra parte, la MO acumulada en los ecosistemas forestales representa una parte importante del
reservorio total de carbono orgánico (C). Se estima que la biomasa aérea de los bosques
constituye entre el 82-86% de todo el C fijado en la biomasa terrestre (Richter et al., 1999) y que
los suelos forestales acumulan entre el 70-73 % de todo el C orgánico fijado en el suelo (Birdsey
et al., 1993). El stock actual de C orgánico en la biomasa forestal arbolada de la vertiente atlántica
del País Vasco se estima en 13.25 Mt C (raíces incluidas) mientras que el stock actual de C
orgánico en los primeros 30 cm del suelo se estima en 29.4 Mt C (Ihobe, 2005). Por lo tanto, los
ecositemas forestales y en particular lo suelos forestales juegan un papel importante en el ciclo
global del C y el cambio climático (IPCC, 2000).
1.3.4. Cantidad y Calidad de la Materia Orgánica
La materia orgánica del suelo incluye la fracción de residuos orgánicos de plantas, animales o
microorganismos en diferentes fases de descomposición (Killham,1994). La cantidad de MO o C
orgánico presente en un suelo depende, por un lado, del balance entre las entradas mediante
hojarasca (aérea y subterránea) y rizodeposición y, por otro lado, de las salidas que se producen
principalmente por la liberación de C durante la descomposición (Jandl et al., 2007), así como por
lixiviado y procesos erosivos.
La cantidad de hojarasca que se incorpora al suelo en un bosque de clima templado puede variar
entre 3500 y 11000 kg ha-1 yr-1 (Diaz-Maroto y Vila-Lameiro, 2006; Kavvadias et al., 2001;
González-Arias, et al., 1998; Barraqueta y Basagoiti., 1988), dependiendo factores como la
especie o el tipo de suelo. La MO total incorporada al suelo es una mezcla de compuestos
orgánicos, principalmente polisacáridos (almidón, celulosa, hemicelulosa y pectina; 50-60 %) y
lignina (15-20 %), pero también suele tener proteínas, polifenoles (e.g. taninos), clorofila, cutina y
suberina, lípidos y ceras (10-20 %) (von Lutzow et al., 2006). La abundancia relativa de cada uno
estos compuestos y las características moleculares de dichos compuestos varían según la especie;
es decir, la estructura química o calidad de la MO difiere según la especie. Según el estudio de
Lorenz et al. (2004) realizado en el bosque Mannheim-Käfertal de Alemania, la hojarasca bajo
pinar se caracteriza por tener taninos condensados y lignina formada por monómeros de guaiacyl
propano mientras que la hojarasca bajo roble o haya contiene una lignina en la que dominan los
monómeros de siringyl y guaiacyl; por otro lado, los taninos son predominantemente hidrolizables
en el roble y condensados en el haya.
ESTRUCTURA Y DINÁMICA DE LA MATERIA ORGÁNICA DEL SUELO EN ECOSISTEMAS FORESTALES TEMPLADOS…
34
La descomposición de la MO está principalmente controlada por la comunidad microbiana dado que
menos del 5 % de ésta se oxida por una vía estrictamente química (Lavelle et al., 1993). Los
procesos microbianos de descomposición de la MO son controlados por la disponibilidad del
sustrato, y por las condiciones ambientales como son la temperatura y la humedad (Prescott, 2002).
Bajo condiciones ambientales similares, la descomposición de la MO dependerá de (i) la
disponibilidad del sustrato, que depende a su vez de la entrada de hojarasca o cantidad de MO, pero
también de la accesibilidad física al mismo, (ii) la estructura química de los compuestos orgánicos o
calidad de MO, y (iii) los enlaces entre la MO y el suelo mineral (Jandl et al., 2007). Por lo tanto, la
descomposición de la MO dependerá principalmente del grado de estabilización de la MO.
1.3.5. Estabilización de la Materia Orgánica
Conviene distinguir el proceso de estabilización de la MO del proceso de acumulación de la MO.
La MO se acumula cuando se producen condiciones que inhiben la descomposición de la misma,
tales como (1) un exceso de humedad, (2) temperaturas muy bajas, (3) distrofia, (4) presencia de
toxinas, etc. Estas condiciones son típicas en Histosoles (suelos orgánicos), pero también se
producen en otro tipo de suelos, como es el caso de determinados horizontes O de suelos muy
ácidos (e.g., Podzoles, Umbrisoles). Esta MO suele ser muy poco estable — debido a que apenas
ha tenido lugar un proceso de humificación —, y es susceptible de descomponerse si las
condiciones que inhiben este proceso se invierten. Por otro lado, el proceso de estabilización de la
MO se da (1) por la inherente recalcitrancia de los compuestos orgánicos, (2) por la interacción de
la MO con las superficies reactivas de la fracción mineral del suelo (e.g., oxi-hidróxidos de Fe y
Al, aluminosilicatos) o (3) simplemente por la inaccesibilidad de la MO para los microorganismos
(von Lutzow et al., 2006).
(1) La recalcitrancia de los compuestos orgánicos puede ser primaria o secundaria. La
recalcitrancia primaria se relaciona a las características moleculares propias de la hojarasca o
rizodepositos de cada especie, mientras que la secundaria es el resultado de diversos procesos
metabólicos y degradativos (Sollins et al., 1996). Así, los polímeros que contienen anillos
aromáticos como la lignina y las moléculas polimetilénicas como las ceras, cutina y suberina son
muy difícilmente degradados por la comunidad microbiana; lo mismo sucede con subproductos
generados en el proceso de descomposición como los polímeros húmicos (Lutzow et al., 2006).
Esta MO se define como MO estabilizada bioquímicamente.
(2) La adsorción de la MO por las superficies reactivas de los aluminosilicatos y los oxi-
hidróxidos de Fe y Al y la complejación de la MO con iones metálicos forma complejos
organominerales con una tasa de retorno lenta (Hagedorn et al., 2003). Hay diferencias
1. INTRODUCCIÓN
35
considerables entre los distintos tipos de aluminosilicatos: así, la MO enlazada con la esmectita
tiene una tasa de retorno de 1100 años mientras que el de la MO asociada a la kaolinita es de 360
años, estando estas diferencias relacionadas con la capacidad de intercambio catiónico efectiva
(CICe) y la superficie reactiva de las arcillas (Wattel-Koekkoek et al., 2003). La esmectita es un
filosilicato 2:1 con una densidad de carga superficial de 600-800 m2 g-1, a diferencia de la
caolinita que es un filosilicato 1:1, con una densidad de carga superficial mucho menor (10-20 m2
g-1) (Bohn et al., 1979). La mayor capacidad de estabilización de la MO por parte de la esmectita
se debe, no sólo a su mayor carga superficial (Saggar et al., 1996), en relación a la caolinita, sino
también al hecho de que es una arcilla expandible y, en el proceso de expansión y posterior
contracción puede quedar MO atrapada en su interior.
Como se ha apuntado anteriormente, la adsorción de la MO sobre oxi-hidróxidos de Fe- y Al-, así
como la complejación de la MO con iones metálicos forman complejos organominerales con una
tasa de retorno lenta. Los oxi-hidróxidos de Fe- y Al- pueden formar ligandos con grupos
funcionales de la MO, principalmente con grupos carboxílicos y fenólicos, y la formación de
complejos organo-alumínicos tiene lugar principalmente en un rango de pH entre 4.3-4.7 (Gu et
al., 1994). Por debajo de ese pH la solubilidad de estos complejos aumenta de forma exponencial,
encontrándose predominantemente en disolución (Camps Arbestain et al., 2003). Por lo tanto, este
tipo de procesos están limitados a suelos ácidos ricos en minerales con grupos protonados
hidroxílicos (Shen, 1999). La MO complejada de esta forma se define como MO químicamente
estabilizada. Torn et al. (2002) demostraron que la MO estabilizada de esta forma no varía incluso
con marcados cambios de uso tras estudiar series de suelo de 150 años en la estepa de Rusia.
(3) La inaccesibilidad de la MO para los microorganismos y enzimas está principalmente
relacionado con la agregación o estructura del suelo. La estructura del suelo se refiere al tamaño,
forma y organización de sólidos y huecos, continuidad de poros, la capacidad de retener y
trasmitir fluidos y sustancias orgánicas e inorgánicas y finalmente, la habilidad de sostener un
buen crecimiento y desarrollo radicular (Lal, 1991); por lo tanto la estructura del suelo es una
propiedad dinámica del suelo muy relacionada con la MO y con las características de la misma.
Los agregados son partículas secundarias que se forman mediante la combinación de partículas
minerales primarias (de tamaño arena, limo y arcilla) con sustancias orgánicas e inorgánicas.
Existen varias formas de agregación:
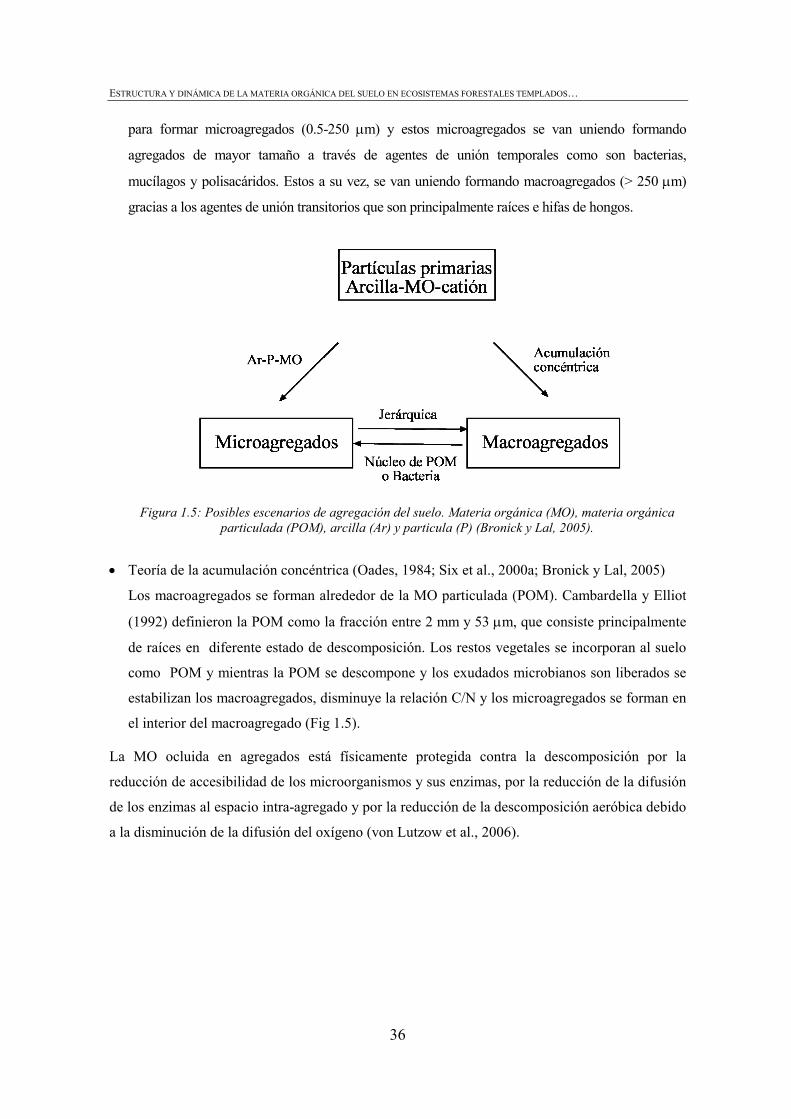
• Teoría jerárquica de agregación (Tisdall y Oades, 1982)
Este modelo de agregación se propuso para suelos minerales de praderas, pero es uno de los
modelos más reseñados en la literatura sobre la estructuración del suelo. La MO se une a los
minerales de arcilla mediante cationes polivalentes, conocidos como agentes de unión persistentes,
ESTRUCTURA Y DINÁMICA DE LA MATERIA ORGÁNICA DEL SUELO EN ECOSISTEMAS FORESTALES TEMPLADOS…
36
para formar microagregados (0.5-250 μm) y estos microagregados se van uniendo formando
agregados de mayor tamaño a través de agentes de unión temporales como son bacterias,
mucílagos y polisacáridos. Estos a su vez, se van uniendo formando macroagregados (> 250 μm)
gracias a los agentes de unión transitorios que son principalmente raíces e hifas de hongos.
Figura 1.5: Posibles escenarios de agregación del suelo. Materia orgánica (MO), materia orgánica particulada (POM), arcilla (Ar) y particula (P) (Bronick y Lal, 2005).
• Teoría de la acumulación concéntrica (Oades, 1984; Six et al., 2000a; Bronick y Lal, 2005)
Los macroagregados se forman alrededor de la MO particulada (POM). Cambardella y Elliot
(1992) definieron la POM como la fracción entre 2 mm y 53 μm, que consiste principalmente
de raíces en diferente estado de descomposición. Los restos vegetales se incorporan al suelo
como POM y mientras la POM se descompone y los exudados microbianos son liberados se
estabilizan los macroagregados, disminuye la relación C/N y los microagregados se forman en
el interior del macroagregado (Fig 1.5).
La MO ocluida en agregados está físicamente protegida contra la descomposición por la
reducción de accesibilidad de los microorganismos y sus enzimas, por la reducción de la difusión
de los enzimas al espacio intra-agregado y por la reducción de la descomposición aeróbica debido
a la disminución de la difusión del oxígeno (von Lutzow et al., 2006).
1. INTRODUCCIÓN
37
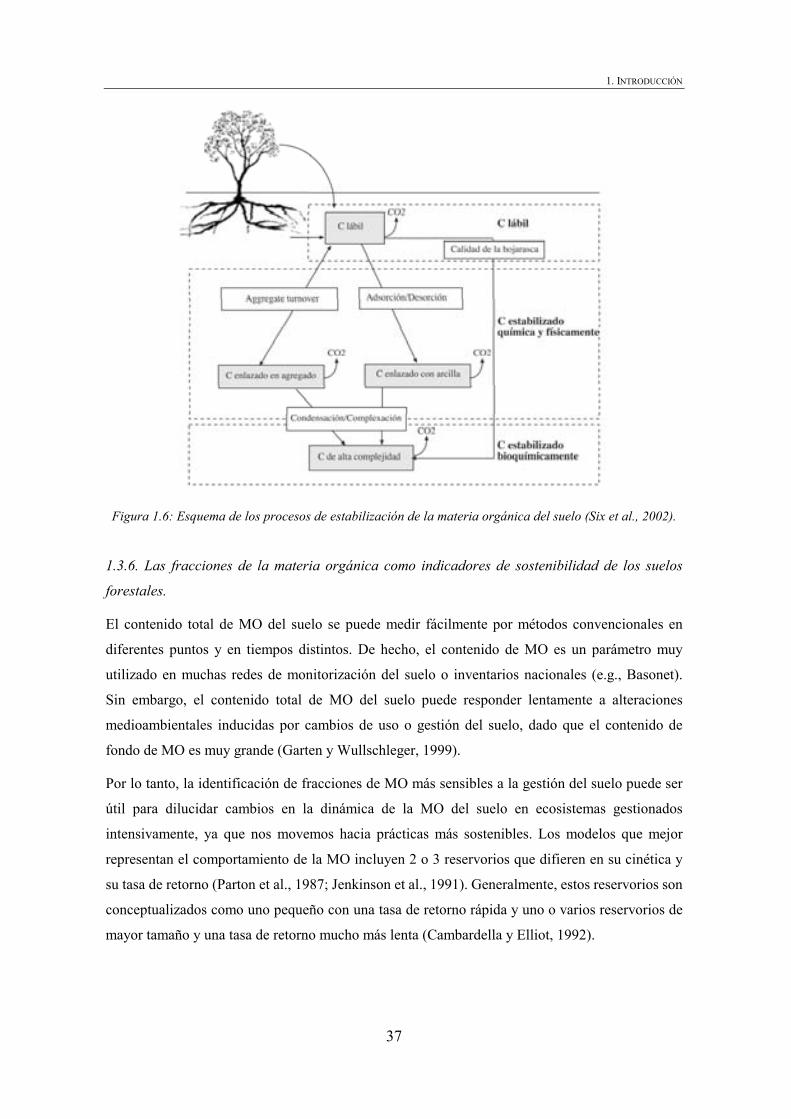
Figura 1.6: Esquema de los procesos de estabilización de la materia orgánica del suelo (Six et al., 2002).
1.3.6. Las fracciones de la materia orgánica como indicadores de sostenibilidad de los suelos
forestales.
El contenido total de MO del suelo se puede medir fácilmente por métodos convencionales en
diferentes puntos y en tiempos distintos. De hecho, el contenido de MO es un parámetro muy
utilizado en muchas redes de monitorización del suelo o inventarios nacionales (e.g., Basonet).
Sin embargo, el contenido total de MO del suelo puede responder lentamente a alteraciones
medioambientales inducidas por cambios de uso o gestión del suelo, dado que el contenido de
fondo de MO es muy grande (Garten y Wullschleger, 1999).
Por lo tanto, la identificación de fracciones de MO más sensibles a la gestión del suelo puede ser
útil para dilucidar cambios en la dinámica de la MO del suelo en ecosistemas gestionados
intensivamente, ya que nos movemos hacia prácticas más sostenibles. Los modelos que mejor
representan el comportamiento de la MO incluyen 2 o 3 reservorios que difieren en su cinética y
su tasa de retorno (Parton et al., 1987; Jenkinson et al., 1991). Generalmente, estos reservorios son
conceptualizados como uno pequeño con una tasa de retorno rápida y uno o varios reservorios de
mayor tamaño y una tasa de retorno mucho más lenta (Cambardella y Elliot, 1992).
ESTRUCTURA Y DINÁMICA DE LA MATERIA ORGÁNICA DEL SUELO EN ECOSISTEMAS FORESTALES TEMPLADOS…
38
Las fracciones de la MO con una tasa de retorno más rápida, de años a décadas, responden
habitualmente más sensiblemente a cambios relacionados con la gestión que las fracciones con
una tasa de retorno más lentas (Cambardella y Elliot, 1992; Gregorich y Janzem, 1996; Six et al.,
1998), por lo que dichas fracciones pueden servir como indicadores o herramientas de verificación
de la calidad del suelo y la gestión sostenible, como por ejemplo:
Hojarasca- Los modelos de comportamiento de la MO no consideran la hojarasca del suelo, ya
que es sólo característico de suelos forestales. Sin embargo, la hojarasca comprende una de las
fracciones más dinámicas de la MO del suelo, por lo que conocer el efecto de las actividades
forestales en la dinámica de la MO es crucial para predecir la sostenibilidad de los ecosistemas
forestales a escala local y el cambio de C con la atmósfera a escala global (Yanai et al., 2003).
POM- La evidencia de que la materia orgánica tiene un papel importante en la determinación de la
agregación está asumida, pero la fracción POM pudiera ser más sensible a cambios en la
estructura del suelo por lo que se ha definido como posible indicador de sostenibilidad del suelo
(Haynes et al., 1999; Six et al., 2002). El mantenimiento o incremento de la POM como
consecuencia de las actividades forestales, podría mejorar la protección física de la MO, la
infiltración y reducir la exportación de sedimentos a los cursos de agua.
Comunidad microbiana- La biomasa microbiana representa el 2-3% de la MO del suelo (Kandeler
et al., 2005) y se estima que su tasa de retorno es de 0.5-1.5 años (Mc Gill et al., 1986). Sin
embargo, esta biomasa es responsable de proveer de nutrientes a las plantas mediante la
descomposición de la MO (Bengtson et al., 2007). La descomposición de la MO es un proceso
ecológico muy complejo que incluye la interacción de muchos taxones (Sinsabaugh et al., 2002).
Hongos y bacterias son los taxones clave en la degradación de la gran cantidad de MO
incorporada al suelo todos los años. La composición de la comunidad microbiana depende en gran
medida de la cantidad y principalmente de la calidad de la MO incorporada al suelo y la actividad
de la temperatura y humedad del suelo (Prescott, 2002).
1.3.7. Perspectiva practica: influencia de las actividades forestales en la MO
Las actividades forestales actuales más importantes en el País Vasco son la utilización de especies
exóticas como especies productivas y la cosecha y posterior preparación del terreno mecanizados
de dichas especies.
Las características de la cubierta vegetal determinan la cantidad y calidad de hojarasca que influye
significativamente en la cantidad de nutrientes a reciclar, en la composición de la comunidad
microbiana y por consiguiente en la disponibilidad de nutrientes (Prescott, 2002). Además, las
1. INTRODUCCIÓN
39
características de la hojarasca y los subproductos liberados en su descomposición pueden influir
en la agregación del suelo (Bronick y Lal, 2005). El diámetro medio de agregado (MWD) y los
agregados estables agua (WSA) se correlacionan con la composición bioquímica de los residuos
vegetales en cultivos agrícolas. El maíz contiene muchos fenoles en su residuo y una agregación
mayor que muchos otros cultivos, al contrario la baja agregación de la soja se relaciona con la
baja cantidad de fenoles (Martens, 2000). La actividad radicular también puede influir en la
estructura del suelo, ya que las raíces reorganizan las partículas y liberan exudados que producen
alteraciones físicas, químicas y biológicas que afectan a la estructura del suelo. La penetración de
raíces en el suelo genera canales, especialmente cuando estas mueren y se descomponen. Dichos
canales mejoran el movimiento de gas y agua (Moore et al., 1986). Químicamente, las raíces
liberan una gran variedad de compuestos con capacidad adherente como por ejemplo los ácidos
poligalacturónicos que pueden estabilizar los agregados incrementando la fuerza de los enlaces
(Czarnes et al., 2000). Todo ello puede influir en la comunidad microbiana que a su vez genera
más compuestos adherentes que mejoran la agregación. La agregación se incrementa
generalmente cuando existe una mayor densidad longitudinal de raíces, cuando se producen
mayores asociaciones microbianas y cuando se aumenta la cantidad de glomalina en suelo (Rillig
et al., 2002). Sin embargo, diferentes sistemas radiculares tienen efectos diferentes en la
estructuración del suelo, ya que difieren en las propiedades de las propias raíces, de sus exudados
y de sus funciones (Chan y Heenan, 1999b).
En este contexto, el cambio especie podría suponer un cambio importante en la estructura y la
dinámica de la materia orgánica y por consiguiente en la Calidad del Suelo.
Por otro lado, las estrategias de cosecha y la intensidad de la preparación del terreno pueden variar
según el tipo de ecosistema forestal. En el País Vasco, la corta a hecho mediante motosierra,
limpieza de los fustes en el sitio, retirada de los mismos mediante arrastrador y una posterior
preparación del terreno utilizando la pala frontal de un buldózer para realizar la limpieza de los
retos de corta y la eliminación de la vegetación competidora de la plantación, y que lleva como
apero posterior un rejón subsolador que se introduce en el suelo unos 50 cm con la intención de
mejorar la estructura física del suelo, son las operaciones selvícolas más habituales durante la
cosecha y el establecimiento de la nueva plantación en las repoblaciones de Pinus radiata D.Don.
Numerosos estudios han demostrado que las cortas a hecho o matarrasa alteran significativamente
el mulch natural de hojarasca (e.g., Lavender et al., 1990; Schmidt et al., 1996). Sin embargo,
otros estudios han probado que si la cosecha y preparación del terreno se llevan a cabo con sumo
cuidado, el mantillo puede incrementar varios años tras la cosecha, dado que la pérdida de
ESTRUCTURA Y DINÁMICA DE LA MATERIA ORGÁNICA DEL SUELO EN ECOSISTEMAS FORESTALES TEMPLADOS…
40
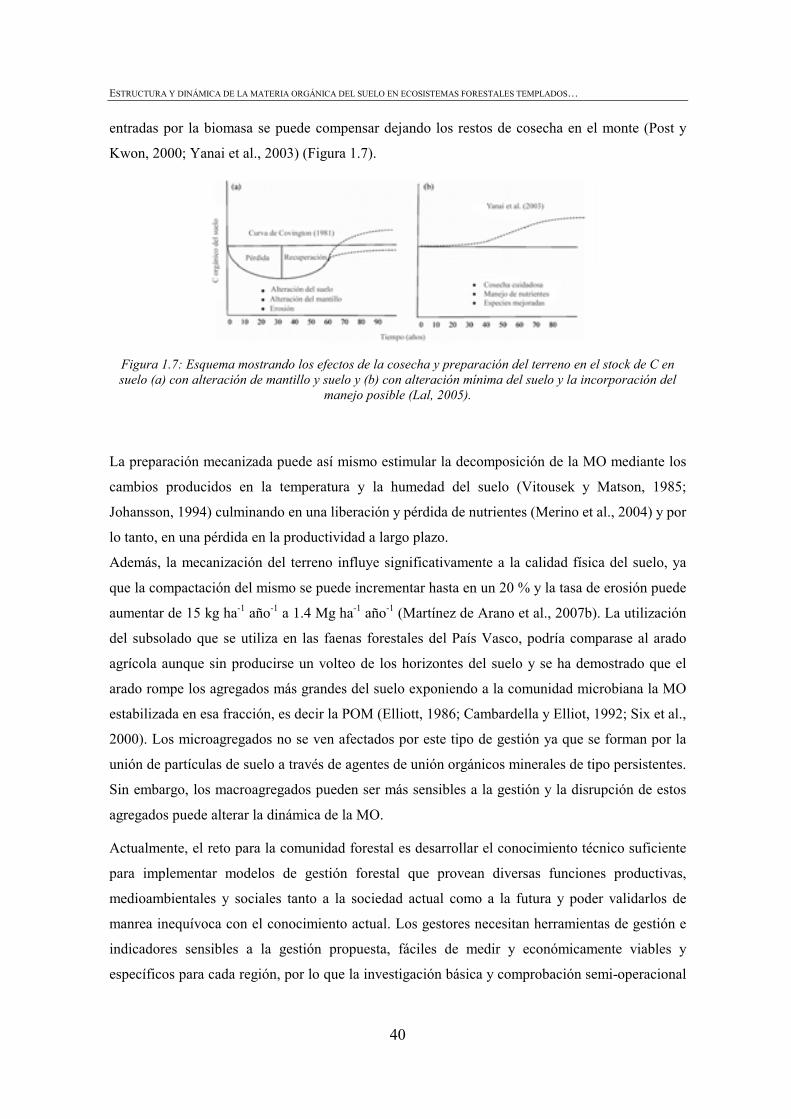
entradas por la biomasa se puede compensar dejando los restos de cosecha en el monte (Post y
Kwon, 2000; Yanai et al., 2003) (Figura 1.7).
Figura 1.7: Esquema mostrando los efectos de la cosecha y preparación del terreno en el stock de C en suelo (a) con alteración de mantillo y suelo y (b) con alteración mínima del suelo y la incorporación del
manejo posible (Lal, 2005).
La preparación mecanizada puede así mismo estimular la decomposición de la MO mediante los
cambios producidos en la temperatura y la humedad del suelo (Vitousek y Matson, 1985;
Johansson, 1994) culminando en una liberación y pérdida de nutrientes (Merino et al., 2004) y por
lo tanto, en una pérdida en la productividad a largo plazo.
Además, la mecanización del terreno influye significativamente a la calidad física del suelo, ya
que la compactación del mismo se puede incrementar hasta en un 20 % y la tasa de erosión puede
aumentar de 15 kg ha-1 año-1 a 1.4 Mg ha-1 año-1 (Martínez de Arano et al., 2007b). La utilización
del subsolado que se utiliza en las faenas forestales del País Vasco, podría comparase al arado
agrícola aunque sin producirse un volteo de los horizontes del suelo y se ha demostrado que el
arado rompe los agregados más grandes del suelo exponiendo a la comunidad microbiana la MO
estabilizada en esa fracción, es decir la POM (Elliott, 1986; Cambardella y Elliot, 1992; Six et al.,
2000). Los microagregados no se ven afectados por este tipo de gestión ya que se forman por la
unión de partículas de suelo a través de agentes de unión orgánicos minerales de tipo persistentes.
Sin embargo, los macroagregados pueden ser más sensibles a la gestión y la disrupción de estos
agregados puede alterar la dinámica de la MO.
Actualmente, el reto para la comunidad forestal es desarrollar el conocimiento técnico suficiente
para implementar modelos de gestión forestal que provean diversas funciones productivas,
medioambientales y sociales tanto a la sociedad actual como a la futura y poder validarlos de
manrea inequívoca con el conocimiento actual. Los gestores necesitan herramientas de gestión e
indicadores sensibles a la gestión propuesta, fáciles de medir y económicamente viables y
específicos para cada región, por lo que la investigación básica y comprobación semi-operacional
1. INTRODUCCIÓN
41
son necesarios. En este contexto, estudios planteados como "case studies" en ecosistemas
forestales representativos pueden ser una forma efectiva de evaluar indicadores potenciales para
comprobar la sostenibilidad en la gestión de los suelos forestales y desarrollar propuestas para su
aplicación a mayores escalas (Raison y Rab, 2001). Los "case studies" pueden ser particularmente
valiosos para definir el nivel de precisión necesario para una correcta representación de las
propiedades del suelo para cada tipo de ecosistema forestal. La gran variabilidad natural de estas
propiedades puede incrementarse con las perturbaciones derivadas de la gestión, por lo que se
necesitarán compensaciones adecuadas entre las medidas detalladas en pocos sitios y las medidas
con mayores rangos de incertidumbre para un rango más amplio de sitios.
1.4. Bibliografía
Adan de Yarza, M., 1916. Algunas coníferas notables del parque de Zubieta, inmediato a la villa
de Lequeitio (Vizcaya). España Forestal 10(2), 40-41.
Aerts, R., 1995. The advantages of being evergreen. Trends in Ecology and Evolution 10, 402-
407.
Aragón, A., 2001. El bosque guipuzcoano en la Edad Moderna: aprovechamiento, ordenamiento
legal y conflictividad. Aranzadi Zientzi Elkartea, Munibe Suplemento 15, pp. 285
Arshad, M.A., Cohen, G.M., 1992. Characterization of soil quality: physical and chemical criteria.
American Journal of Alternative Agriculture 7, 25-32.
Aseginolaza, C., Gómez, D., Lizaur, X., Montserrat, G., Morante, G., Salaverría, M.R., Uribe-
Echebarria, P.M., 1996. Vegetación de la comunidad autónoma del País Vasco. Dept. de
Ordenación del Territorio, Vivienda y Medio Ambiente. Vitoria-Gasteiz.
Barraqueta P., Basagoiti M., 1988. Producción de hojarasca y aporte de nutrientes en plantaciones
de Pinus radiata en el País Vasco. Actas del Congreso Mundial Vasco. Biología
ambiental, Tomo I: 411–426.
Bauhus, J., Khanna, P.K., Hopmans, P., weston, C., 2002. Is soil carbon a useful indicator of
sustainable forest soil management? -a case study from native eucalypt forests of south-
eastern Australia. Forest Ecology and Management 171, 59-74.
Bengtson, P., Basiliko, N., Prescott, C.E., Grayston, S.J., 2007. Spatial dependency of soil
nutrient availability and microbial properties in a mixed forest of Tsuga heterophylla and
Pseudotsuga menziesii, in coastal British Columbia, Canada. Soil Biology and
Biochemistry 39 (10), 2429-2435.
ESTRUCTURA Y DINÁMICA DE LA MATERIA ORGÁNICA DEL SUELO EN ECOSISTEMAS FORESTALES TEMPLADOS…
42
Ben-Hur, M., Stern R., van der Merwe A.J., Shainberg, I., 1992. Slope and gypsum effects on
infiltration and erodibility of dispersive and nondispersive soils. Soil Science Society of
America Journal 56, 1571–1576.
Birdsey, R.A., Platinga, A.J., Heath, L.S., 1993. Past and prospective carbon storage in United
States forests. Forest Ecology and Management 58, 33–40.
Bohn, H., McNeal, B., O´Connor, G., 1979. Soil chemistry. John Wiley & Sons. New York. pp. 83-
84.
Boyle, M., Frankenberger, W.T., Stoltzy, L.H., 1989. The influence of organic matter on soil
aggregation and water infiltration. Journal of Prod. Agri. 2, 290-299.
Bronick, C.J., Lal, R., 2005. Soil structure and management: a review. Geoderma 124, 3-22.
Cambardella, C.A., Elliot, E.T., 1992. Particulate soil organic matter changes across a grassland
cultivation sequence. Soil Science Society of America Journal 56, 777-783.
Camps-Arbestain, M., Barreal., M.E., Mourenza, C., Alvarez, E., Kidd, P., Macías, F., 2003.
Rhizosphere chemistry in acid forest soils that differ in their degree of Al-saturation of
organic matter. Soil Science 168, 267-279.
Camps-Arbestain, M., Martínez de Arano, I., Mendarte, S., Aizpurua, A., Pinto, M., 2004. Pautas
para inducir una acumulación adicional de carbono orgánico en biomasa forestal y en suelos
agrícolas y forestales de la CAPV. Edafología 11, 52-78.
Camps-Arbestain, M., Macías, F., Chesworth, W., 2008. Soil. In: Chesworth (ed.) Encyclopedia of
Soil Science. Springer. New York. pp. 629-633.
Carter, M.R., Gregorich, E.G., Anderson, D.W., Doran, J.W., Janzen, H.H., Pierce, F.J., 1997.
Concepts of soil quality and their significance. In: Gregorich, E.G., Carter M.R., (eds.) Soil
quality for crop production and Ecoystem Health. Elsevier, Amsterdam pp. 1-19.
Chan, K.Y., Heenan, D.P., 1999b. Microbial-induced soil aggregate stability under different crop
rotations. Biology and Fertility of Soils 30, 29-32.
Chesworth, W., 2000. The phase rule in soil science. Edafología 7, 107-119.
Christensen, B.T., 2001. Physical fractionation of soil and structural and funtional complexity in
organic matter turnover. European Journal of Soil Science 52, 345–353.
1. INTRODUCCIÓN
43
Czarnes, S., Hallett, P.D., Bengough, A.G., Young, I.M., 2000. Root- and microbial-derived
mucilages affect soil structure and water transport. European Journal of Soil Science 51,
435– 443.
Dale, V.H., Peacock, A.D., Garten Jr., C.T., Sobek, E., Wolfe, A.K., 2007. Selecting indicators of
soil, microbial and plant conditions to understand ecological changes in Georgia pine
forests. Ecological Indicators in press
Diaz-Maroto, I., Vila-Lameiro, P., 2006. Litter production and composition in natural stands of
Quercus robur L. (Galicia, Spain). Polish Journal ef Ecology 54, 429-439.
Dick, W.A., 1984. Influence of long-term tillage and crop rotation combinations on soil enzyme
activities. Soil Science Society of America Journal 48, 569-584.
Doran, J.W., Parkin, T.B., 1996. Quantitative indicators of soil quality: a minimum data set. In: In:
Doran, J.W. and Jones, A.J. (eds.) Methods for assessing soil quality. Soil Science Society
of America Special Publications Nº 35 pp. 25-37.
EC, 2006. COM 2006/231, 2006. Communication from the Commussion to the Council, the
European Parliament, the European Economic and Social Committee and the Committee of
the Regions. Thematic Strategy for Soil Protection. Commission of the European
Communities. Brussels, 22.9.2006, 12.pp
Elliot, E.T., 1986. Aggregate structure and carbon, nitrogen and phosphorus in native and cultivate
soils. Soil Science Society of America Journal 50, 627-633.
FAO–UNESCO, 1998. Clasificación de suelos FAO. Base de referencia para los suelos del Mundo.
World Reference for Soil Resource. FAO, Rome.
Finér, L., Mannerkoski, H., Piirainen, S., Starr, M., 2003. Carbon and nitrogen poold in an old-
growth Norway spruce mixed forest in eastern Finland and changes associated with clear-
cutting. Forest Ecology and Management 174(1-3), 51-63.
Fransen, P.J.B., Phillips, C.J., Fahey, B.D., 2000. Forest road erosion in New Zealand: overview.
Earth Surface Processes and Landforms 26, 165-174.
Franzluebbers A.J., 2002. Water infiltration and soil structure related to organic matter and its
stratification with depth. Soil and Tillage Research 66, 197-205.
Garten C.T., Wullschleger, S.D., 1999. Soil carbon inventories under a bioenergy crop
(Switchgrass): measurement limitations. Journal of Environmental Quality 28, 1359-1365.
ESTRUCTURA Y DINÁMICA DE LA MATERIA ORGÁNICA DEL SUELO EN ECOSISTEMAS FORESTALES TEMPLADOS…
44
Goicoechea, J.M., 1986. Política forestal de Euskadi. Itsaslur 85, 117-125, Actas de Jornadas Técnicas.
Vitoria-Gasteiz. Dept. Agricultura y Pesca.
González-Arias, A., Amezaga, I., Echeandía, A., Domingo, M., Onaindia, M., 1998. Effects of
pollution on the nutrient return via litterfall for Pinus radiata plantations in the Basque
Country. Plant Ecology 139, 247-258.
Graefe, U., Elsner, D.-C., Gehrmann, J., Stempelmann, I., 2002. Schwellenwerte der
bodenversauerung für die bodenbiozönose. Mitt.Dtsch.Bodenk.Ges. 98, 39-40.
Grayston, S.J., Vaughan, D., Jones, D., 1996. Rhizosphere carbon flow in trees, in comparison with
annual plants: the importance of root exudation and its impact on microbial activity and
nutrient availability. Applied Soil Ecology 5, 29-56.
Grayston, S.J., Prescott, C.E., 2005. Microbial communities in the forest floors under four tree species
in coastal British Columbia. Soil Biology and Biochemistry 37, 1157-1167.
Gregorich, E.G., Janzen, H.H., 1996. Storage of soil carbon in the light fraction and macroorganic
matter. p. 167–190. In: Carter, M.R., Stewart, B.A. (ed.) Structure and organic matter storage
in agricultural soils. Lewis Publishers, CRC Press, Boca Raton, FL.
Groome, H., 1987. Situación actual y perspectivas futuras del sector forestal de la Comunidad
Autonóma Vasca. Lurralde 10, 185-204.
Gu, B., Schimt, J., Chen, J., 1994. Adsorption and desorption of natural organic matter on iron oxide:
mechanisms and models. Environmental Science Technology 28, 38–46.
Hagedorn, F., Spinnler, D., Bundt, M., Blaser, P., Siegwolf, R., 2003. The input and fate of new C in
two forest soils under elevated CO2. Global Change Biology 9, 862–872.
Harris, R.F., and D.F. Bezdicek. 1994. Descriptive aspects of soil quality/health. In: Doran, J.W.,
Coleman, D.C., Bezdicek, D.F., Stewart, B.A. (eds.) Defining soil quality for a sustainable
environment. Soil Science Society of America Special Publications Nº 35, pp. 23–35.
Harris, R.F., Karlen, D.L., Mulla, D.J., 1996. A conceptual framework for assessment and
management of soil quality and health. In: Doran, J.W., Jones, A.J. (eds.) Methods for
assessing soil quality. Soil Science Society of America Special Publications Nº 49, pp. 61-81.
Hashimoto, S., Masakazu, S., 2004. The impact of forest clear-cutting on soil temperature: a
comparison between before and after cutting, and between clear-cut and control sites.
Journal of Forest Research, 9 (2), 125-132.
1. INTRODUCCIÓN
45
Haynes, R.J., Hamilton, C.S., 1999. Effects of sugarcane production on soil quality: a synthesis of
world literature. Proceedings of South African Sugar Technologists Association 73, 45-51.
Hudson, B., 1994. Soil organic matter and available water capacity. Journal of Soil and Water
Conservation 49, 189-194.
IFN, 2005. Tercer Inventario Forestal Nacional 1997-2006. Ministerio de Medio Ambiente.
Ihobe, 2005. Inventario de carbono orgánico en suelos y biomasa de la Comunidad Autonóma del
País Vasco. Serie Programa Marco Ambiental Nº 48.
IPCC, 2000. Land Use, Land Use Change and Forestry. Special Report, Inter-Governmental Panel
on Climate Change. Cambridge University Press, Cambridge, UK, pp. 127–180.
Jandl, R., Lindner, M., Vesterdal, L., Bauwens, B., Baritz, R., Hagedorn, F., Johnson, D.W.,
Minkkinen, K., Byrne, K.A., 2007. How strongly can forest management influence soil
carbon sequestration? Geoderma 137, 253-268.
Jenkinson, D.S., Adams, D.E., Wild, A., 1991. Model estimates of CO2 emissions from soil in
rsponse to global warming. Nature 351, 301-304.
Johansson, M.-B., 1994. The influence of soil scarification on the turn-over rate of slash needles and
nutrient release. Scandinavian Journal of Forest Research 9, 170-179.
Johnson, D.W., Todd, D.E., 1998. Harvesting effects on long-term changes in the nutrient pool of
mixed oak forest. Soil Science Society of America Journal 62, 1725–1735.
Kandeler E., Stemmer M., Gerzabek M.H., 2005. Role of microorganisms in carbon cycling in soils.
In: F. Buscot and A. Varma (eds.).Microorganisms in soils: roles in genesis and functions
Springer-Verlag, Berlin, Heidelberg, pp 139 – 157.
Karlen, D.L., Mausbach, M.J., Doran, J.W., Cline, R.G., Harris, R.F., Schuman, G.E., 1997. Soil
quality: A concept, definition and framework for evaluation. Soil Science Society of
America Journal 61, 4-10.
Karlen, D.L., Ditzler,C.A.,Andrews,S.S., 2003. Soil quality:why and how? Geoderma 114, 145-156.
Kavvadias, V.A., Alifragis, D., Tsiontsis, A., Brofas, G., Stamatelos, G., 2001. Litterfall, litter
accumulation and litter decomposition rates in four forest ecosystems in northern Greece.
Forest Ecology and Management 144, 113-127.
Killham, K., 1994. Soil Ecology. Cambridge University Press.
Klooster, D., 2005. Environmental certification of forests: The evolution of environmental
governance in a commodity network. Journal of Rural Studies 21(4), 403-417.
ESTRUCTURA Y DINÁMICA DE LA MATERIA ORGÁNICA DEL SUELO EN ECOSISTEMAS FORESTALES TEMPLADOS…
46
Lado, M., Paz, A., Ben-Hur, M., 2004. Organic Matter and Aggregate Size Interactions in Infiltration,
Seal Formation, and Soil Loss. Soil Science Society of America Journal 68, 935-942.
Lal, R., 1991. Soil structure and sustainability. J. Sustain. Agric. 1, 67–92.
Lal, R., 2005. Forest soils and carbon sequestration. Forest Ecology and Management 220 (1-3), 242-
258.
Larson, W.E., Pierce, F.J., 1991. Conservation and enhancement of soil quality. p. 175-203. In:
Evaluation for Sustainable Land Management in the Developing World, Vol. 2: Technical
papers. Bangkok, Thailand: International Board for Research and Management, 1991.
IBSRAM Proceedings Nº 12(2).
Lavelle, P., Blanchart, E., Martin, A., Martin, S., 1993. A hierarchichal model for decomposition in
terrestrial ecosystems: aplication to soils of the humid tropics. Biotropica 25 (2), 130-150.
Lavender, D.P., Parish, R., Johnson, C.M., 0ontgomery, G., Vyse, A., Willis, R.A., Winston, D., 1990.
Regenerating British Columbia´s forests. University of British Columbia, Vancouver, BC.
Lemma, B., Nilsson, I., Berggren Kleja, D., Olsson, M., Knicker, H., 2007. Decomposition and
substrate quality of leaf litters and fine roots from three exotic plantations and a native forest
in the southwestern highlands of Ethiopia. Soil Biology and Biochemistry 39(9), 2317-2328.
Loidi, J., 2005. The Cantabrian-Atlantic oak and beech forests: human influence throughout history.
Chronica Botanica 18, 161-173.
Lorenz, K., Preston, C.M., Krumrei, S., Feger, K.-H., 2004. Decomposition of needle/leaf litter from
Scotr pine, black cherry, common oak and European beech at a conurbation forest site.
European Journal of Forest Research 123, 177-188.
Macías, F., Chesworth, W., 1992. Weathering in humid regios, with emphasis on igneous rocks and
their metamorphic equivalents. In: Martini, I., y Chesworth, W. (eds.). Weathering, Soils and
Paleosoils, Elsevier, New York, pp. 283-347.
MacRae, A., Mehuys, G.R., 1985. The effect of green manuring on the physical properties of
temperate area soils. Advances in Soil Science 3, 71-94.
Martens, D.A., 2000. Plant residue biochemistry regulates soil carbon cycling and carbon
sequestration. Soil Biology and Biochemistry 32, 361-369.
Martínez de Arano, I., Gartzia-Bengoetxea, N., González-Arias, A., Merino A., 2007a. Gestión
forestal y conservación de suelo en los bosques cultivados del País Vasco. Reunión
Nacional de Suelos XXVI Lurzoru Nazio-Bilera, 25-27 Junio, Durango, Bizkaia.
1. INTRODUCCIÓN
47
Martínez de Arano, I., Gartzia-Bengoetxea, N., González-Arias., 2007b. Rotation Forestry,
Continuous Cover Forestry and Soil Sustainability. In: Dedrick, S., Spiecker, H., Orazio, C.,
Tomé, M., Martínez de Arano, I. (eds.) Plantation or Conversion-The Debate!. European
Forest Institute, Discussion paper 13, pp 43-47.
MCPFE, 1993. Resolution H1: General Guidelines for Sustainable Management of Forests in
Europe. Second Ministerial Conference on the Protection of Forests in Europe: Helsinki,
Finland 16-17 June, 2003.
http://mcpfe.mcnet.pl/index.php?kat=26&sel=26
McGill, W.B., Cannon, K.R., Robertson, J.A. and Cook, F.D., 1986. Dynamics of soil microbial
biomass and water soluble organic C in Breton L after 50 years of cropping two rotations.
Canadian Journal of Soil Science 66, 1–19.
Megahan, W.F., 1980. Nonpoint source pollution from forestry activities in the western United
States: results of recent research and research needs. In: Proceedings of the US Forestry and
Water Quality: What Course in the 1980s? Richmond, VA, June 19-20, 1980. Water
Pollution Control Federation, Norwegian Forest Research Institute, Oslo, Norway,
Washington, DC, pp. 92-151.
Merino, A., Edeso, J.M., 1999. Soil fertility rehabilitation in young Pinus radiata D. Don plantation
from Northern Spain after intensive site preparation. Forest Ecology and Management 116,
83-91.
Merino, A., Fernández-López, A., Solla-Gullón, F., Edeso, J.M., 2004. Soil changes and tree growth
in intensively managed Pinus radiata in northern Spain. Forest Ecology and Management
196, 393-404.
Mesa Intersectorial de la Madera, 2002. Ciclos del Pino Radiata. www.mahaia.org
Michel, M., 2003. El pino radiata (Pinus radiata D.Don) en la historia forestal de la Comunidad
Autónoma del País Vasco: análisis de un proceso de forestalismo intensivo. Ph.D. thesis,
Universidad Politécnica de Madrid, Spain.
Moore, I.D., Burch, G.J., Wallbrink, P.J., 1986. Preferential flow and hydraulic conductivity of
forest soils. Soil Science Society of America Journal 50, 876-881.
Morin, J., Benyamini, Y., Michaeli, A., 1981. The effect of raindrop impact on the dynamics of soil
surface crusting and water movement in the profile. Journal of Hydrology 52, 321–335.
Nambiar, E.K.S., 1996. Sustained productivity of forests is a continuing challenge to soil science.
Soil Sci.Soc.Am.J. 60, 1629-1642.
ESTRUCTURA Y DINÁMICA DE LA MATERIA ORGÁNICA DEL SUELO EN ECOSISTEMAS FORESTALES TEMPLADOS…
48
Nilgard, B., 1971. Pedological influence of spruce planted on former beech forest soil in Scania,
South Sweden. Oikos 22, 302-314.
Northup, R.R., Dahlgren, R.A., McColl, J.G., 1998. Polyphenols as regulators of plant-litter-soil
interactions in northern California´s pygmy forest: a positive feedback? Biogeochemistry
42, 189-220.
Oades, J.M., 1984. Soil organic matter and structural stability: mechanisms and implications for
management. Plant and Soil 76, 319–337.
Olsson, B.A., Lundkvist, H., Staaf, H., 2000. Nutrient status in needles of norway spruce and
Scots pine following harvesting of logging residues. Plant and Soil 23, 161-173.
Parton, W.J., Brookes, P.C., Coleman, K., Jenkinson, D.S., 1987. Dynamics of C, N, S, and P in
grassland soils: a model. Biogeochemistry 5, 109–131.
Pikul, J.L., Zuzel, J.F., 1994. Soil crusting and water infiltration affected by long-term tillage and
residue management. Soil Science Society of America Journal 58, 1524-1530.
Ponge, J.-F., 2003. Humus forms in terrestrial ecosystems: a framework to biodiversity. Soil
Biology and Biochemistry 35, 935-945.
Post, W.M., Kwon, K.C., 2000. Soil carbon sequestration and land-use change: Processes and
Potential. Global Change Biology 6, 317-328.
Prescott, C.E., 2002. The influence of forest canopy on nutrient cycling. Tree Physiology 22,
1193-1200.
Pritchett, W.L., Fisher, R.F., 1987. Properties and Management of Forest Soils. Wiley, New York.
Raison, J, Rab, M.A., 2001. Guiding concepts for the application of indicators to interpret change
in soil properties and processes in forests. In: Raison et al. (eds.) Criteria and indicators
for sustainable forest management. 231-258 pp.
Richter, D.D., Markewitz, D., Trumbore, S.E., Wells, C.G., 1999. Rapid accumulation and
turnover of soil carbon in a re-establishing forest. Nature 400, 56-58.
Reeves, D.W., 1997. The role of soil organic matter in maintaining soil quality in continuous
cropping systems. Soil and Tillage Research 43, 131-167.
Rillig, M.C., Wright, S.F., Eviner, V.T., 2002. The role of arbuscular mycorrhizal fungi and
glomalin in soil aggregation: comparing effects of five plant species. Plant and Soil 238,
325– 333.
1. INTRODUCCIÓN
49
Ruiz de Urrestarazu, E., 2001. Patrimonio rural y políticas europeas. Lurralde: Investigación y
espacio 24, 305-314.
Saggar, S., Parshotam, A., Sparling, G.P., C.W., F., Hart, P.B., 1996. 14C-labelled rygrass
turnover and residence times in soils varying in clay content and mineralogy. Soil
Biology & Biochemistry 28, 1677–1686.
Schmidt, M.G., MacDonald, S.E., Rothwell, R.L., 1996. Impacts of harvesting and site
preparation on soil chemical properties of mixed-wood boreal forest sites in Alberta.
Canadian Journal of Soil Science 76, 531-540.
Shen, Y.-H., 1999. Sorption of humic acid to soil: the role of soil mineral composition.
Chemosphere 38, 2489-2499.
Shi, W., Dell, E., Bowman, D., Iyyemperumal, K., 2006. Soil enzyme activities and organic
matter composition in a turfgrass chronosequence. Plant and Soil 288, 285-296.
Sinsabaugh, R.L, Carreiro, M.M., Álvarez, S. 2002. Enzyme and Microbial Dynamics of Litter
Decomposition. In: Burns, R.G, Dick, R.P. (eds.) Enzymes in the Environment, Marcel
Dekker, New York. pp 249-266.
Six, J., Elliott, E.T., Paustian, K., Doran, J.W., 1998. Aggregation and soil organic matter
accumulation in cultivated and native grassland soils. Soil Science Society of America
Journal 62, 1367–1377.
Six, J., Elliott, E.T., Paustian, K., 2000a. Soil macroaggregate turnover and microaggregate
formation: a mechanism for C sequestration under no-tillage agriculture. Soil Biology and
Biochemistry 32, 2099–2103.
Six, J., Elliott, E.T., Paustian, K., 2000b. Soil structure and soil organic matter: II. A normalized
stability index and the effect of mineralogy. Soil Science Society of America Journal 64,
1042–1049.
Six, J., Conant, R.T., Paul, E.A., Paustian, K., 2002. Stabilization mechanisms of soil organic
matter: Implications for C-saturation of soils. Plant and Soil 241:155-176.
Sollins, P., Homann, P., Caldwell, B.A., 1996. Stabilization and destabilization of soil organic
matter: mechanisms and controls. Geoderma 74, 65–105.
Soil Survey Staff. 2006. Keys to Soil Taxonomy, 10th ed. USDA-Natural Resources Conservation
Service, Washington, DC.
ESTRUCTURA Y DINÁMICA DE LA MATERIA ORGÁNICA DEL SUELO EN ECOSISTEMAS FORESTALES TEMPLADOS…
50
SSSA, 1987. Glossary of soil science terms. Soil Science Society of America, Madison, WI, USA,
44 pp.
Tisdall, J.M., Oades, J.M., 1982. Organic matter and water-stable aggregates in soils. Journal of
Soil Science 33, 141–163.
Torn, M.S., Lapenis, A.G., Timofeev, A., Fischer, M.L., Babikov, B.V., Harden, J.W., 2002.
Organic carbon and carbon isotopes in modern and 100-yearold-soil archives of the
Russian steppe. Global Change Biology 8, 941–953.
Vitousek, P.M., Matson, P.A., 1985. Disturbance, nitrogen availability and nitrogen losses in an
intensively managed lobolly pine plantation. Ecology 66, 1360-1376.
von Lützow, M., Kögel-Knabner, I., Ekschmitt, K., Matzner, E., Guggenberger, G., Marschner,
B., Flessa, H., 2006. Stabilization of organic matter in temperate soils: mechanisms and
their relevance under different soil conditions - a review. European Journal of Soil
Science 57, 426-445.
Warkentin, B.P., Fletcher. H.F., 1977. Soil quality for intensive agriculture. Proc. Int. Sem. on
Soil Environ. and Fert. Manage. in Intensive Agric. Soc. Sci. Soil and Manure, Natl. Inst.
of Agric. Sci., Tokyo.
Wattel-Koekkoek, E.J.W., Buurman, P., van der Pflicht, J., Wattel, E., van Breemen, N., 2003.
Mean residence time of soil organic matter associated with kaolinite and smectite.
European Journal of Soil Science 54, 269–278.
Yanai, R.D., Currie, W.S., Goodale, C.L., 2003. Soil carbon dynamics after forest harvest: an
ecosystem paradigm reconsidered. Ecosystems 56, 197–212.
Zou, C.,Sands, R., Buchan, G., Hudson, I., 2000. Least limiting water range: A potential indicator
of physical quality of forest soils. Australian Journal of Soil Research 38, 947-958.

2. Objetives

53
El objetivo general de este trabajo es describir la estructura y dinámica de la materia orgánica
(MO) del suelo de ecosistemas forestales presentes en la zona de clima templado del País Vasco,
así como evaluar el efecto de la intensificación de la gestión forestal sobre la estructura y
dinámica de dicha MO, además de valorar la utilización de diversas fracciones de la MO como
indicadores de Calidad del Suelo o de Gestión Forestal Sostenible. Este objetivo general se intenta
alcanzar con los siguientes objetivos más específicos:
1. Caracterizar propiedades físicas, químicas y biológicas del mantillo (Horizonte O) en
rodales seminaturales y cultivados adyacentes (Capítulo 3).
2. Explorar la relación de diversas fracciones de la MO del horizonte superficial del suelo
con diferentes parámetros físicos y químicos en rodales seminaturales y cultivados
adyacentes, y estudiar el efecto de la intensificación de la gestión sobre ellos para obtener
un conjunto mínimo de parámetros descriptores de los cambios operados en el
funcionamiento del suelo (Capítulo 4).
3. Determinar la relación entre cantidad y calidad de la MO y la estructura del suelo de
rodales seminaturales y cultivados adyacentes (Capítulo 5).
4. Determinar el efecto de la especie forestal dominante sobre las fracciones más lábiles de
la MO en la zona de clima templado del País Vasco a escala de paisaje (Capítulo 6).

2. OBJETIVES
55
The overall objectives of this study were: to describe the structure and dynamics of the soil
organic matter (OM) in forest ecosystems in the temperature climate of the Basque Country; to
evaluate the effect of the intensification of forest management on the structure and dynamics of
the OM, and also to evaluate the use of different fractions of the OM as indicators of soil quality
and of sustainable forest management. In order to achieve these overall objectives, the following
more specific objectives were considered:
1. Characterization of the physical, chemical and biological properties of the forest floor
layer (O Horizon) in adjacent semi-natural and cultivated stands (Chapter 3).
2. Exploration of the relationship between the different fractions of the OM of the surface
horizon of the soil and different physical and chemical parameters in adjacent semi-
natural and cultivated stands, and of the effect of the intensification of management on
these, to obtain a minimum set of parameters to describe the changes in soil functioning
(Chapter 4).
3. Determination of the relationship between quantity and quality of the OM and soil
structure in adjacent semi-natural and cultivated stands (Chapter 5).
4. Determination of the effect of the dominant forest species on the most labile fractions of
the OM in the temperate climate of the Basque Country, at the landscape level (Chapter
6).

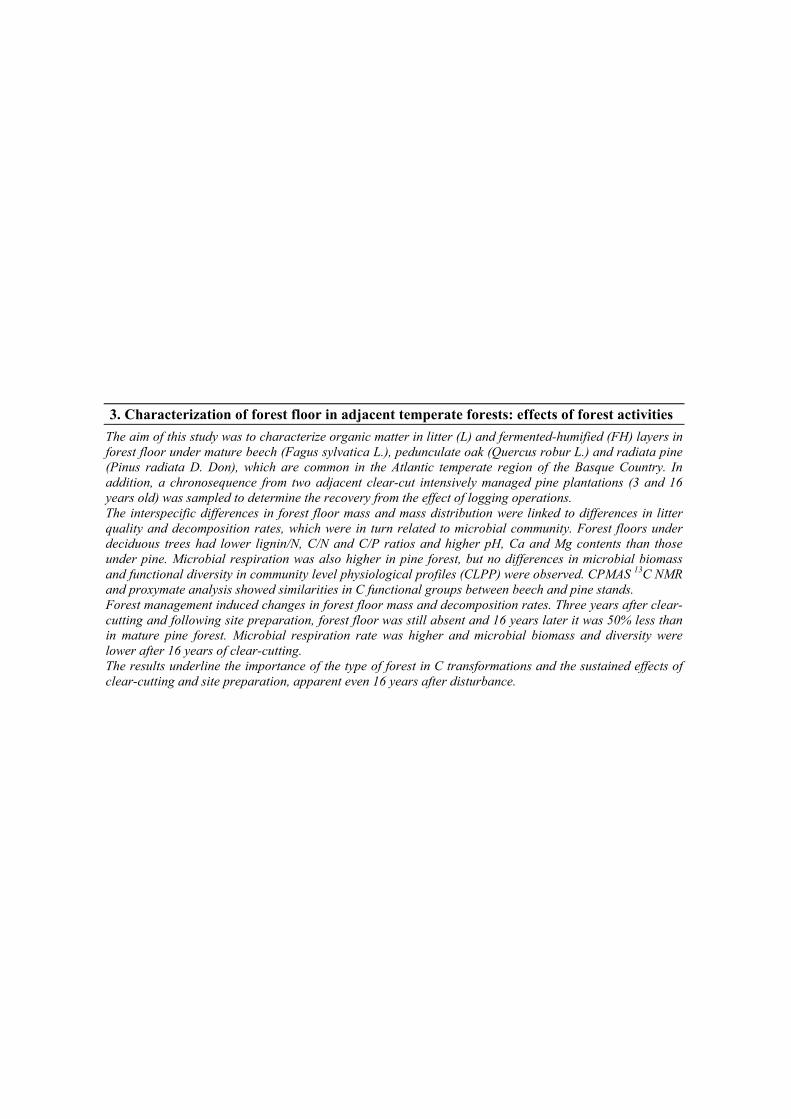
3. Characterization of forest floor in adjacent temperate forests: effects of forest activities The aim of this study was to characterize organic matter in litter (L) and fermented-humified (FH) layers in forest floor under mature beech (Fagus sylvatica L.), pedunculate oak (Quercus robur L.) and radiata pine (Pinus radiata D. Don), which are common in the Atlantic temperate region of the Basque Country. In addition, a chronosequence from two adjacent clear-cut intensively managed pine plantations (3 and 16 years old) was sampled to determine the recovery from the effect of logging operations. The interspecific differences in forest floor mass and mass distribution were linked to differences in litter quality and decomposition rates, which were in turn related to microbial community. Forest floors under deciduous trees had lower lignin/N, C/N and C/P ratios and higher pH, Ca and Mg contents than those under pine. Microbial respiration was also higher in pine forest, but no differences in microbial biomass and functional diversity in community level physiological profiles (CLPP) were observed. CPMAS 13C NMR and proxymate analysis showed similarities in C functional groups between beech and pine stands. Forest management induced changes in forest floor mass and decomposition rates. Three years after clear-cutting and following site preparation, forest floor was still absent and 16 years later it was 50% less than in mature pine forest. Microbial respiration rate was higher and microbial biomass and diversity were lower after 16 years of clear-cutting. The results underline the importance of the type of forest in C transformations and the sustained effects of clear-cutting and site preparation, apparent even 16 years after disturbance.

59
3.1. Introduction
During the XX century, large-scale plantations of the exotic Pinus radiata species were
established on abandoned farmland and mountainous land in the temperate Basque Country
(northern Spain) (Michel, 2003). This tree species now dominates forest plantations in the region
and forests are currently being managed in a clear-cut regime with rotation lengths of between 30
and 40 years, harvesting with chainsaw and skidding, and mechanical site preparation prior to
planting by processes such as blading and down-slope ripping. These human-induced changes to
the landscape are likely to cause changes in the forest composition, net primary production and
consequently, regional patterns of carbon cycling (Pastor and Post, 1988; Finzi et al., 1998; Yanai
et al., 2000). Litter decomposition and the subsequent release of nutrients in plant-available forms
is an essential process in the functioning of forest ecosystems. The rate of litter decomposition is
determined by the prevailing environmental conditions for a given location (Prescott, 1995), by
the intrinsic chemical properties of plant litter or litter quality (Almendros et al., 2000), and by the
diversity and activity of the microbial community (Leckie et al., 2004). Under similar
environmental conditions, the substrate quality and decomposer community, are directly related to
biological diversity (Hättenschwiler et al., 2005).
To our knowledge, there are few studies of the effects of forest activities on substrate quality,
microbial community diversity and decomposition rates in forest floors in temperate forests.
Forest activities in the study region include; (i) introduction of exotic tree species, and (ii)
intensive management, with use of heavy machinery for harvesting and site preparation.
Different tree species show different patterns of forest floor accumulation owing to differences in
SOM chemistry (Raulund-Rasmussen and Vejre, 1995; Hannam et al., 2004). Quideau et al.
(2005) studied Mediterranean evergreen shrubs and found that under scrub oak, leaf litter was
dominated by carbonyl C, whereas under manzanita (Arctostaphylos manzanita Parry.) litter was
dominated by O-alkyl C and under coniferous vegetation, by alkyl C. To our knowledge
differences between temperate forests in terms of the chemical nature and distribution of litter
organic constituents such as carbohydrates, phenols and carboxylic acids, have not been
investigated. These constituents affect the chemical stability of accumulated organic matter and
exert a strong influence on soil microbial activity, by functioning as sources of energy for the
growth and activity of decomposing organisms (Goh and Heng, 1987).
Despite the differences in accumulation patterns under different tree species, the forest floor of
mature forests remains constant because inputs are balanced by outputs. However, disturbances
such as clear-cut forest harvesting and subsequent soil preparation, cause drastic alteration of this
ESTRUCTURA Y DINÁMICA DE LA MATERIA ORGÁNICA DEL SUELO EN ECOSISTEMAS FORESTALES TEMPLADOS…
60
balance. Forest harvesting and site preparation change the quantity and biochemical composition
of plant litter, which serves as the primary substrate for microbial activity. Abundance of dead
organic matter on the soil surface after harvesting and site preparation depend on the forest
management practices selected. Stem-only harvesting may leave an abundance of dead organic
matter on the soil surface, although inputs of detritus are diminished following this initial
contribution. However in forest practices such as blading and subsequent down-slope ripping, all
aboveground organic residues are pushed out of the stand with the front blade of a bulldozer
(Olarieta et al., 1997; Merino et al., 2004). Furthermore, post-harvest residual organic matter
represents a biochemically different substrate from the fine roots, leaves, and dead plant tissues
that comprise litter in mature forests (Covington, 1981). Such a change in substrate input has the
potential to alter the composition of soil microbial communities because bacteria, actinobacteria
and fungi differ in their physiological abilities to metabolize organic substrates contained in plant
litter (Paul and Clark, 1996). Borman and Likens (1979) suggested that the rate of nutrient
mobilization from the forest floor may regulate recovery after devegetation by insuring the
availability of essential elements during recovery. Forest floor plays an important role in recovery
after disturbance (Covington, 1981) and the effect of forest harvest on soil organic matter is
important not only in terms of local successional processes but also global carbon storage (Yanai
et al., 2000).
In this context, the present study was designed to provide basic information on forest floor in
temperate semi-natural and cultivated forests. Our lack of knowledge about the chemistry of forest
floor organic matter and dynamics means that preliminary studies were required to generate the
necessary basic information. The main objectives were: i) to compare the biotic and abiotic
characteristics of the forest floors in three stands dominated by different tree species (European
beech, pedunculate oak and radiata pine) developed under similar soil parent material,
geomorphology and climate, ii) to show the effects on the forest floors of a 3 year old radiata pine
stand and of a 16 year old stand, after mechanical logging and site preparation operations, and iii)
to explore the relationships among measured characteristics of these forest floors to gain insights
into the effect of species change and intensive mechanization on C dynamics.
3.2. Materials and methods
3.2.1. Forest floor sampling
The study site (30T 534075 4783284) was selected as an example of the temperate forest
landscape in the Basque Country; the stands in the site had similar soil types (Typic Udorthent,
Soil Survey Staff, 2006) and climatic conditions, mean annual temperature and precipitation of
3. CHARACTERIZATION OF FOREST FLOOR IN ADJACENT TEMPERATE FORESTS: EFFECTS OF FOREST ACTIVITIES
61
14.1º C and 1200 mm, respectively, and were in close proximity to each other. The strategy of the
study was to evaluate three representative stands of two mature semi-natural forests (Quercus
robur L. and Fagus sylvatica L., hereafter referred to as oak and beech and a nearby first-rotation
and non mechanized cultivated Pinus radiata D. Don plantation (hereafter referred to as pine
40ys) to evaluate the effect of change in tree species on forest floor in these stands. In addition, a
chronosequence was sampled from two adjacent clear-cut sites (3- and 16 years old) (hereafter
referred to as pine 3ys and pine 16ys) to evaluate the effect of mechanized forest operations 3-
and 16-years after disturbance. The logging operations of the two disturbed pine plantations
included forest harvesting with skidders and site preparation by blading and down-slope ripping.
In blading, the soil surface should be scraped, although sometimes the first centimetres of soil are
also excavated and slash and surface organic material are displaced to small piles down-slope
(Macdonald et al., 1998); down-slope ripping consists of deep ploughing (≈ 50 cm) following the
maximum slope of the stand.
In each stand (areas between 0.8-1.5 ha), three trees were selected at random and forest floor
samples (10 samples, 15 x 15 cm template) were systematically collected within a 2.5 m radius
from the base of each of these trees on 13th of April 2005. All samples were collected at the same
time and were divided into L and FH layers and combined to give one composite sample per tree
and layer. The L layer consisted of slightly decomposed litter of identifiable origin, and the FH
layer, which we were not able to separate into F and H layers, consisted of partly decomposed and
very decomposed organic material. Samples for chemical analysis were oven dried to constant
weight, weighed and ground (< 0.5 mm) in a laboratory mill, and samples for microbiological
analysis were stored at 4 ºC for no more than 7 days. L layer samples were cut into smaller pieces
(≈ 1 cm2) and FH layers were passed through a 5 mm sieve.
3.2.2. Forest floor chemical, biochemical and moisture analysis
Organic C and total N were analysed in a LECO CNS 2000 (LECO Corporation, MI, USA). Total
concentrations of P, Ca, Mg, K and Na were determined in aqueous extracts after wet digestion
with nitric-perchloric acid by Inductively Coupled Plasma Emission Spectroscopy (Varian Iberica
S.L., Barcelona, Spain). Forest floor pH was determined in 1:10 FF (forest floor):water solution
(Blakemore et al., 1977). The water-soluble carbohydrates (WSC) were determined
colorimetrically by the anthrone method, in water extracts, according to Deriaz (1961). Acid-
detergent fibre (ADF) and acid-detergent lignin (ADL) were determined with an ANKOM220 fiber
analyzer (ANKOM Technology, NY, USA) (van Soest et al., 1991). The cellulose fraction was
estimated as CEL=ADF−ADL and the ADL fraction was considered to be lignin, although it
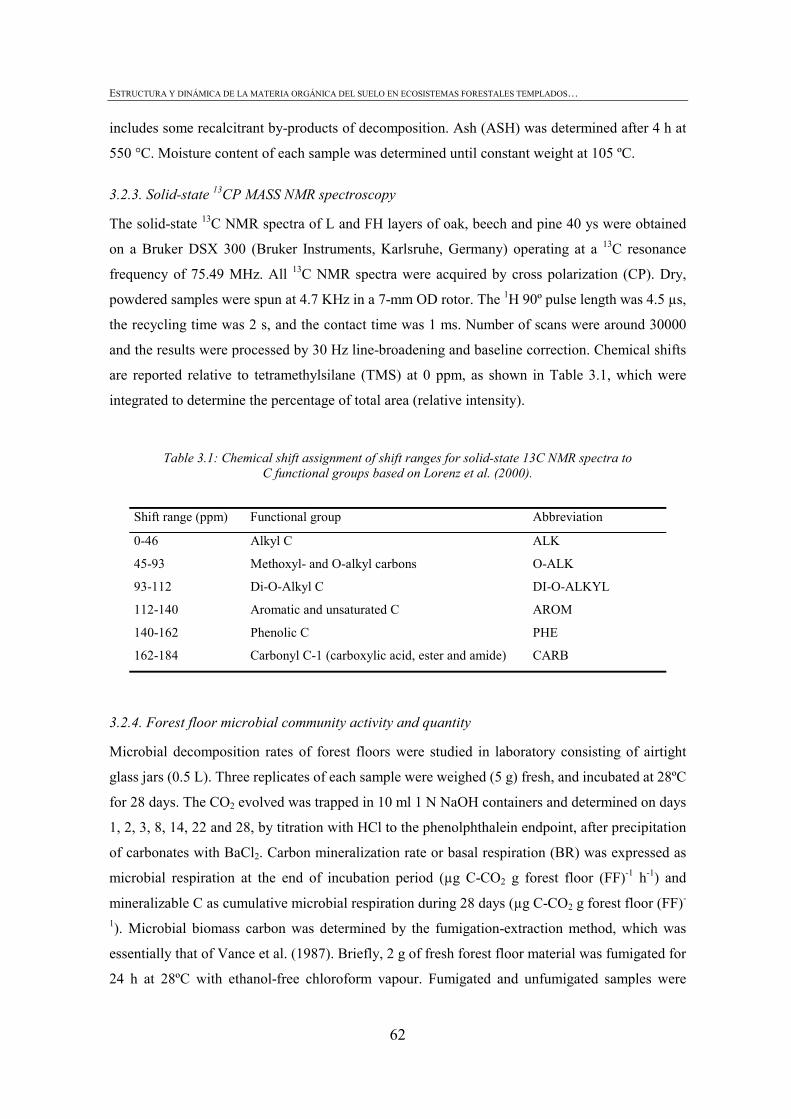
ESTRUCTURA Y DINÁMICA DE LA MATERIA ORGÁNICA DEL SUELO EN ECOSISTEMAS FORESTALES TEMPLADOS…
62
includes some recalcitrant by-products of decomposition. Ash (ASH) was determined after 4 h at
550 °C. Moisture content of each sample was determined until constant weight at 105 ºC.
3.2.3. Solid-state 13CP MASS NMR spectroscopy
The solid-state 13C NMR spectra of L and FH layers of oak, beech and pine 40 ys were obtained
on a Bruker DSX 300 (Bruker Instruments, Karlsruhe, Germany) operating at a 13C resonance
frequency of 75.49 MHz. All 13C NMR spectra were acquired by cross polarization (CP). Dry,
powdered samples were spun at 4.7 KHz in a 7-mm OD rotor. The 1H 90º pulse length was 4.5 µs,
the recycling time was 2 s, and the contact time was 1 ms. Number of scans were around 30000
and the results were processed by 30 Hz line-broadening and baseline correction. Chemical shifts
are reported relative to tetramethylsilane (TMS) at 0 ppm, as shown in Table 3.1, which were
integrated to determine the percentage of total area (relative intensity).
Table 3.1: Chemical shift assignment of shift ranges for solid-state 13C NMR spectra to C functional groups based on Lorenz et al. (2000).
Shift range (ppm) Functional group Abbreviation
0-46 Alkyl C ALK
45-93 Methoxyl- and O-alkyl carbons O-ALK
93-112 Di-O-Alkyl C DI-O-ALKYL
112-140 Aromatic and unsaturated C AROM
140-162 Phenolic C PHE
162-184 Carbonyl C-1 (carboxylic acid, ester and amide) CARB
3.2.4. Forest floor microbial community activity and quantity
Microbial decomposition rates of forest floors were studied in laboratory consisting of airtight
glass jars (0.5 L). Three replicates of each sample were weighed (5 g) fresh, and incubated at 28ºC
for 28 days. The CO2 evolved was trapped in 10 ml 1 N NaOH containers and determined on days
1, 2, 3, 8, 14, 22 and 28, by titration with HCl to the phenolphthalein endpoint, after precipitation
of carbonates with BaCl2. Carbon mineralization rate or basal respiration (BR) was expressed as
microbial respiration at the end of incubation period (µg C-CO2 g forest floor (FF)-1 h-1) and
mineralizable C as cumulative microbial respiration during 28 days (µg C-CO2 g forest floor (FF)-
1). Microbial biomass carbon was determined by the fumigation-extraction method, which was
essentially that of Vance et al. (1987). Briefly, 2 g of fresh forest floor material was fumigated for
24 h at 28ºC with ethanol-free chloroform vapour. Fumigated and unfumigated samples were
3. CHARACTERIZATION OF FOREST FLOOR IN ADJACENT TEMPERATE FORESTS: EFFECTS OF FOREST ACTIVITIES
63
extracted with 0.5 M K2SO4 (30 min, 200 rpm). The extracts were filtered through Whatman nº 42
filters and total organic C was determined by digestion in chromic acid.
3.2.5. Forest floor microbial community diversity
The functional diversity of microbial communities was characterized by community level
physiological profiles (CLPP) with a Biolog EcoplateTM microplating system (Biolog, Hayward,
CA, USA) based on the methods of Degens et al. (2001) and Grayston and Prescott (2005).
EcoplatesTM use 31 carbon substrates that are more ecologically relevant compounds and are
likely to provide a useful test for microbial analysis and to pick up those microorganisms usually
missed through being swamped by faster growing r-strategists species on GN plates (Campbell et
al., 1997). Briefly, moist forest floor samples (5 g) were suspended in 50 ml of one-quarter
strength Ringer´s solution with 30 glass beads of 3 mm diameter for 15 min in a reciprocating
shaker at high speed (250 rpm). Ten fold dilutions were made in de-ionized water, until 10-3, and
this was centrifuged at 750 g for 10 min. Aliquots (125 µl) of the resulting suspension were
inoculated in EcoplatesTM, incubated in dark at 28 ºC and colour formation read as light
absorbance at 595 nm after 0, 16, 20, 24, 40, 44, 48, 64, 68, 72, 88, 92, 96 and 160 h in a
multifunctional Zenyth 3100 microplate reader (Anthos Labtec Instruments, Salzburg, Austria).
The absorbance of the control value was subtracted from the absorbance value of wells containing
C substrates for each time. The average number of substrates used (NUS) was calculated on the
basis of majority-rules decision established by Goodfriend (1998) whereby substrate use was
confirmed if dye reaction was positive (>0.25 absorbance units); the Shannon diversity index was
used as practical indicator of overall measure of microbial functional diversity (Degens et al.,
2001). Average well colour development (AWCD) of each sample was also calculated and used to
transform individual carbon source values to eliminate variation in AWCD caused by different
cell densities (Garland and Mills, 1991).
3.2.6. Statistical analysis
One-way analysis of variance (ANOVA) was applied to the forest floor chemical properties to
detect differences in the stands dominated by different tree species and differences in the
mechanized stands and the non mechanized adult pine stand. Variables were tested for normality
and Levene´s test for homogeneity of variances was used prior to conducting one-way analysis of
variance, and a protected least-significant difference (PLSD) test was used to determine the
significance of main effects revealed by ANOVA. In a similar way, the Student t-test was used to
show differences between forest floor layers. These statistical analyses were performed to gain a
deeper insight into the data structure. Nevertheless, because of the inherent large variability
ESTRUCTURA Y DINÁMICA DE LA MATERIA ORGÁNICA DEL SUELO EN ECOSISTEMAS FORESTALES TEMPLADOS…
64
usually found in the parameters that characterize forest ecosystems and also the lack of stand
replicates, statistical analysis were used to show trends in change among the studied stands, rather
than to make specific conclusions about the effects of species change or mechanical operations on
forest floor. Differences were therefore also considered significant at P < 0.10 (Six et al., 2002).
The CLPP data was firstly analysed by Principal Component Analysis (PCA) to reduce the
dimensionality in data. The first 10 components of the PCA were used in a Canonical Variate
Analysis (Grayston and Prescott, 2005) to determine whether microorganisms present in the
studied forest floor samples differed in the overall patterns of carbon utilisation. The ordination
coordinate loadings were also used to identify the carbon sources responsible for the
discrimination and component scores were compared by mean separation tests to detect
significant differences between tree species (PLSD) and forest floor layer (t-test).
Another Principal Component Analysis (PCA) was also performed, considering the whole
standardized data set as an explanatory test of multivariate significance of component factors
between groups (Stevenson et al., 2004). Factors in PCA analysis were retained to explain at least
75 % of the variance of the original data and composite variables of the factors were selected on
the basis of the variable loadings being greater or equal to 0.6 (Lee, 1993).
3.3. Results
3.3.1. Forest floor mass, chemical and biochemical properties
Total forest floor mass varied with tree species (F= 18.98, P < 0.01) and time since disturbance
(F= 36.07, P < 0.001). Beech stand showed significantly higher forest floor mass (25.2 ± 2.1 Mg
ha-1) than pine 40ys (16.35 ± 1.9 Mg ha-1) and oak stands (7.55 ± 0.2 Mg ha-1).
Pine 3ys stand showed a complete absence of the forest floor mainly due to the mechanical site
preparation (blading and down-slope ripping) applied on the stand. Pine 16ys stand forest floor (8.13
± 0.6 Mg ha-1) was higher than in pine 3ys stand but still significantly lower than in mature pine.
One hundred percent (100%) of the forest floor mass under oak was found in the L layer, whereas
each forest floor layer accounted for 50 % of the forest floor mass beneath beech. In the two
coniferous stands with forest floor (pine 40ys and pine 16ys), the FH layer accounted for 70 % of
the forest floor mass in pine 40ys and 30 % in pine 16ys.
In L layers, forest floor pH, and concentrations of Ca, Mg and K were significantly higher in oak
and beech stands than in the pine stand (Table 3.2). Total concentration of C was lower in the oak
stand than in beech and pine 40ys, however concentrations of N and P were similar in oak and pine
3. CHARACTERIZATION OF FOREST FLOOR IN ADJACENT TEMPERATE FORESTS: EFFECTS OF FOREST ACTIVITIES
65
40ys stands and significantly higher in the beech stand. As regards litter quality variables, oak and
beech forests showed similar C/N and C/P ratios whereas the ratios in mature pine forest were
significantly higher. Pine 16ys and pine 40ys showed similar concentrations of nutrients and C/N
ratio, but pine 16ys showed significantly lower C/P ratio in L layer. In FH layers, the only
significant differences found between beech and mature pine were the higher pH value and lower
C/N ratios in beech forest. Mature pine and pine 16ys stands showed similar chemical properties in
FH layers. Forest floor layers differed significantly in concentration of nutrients and quality of
organic matter. A significant increase in concentration of potassium, magnesium, sodium and
phosphorous and a significant reduction in C/N and C/P ratios was observed with depth (Table 3.2).
The biochemical properties of slightly decomposed litter material (L layer) were similar in beech
and pine stands but significantly different in the oak stand. Oak showed significantly lower ADF,
CEL and lignin than beech and pine 40ys (Table 3.3). However, lignin/N ratio, another litter
quality variable, differed significantly among oak and beech stands and pine 40ys stand, showing
highest values in the pine forest. Both pine stands (pine 40ys and pine 16ys) showed very similar
biochemical properties in L layer. In FH layers, beech and pine 40ys had similar properties but
pine 16ys had significantly higher WSC than pine 40ys. In all stands, ADF, CEL and lignin were
significantly lower in FH layer than L layer. WSC also decreased in all forest floors with depth
but in pine 16ys (Table 3.3).
3.3.2. Solid-state 13CPMASS NMR spectroscopy
The 13CP NMR spectra of L and FH layers of mature oak, beech and radiata pine forests are
shown in Fig. 1. In forest floor L layers, the ALK region of the spectra showed one mean peak at
29-30 ppm, corresponding to polymethylene type carbons, but oak and beech samples showed an
additional shoulder at 19-20 ppm, corresponding to acetate groups. In all tree species, major
signals in the -O-ALK region of carbons was found around 73 ppm, which is characteristic of
carbons of cellulose and hemicellulose. The shoulder at 63 ppm was assigned to the C-6 carbon of
carbohydrates and was noteworthy in beech and oak forest floor L layers. An additional peak at
56-57 ppm was a carbon signal for lignins (Fig 3.1).
In the DI-O-ALK region of the spectra, the C-2 and C-6 carbons of syringyl lignin units probably
contributed to the peak centred around 105 ppm (Preston et al., 2000), present in all samples.
However, the peak at 117 ppm that may correspond to C-substituted aromatic carbons (Quideau et
al., 2005), was less ambiguous in beech forest floor, while phenolic carbons between 140-164
ppm appear more intensely in oak forest floor. Finally, the peak at 174 ppm, which was indicative
of carbonyl carbons, was also more noteworthy in oak forest floor.
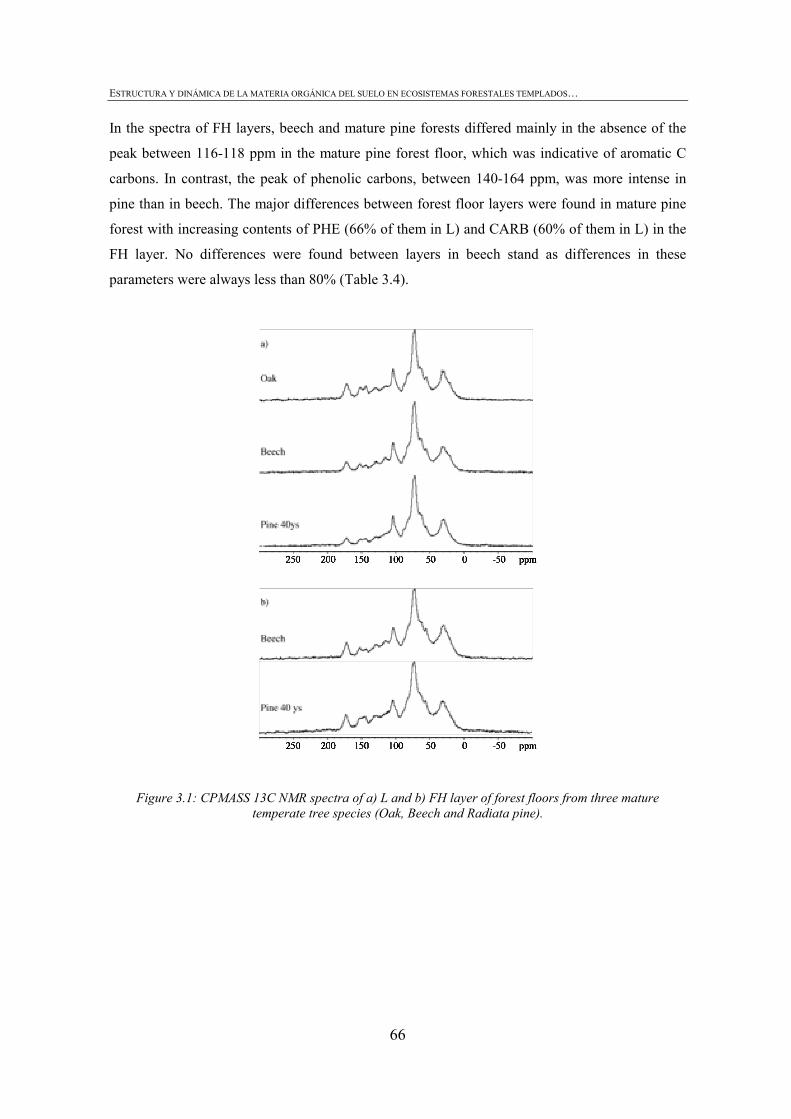
ESTRUCTURA Y DINÁMICA DE LA MATERIA ORGÁNICA DEL SUELO EN ECOSISTEMAS FORESTALES TEMPLADOS…
66
In the spectra of FH layers, beech and mature pine forests differed mainly in the absence of the
peak between 116-118 ppm in the mature pine forest floor, which was indicative of aromatic C
carbons. In contrast, the peak of phenolic carbons, between 140-164 ppm, was more intense in
pine than in beech. The major differences between forest floor layers were found in mature pine
forest with increasing contents of PHE (66% of them in L) and CARB (60% of them in L) in the
FH layer. No differences were found between layers in beech stand as differences in these
parameters were always less than 80% (Table 3.4).
Figure 3.1: CPMASS 13C NMR spectra of a) L and b) FH layer of forest floors from three mature temperate tree species (Oak, Beech and Radiata pine).
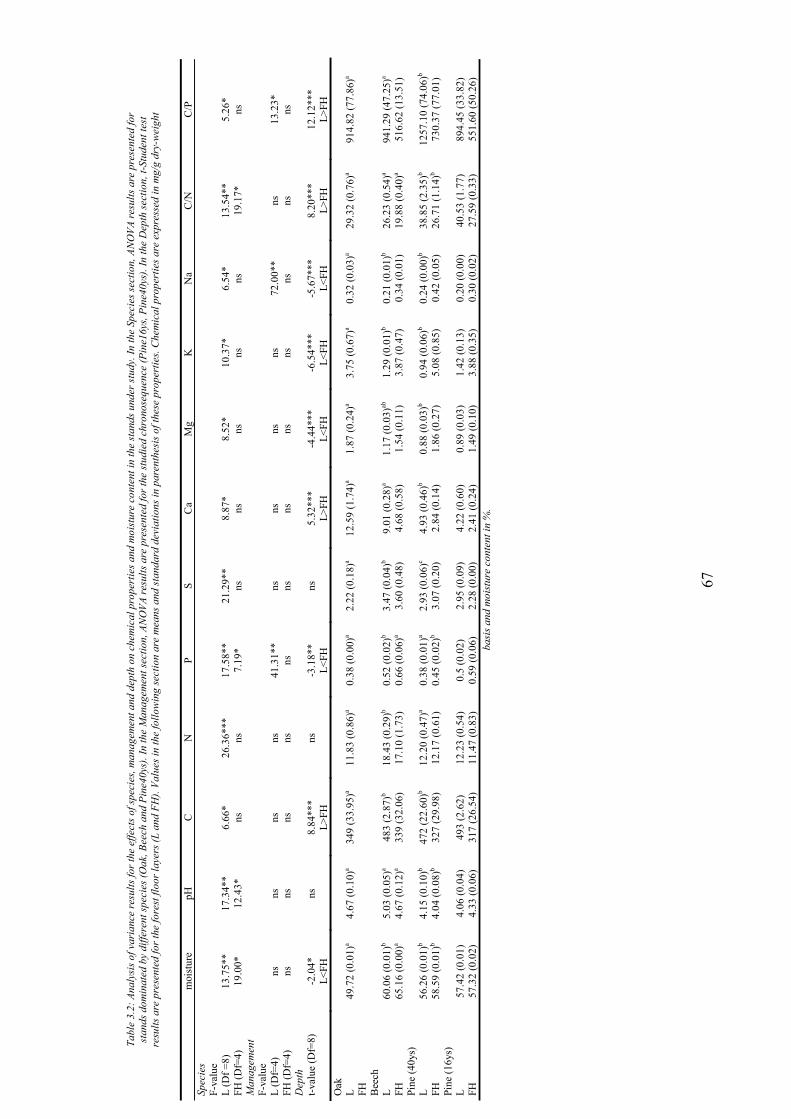
67
Tabl
e 3.
2: A
naly
sis o
f var
ianc
e re
sults
for t
he e
ffect
s of s
peci
es, m
anag
emen
t and
dep
th o
n ch
emic
al p
rope
rtie
s and
moi
stur
e co
nten
t in
the
stan
ds u
nder
stud
y. In
the
Spec
ies s
ectio
n, A
NO
VA re
sults
are
pre
sent
ed fo
r st
ands
dom
inat
ed b
y di
ffere
nt sp
ecie
s (O
ak, B
eech
and
Pin
e40y
s). I
n th
e M
anag
emen
t sec
tion,
AN
OVA
resu
lts a
re p
rese
nted
for t
he st
udie
d ch
rono
sequ
ence
(Pin
e16y
s, Pi
ne40
ys).
In th
e D
epth
sect
ion,
t-St
uden
t tes
t re
sults
are
pre
sent
ed fo
r the
fore
st fl
oor l
ayer
s (L
and
FH).
Valu
es in
the
follo
win
g se
ctio
n ar
e m
eans
and
stan
dard
dev
iatio
ns in
par
enth
esis
of t
hese
pro
pert
ies.
Che
mic
al p
rope
rtie
s are
exp
ress
ed in
mg/
g dr
y-w
eigh
t
basi
s and
moi
stur
e co
nten
t in
%.
m
oist
ure
pH
C
N
P S
Ca
Mg
K
Na
C/N
C
/P
Spec
ies
F-va
lue
L (D
f =8)
13
.75*
* 17
.34*
* 6.
66*
26.3
6***
17
.58*
* 21
.29*
* 8.
87*
8.52
* 10
.37*
6.
54*
13.5
4**
5.26
* FH
(Df=
4)
19.0
0*
12.4
3*
ns
ns
7.19
* ns
ns
ns
ns
ns
19
.17*
ns
M
anag
emen
t
F-
valu
e
L
(Df=
4)
ns
ns
ns
ns
41.3
1**
ns
ns
ns
ns
72.0
0**
ns
13.2
3*
FH (D
f=4)
ns
ns
ns
ns
ns
ns
ns
ns
ns
ns
ns
ns
D
epth
t-v
alue
(Df=
8)
-2.0
4*
ns
8.84
***
ns
-3.1
8**
ns
5.32
***
-4.4
4***
-6
.54*
**
-5.6
7***
8.
20**
* 12
.12*
**
L<
FH
L>
FH
L<
FH
L>
FH
L<FH
L<
FH
L<FH
L>
FH
L>FH
O
ak
L 49
.72
(0.0
1)a
4.67
(0.1
0)a
349
(33.
95)a
11.8
3 (0
.86)
a 0.
38 (0
.00)
a 2.
22 (0
.18)
a 12
.59
(1.7
4)a
1.87
(0.2
4)a
3.75
(0.6
7)a
0.32
(0.0
3)a
29.3
2 (0
.76)
a 91
4.82
(77.
86)a
FH
Bee
ch
L 60
.06
(0.0
1)b
5.03
(0.0
5)a
483
(2.8
7)b
18.4
3 (0
.29)
b 0.
52 (0
.02)
b 3.
47 (0
.04)
b 9.
01 (0
.28)
a 1.
17 (0
.03)
ab
1.29
(0.0
1)b
0.21
(0.0
1)b
26.2
3 (0
.54)
a 94
1.29
(47.
25)a
FH
65.1
6 (0
.00)
a 4.
67 (0
.12)
a 33
9 (3
2.06
) 17
.10
(1.7
3)
0.66
(0.0
6)a
3.60
(0.4
8)
4.68
(0.5
8)
1.54
(0.1
1)
3.87
(0.4
7)
0.34
(0.0
1)
19.8
8 (0
.40)
a 51
6.62
(13.
51)
Pine
(40y
s)
L 56
.26
(0.0
1)b
4.15
(0.1
0)b
472
(22.
60)b
12.2
0 (0
.47)
a 0.
38 (0
.01)
a 2.
93 (0
.06)
c 4.
93 (0
.46)
b 0.
88 (0
.03)
b 0.
94 (0
.06)
b 0.
24 (0
.00)
b 38
.85
(2.3
5)b
1257
.10
(74.
06)b
FH
58.5
9 (0
.01)
b 4.
04 (0
.08)
b 32
7 (2
9.98
) 12
.17
(0.6
1)
0.45
(0.0
2)b
3.07
(0.2
0)
2.84
(0.1
4)
1.86
(0.2
7)
5.08
(0.8
5)
0.42
(0.0
5)
26.7
1 (1
.14)
b 73
0.37
(77.
01)
Pine
(16y
s)
L 57
.42
(0.0
1)
4.06
(0.0
4)
493
(2.6
2)
12.2
3 (0
.54)
0.
5 (0
.02)
2.
95 (0
.09)
4.
22 (0
.60)
0.
89 (0
.03)
1.
42 (0
.13)
0.
20 (0
.00)
40
.53
(1.7
7)
894.
45 (3
3.82
) FH
57
.32
(0.0
2)
4.33
(0.0
6)
317
(26.
54)
11.4
7 (0
.83)
0.
59 (0
.06)
2.
28 (0
.00)
2.
41 (0
.24)
1.
49 (0
.10)
3.
88 (0
.35)
0.
30 (0
.02)
27
.59
(0.3
3)
551.
60 (5
0.26
)
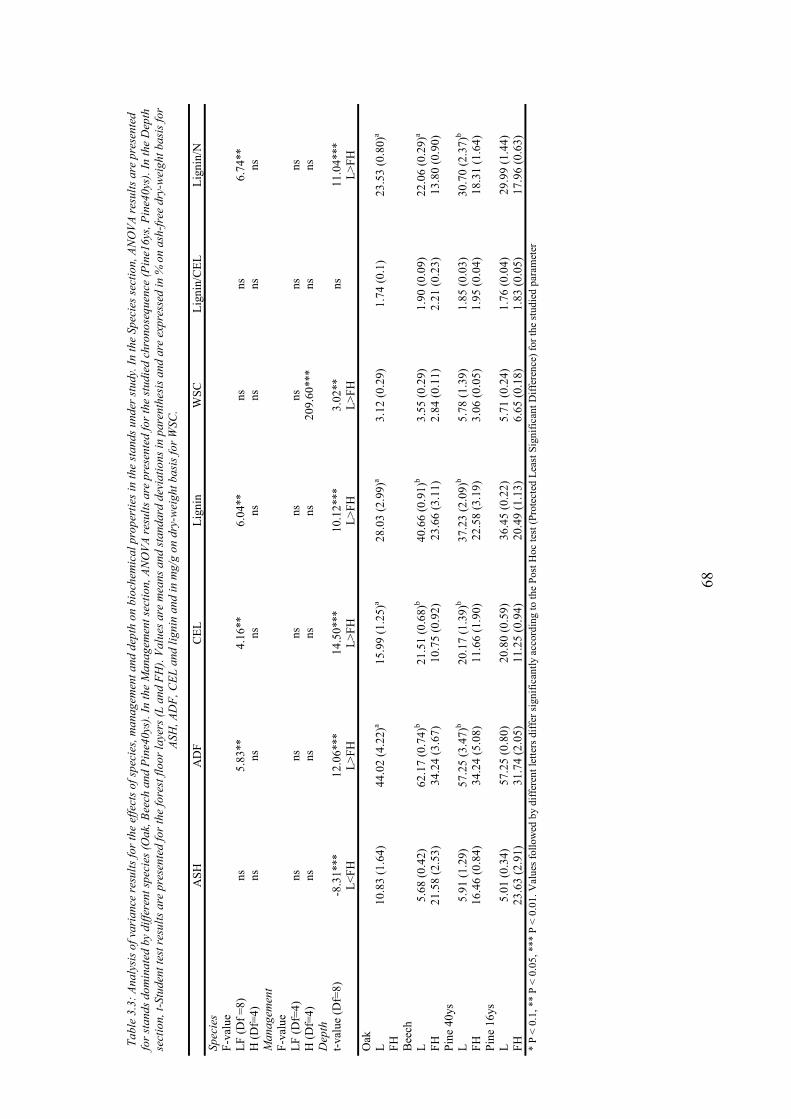
68
Tabl
e 3.
3: A
naly
sis o
f var
ianc
e re
sults
for t
he e
ffect
s of s
peci
es, m
anag
emen
t and
dep
th o
n bi
oche
mic
al p
rope
rtie
s in
the
stan
ds u
nder
stud
y. In
the
Spec
ies s
ectio
n, A
NO
VA re
sults
are
pre
sent
ed
for s
tand
s dom
inat
ed b
y di
ffere
nt sp
ecie
s (O
ak, B
eech
and
Pin
e40y
s). I
n th
e M
anag
emen
t sec
tion,
AN
OVA
resu
lts a
re p
rese
nted
for t
he st
udie
d ch
rono
sequ
ence
(Pin
e16y
s, Pi
ne40
ys).
In th
e D
epth
se
ctio
n, t-
Stud
ent t
est r
esul
ts a
re p
rese
nted
for t
he fo
rest
floo
r lay
ers (
L an
d FH
). Va
lues
are
mea
ns a
nd st
anda
rd d
evia
tions
in p
aren
thes
is a
nd a
re e
xpre
ssed
in %
on
ash-
free
dry
-wei
ght b
asis
for
ASH
, AD
F, C
EL a
nd li
gnin
and
in m
g/g
on d
ry-w
eigh
t bas
is fo
r WSC
.
* P
< 0.
1, *
* P
< 0.
05, *
** P
< 0
.01.
Val
ues f
ollo
wed
by
diffe
rent
lette
rs d
iffer
sign
ifica
ntly
acc
ordi
ng to
the
Post
Hoc
test
(Pro
tect
ed L
east
Sig
nific
ant D
iffer
ence
) for
the
stud
ied
para
met
er
A
SH
AD
F C
EL
Lign
in
WSC
Li
gnin
/CEL
Li
gnin
/N
Spec
ies
F-
valu
e
LF (D
f =8)
ns
5.
83**
4.
16**
6.
04**
ns
ns
6.
74**
H
(Df=
4)
ns
ns
ns
ns
ns
ns
ns
Man
agem
ent
F-
valu
e
LF (D
f=4)
ns
ns
ns
ns
ns
ns
ns
H
(Df=
4)
ns
ns
ns
ns
209.
60**
* ns
ns
D
epth
t-val
ue (D
f=8)
-8
.31*
**
12.0
6***
14
.50*
**
10.1
2***
3.
02**
ns
11
.04*
**
L<
FH
L>FH
L>
FH
L>FH
L>
FH
L>
FH
Oak
L 10
.83
(1.6
4)
44.0
2 (4
.22)
a 15
.99
(1.2
5)a
28.0
3 (2
.99)
a 3.
12 (0
.29)
1.
74 (0
.1)
23.5
3 (0
.80)
a FH
Bee
ch
L
5.68
(0.4
2)
62.1
7 (0
.74)
b 21
.51
(0.6
8)b
40.6
6 (0
.91)
b 3.
55 (0
.29)
1.
90 (0
.09)
22
.06
(0.2
9)a
FH
21.5
8 (2
.53)
34
.24
(3.6
7)
10.7
5 (0
.92)
23
.66
(3.1
1)
2.84
(0.1
1)
2.21
(0.2
3)
13.8
0 (0
.90)
Pi
ne 4
0ys
L
5.91
(1.2
9)
57.2
5 (3
.47)
b 20
.17
(1.3
9)b
37.2
3 (2
.09)
b 5.
78 (1
.39)
1.
85 (0
.03)
30
.70
(2.3
7)b
FH
16.4
6 (0
.84)
34
.24
(5.0
8)
11.6
6 (1
.90)
22
.58
(3.1
9)
3.06
(0.0
5)
1.95
(0.0
4)
18.3
1 (1
.64)
Pi
ne 1
6ys
L
5.01
(0.3
4)
57.2
5 (0
.80)
20
.80
(0.5
9)
36.4
5 (0
.22)
5.
71 (0
.24)
1.
76 (0
.04)
29
.99
(1.4
4)
FH
23.6
3 (2
.91)
31
.74
(2.0
5)
11.2
5 (0
.94)
20
.49
(1.1
3)
6.65
(0.1
8)
1.83
(0.0
5)
17.9
6 (0
.63)
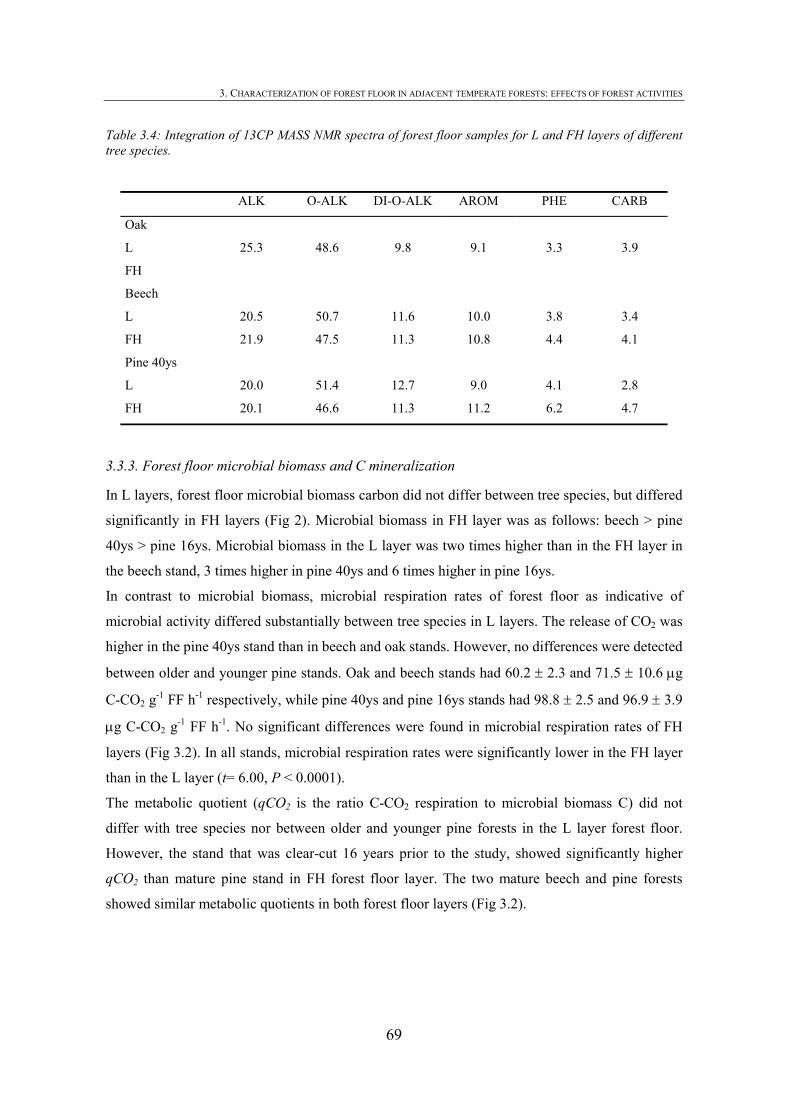
3. CHARACTERIZATION OF FOREST FLOOR IN ADJACENT TEMPERATE FORESTS: EFFECTS OF FOREST ACTIVITIES
69
Table 3.4: Integration of 13CP MASS NMR spectra of forest floor samples for L and FH layers of different tree species.
3.3.3. Forest floor microbial biomass and C mineralization
In L layers, forest floor microbial biomass carbon did not differ between tree species, but differed
significantly in FH layers (Fig 2). Microbial biomass in FH layer was as follows: beech > pine
40ys > pine 16ys. Microbial biomass in the L layer was two times higher than in the FH layer in
the beech stand, 3 times higher in pine 40ys and 6 times higher in pine 16ys.
In contrast to microbial biomass, microbial respiration rates of forest floor as indicative of
microbial activity differed substantially between tree species in L layers. The release of CO2 was
higher in the pine 40ys stand than in beech and oak stands. However, no differences were detected
between older and younger pine stands. Oak and beech stands had 60.2 ± 2.3 and 71.5 ± 10.6 μg
C-CO2 g-1 FF h-1 respectively, while pine 40ys and pine 16ys stands had 98.8 ± 2.5 and 96.9 ± 3.9
μg C-CO2 g-1 FF h-1. No significant differences were found in microbial respiration rates of FH
layers (Fig 3.2). In all stands, microbial respiration rates were significantly lower in the FH layer
than in the L layer (t= 6.00, P < 0.0001).
The metabolic quotient (qCO2 is the ratio C-CO2 respiration to microbial biomass C) did not
differ with tree species nor between older and younger pine forests in the L layer forest floor.
However, the stand that was clear-cut 16 years prior to the study, showed significantly higher
qCO2 than mature pine stand in FH forest floor layer. The two mature beech and pine forests
showed similar metabolic quotients in both forest floor layers (Fig 3.2).
ALK O-ALK DI-O-ALK AROM PHE CARB
Oak
L 25.3 48.6 9.8 9.1 3.3 3.9
FH
Beech
L 20.5 50.7 11.6 10.0 3.8 3.4
FH 21.9 47.5 11.3 10.8 4.4 4.1
Pine 40ys
L 20.0 51.4 12.7 9.0 4.1 2.8
FH 20.1 46.6 11.3 11.2 6.2 4.7
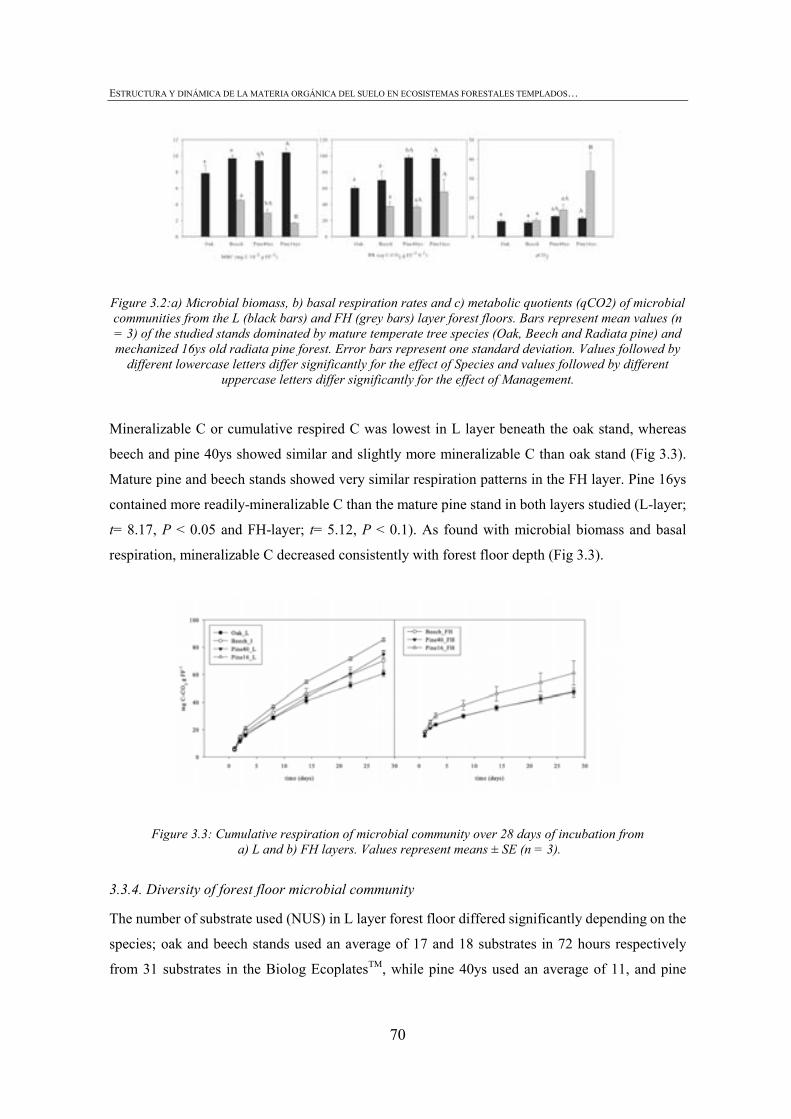
ESTRUCTURA Y DINÁMICA DE LA MATERIA ORGÁNICA DEL SUELO EN ECOSISTEMAS FORESTALES TEMPLADOS…
70
Figure 3.2:a) Microbial biomass, b) basal respiration rates and c) metabolic quotients (qCO2) of microbial communities from the L (black bars) and FH (grey bars) layer forest floors. Bars represent mean values (n = 3) of the studied stands dominated by mature temperate tree species (Oak, Beech and Radiata pine) and mechanized 16ys old radiata pine forest. Error bars represent one standard deviation. Values followed by
different lowercase letters differ significantly for the effect of Species and values followed by different uppercase letters differ significantly for the effect of Management.
Mineralizable C or cumulative respired C was lowest in L layer beneath the oak stand, whereas
beech and pine 40ys showed similar and slightly more mineralizable C than oak stand (Fig 3.3).
Mature pine and beech stands showed very similar respiration patterns in the FH layer. Pine 16ys
contained more readily-mineralizable C than the mature pine stand in both layers studied (L-layer;
t= 8.17, P < 0.05 and FH-layer; t= 5.12, P < 0.1). As found with microbial biomass and basal
respiration, mineralizable C decreased consistently with forest floor depth (Fig 3.3).
Figure 3.3: Cumulative respiration of microbial community over 28 days of incubation from a) L and b) FH layers. Values represent means ± SE (n = 3).
3.3.4. Diversity of forest floor microbial community
The number of substrate used (NUS) in L layer forest floor differed significantly depending on the
species; oak and beech stands used an average of 17 and 18 substrates in 72 hours respectively
from 31 substrates in the Biolog EcoplatesTM, while pine 40ys used an average of 11, and pine
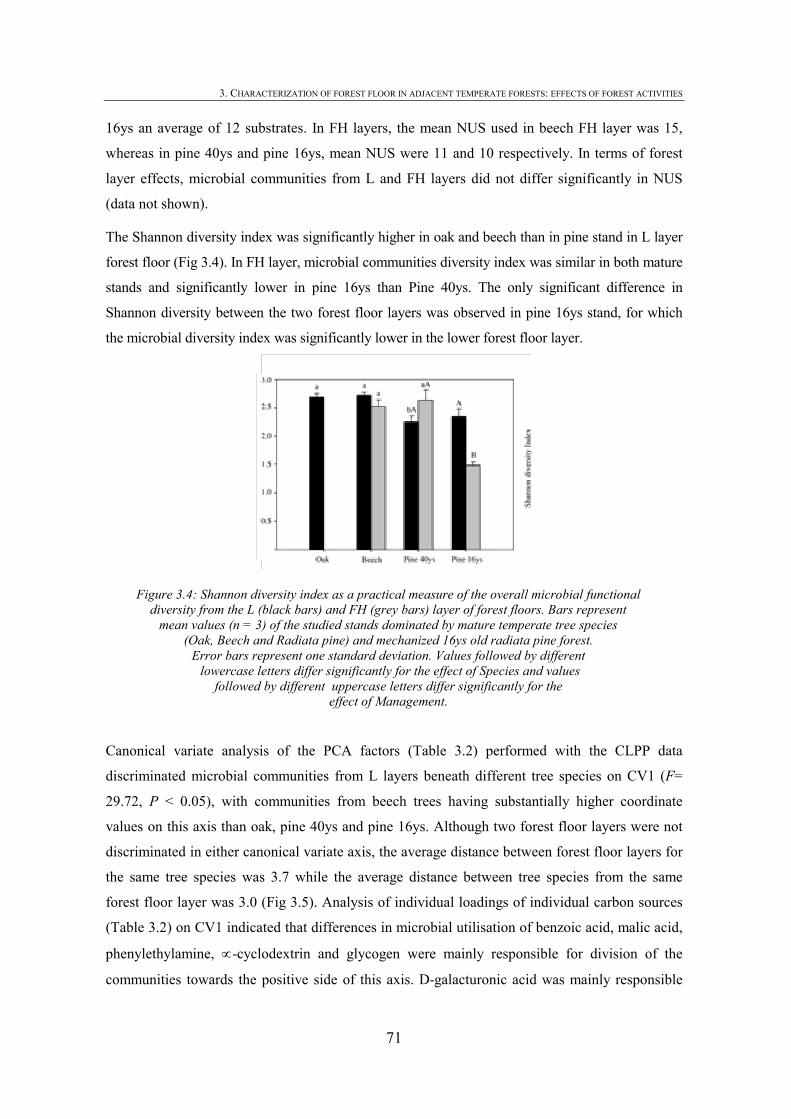
3. CHARACTERIZATION OF FOREST FLOOR IN ADJACENT TEMPERATE FORESTS: EFFECTS OF FOREST ACTIVITIES
71
16ys an average of 12 substrates. In FH layers, the mean NUS used in beech FH layer was 15,
whereas in pine 40ys and pine 16ys, mean NUS were 11 and 10 respectively. In terms of forest
layer effects, microbial communities from L and FH layers did not differ significantly in NUS
(data not shown).
The Shannon diversity index was significantly higher in oak and beech than in pine stand in L layer
forest floor (Fig 3.4). In FH layer, microbial communities diversity index was similar in both mature
stands and significantly lower in pine 16ys than Pine 40ys. The only significant difference in
Shannon diversity between the two forest floor layers was observed in pine 16ys stand, for which
the microbial diversity index was significantly lower in the lower forest floor layer.
Figure 3.4: Shannon diversity index as a practical measure of the overall microbial functional diversity from the L (black bars) and FH (grey bars) layer of forest floors. Bars represent
mean values (n = 3) of the studied stands dominated by mature temperate tree species (Oak, Beech and Radiata pine) and mechanized 16ys old radiata pine forest.
Error bars represent one standard deviation. Values followed by different lowercase letters differ significantly for the effect of Species and values
followed by different uppercase letters differ significantly for the effect of Management.
Canonical variate analysis of the PCA factors (Table 3.2) performed with the CLPP data
discriminated microbial communities from L layers beneath different tree species on CV1 (F=
29.72, P < 0.05), with communities from beech trees having substantially higher coordinate
values on this axis than oak, pine 40ys and pine 16ys. Although two forest floor layers were not
discriminated in either canonical variate axis, the average distance between forest floor layers for
the same tree species was 3.7 while the average distance between tree species from the same
forest floor layer was 3.0 (Fig 3.5). Analysis of individual loadings of individual carbon sources
(Table 3.2) on CV1 indicated that differences in microbial utilisation of benzoic acid, malic acid,
phenylethylamine, ∝-cyclodextrin and glycogen were mainly responsible for division of the
communities towards the positive side of this axis. D-galacturonic acid was mainly responsible
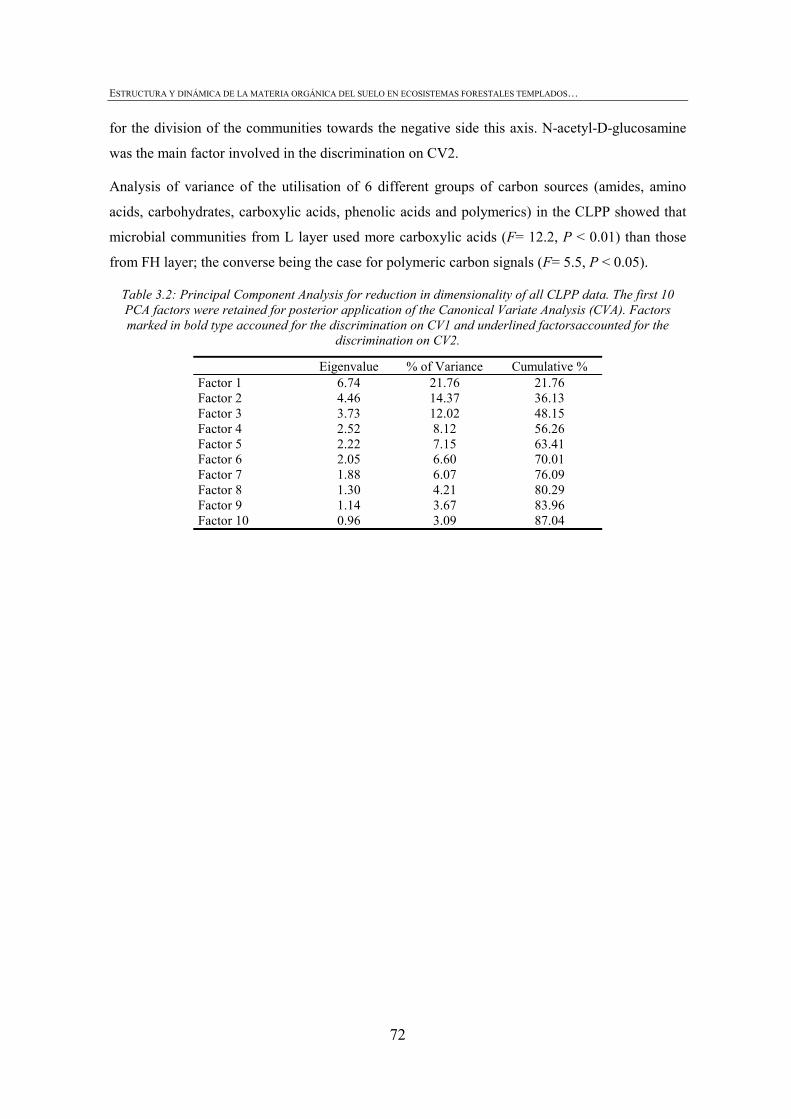
ESTRUCTURA Y DINÁMICA DE LA MATERIA ORGÁNICA DEL SUELO EN ECOSISTEMAS FORESTALES TEMPLADOS…
72
for the division of the communities towards the negative side this axis. N-acetyl-D-glucosamine
was the main factor involved in the discrimination on CV2.
Analysis of variance of the utilisation of 6 different groups of carbon sources (amides, amino
acids, carbohydrates, carboxylic acids, phenolic acids and polymerics) in the CLPP showed that
microbial communities from L layer used more carboxylic acids (F= 12.2, P < 0.01) than those
from FH layer; the converse being the case for polymeric carbon signals (F= 5.5, P < 0.05).
Table 3.2: Principal Component Analysis for reduction in dimensionality of all CLPP data. The first 10 PCA factors were retained for posterior application of the Canonical Variate Analysis (CVA). Factors marked in bold type accouned for the discrimination on CV1 and underlined factorsaccounted for the
discrimination on CV2.
Eigenvalue % of Variance Cumulative % Factor 1 6.74 21.76 21.76 Factor 2 4.46 14.37 36.13 Factor 3 3.73 12.02 48.15 Factor 4 2.52 8.12 56.26 Factor 5 2.22 7.15 63.41 Factor 6 2.05 6.60 70.01 Factor 7 1.88 6.07 76.09 Factor 8 1.30 4.21 80.29 Factor 9 1.14 3.67 83.96 Factor 10 0.96 3.09 87.04
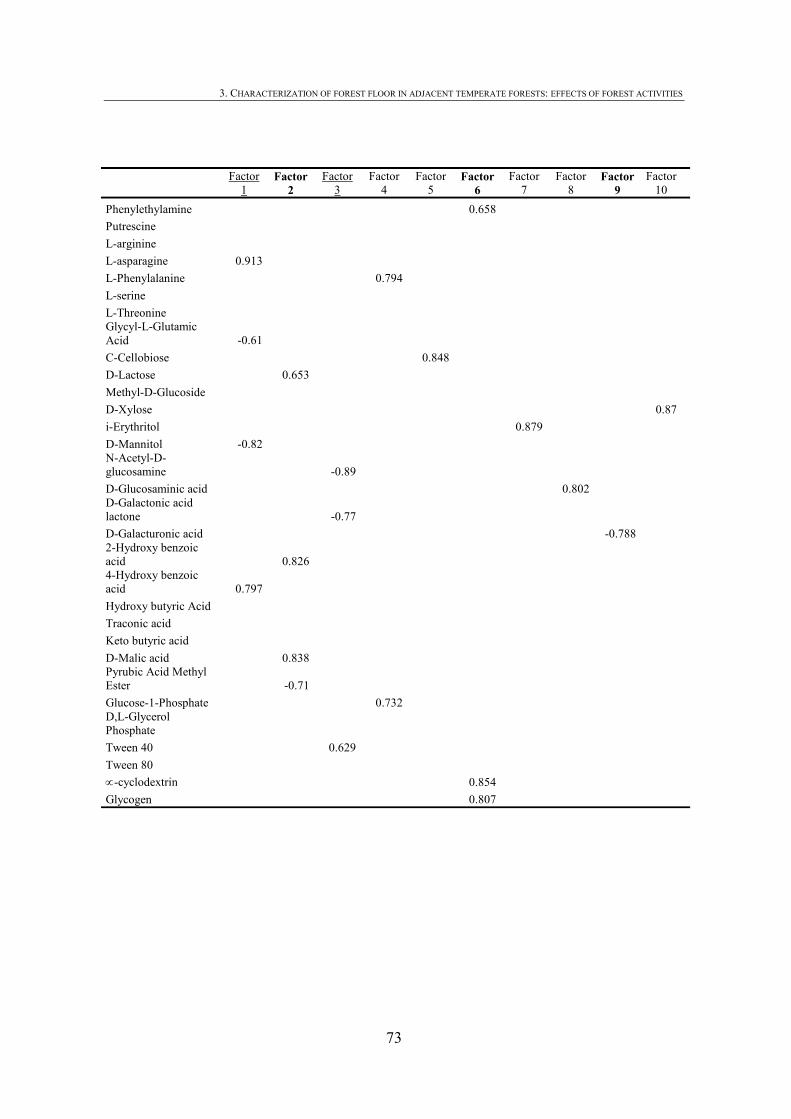
3. CHARACTERIZATION OF FOREST FLOOR IN ADJACENT TEMPERATE FORESTS: EFFECTS OF FOREST ACTIVITIES
73
Factor
1 Factor
2 Factor
3 Factor
4 Factor
5 Factor
6 Factor
7 Factor
8 Factor
9 Factor
10
Phenylethylamine 0.658 Putrescine L-arginine L-asparagine 0.913 L-Phenylalanine 0.794 L-serine L-Threonine Glycyl-L-Glutamic Acid -0.61 C-Cellobiose 0.848 D-Lactose 0.653 Methyl-D-Glucoside D-Xylose 0.87 i-Erythritol 0.879 D-Mannitol -0.82 N-Acetyl-D-glucosamine -0.89 D-Glucosaminic acid 0.802 D-Galactonic acid lactone -0.77 D-Galacturonic acid -0.788 2-Hydroxy benzoic acid 0.826 4-Hydroxy benzoic acid 0.797 Hydroxy butyric Acid Traconic acid Keto butyric acid D-Malic acid 0.838 Pyrubic Acid Methyl Ester -0.71 Glucose-1-Phosphate 0.732 D,L-Glycerol Phosphate Tween 40 0.629 Tween 80 ∝-cyclodextrin 0.854 Glycogen 0.807
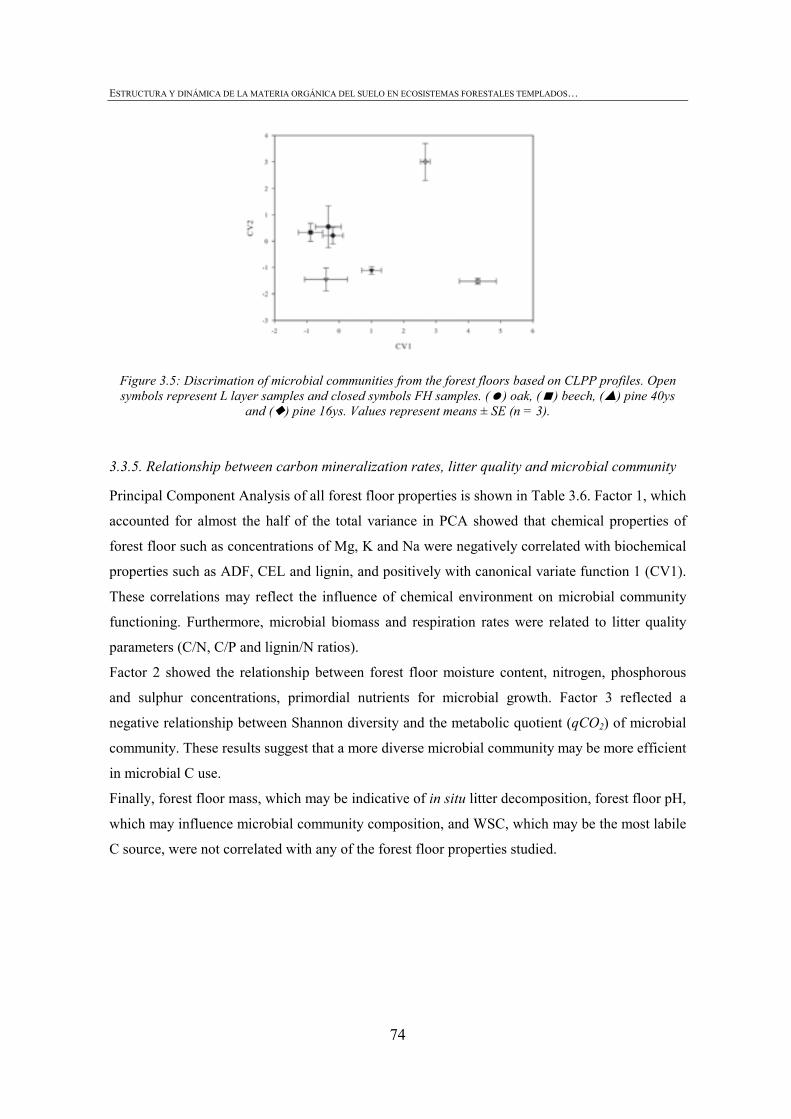
ESTRUCTURA Y DINÁMICA DE LA MATERIA ORGÁNICA DEL SUELO EN ECOSISTEMAS FORESTALES TEMPLADOS…
74
Figure 3.5: Discrimation of microbial communities from the forest floors based on CLPP profiles. Open symbols represent L layer samples and closed symbols FH samples. ( ) oak, ( ) beech, ( ) pine 40ys
and ( ) pine 16ys. Values represent means ± SE (n = 3).
3.3.5. Relationship between carbon mineralization rates, litter quality and microbial community
Principal Component Analysis of all forest floor properties is shown in Table 3.6. Factor 1, which
accounted for almost the half of the total variance in PCA showed that chemical properties of
forest floor such as concentrations of Mg, K and Na were negatively correlated with biochemical
properties such as ADF, CEL and lignin, and positively with canonical variate function 1 (CV1).
These correlations may reflect the influence of chemical environment on microbial community
functioning. Furthermore, microbial biomass and respiration rates were related to litter quality
parameters (C/N, C/P and lignin/N ratios).
Factor 2 showed the relationship between forest floor moisture content, nitrogen, phosphorous
and sulphur concentrations, primordial nutrients for microbial growth. Factor 3 reflected a
negative relationship between Shannon diversity and the metabolic quotient (qCO2) of microbial
community. These results suggest that a more diverse microbial community may be more efficient
in microbial C use.
Finally, forest floor mass, which may be indicative of in situ litter decomposition, forest floor pH,
which may influence microbial community composition, and WSC, which may be the most labile
C source, were not correlated with any of the forest floor properties studied.
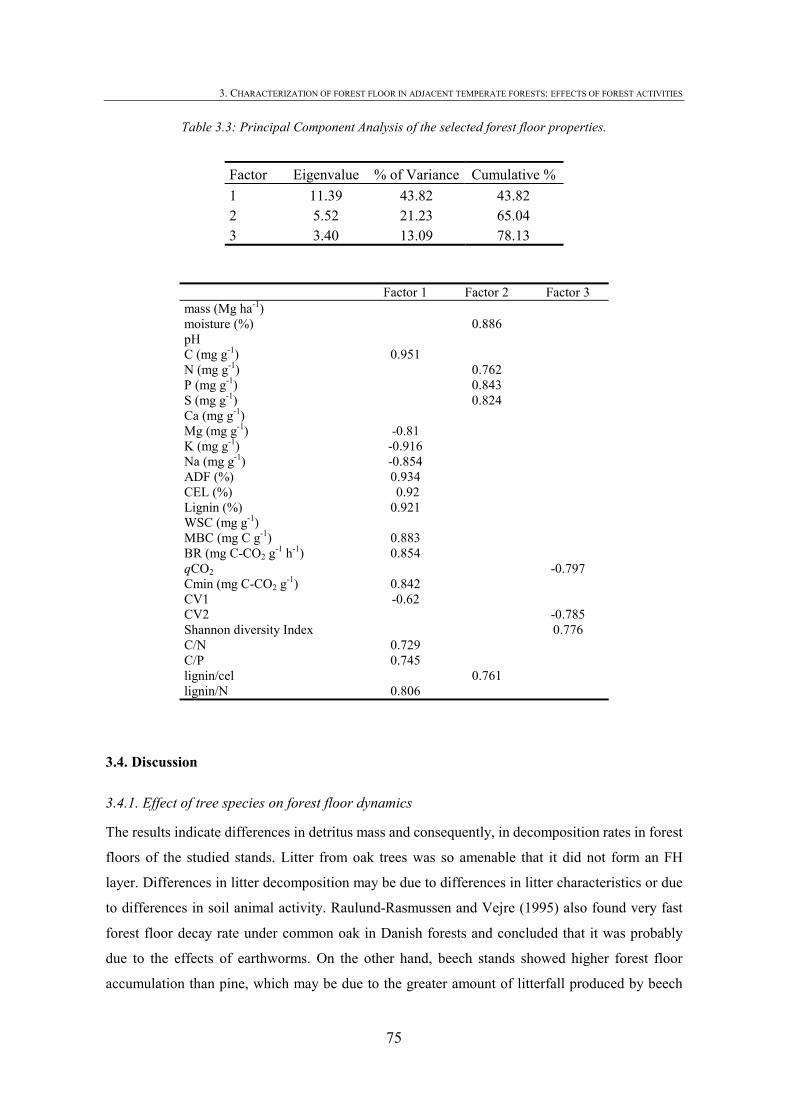
3. CHARACTERIZATION OF FOREST FLOOR IN ADJACENT TEMPERATE FORESTS: EFFECTS OF FOREST ACTIVITIES
75
Table 3.3: Principal Component Analysis of the selected forest floor properties.
Factor Eigenvalue % of Variance Cumulative % 1 11.39 43.82 43.82 2 5.52 21.23 65.04 3 3.40 13.09 78.13
Factor 1 Factor 2 Factor 3 mass (Mg ha-1) moisture (%) 0.886 pH C (mg g-1) 0.951 N (mg g-1) 0.762 P (mg g-1) 0.843 S (mg g-1) 0.824 Ca (mg g-1) Mg (mg g-1) -0.81 K (mg g-1) -0.916 Na (mg g-1) -0.854 ADF (%) 0.934 CEL (%) 0.92 Lignin (%) 0.921 WSC (mg g-1) MBC (mg C g-1) 0.883 BR (mg C-CO2 g-1 h-1) 0.854 qCO2 -0.797 Cmin (mg C-CO2 g-1) 0.842 CV1 -0.62 CV2 -0.785 Shannon diversity Index 0.776 C/N 0.729 C/P 0.745 lignin/cel 0.761 lignin/N 0.806
3.4. Discussion
3.4.1. Effect of tree species on forest floor dynamics
The results indicate differences in detritus mass and consequently, in decomposition rates in forest
floors of the studied stands. Litter from oak trees was so amenable that it did not form an FH
layer. Differences in litter decomposition may be due to differences in litter characteristics or due
to differences in soil animal activity. Raulund-Rasmussen and Vejre (1995) also found very fast
forest floor decay rate under common oak in Danish forests and concluded that it was probably
due to the effects of earthworms. On the other hand, beech stands showed higher forest floor
accumulation than pine, which may be due to the greater amount of litterfall produced by beech
ESTRUCTURA Y DINÁMICA DE LA MATERIA ORGÁNICA DEL SUELO EN ECOSISTEMAS FORESTALES TEMPLADOS…
76
(Kavvadias et al., 2001 and Romanya and Vallejo, 2004). This is consistent with the findings of
Kavvadias et al. (2001), i.e. higher forest floor accumulation in Fagus sylvatica than in Pinus
pinaster and Pinus nigra, but faster litter decomposition rates in beech than in pine forests. The
decomposition rate of forest floor beneath pine was lowest showing that 70% of the forest floor
was located in FH layer.
Forest floor L layer under deciduous trees had a different chemical composition from that of pine
forest floor. Forest floor pH, Ca and Mg under two deciduous trees (oak and beech) were higher
than under coniferous trees. In organic matter with high concentrations of nutrients, bacterial
activity dominates and nutrients are rapidly released (Melillo et al., 1982). However, comparison
of microbial biomass of L layers did not reveal any differences between broadleaved and
coniferous tree species. On the other hand, tree species can influence microbial decomposition
primarily via differences in litter lignin (Hobbie et al., 2006). Litter with higher lignin/N and C/N
ratios decomposes more slowly than litter with lower lignin/N and C/N ratios (e.g. Melillo et al.,
1982; Prescott, 1995; Hobbie et al., 2006). Deciduous trees showed significantly lower C/N and
lignin/N ratios than pine trees. However, there were significant differences between the two
deciduous trees in terms of forest floor decomposition rates, which may be explained by
differences in the potential utilisation of carbon sources by microbial communities (CLPP).
Microbial communities beneath beech species were clearly discriminated by CLPP. Forest floor
beneath beech trees showed higher moisture content than forest floor beneath oak trees. As all
samples were collected at the same time, these differences could be attributed to higher water
storage capacity of the beech forest floor than oak forest floor due, for instance, to higher
accumulation of organic matter. The difference in moisture content may influence the
bacterial:fungal ratio of the microbial community. Grayston and Prescott (2005) also concluded
that the high bacterial:fungal ratio in cedar forest floors in British Columbia may be related to
their higher moisture content. Gram-negative bacteria, including pseudomonas, are particularly
sensitive to water stress, and Gram-positive bacteria, particularly actinobacteria, are highly
tolerant to water stress (Killham, 1994). Therefore, the composition of the microbial community
may differ in forest floors beneath oak and beech trees, which may explain the differences in
organic matter dynamics in the forest floor.
3.4.2. Effect of management in pine forests
The evidence for forest floor loss following logging operations was convincing and consistent with
the results of Johnson et al. (1995) who found a significant decline in forest floor mass from 3 to 8
years after whole-tree harvesting. However, some studies in which the same stands were compared
3. CHARACTERIZATION OF FOREST FLOOR IN ADJACENT TEMPERATE FORESTS: EFFECTS OF FOREST ACTIVITIES
77
before and after logging showed that forest floor mass increases when the aboveground organic
residues are left in the stand (Mattson and Swank, 1989). The results of the present study reflect the
total removal of the forest floor mass from the pine 3ys stand with the front blade of a bulldozer, and
that this was still absent even 3 years after the establishment of the new pine plantation. Moreover,
forest floor mass was still 50% lower compared with a mature stand 16 years after disturbance.
Covington’s curve (1981) predicted a loss of 50% of forest floor organic matter in the first 20 years
after the disturbance due to a reduction in litter input and acceleration in decomposition rates after
clear-cutting. In the corresponding study, a series of stands of different ages were used to describe
the pattern of forest floor mass and organic matter content during succession following logging in
northern hardwood stands in New Hampshire (Covington, 1981).
Clear-cutting and subsequent site preparation operations may also alter the quality of organic
matter by increasing decomposition rates. Ussiri and Johnson (2007) found relatively small
changes in the structure and composition of organic matter by C13 NMR after clear-cutting,
however they concluded that more labile fractions and more dynamic pools of organic matter may
be more sensitive indicators of the effects of disturbance. Water-soluble carbohydrates (WSC) and
cumulative respiration increased significantly relative to the adjacent mature pine forest in the
studied stand 16 years after clear cutting in the FH layer. However, we could not find any
relationship between WSC and the forest floor properties studied. This may reflect higher
decomposition rates even 16 years after disturbance (Covington, 1981).
Forest floor microbial community was also affected by clear-cutting and subsequent site
preparation. The Shannon diversity index was significantly lower than that observed in mature
pine and CLPP was also different in pine 16ys. Hannam et al. (2006) found that the forest floor
microbial community responded immediately after harvesting but returned to pre-harvest levels in
4.5 and 5.5 years post-harvest for PLFA. In contrast, we suggest that the microbial community in
the cultivated pine forest under study is not resilient following clear-cutting and subsequent site
preparation during the first 16 years after disturbance.
3.5. Conclusions
Organic matter dynamics in the forest floor was different beneath different tree species. In the
stands under study, oak, beech and pine forests showed different patterns of accumulation of
organic matter. Although no differences were detected in microbial biomass, there were
differences in litter quality and microbial diversity.
Mechanization of forest management in the Pinus radiata plantations under study induces
complex changes in the forest floor. Results from this study indicate a significant loss of organic
ESTRUCTURA Y DINÁMICA DE LA MATERIA ORGÁNICA DEL SUELO EN ECOSISTEMAS FORESTALES TEMPLADOS…
78
matter following clear-cutting and mechanical site preparation, and that these changes may persist
for at least 16 years after disturbance. In addition, accelerated decomposition rates were observed
and substantially lower microbial diversity in the pine 16ys stand. Nevertheless, further studies
are required to elucidate the effects of change in tree species and clear-cutting and site preparation
on carbon dynamics and long-term site productivity at the landscape level.
Acknowledgements
Funding for this study was provided by European Union ERDF-INTERREG IIIB Atlantic Area
and the Department of Agriculture, Fisheries and Food of the Basque Country. We are grateful to
Dr. Fernando Blanco for help with the proximate analyses and Dr. Juan Mari Alberdi for technical
assistance with NMR analysis. We also thank the University of the Basque Country for supporting
us with computer facilities and software packages, and Dr. Christine Francis for revising the
English of the manuscript.
3.6. References
Almendros, G., Dorado, J., González-Vila, F.J., Blanco, M.J. and Lankes, U. 2000. 13C NMR
assessment of decomposition patterns during composting of forest shrub biomass. Soil
Biology and Biochemistry 32:793-804.
Blakemore, L. C., Searle, P. L. and Daly, B. K., 1977. Methods for chemical analysis of soils.
New Zealand Soil Bureau scientific report 10A.
Borman, F. H. and Likens, G. E. 1979. Pattern and process in a forested ecosystem. New York.
Springer-Verlag. 253 p.
Campbell, C.D., Grayston, S.J. and Hirst, D.J. 1997. Use of rhizosphere carbon sources in sole
carbon source tests to discriminate soil microbial communities. Journal of Microbiological
Methods 30: 33–41.
Covington, W.W., 1981. Changes in forest floor organic matter and nutrient content following
clear-cutting in northern hardwood. Ecology 65: 41–48.
Degens, B. P., Schipper, L. A., Sparling, G.P. and Duncan, L.C. 2001. Is the microbial
community in a soil with reduced catabolic diversity less resistant to stress or disturbance?
Soil Biology and Biochemistry 33: 1143-1153
Deriaz, R.E.,1961. The routine analysis of carbohydrates and lignin in herbage. Journal of the
Science of Food and Agriculture 12: 152-160.
3. CHARACTERIZATION OF FOREST FLOOR IN ADJACENT TEMPERATE FORESTS: EFFECTS OF FOREST ACTIVITIES
79
Finzi, A.C., Van Breemen, N. and Canham, C.D., 1998. Canopy soil-tree interactions within
temperate forests: species effect on soil carbon and nitrogen. Ecological Applications 8:
440-446.
Garland, J.L. and Mills, A.L. 1991. Classification and characterization of heterotrophic microbial
communities on the basis of patterns of community-level sole-carbon-source utilization.
Applied and Environmental Microbiology 57: 2351-2359
Goh, K.M and Heng, S. 1987. The quantity and nature of the forest floor and topsoil under some
indigenous forests and nearby areas converted to Pinus radiata plantations in South Island,
New Zealand. New Zealand Journal of Botany 25: 243-254.
Goodfriend, W.L. 1998. Microbial community patterns of potential substrate utilization: a
comparison of salt marsh, sand dune, and seawater-irrigated agronomic systems. Soil
Biology and Biochemistry 30: 8-9.
Grayston, S.J. and Prescott, C. E. 2005. Microbial communities in forest floors under four tree
species in coastal British Columbia. Soil Biology and Biochemistry 37: 1157-1167.
Hannam, K. D., Quideau, S. A., Oh, S.-W., Kishchuk, B. E. and Wasylishen, R. E. 2004. Forest
floor composition in aspen- and spruce-dominated stands of the boreal mixedwood forest.
Soil Science Society of America Journal 68:1735–1743.
Hannam, K. D., Quideau, S. A. and Kishchuk, B. E., 2006. Forest floor microbial communities in
relation to stand composition and timber harvesting in northern Alberta. Soil Biology and
Biochemistry 38: 2565-2575.
Hättenschwiler, S., Tuinov, A.V. and Scheu, S., 2005. Biodiversity and litter decomposition in
terrestrial ecosystems. Annual Review of Ecology, Evolution and Systematics 36: 191-218.
Hobbie S.E., Reich P.B., Oleksyn J., Ogdahl M., Zytkowiak R., Hale C. and Karolewski P, 2006.
Tree species effects on decomposition and forest floor dynamics in a common garden.
Ecology 87: 2288-2297.
Johnson, C.E., Driscoll, C.T., Fahey, T.J., Siccama, T.G. and Hughes, J.W., 1995. Carbon
dynamics following clear cutting of a northern hardwood forest. In: J.M. Kelly and W.W.
McFee, Editors, Carbon Forms and Functions in Forest Soils, SSSA, Madison, WI. pp.
463–488.
Kavvadias, V.A., Alifragis, D., Tsiontsis, A., Brofas, G. and Stamatelos, G., 2001. Litterfall, litter
accumulation and litter decomposition rates in four forest ecosystems in northern Greece.
Forest Ecology and Management 144: 113-127.
Killham, K. 1994. Soil Ecology, Cambridge University Press, U.K.
ESTRUCTURA Y DINÁMICA DE LA MATERIA ORGÁNICA DEL SUELO EN ECOSISTEMAS FORESTALES TEMPLADOS…
80
Leckie, S. E., Prescott, C.E. and Grayston, S.J. 2004. Forest floor microbial community response
to tree species and fertilization of regenerating coniferous forests. Canadian Journal of
Forest Research 34: 1426-1435.
Lee, D.S., 1993. Spatial variability of urban precipitation chemistry and deposition—statistical
associations between constituents and potential removal processes of precursor species.
Atmospheric Environment 27: 321–337.
Lorenz, K., Preston, C.M., Raspe, S., Morrison, I.K., Feger, K.H., 2000. Litter decomposition and
humus characteristics in Canadian and German spruce ecosystems: information from tannin
analysis and 13C CPMASS NMR. Soil Biology and Biochemistry 32, 779-792
Macdonald, S.E., Schmidt, M.G. and Rothwell, R.L., 1998. Impacts of mechanical site
preparation on foliar nutrients of planted white spruce seedlings on mixed-wood boreal
forest sites in Alberta. Forest Ecology and Management 110: 35-48.
Mattson, K.G. and Swank, W.T., 1989. Soil and detrital carbon dynamics following forest cutting
in the Southern Appalachians. Biology and Fertility of Soils 7: 247-253.
Melillo, J. M., Aber, J. D. and Muratore, J. F., 1982. Nitrogen and lignin control of hardwood leaf
litter decomposition dynamics. Ecology 63: 621- 626.
Merino, A., Fernández-López, A., Solla-Gullón, F., Edeso, J.M., 2004. Soil changes and tree
growth in intensively managed Pinus radiata in northern Spain. Forest Ecology and
Management 196, 393-404
Michel, M., 2003. El pino radiata (Pinus Radiata D.Don) en la historia forestal de la Comunidad
Autónoma del País Vasco : análisis de un proceso de forestalismo intensivo. PhD.
Universidad Politécnica de Madrid
Olarieta, J.R., Rodrıguez, R., Besga, G., Rodrıguez, M., Virgel, S., 1997. Evolución de la cubierta
del suelo con diferentes sistemas de preparación del terreno tras la matarrasa de
plantaciones de pino radiata. In: Puertas, F., Rivas, M. Eds. , I Congreso Forestal Hispano-
Luso II Gobierno de Navarra, Pamplona, pp. 449 – 454.
Pastor, J. and Post, W.M. 1988. Response of northern forests to CO2-induced climate change.
Nature, 334(6177): 55-58.
Paul, E.A. and Clark, F.E. 1996. Soil Microbiology and Biochemistry, Second Edition. Academic
Press, San Diego, pp. 340.
Prescott, C.E., 1995. Does nitrogen availability control rates of litter decomposition in forests?
Plant and Soil 168-169: 83–88.
Preston, C.M. and Trofymow, J.A.. Canadian intersite decomposition experiment working group,
3. CHARACTERIZATION OF FOREST FLOOR IN ADJACENT TEMPERATE FORESTS: EFFECTS OF FOREST ACTIVITIES
81
2000. Variability in litter quality and its relationship to litter decay in Canadian forests.
Canadian Journal of Botany 78, 1269-1287.
Quideau, S.A., Graham, R.C., Oh, S.-W, Hendrix, P.F. and Wasylishen, R.E., 2005. Leaf litter
decomposition in a chaparral ecosystem, Southern California. Soil Biology and
Biochemistry 37: 1988-1998.
Raulund-Rasmussen, K. and Vejre, H., 1995. Effect of tree species and soil properties on nutrient
immobilization in the forest floor. Plant and Soil 169: 345-352.
Romanya, J. and Vallejo, R. 2004. Productivity of Pinus radiata plantations in Spain in response
to climate and soil. Forest Ecology and Management 195: 177-189.
Six, J., Callewaert, P., Lenders, S., De Gruze, S., Morris, S.J., Gregorich, E.G., Paul, E.A. and
Paustian, K., 2002. Measuring and understanding carbon storage in afforested soils by
physical fractionation. Soil Science Society of America Journal 66: 1981-1987.
Soil Survey Staff (SSS), 2006. Keys to Soil Taxonomy, 10th ed. USDA-Natural Resources
Conservation Service, Washington, DC.
Stevenson, B.A., G.P. Sparling, L.A. Schipper, B.P. Degens and L.C. Duncan, 2004. Pasture and
forest soil microbial communities show distinct patterns their catabolic respiration
responses at a landscape scale. Soil Biology and Biochemistry 36: 49-55.
Ussiri, D.A.N. and Johnson, C.E., 2007. Organic matter composition and dynamics in a northern
hardwood forest ecosystem 15 years after clear-cutting. Forest Ecology and Management
240: 131-142.
Vance, E. D., Brookes, P. C. and Jenkinson, D. S., 1987. An extraction method for measuring soil
microbial biomass C. Soil Biology and Biochemistry 19: 703-704.
Van Soest, P.J., Robertson, J. B. and Lewis, B.A., 1991. Symposium: Carbohydrate,
methodology, metabolism and nutritional implications in dairy cattle, Methods for dietary
fiber, neutral detergent fiber and nonstarch polysaccharydes in relation to animal nutrition.
Journal of Dairy Science 74: 3583-3597.
Yanai, R.D., Arthur, M.A. Siccamac T.G., Federer C.A., 2000. Challenges of measuring forest
floor organic matter dynamics: Repeated measures from a chronosequence. Forest Ecology
and Management 138: 273-283.

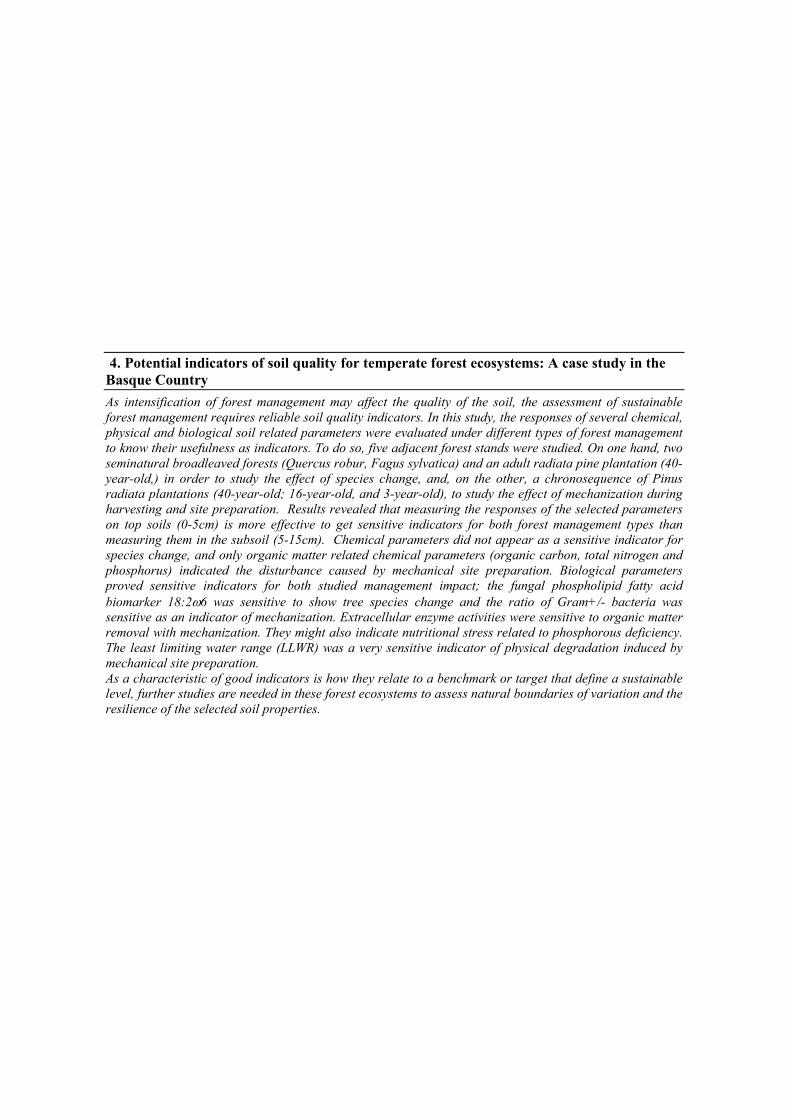
4. Potential indicators of soil quality for temperate forest ecosystems: A case study in the Basque Country As intensification of forest management may affect the quality of the soil, the assessment of sustainable forest management requires reliable soil quality indicators. In this study, the responses of several chemical, physical and biological soil related parameters were evaluated under different types of forest management to know their usefulness as indicators. To do so, five adjacent forest stands were studied. On one hand, two seminatural broadleaved forests (Quercus robur, Fagus sylvatica) and an adult radiata pine plantation (40-year-old,) in order to study the effect of species change, and, on the other, a chronosequence of Pinus radiata plantations (40-year-old; 16-year-old, and 3-year-old), to study the effect of mechanization during harvesting and site preparation. Results revealed that measuring the responses of the selected parameters on top soils (0-5cm) is more effective to get sensitive indicators for both forest management types than measuring them in the subsoil (5-15cm). Chemical parameters did not appear as a sensitive indicator for species change, and only organic matter related chemical parameters (organic carbon, total nitrogen and phosphorus) indicated the disturbance caused by mechanical site preparation. Biological parameters proved sensitive indicators for both studied management impact; the fungal phospholipid fatty acid biomarker 18:2ω6 was sensitive to show tree species change and the ratio of Gram+/- bacteria was sensitive as an indicator of mechanization. Extracellular enzyme activities were sensitive to organic matter removal with mechanization. They might also indicate nutritional stress related to phosphorous deficiency. The least limiting water range (LLWR) was a very sensitive indicator of physical degradation induced by mechanical site preparation. As a characteristic of good indicators is how they relate to a benchmark or target that define a sustainable level, further studies are needed in these forest ecosystems to assess natural boundaries of variation and the resilience of the selected soil properties.

85
4.1. Introduction
Most European countries agreed to the Pan-European principles for sustainable forest
management (Helsinki Process, 1993) because conversion of native forests and afforestation of
agricultural or abandoned land to provide cultivated forests of rapidly growing exotic species was
a widespread phenomenon. Furthermore, the increasing concurrence in global markets and the
intensification of logging operations (timber harvesting and site preparation) were placing greater
pressure on forest ecosystems. In northern Spain, cultivated radiata pine (Pinus radiata D. Don)
forests cover an area of more than 150,000 ha, and seminatural forests of European beech and
pedunculate oak have been maintained in small patches (20,000 ha). The current types of forest
management in these cultivated plantations involves clearcutting with rotations of between 30 and
40 years, harvesting with chainsaws, skidding, and mechanical site preparation, prior to planting,
by processes such as scarification and ripping.
Forests play a key role in global sustainability not only as providers of raw materials, but also as
providers of ecosystem functions related to biodiversity, carbon sequestration and protection of
soil and water. Maintenance of these functions in perpetuity should be the goal of sustainable
forest management (Doran, 2002). Assessment of the sustainability of forest management requires
indicators, and as forestry has a large impact on soil systems, there is a need to develop soil-based
sustainability indicators; this need has increasingly been identified since forest policies have
shifted to more balanced ecological approaches. The main challenge in selecting soil quality
indicators is determining which measures appropriately characterize the system and yet are simple
enough to be effectively and efficiently monitored (Dale et al., 2007).
Several authors have proposed minimum datasets of soil parameters to be used as soil quality
indicators (Doran and Parking 1994, Tscherko and Kandeler 1999, Shukla et al., 2006). These
datasets need to define ecosystem processes that integrate physical, chemical and biological
properties. Soil organic matter (SOM) has frequently been suggested as a key attribute of soil
quality and sustainability because it is linked to nutrient availability, water holding capacity, C
cycling, gas exchange and biological processes (Nambiar, 1996). However, results of prior studies
in cultivated forests were inconclusive in terms of the response of total SOM as an indicator of
sustainable forest management (Bauhus et al., 2002). Therefore, different pools of SOM with
different functional roles in soil must be evaluated. Particulate organic matter (POM) may
respond more rapidly to management than SOM (Cambardella and Elliot, 1992; Fortuna et al.,
2003) and soil microbial community, a small but very active part of the SOM (Christensen, 1992)
has been suggested as a sensitive indicator of change in grassland and boreal ecosystems (Mariani
et al., 2006; Tscherko et al. 2007).
ESTRUCTURA Y DINÁMICA DE LA MATERIA ORGÁNICA DEL SUELO EN ECOSISTEMAS FORESTALES TEMPLADOS…
86
Microbial community composition and function may be altered by changes in the quantity and
biochemical composition of plant litter (Hassett and Zak, 2005) and the effect of logging
operations on soil microenvironments. Phospholipid fatty acid (PLFA) has been used to study the
variability in forest soil communities (Leckie et al., 2004). Certain fatty acids are used as
biomarkers for particular groups of organisms (Frostegard and Bååth, 1996) and total PLFA
content as a measure of microbial biomass (Zelles et al., 1999). Microbial extracellular enzymes
degrade e.g. the cellulose, hemi- cellulose and lignin of plant litter (Waldrop et al., 2003), and
reflect the functioning of soil microbial communities and ecosystem processes.
Bulk density, soil strength, aggregate stability or available water content (AWC) have often been
used as indicators of soil physical quality, because compaction caused by logging disrupts the
physical integrity of soil by modifying the porosity and impeding movement of gas, water,
nutrients and roots in the profile (Greacen and Sands, 1980). The least limiting water range
(LLWR) has recently been suggested as a better indicator of soil physical disturbance as it
incorporates the limiting values for the growth of the vegetation such as soil mechanical
impedance, oxygen and water supply to plant roots into one parameter on the basis of water
content. The lower limit is defined by the water content at which soil resistance to penetration
becomes limiting which is considered 3 MPa for radiata pine (Zou et al., 2000) (wilting point or
the threshold soil strength value), and the upper limit is defined by the water content at which
aeration becomes limiting (field capacity or 10% air-filled porsity) (Zou et al., 2000). Intrinsic
accountability of these important water limit criteria makes the LLWR a potentially useful soil
quality indicator of mechanized forest system impact on soil physical conditions and vegetation
growth (da Silva and Kay, 1996; da Silva and Kay, 1997b; Betz et al., 1998 and McKenzie and
McBratney, 2001), however, rather few studies have been conducted in forest ecosystems.
Chemical parameters commonly used to evaluate soil quality, such as total nutrient content,
change slowly over time, thus limiting their usefulness for detecting early changes induced by
forest management (Bending et al., 2004). Although routine soil chemical analyses are not usually
directly related to the capacity of the soil to supply nutrients in the long term, they are still the
most common type of soil analysis applied both in agriculture and forestry and are widely use in
management impact assessment.
The main characteristic of a good indicator of forest sustainability is its ability to be compared
with a benchmark and/or target that defines a sustainable level. Natural forests have been
identified as representing this sustainable level in terms of forest management. However, tree
species affect soil processes such as nutrient cycling (Binkley, 1995), base content and humus
4. POTENTIAL INDICATORS OF SOIL QUALITY FOR TEMPERATE FOREST ECOSYSTEMS: A CASE STUDY IN THE BASQUE COUNTRY
87
formation (Raulund-Rasmussen and Vejre, 1995). These effects are mainly attributed to the effect
that species differences in litter quality and root exudates (Hobbie, 1992) have on soil
microorganisms (Leckie et al., 2004). It is therefore important to understand the differences in soil
properties with respect to native and exotic species in order to establish coherent sustainable forest
benchmarks.
In this context, the objectives of this study were i) to understand the behaviour of a set of
parameters that have been proposed as soil quality indicators in adjacent stands that differ mainly
in land-use history and management but not in soil parent material, geomorphology or climate and
ii) to obtain an insight into the potential use of these parameters as indicators of soil quality, for
future planning of soil monitoring programmes in temperate forest ecosystems.
4.2. Materials and Methods
4.2.1. Site description
The study site (5 ha) (30T 534075 4783284) was selected as an example of the Atlantic forest
landscape in the Basque Country. The Atlantic climate is mesothermic with cool, moist summers
and mild, wet winters. The mean air temperature is 18.7 ºC in summer and 9.6 ºC in winter. The
mean annual precipitation ranges between 1200 and 2000 mm and heaviest rainfall occurs
between September and May (Ortubai, 1995). The area is situated 600 m above sea level. The
parent material is sandstone and soil mineralogy and textural classes were homogeneous within
the study site (Table 4.1). The soil was classified as a Typic Udorthent (SSS, 2006). The land
mainly comprises steep hills to moderately steep rolling hills. Five different and adjacent forest
stands were selected, three of them differing in tree species (native or exotic) and a
chronosequence of exotic species plantations differing in time since site preparation: (1)
Seminatural oak forest dominated by Quercus robur L. with Erica vagans L., Ulex europaeus
Schott, Rubus ulmifolius L. and Ilex aquifolium L. in the understory and not managed in the last
few decades, and (2) Seminatural beech forest characterised by Fagus sylvatica L. pollarded until
the mid 1940s for firewood and charcoal and not managed in the last few decades. In addition,
three Pinus radiata plantations that differ in age and silvicultural history were chosen, namely (3)
Pine (40-year-old), a mature even-aged plantation established around 40 years ago without
mechanical site preparation, and in which there is a sparse understory with ferns, and (4) Pine (16-
year-old) and (5) Pine (3-year-old old), which are even-aged second-rotation plantations,
established after logging. Logging involves three operations: timber harvesting, preparation of soil
and ripping of log landing. Harvesting in both cases involved chainsaw felling and mechanical
snigging of logs with a skidder, to a landing. Soil preparation involved the removal of logging
ESTRUCTURA Y DINÁMICA DE LA MATERIA ORGÁNICA DEL SUELO EN ECOSISTEMAS FORESTALES TEMPLADOS…
88
slash and surface organic material from the stand and scarification of surface soils with a front-
mounted straight-blade; log landing was performed with a ripper tooth that digs into the soil and a
plough that displaces the soil laterally and partially turns it over, creating a trench.
4.2.2. Soil sampling
Each stand covered an area of approximately 1 ha, and three study plots (10 m x10 m) were
placed in each stand. Within each plot, ten soil samples were systematically collected by the core
method (core diameter 15 cm) in January of 2005, and the samples were divided into 0-5 cm and
5-15 cm mineral soil layers. Soil samples were combined to provide one composite sample per
plot and layer and were then split into a field-moist portion and a portion for drying. The field-
moist portion was sieved to < 2 mm to remove large woody debris and stones, separated into two
replicate samples and frozen at -20ºC. The other portion was dried at 30ºC and also sieved to 2 <
mm and separated into two replicate samples. Subsamples were dried at 105 ºC for 24 h for
estimation of the moisture content.
4.2.3. Chemical properties
Total organic C and N were measured in a LECO CNS 2000 autoanalyser (LECO Corporation,
MI, USA). Soil pH-H2O was determined in 1:2.5 soil:water suspension. Cation exchange capacity
(CEC) was determined with ammonium acetate (1M, pH 7). Extractable aluminium was measured
by titration with sodium hydroxide and phenolphthalein. Available phosphorus was analysed by
the Olsen method (Olsen et al., 1954).
Particulate organic matter (POM) was determined by the method of Cambardella and Elliot
(1992), as modified by Marriott and Wander (2006). Briefly, 10 grams of soil were dispersed with
hexa-metaphosphate in an end-over-end shaker at 150 rpm for 16 hours, and the sample was then
passed through a 53 μm sieved and rinsed with distilled water until a clear solution was obtained.
The mixture of sand and POM was oven dried at 50ºC for 48 hours and the C content was
determined with a LECO CNS 2000 analyser.
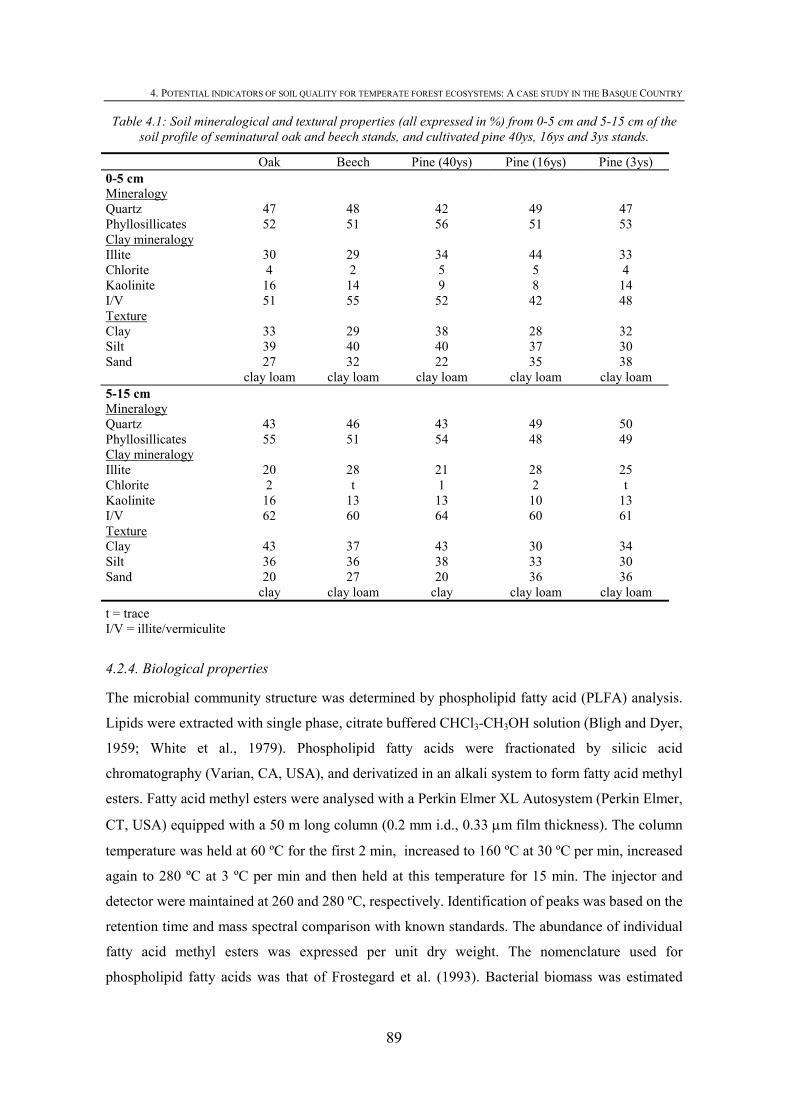
4. POTENTIAL INDICATORS OF SOIL QUALITY FOR TEMPERATE FOREST ECOSYSTEMS: A CASE STUDY IN THE BASQUE COUNTRY
89
Table 4.1: Soil mineralogical and textural properties (all expressed in %) from 0-5 cm and 5-15 cm of the soil profile of seminatural oak and beech stands, and cultivated pine 40ys, 16ys and 3ys stands.
Oak Beech Pine (40ys) Pine (16ys) Pine (3ys) 0-5 cm Mineralogy Quartz 47 48 42 49 47 Phyllosillicates 52 51 56 51 53 Clay mineralogy Illite 30 29 34 44 33 Chlorite 4 2 5 5 4 Kaolinite 16 14 9 8 14 I/V 51 55 52 42 48 Texture Clay 33 29 38 28 32 Silt 39 40 40 37 30 Sand 27 32 22 35 38 clay loam clay loam clay loam clay loam clay loam 5-15 cm Mineralogy Quartz 43 46 43 49 50 Phyllosillicates 55 51 54 48 49 Clay mineralogy Illite 20 28 21 28 25 Chlorite 2 t 1 2 t Kaolinite 16 13 13 10 13 I/V 62 60 64 60 61 Texture Clay 43 37 43 30 34 Silt 36 36 38 33 30 Sand 20 27 20 36 36
clay clay loam clay clay loam clay loam t = trace I/V = illite/vermiculite
4.2.4. Biological properties
The microbial community structure was determined by phospholipid fatty acid (PLFA) analysis.
Lipids were extracted with single phase, citrate buffered CHCl3-CH3OH solution (Bligh and Dyer,
1959; White et al., 1979). Phospholipid fatty acids were fractionated by silicic acid
chromatography (Varian, CA, USA), and derivatized in an alkali system to form fatty acid methyl
esters. Fatty acid methyl esters were analysed with a Perkin Elmer XL Autosystem (Perkin Elmer,
CT, USA) equipped with a 50 m long column (0.2 mm i.d., 0.33 μm film thickness). The column
temperature was held at 60 ºC for the first 2 min, increased to 160 ºC at 30 ºC per min, increased
again to 280 ºC at 3 ºC per min and then held at this temperature for 15 min. The injector and
detector were maintained at 260 and 280 ºC, respectively. Identification of peaks was based on the
retention time and mass spectral comparison with known standards. The abundance of individual
fatty acid methyl esters was expressed per unit dry weight. The nomenclature used for
phospholipid fatty acids was that of Frostegard et al. (1993). Bacterial biomass was estimated
ESTRUCTURA Y DINÁMICA DE LA MATERIA ORGÁNICA DEL SUELO EN ECOSISTEMAS FORESTALES TEMPLADOS…
90
from the summed concentration of 9 bacterial PLFA, i15:0, a15:0, 15:0, i16:0, i17:0, 17:0, cy17:0,
18:1ω7 and cy19:0 (Frostegard and Bååth, 1996) and the fatty acid 18:2ω6 was used as an
indicator of fungal biomass (Federle, 1986). The Gram-positive specific fatty acids i15:0, a15:0,
i16:0 and i17:0 and the Gram-negative specific fatty acids cy17:0, 18:1ω7 and cy19:0 were used
as biomarkers. Total phospholipid fatty acids were compared among different types of forest
management as nmol g-1soil, while PLFAs used as biomarkers were compared on a mole basis
(%) in order to standardize differences in the total amount of soil PLFAs. The diversity of PLFAs
was calculated with the Shannon index H.
The enzyme assay was performed as microbial community function by a modification of the
method of Marx et al. (2001). Briefly, the enzyme activities assayed were: β-1,4-glucosidase, α-
1,4-glucosidase, cellobiohydrolase, β-1,4-xylosidase, β-1,4-N-acetylglucosaminidase, acid
phosphatase, L-leucine aminopeptidase and L-tyrosine aminopeptidase. One gram of fresh soil
and 50 ml of sterile water were sonicated for 2 min at an output energy of 50 J s-1. The resulting
soil suspension was continuously stirred and 50 μl aliquots were dispensed in 96-well
microplates. Fifty microlitres of buffer solution were added; glycosidases and acid phosphatase
were assayed in 100 mM MES buffer (pH 6.1) and peptidases in 50 mM Trizma buffer (pH 7.8).
Finally, 100 μl of 1 mM substrate solution was added. Depending on the substrate tested, either a
4-methylumbelliferone or 7-amino-4-methyl coumarin standard was used. The microplates were
pre-incubated in the dark at 30ºC and the fluorescence intensity was then measured at time 0, 30,
60, 120 180 min in a Microplate Fluorescence Reader FLx800 (BIO-TEK instruments Inc., VE,
USA) equipped with an excitation filter of 355 nm and an emission filter of 460 nm. All enzyme
activities were expressed in nmol g-1 h-1.
4.2.5. Physical properties
The least limiting water range (LLWR) was calculated in all stands on the basis of experimental
data. Critical values for plant growth associated with water potential, soil resistance and air-filled
porosity were selected: 0.10 cm3cm-3 air-filled porosity (Grable and Siemer, 1968), field capacity
at -0.01 MPa matric potential (Haise et al., 1955), wilting point at -1.5 MPa matric potential
(Richards and Weaver, 1944), and the soil strength restriction limit at 3.0 MPa (Sands et al.,
1979). Field capacity (θfc) and wilting point (θwp) water contents were determined in all samples
by the standard tension plate procedure (Klute, 1986). The soil water content identified by the air-
filled porosity at 10% (θafp) was calculated as θsat-0.1, where θsat= 1-(bulk density/soil particle
density). Bulk density was estimated in ten soil samples extracted with stainless steel (100 cm3)
cylinders in each plot. Water content at 3 MPa (θss) was determined on soil strength regression
4. POTENTIAL INDICATORS OF SOIL QUALITY FOR TEMPERATE FOREST ECOSYSTEMS: A CASE STUDY IN THE BASQUE COUNTRY
91
models developed for each stand from a grid of 34 points. In each point, soil strength was
measured with a cone penetrometer (CP 40II, Rimik, Australia), readings were recorded every 1
cm and the average value of the first 5 readings represented the soil strength in the first 5 cm. In
addition, a soil sample was taken to determine the gravimetric water content. Sampling was
carried out twice, once when soils were near field capacity (May 2005) and the second time when
they were near wilting point (August 2005). The upper limit of the LLWR is the drier soil water
content of either θfc or θafp, whereas the lower limit is the wetter soil water content of either θwp or
θss (Zou et al., 2000).
4.2.6. Statistical analysis
One-way analysis of variance (ANOVA) was conducted to compare mean values for each soil
depth and a Student t test to compare the two depths. Factor analyses were performed to reduce
the number of variables in extracellular multienzyme activities and PLFA patterns with a
correlation matrix; factors with eigenvalues >1 were retained and factors subjected to varimax
rotation to maximize correlation between factors and measured properties. Stepwise discriminant
function analysis was used to determine the key soil properties that best predict the forest
categories and how good the prediction was. It was used to gain insights into the relationship
between group membership and the variables used to predict group membership. When using any
stepwise method, it is often desirable to determine the efficiency of the analysis via a cross-
validation procedure to develop an unbiased estimate for determining to which group a particular
observation belongs.
Once the discriminant functions were calculated, a plot of the stretched attribute vectors was
calculated by rotating the discriminant functions to redistribute the variance. Correlations between
the canonical discriminant functions and each discriminating variable were calculated and
multiplied by the univariate F ratio to produce (x, y) coordinates for the endpoint of a vector that
has its other endpoint at the origin (Hair et al., 1995). Thus, the F value indicates the extent to
which each variable makes a significant contribution to discriminating between groups.
4.3. Results
4.3.1. Chemical soil properties
Soil organic C contents in the upper soil horizon were similar in all stands except the pine (3-year-
old) (Table 4.2), concentrations of nitrogen, available phosphorus and potassium, and cation
exchange capacity (CEC) were also significantly lower in the latter stand. There was a significant
decrease with depth in all elements associated with soil organic matter, such as soil total nitrogen,
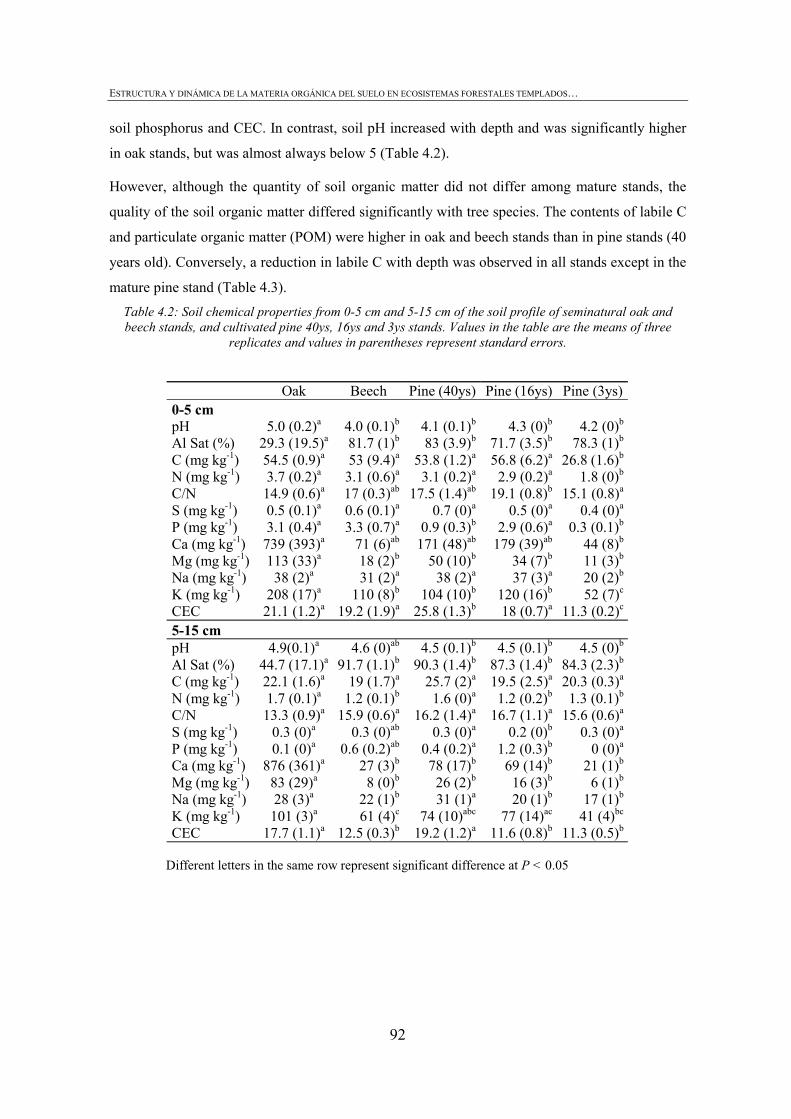
ESTRUCTURA Y DINÁMICA DE LA MATERIA ORGÁNICA DEL SUELO EN ECOSISTEMAS FORESTALES TEMPLADOS…
92
soil phosphorus and CEC. In contrast, soil pH increased with depth and was significantly higher
in oak stands, but was almost always below 5 (Table 4.2).
However, although the quantity of soil organic matter did not differ among mature stands, the
quality of the soil organic matter differed significantly with tree species. The contents of labile C
and particulate organic matter (POM) were higher in oak and beech stands than in pine stands (40
years old). Conversely, a reduction in labile C with depth was observed in all stands except in the
mature pine stand (Table 4.3). Table 4.2: Soil chemical properties from 0-5 cm and 5-15 cm of the soil profile of seminatural oak and beech stands, and cultivated pine 40ys, 16ys and 3ys stands. Values in the table are the means of three
replicates and values in parentheses represent standard errors.
Oak Beech Pine (40ys) Pine (16ys) Pine (3ys) 0-5 cm pH 5.0 (0.2)a 4.0 (0.1)b 4.1 (0.1)b 4.3 (0)b 4.2 (0)b Al Sat (%) 29.3 (19.5)a 81.7 (1)b 83 (3.9)b 71.7 (3.5)b 78.3 (1)b C (mg kg-1) 54.5 (0.9)a 53 (9.4)a 53.8 (1.2)a 56.8 (6.2)a 26.8 (1.6)b N (mg kg-1) 3.7 (0.2)a 3.1 (0.6)a 3.1 (0.2)a 2.9 (0.2)a 1.8 (0)b C/N 14.9 (0.6)a 17 (0.3)ab 17.5 (1.4)ab 19.1 (0.8)b 15.1 (0.8)a S (mg kg-1) 0.5 (0.1)a 0.6 (0.1)a 0.7 (0)a 0.5 (0)a 0.4 (0)a P (mg kg-1) 3.1 (0.4)a 3.3 (0.7)a 0.9 (0.3)b 2.9 (0.6)a 0.3 (0.1)b Ca (mg kg-1) 739 (393)a 71 (6)ab 171 (48)ab 179 (39)ab 44 (8)b Mg (mg kg-1) 113 (33)a 18 (2)b 50 (10)b 34 (7)b 11 (3)b Na (mg kg-1) 38 (2)a 31 (2)a 38 (2)a 37 (3)a 20 (2)b K (mg kg-1) 208 (17)a 110 (8)b 104 (10)b 120 (16)b 52 (7)c CEC 21.1 (1.2)a 19.2 (1.9)a 25.8 (1.3)b 18 (0.7)a 11.3 (0.2)c 5-15 cm pH 4.9(0.1)a 4.6 (0)ab 4.5 (0.1)b 4.5 (0.1)b 4.5 (0)b Al Sat (%) 44.7 (17.1)a 91.7 (1.1)b 90.3 (1.4)b 87.3 (1.4)b 84.3 (2.3)b C (mg kg-1) 22.1 (1.6)a 19 (1.7)a 25.7 (2)a 19.5 (2.5)a 20.3 (0.3)a N (mg kg-1) 1.7 (0.1)a 1.2 (0.1)b 1.6 (0)a 1.2 (0.2)b 1.3 (0.1)b C/N 13.3 (0.9)a 15.9 (0.6)a 16.2 (1.4)a 16.7 (1.1)a 15.6 (0.6)a S (mg kg-1) 0.3 (0)a 0.3 (0)ab 0.3 (0)a 0.2 (0)b 0.3 (0)a P (mg kg-1) 0.1 (0)a 0.6 (0.2)ab 0.4 (0.2)a 1.2 (0.3)b 0 (0)a Ca (mg kg-1) 876 (361)a 27 (3)b 78 (17)b 69 (14)b 21 (1)b Mg (mg kg-1) 83 (29)a 8 (0)b 26 (2)b 16 (3)b 6 (1)b Na (mg kg-1) 28 (3)a 22 (1)b 31 (1)a 20 (1)b 17 (1)b K (mg kg-1) 101 (3)a 61 (4)c 74 (10)abc 77 (14)ac 41 (4)bc CEC 17.7 (1.1)a 12.5 (0.3)b 19.2 (1.2)a 11.6 (0.8)b 11.3 (0.5)b
Different letters in the same row represent significant difference at P < 0.05
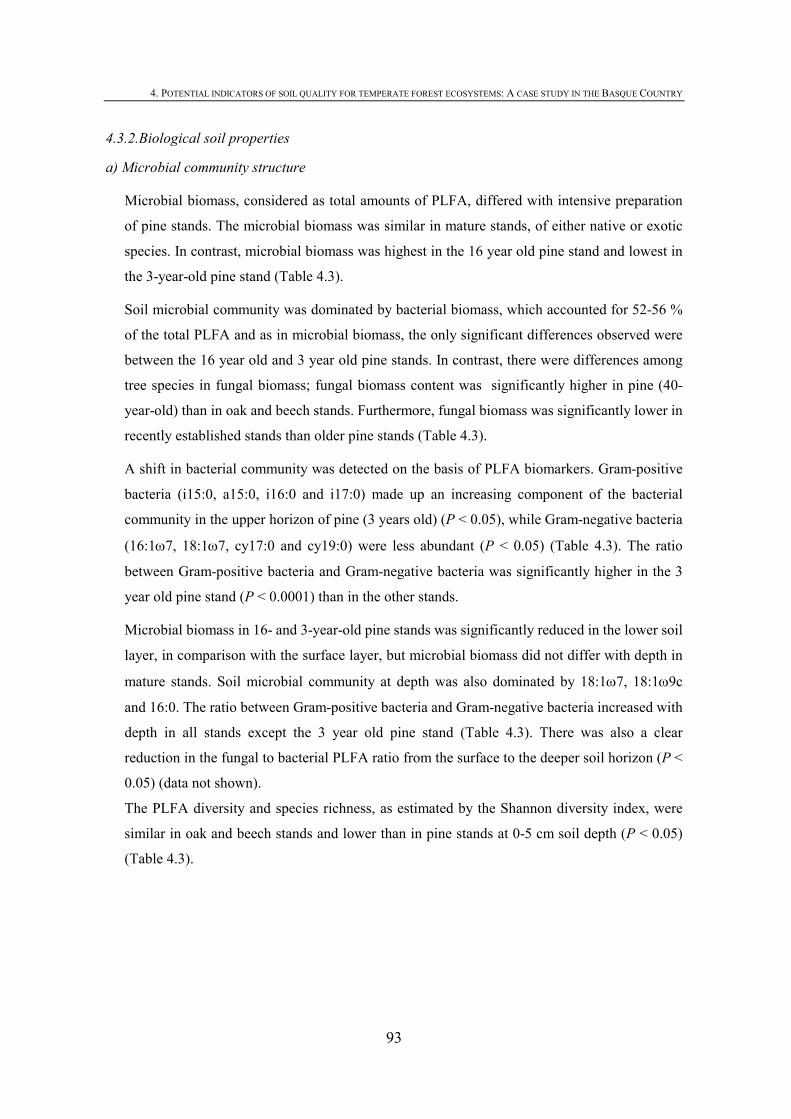
4. POTENTIAL INDICATORS OF SOIL QUALITY FOR TEMPERATE FOREST ECOSYSTEMS: A CASE STUDY IN THE BASQUE COUNTRY
93
4.3.2.Biological soil properties
a) Microbial community structure
Microbial biomass, considered as total amounts of PLFA, differed with intensive preparation
of pine stands. The microbial biomass was similar in mature stands, of either native or exotic
species. In contrast, microbial biomass was highest in the 16 year old pine stand and lowest in
the 3-year-old pine stand (Table 4.3).
Soil microbial community was dominated by bacterial biomass, which accounted for 52-56 %
of the total PLFA and as in microbial biomass, the only significant differences observed were
between the 16 year old and 3 year old pine stands. In contrast, there were differences among
tree species in fungal biomass; fungal biomass content was significantly higher in pine (40-
year-old) than in oak and beech stands. Furthermore, fungal biomass was significantly lower in
recently established stands than older pine stands (Table 4.3).
A shift in bacterial community was detected on the basis of PLFA biomarkers. Gram-positive
bacteria (i15:0, a15:0, i16:0 and i17:0) made up an increasing component of the bacterial
community in the upper horizon of pine (3 years old) (P < 0.05), while Gram-negative bacteria
(16:1ω7, 18:1ω7, cy17:0 and cy19:0) were less abundant (P < 0.05) (Table 4.3). The ratio
between Gram-positive bacteria and Gram-negative bacteria was significantly higher in the 3
year old pine stand (P < 0.0001) than in the other stands.
Microbial biomass in 16- and 3-year-old pine stands was significantly reduced in the lower soil
layer, in comparison with the surface layer, but microbial biomass did not differ with depth in
mature stands. Soil microbial community at depth was also dominated by 18:1ω7, 18:1ω9c
and 16:0. The ratio between Gram-positive bacteria and Gram-negative bacteria increased with
depth in all stands except the 3 year old pine stand (Table 4.3). There was also a clear
reduction in the fungal to bacterial PLFA ratio from the surface to the deeper soil horizon (P <
0.05) (data not shown).
The PLFA diversity and species richness, as estimated by the Shannon diversity index, were
similar in oak and beech stands and lower than in pine stands at 0-5 cm soil depth (P < 0.05)
(Table 4.3).
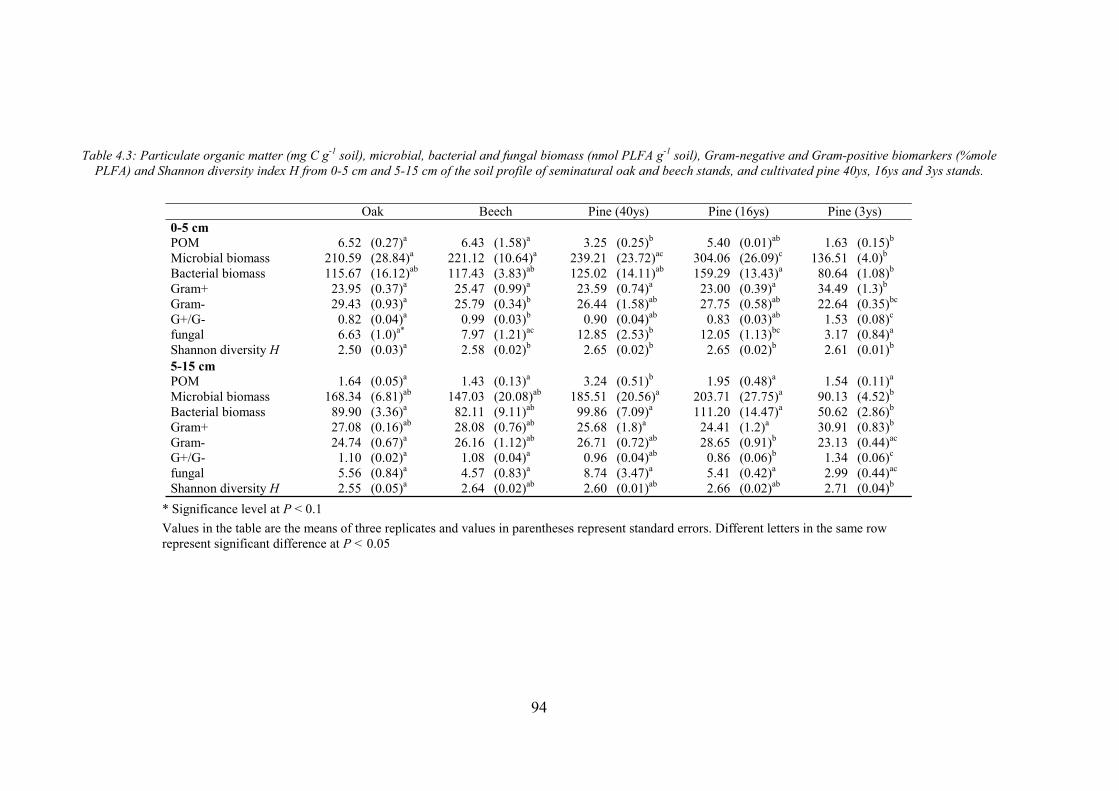
94
Table 4.3: Particulate organic matter (mg C g-1 soil), microbial, bacterial and fungal biomass (nmol PLFA g-1 soil), Gram-negative and Gram-positive biomarkers (%mole PLFA) and Shannon diversity index H from 0-5 cm and 5-15 cm of the soil profile of seminatural oak and beech stands, and cultivated pine 40ys, 16ys and 3ys stands.
Oak Beech Pine (40ys) Pine (16ys) Pine (3ys) 0-5 cm POM 6.52 (0.27)a 6.43 (1.58)a 3.25 (0.25)b 5.40 (0.01)ab 1.63 (0.15)b Microbial biomass 210.59 (28.84)a 221.12 (10.64)a 239.21 (23.72)ac 304.06 (26.09)c 136.51 (4.0)b Bacterial biomass 115.67 (16.12)ab 117.43 (3.83)ab 125.02 (14.11)ab 159.29 (13.43)a 80.64 (1.08)b Gram+ 23.95 (0.37)a 25.47 (0.99)a 23.59 (0.74)a 23.00 (0.39)a 34.49 (1.3)b Gram- 29.43 (0.93)a 25.79 (0.34)b 26.44 (1.58)ab 27.75 (0.58)ab 22.64 (0.35)bc G+/G- 0.82 (0.04)a 0.99 (0.03)b 0.90 (0.04)ab 0.83 (0.03)ab 1.53 (0.08)c fungal 6.63 (1.0)a* 7.97 (1.21)ac 12.85 (2.53)b 12.05 (1.13)bc 3.17 (0.84)a Shannon diversity H 2.50 (0.03)a 2.58 (0.02)b 2.65 (0.02)b 2.65 (0.02)b 2.61 (0.01)b 5-15 cm POM 1.64 (0.05)a 1.43 (0.13)a 3.24 (0.51)b 1.95 (0.48)a 1.54 (0.11)a Microbial biomass 168.34 (6.81)ab 147.03 (20.08)ab 185.51 (20.56)a 203.71 (27.75)a 90.13 (4.52)b Bacterial biomass 89.90 (3.36)a 82.11 (9.11)ab 99.86 (7.09)a 111.20 (14.47)a 50.62 (2.86)b Gram+ 27.08 (0.16)ab 28.08 (0.76)ab 25.68 (1.8)a 24.41 (1.2)a 30.91 (0.83)b Gram- 24.74 (0.67)a 26.16 (1.12)ab 26.71 (0.72)ab 28.65 (0.91)b 23.13 (0.44)ac G+/G- 1.10 (0.02)a 1.08 (0.04)a 0.96 (0.04)ab 0.86 (0.06)b 1.34 (0.06)c fungal 5.56 (0.84)a 4.57 (0.83)a 8.74 (3.47)a 5.41 (0.42)a 2.99 (0.44)ac Shannon diversity H 2.55 (0.05)a 2.64 (0.02)ab 2.60 (0.01)ab 2.66 (0.02)ab 2.71 (0.04)b
* Significance level at P < 0.1 Values in the table are the means of three replicates and values in parentheses represent standard errors. Different letters in the same row represent significant difference at P < 0.05
4. POTENTIAL INDICATORS OF SOIL QUALITY FOR TEMPERATE FOREST ECOSYSTEMS: A CASE STUDY IN THE BASQUE COUNTRY
95
b) Microbial community function
Extracellular enzyme activities involved in C-, N-, P- and S-cycling decreased within the soil
profile in all sites (Table 4.4). The oak ecosystem was characterised by higher β-glucosidase and
α-glucosidase activity in the upper soil layer (0-5 cm) than in the other sites (P < 0.05).
Although the differences between most individual extracellular enzyme activities were not
statistically significant, there was a 32-74 % reduction in all enzyme activities in the 3-year-old
pine plantation in comparison with the average activity across other ecosystems.
Phosphatase activity was extremely high in all ecosystems in comparison with the values
reported in previous studies (Larson et al., 2002; Sinsabaugh et al., 2003; Hasset and Zak, 2005).
Mean phosphatase activity for the oak ecosystem was 7.5 μmol h-1 g-1, for beech forest, 7.1
μmol h-1 g-1 and for pine (40-year-old), pine (16-year-old) and pine (3-year-old), 8.1, 5.7 and 3.5
μmol h-1 g-1 respectively. The acid phosphatase activity was significantly higher (P < 0.1) in
mature stands than in the other stands.
Data obtained from the upper soil by a multi-enzyme assay with MUB substrates were used for
principal component analyses and the initial eight enzyme variables were reduced to three
factors. PCA1 explained 50 % of the variance and was associated with polysaccharide
decomposition and strongly correlated with the activities of three enzymes involved in the
production of glycosides and cellobiohydrolase. PCA2 explained 20 % of the variance and was
associated with the N cycle (amino peptidases). PCA3 explained 18 % of the variance and was
related to mineralization of organic phosphorus. Xylosidase activity, which causes degradation
of hemicellulose, was correlated with PCA3. At the lower soil depth, PCA1 and PCA2
explained 48% and 26% of the total variance respectively. PCA1 was associated with C and P
cycles and PCA2 with N cycle, however it was not possible to separate the different types of
forest management.
4.3.3. Physical soil properties
Soil moisture content at sampling declined significantly from 0-5 cm to 5-15 cm depth in all
stands except the pine stand (3-year-old), in which there was no difference in moisture level
between the two horizons and the values were very close to those observed in the deeper horizon
in the other stands. Bulk densities from 0-5 cm depth ranged from 1.09 g/cm3 in pine (40-year-
old) to 1.35 g/cm3 in the pine (3-year-old) stand and soil water content at field capacity decreased
with increasing bulk density (Table 4.5).
Soil water content at field capacity ranged from 0.24 cm3/cm3 in the pine stand (3-year-old) to
0.40 cm3/cm3 in oak stand, and water contents at field capacity were higher in all mature stands
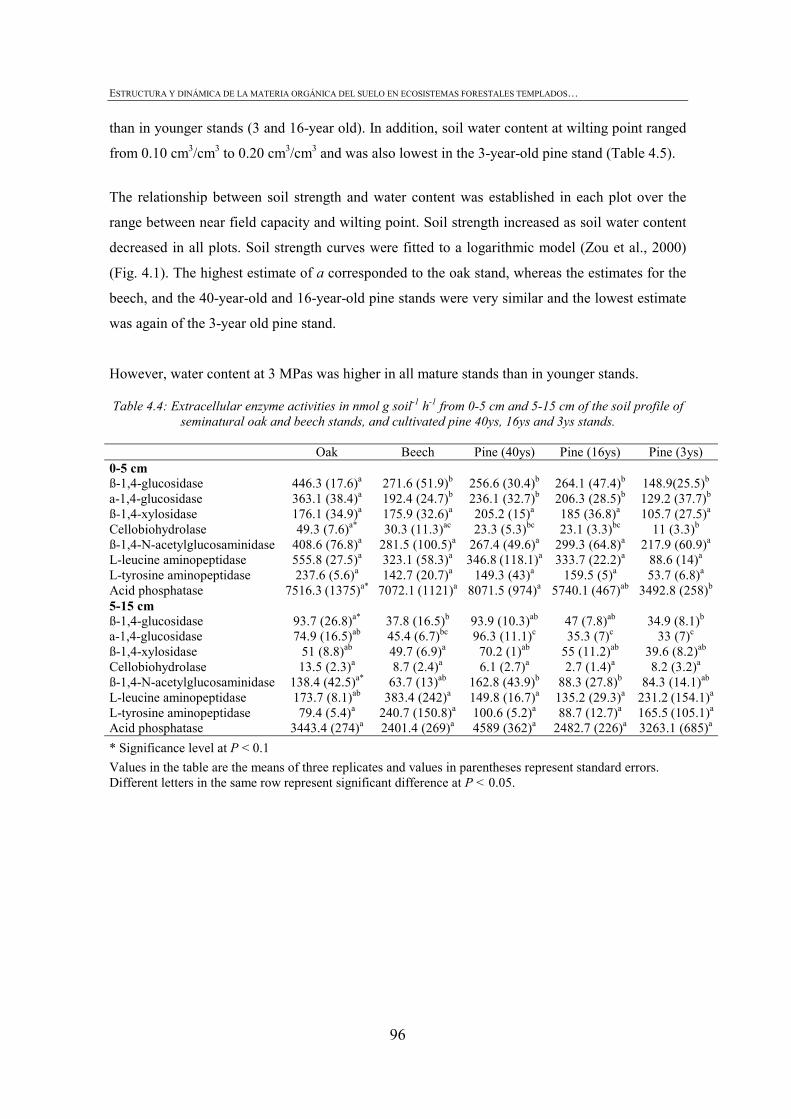
ESTRUCTURA Y DINÁMICA DE LA MATERIA ORGÁNICA DEL SUELO EN ECOSISTEMAS FORESTALES TEMPLADOS…
96
than in younger stands (3 and 16-year old). In addition, soil water content at wilting point ranged
from 0.10 cm3/cm3 to 0.20 cm3/cm3 and was also lowest in the 3-year-old pine stand (Table 4.5).
The relationship between soil strength and water content was established in each plot over the
range between near field capacity and wilting point. Soil strength increased as soil water content
decreased in all plots. Soil strength curves were fitted to a logarithmic model (Zou et al., 2000)
(Fig. 4.1). The highest estimate of a corresponded to the oak stand, whereas the estimates for the
beech, and the 40-year-old and 16-year-old pine stands were very similar and the lowest estimate
was again of the 3-year old pine stand.
However, water content at 3 MPas was higher in all mature stands than in younger stands.
Table 4.4: Extracellular enzyme activities in nmol g soil-1 h-1 from 0-5 cm and 5-15 cm of the soil profile of seminatural oak and beech stands, and cultivated pine 40ys, 16ys and 3ys stands.
* Significance level at P < 0.1 Values in the table are the means of three replicates and values in parentheses represent standard errors. Different letters in the same row represent significant difference at P < 0.05.
Oak Beech Pine (40ys) Pine (16ys) Pine (3ys) 0-5 cm ß-1,4-glucosidase 446.3 (17.6)a 271.6 (51.9)b 256.6 (30.4)b 264.1 (47.4)b 148.9(25.5)b a-1,4-glucosidase 363.1 (38.4)a 192.4 (24.7)b 236.1 (32.7)b 206.3 (28.5)b 129.2 (37.7)b ß-1,4-xylosidase 176.1 (34.9)a 175.9 (32.6)a 205.2 (15)a 185 (36.8)a 105.7 (27.5)a Cellobiohydrolase 49.3 (7.6)a* 30.3 (11.3)ac 23.3 (5.3)bc 23.1 (3.3)bc 11 (3.3)b ß-1,4-N-acetylglucosaminidase 408.6 (76.8)a 281.5 (100.5)a 267.4 (49.6)a 299.3 (64.8)a 217.9 (60.9)a L-leucine aminopeptidase 555.8 (27.5)a 323.1 (58.3)a 346.8 (118.1)a 333.7 (22.2)a 88.6 (14)a L-tyrosine aminopeptidase 237.6 (5.6)a 142.7 (20.7)a 149.3 (43)a 159.5 (5)a 53.7 (6.8)a Acid phosphatase 7516.3 (1375)a* 7072.1 (1121)a 8071.5 (974)a 5740.1 (467)ab 3492.8 (258)b
5-15 cm ß-1,4-glucosidase 93.7 (26.8)a* 37.8 (16.5)b 93.9 (10.3)ab 47 (7.8)ab 34.9 (8.1)b a-1,4-glucosidase 74.9 (16.5)ab 45.4 (6.7)bc 96.3 (11.1)c 35.3 (7)c 33 (7)c ß-1,4-xylosidase 51 (8.8)ab 49.7 (6.9)a 70.2 (1)ab 55 (11.2)ab 39.6 (8.2)ab Cellobiohydrolase 13.5 (2.3)a 8.7 (2.4)a 6.1 (2.7)a 2.7 (1.4)a 8.2 (3.2)a ß-1,4-N-acetylglucosaminidase 138.4 (42.5)a* 63.7 (13)ab 162.8 (43.9)b 88.3 (27.8)b 84.3 (14.1)ab L-leucine aminopeptidase 173.7 (8.1)ab 383.4 (242)a 149.8 (16.7)a 135.2 (29.3)a 231.2 (154.1)a
L-tyrosine aminopeptidase 79.4 (5.4)a 240.7 (150.8)a 100.6 (5.2)a 88.7 (12.7)a 165.5 (105.1)a
Acid phosphatase 3443.4 (274)a 2401.4 (269)a 4589 (362)a 2482.7 (226)a 3263.1 (685)a
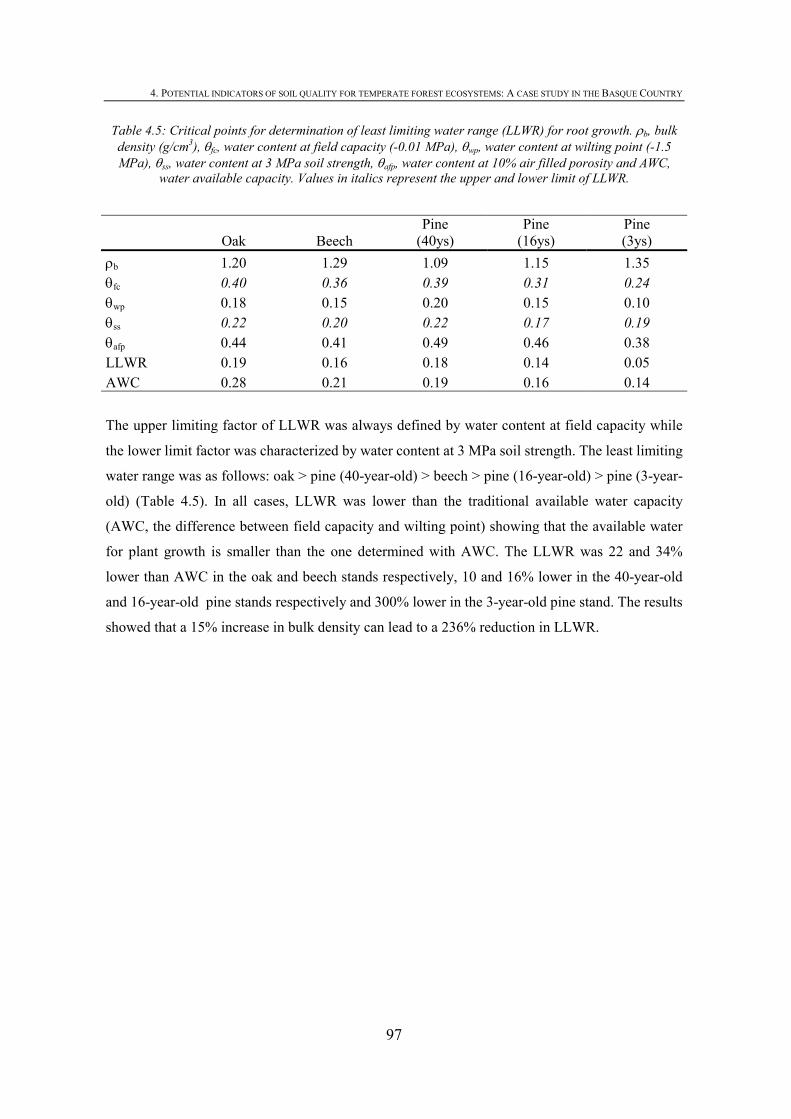
4. POTENTIAL INDICATORS OF SOIL QUALITY FOR TEMPERATE FOREST ECOSYSTEMS: A CASE STUDY IN THE BASQUE COUNTRY
97
Table 4.5: Critical points for determination of least limiting water range (LLWR) for root growth. ρb, bulk density (g/cm3), θfc, water content at field capacity (-0.01 MPa), θwp, water content at wilting point (-1.5 MPa), θss, water content at 3 MPa soil strength, θafp, water content at 10% air filled porosity and AWC,
water available capacity. Values in italics represent the upper and lower limit of LLWR.
The upper limiting factor of LLWR was always defined by water content at field capacity while
the lower limit factor was characterized by water content at 3 MPa soil strength. The least limiting
water range was as follows: oak > pine (40-year-old) > beech > pine (16-year-old) > pine (3-year-
old) (Table 4.5). In all cases, LLWR was lower than the traditional available water capacity
(AWC, the difference between field capacity and wilting point) showing that the available water
for plant growth is smaller than the one determined with AWC. The LLWR was 22 and 34%
lower than AWC in the oak and beech stands respectively, 10 and 16% lower in the 40-year-old
and 16-year-old pine stands respectively and 300% lower in the 3-year-old pine stand. The results
showed that a 15% increase in bulk density can lead to a 236% reduction in LLWR.
Oak Beech Pine
(40ys) Pine
(16ys) Pine (3ys)
ρb 1.20 1.29 1.09 1.15 1.35 θfc 0.40 0.36 0.39 0.31 0.24 θwp 0.18 0.15 0.20 0.15 0.10 θss 0.22 0.20 0.22 0.17 0.19 θafp 0.44 0.41 0.49 0.46 0.38 LLWR 0.19 0.16 0.18 0.14 0.05 AWC 0.28 0.21 0.19 0.16 0.14
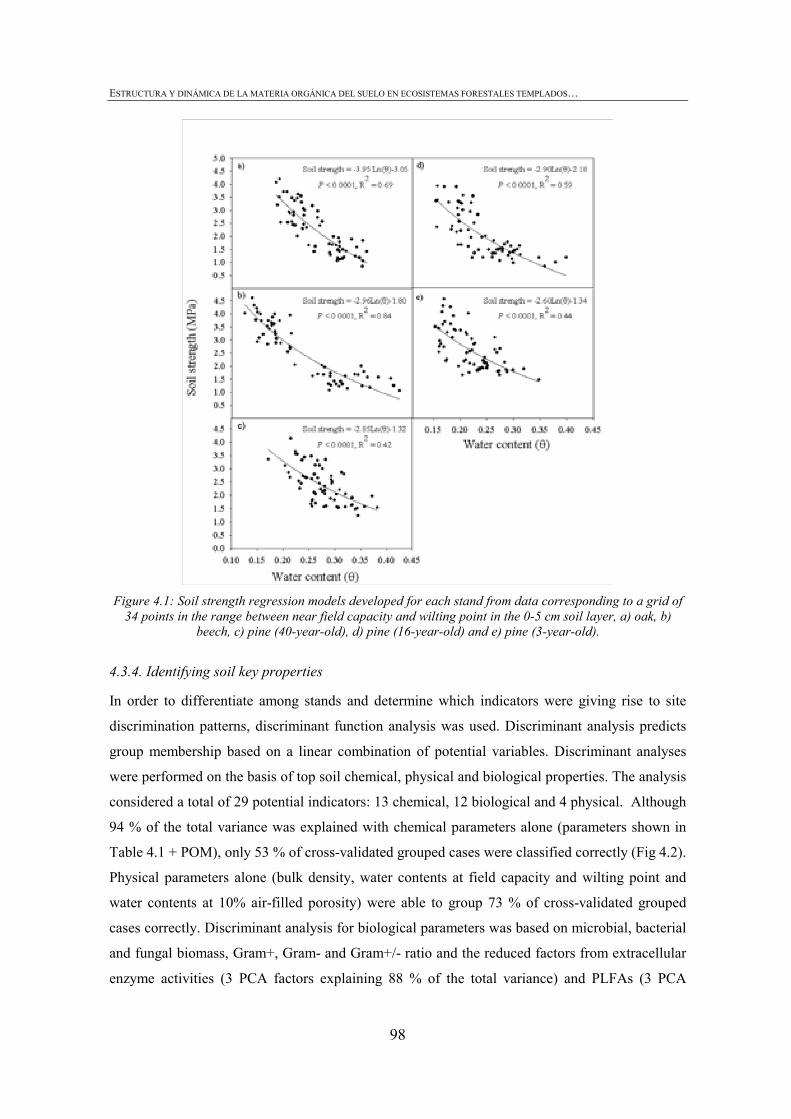
ESTRUCTURA Y DINÁMICA DE LA MATERIA ORGÁNICA DEL SUELO EN ECOSISTEMAS FORESTALES TEMPLADOS…
98
Figure 4.1: Soil strength regression models developed for each stand from data corresponding to a grid of
34 points in the range between near field capacity and wilting point in the 0-5 cm soil layer, a) oak, b) beech, c) pine (40-year-old), d) pine (16-year-old) and e) pine (3-year-old).
4.3.4. Identifying soil key properties
In order to differentiate among stands and determine which indicators were giving rise to site
discrimination patterns, discriminant function analysis was used. Discriminant analysis predicts
group membership based on a linear combination of potential variables. Discriminant analyses
were performed on the basis of top soil chemical, physical and biological properties. The analysis
considered a total of 29 potential indicators: 13 chemical, 12 biological and 4 physical. Although
94 % of the total variance was explained with chemical parameters alone (parameters shown in
Table 4.1 + POM), only 53 % of cross-validated grouped cases were classified correctly (Fig 4.2).
Physical parameters alone (bulk density, water contents at field capacity and wilting point and
water contents at 10% air-filled porosity) were able to group 73 % of cross-validated grouped
cases correctly. Discriminant analysis for biological parameters was based on microbial, bacterial
and fungal biomass, Gram+, Gram- and Gram+/- ratio and the reduced factors from extracellular
enzyme activities (3 PCA factors explaining 88 % of the total variance) and PLFAs (3 PCA
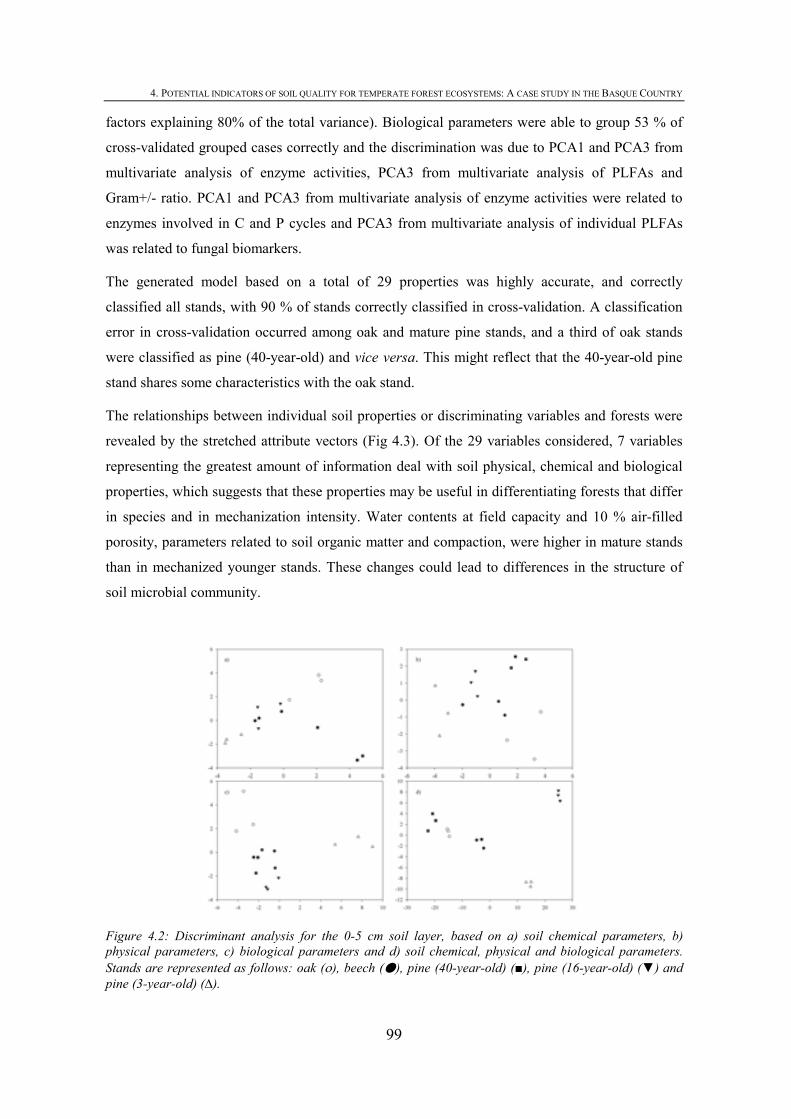
4. POTENTIAL INDICATORS OF SOIL QUALITY FOR TEMPERATE FOREST ECOSYSTEMS: A CASE STUDY IN THE BASQUE COUNTRY
99
factors explaining 80% of the total variance). Biological parameters were able to group 53 % of
cross-validated grouped cases correctly and the discrimination was due to PCA1 and PCA3 from
multivariate analysis of enzyme activities, PCA3 from multivariate analysis of PLFAs and
Gram+/- ratio. PCA1 and PCA3 from multivariate analysis of enzyme activities were related to
enzymes involved in C and P cycles and PCA3 from multivariate analysis of individual PLFAs
was related to fungal biomarkers.
The generated model based on a total of 29 properties was highly accurate, and correctly
classified all stands, with 90 % of stands correctly classified in cross-validation. A classification
error in cross-validation occurred among oak and mature pine stands, and a third of oak stands
were classified as pine (40-year-old) and vice versa. This might reflect that the 40-year-old pine
stand shares some characteristics with the oak stand.
The relationships between individual soil properties or discriminating variables and forests were
revealed by the stretched attribute vectors (Fig 4.3). Of the 29 variables considered, 7 variables
representing the greatest amount of information deal with soil physical, chemical and biological
properties, which suggests that these properties may be useful in differentiating forests that differ
in species and in mechanization intensity. Water contents at field capacity and 10 % air-filled
porosity, parameters related to soil organic matter and compaction, were higher in mature stands
than in mechanized younger stands. These changes could lead to differences in the structure of
soil microbial community.
Figure 4.2: Discriminant analysis for the 0-5 cm soil layer, based on a) soil chemical parameters, b) physical parameters, c) biological parameters and d) soil chemical, physical and biological parameters. Stands are represented as follows: oak (ο), beech (●), pine (40-year-old) (■), pine (16-year-old) (▼) and pine (3-year-old) (∆).
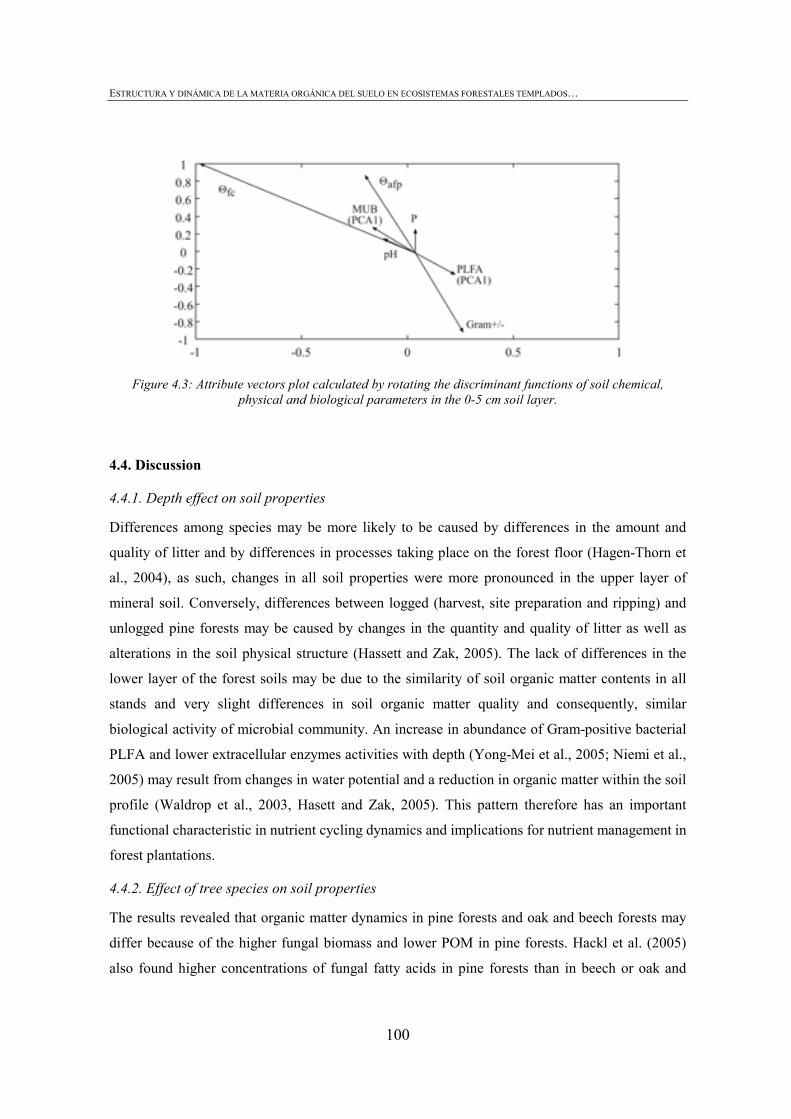
ESTRUCTURA Y DINÁMICA DE LA MATERIA ORGÁNICA DEL SUELO EN ECOSISTEMAS FORESTALES TEMPLADOS…
100
Figure 4.3: Attribute vectors plot calculated by rotating the discriminant functions of soil chemical, physical and biological parameters in the 0-5 cm soil layer.
4.4. Discussion
4.4.1. Depth effect on soil properties
Differences among species may be more likely to be caused by differences in the amount and
quality of litter and by differences in processes taking place on the forest floor (Hagen-Thorn et
al., 2004), as such, changes in all soil properties were more pronounced in the upper layer of
mineral soil. Conversely, differences between logged (harvest, site preparation and ripping) and
unlogged pine forests may be caused by changes in the quantity and quality of litter as well as
alterations in the soil physical structure (Hassett and Zak, 2005). The lack of differences in the
lower layer of the forest soils may be due to the similarity of soil organic matter contents in all
stands and very slight differences in soil organic matter quality and consequently, similar
biological activity of microbial community. An increase in abundance of Gram-positive bacterial
PLFA and lower extracellular enzymes activities with depth (Yong-Mei et al., 2005; Niemi et al.,
2005) may result from changes in water potential and a reduction in organic matter within the soil
profile (Waldrop et al., 2003, Hasett and Zak, 2005). This pattern therefore has an important
functional characteristic in nutrient cycling dynamics and implications for nutrient management in
forest plantations.
4.4.2. Effect of tree species on soil properties
The results revealed that organic matter dynamics in pine forests and oak and beech forests may
differ because of the higher fungal biomass and lower POM in pine forests. Hackl et al. (2005)
also found higher concentrations of fungal fatty acids in pine forests than in beech or oak and
4. POTENTIAL INDICATORS OF SOIL QUALITY FOR TEMPERATE FOREST ECOSYSTEMS: A CASE STUDY IN THE BASQUE COUNTRY
101
suggested that this may be because fungi are presumably more efficient than bacteria at
decomposing pine litter. Pine litter contains high amounts of tannins and lignins and it is well
known that fungi are the main organisms that cause lignin degradation (Dix and Webster, 1995).
Part of the fungal biomass measured as fungal PLFA in pine forest soils may be derived from
ectomycorrihzal fungi (Olsson, 1999), which are known to be dominant colonisers of the
Pinaceae family (Smith and Read, 1997). Furthermore, Salas et al. (2003) found a
correspondence between fungal colonization and POM-P, which indicated that the dynamics of
this macroorganic matter may significantly influence P cycling and that the P contained in this
OM pool may have a significant effect on P availability. It may be interesting to focus further
studies on the dynamics of POM-P and fungal biomass, taking into account that because of the
strongly acidic nature of the soils in northern Spain, the main factor limiting tree growth is the
availability of P (Attiwill and Adams, 1993; Sanchez-Rodríguez et al., 2002). In the Basque
Country, P-Olsen levels below 5 ppm and P-HCl levels below 150 ppm were found in 70 % of
forests studied (Martínez de Arano, 2001), probably because phosphate is immobilized in Fe-
and Al-complexes at low pH (Lajtha and Schlesinger, 1988). Such deficiencies could explain the
very high phosphatase activities observed in the present study, related to the negative
relationship between phosphatase activity and total P in different forests (Olander and Vitousek,
2000, Waldrop et al. 2003). Since phosphatase activity is related to soil organic matter (Tarafar
and Jungk, 1988, Bonmati et al., 1991, Santruckova et al., 2004), the soil microbial community
appears to invest a lot of energy in the production of this enzyme and in the aquisiton of
inorganic P for microbial growth (Clarholm, 1993).
Bulk densities were significantly higher in oak and beech stands than in the mature pine stand.
Forest soils may be compacted by grazing animals and by the roots of the trees themselves
(Greacen and Sands, 1980) and the present results suggest that oak and beech roots become the
soil more compacted than pine roots, however the differences in bulk densities were not reflected
in water contents at field-capacity, wilting-point, 10 % air-filled porosity or soil strength at 3
Mpa. Furthermore, LLWR -defined as an index of soil quality for plant growth- was very similar
in all mature stands and higher than the values reported by Leao et al. (2006) for native Cerrado
forest in Brazil.
4.4.3. Logging effect on soil properties
The effects of soil organic matter removal and alteration in soil physical structure induced by
logging were very pronounced in the youngest pine stand, at 3 years after establisment. Total C
and some chemical parameters related to SOM such as cation exchange capacity (CEC) were
ESTRUCTURA Y DINÁMICA DE LA MATERIA ORGÁNICA DEL SUELO EN ECOSISTEMAS FORESTALES TEMPLADOS…
102
significantly lower in this stand than in the other stands. The observed decline in microbial
biomass was consistent with the removal of organic matter (Hasset and Zak, 2005), and increased
intensity of physical disturbance causes a decline in fungal biomass (Calderson et al., 2001,
Gattinger et al., 2002). The bacterial community also shifted in the recently logged stand and there
was an increase in abundance of Gram-positive bacterial PLFA with a concomitant decrease in
Gram-negative bacterial PLFA. The present results are consistent with those of previous studies
carried out in different ecosystems (Whyte et al., 2002, Margesin et al., 2003, Margesin et al.,
2007), and can be explained by differences in microbial populations in terms of patterns of growth
and reproduction. Gram-positive soil bacteria are able to use more complex carbon sources, such
as mature SOM, and survive in resource limited ecosystems (K strategist); however, Gram-
negative bacteria rely on easily degradable recent plant carbon sources and grow under substrate-
rich conditions (r strategists) (Kramer and Gleixner, 2008). Dale et al. (2007) also found higher
Gram-positive PLFA indicators in pine forests with moderate- and heavy-intensity military use in
Georgia, USA, and Siira-Pietikainen et al. (2001) also concluded that the PLFA pattern was a
sensitive indicator for identifying stress conditions induced by harvesting and mechanical site
preparation in microbial communities, resulting from harvesting in spruce forests in Finland.
Soil physical properties were significantly altered by logging operations even at 16 years after
plantation establishment. Compaction produced by vehicles used in the forest operations during
establishment was still evident in the 16 year-old pine stand in comparison with the mature
unlogged pine stand. Changes in soil structure are reflected in water content and gas diffusion,
and therefore in plant growth (da Silva and Kay, 2004). As expected, water content at 10 % air-
filled porosity declined with increasing bulk density, and water content at field capacity also
decreased with decreasing soil organic matter.
The results obtained show that LLWR was more effective than AWC at reflecting changes in soil
strength, pore size distribution and water retention in a meaningful single parameter. Similar
values of LLWR to those obtained for pine (3-year-old) were reported for grazed pasture (Leao et
al., 2006) and even lower values in soils under wheel tracks (Chan et al., 2006). Soils with a
narrow LLWR are vulnerable to the effects of both drought and heavy rainfall (da Silva and Kay,
1997), and Benjamin et al. (2003) found that narrow LLWR can reduce the potential of a soil to
support plant growth. The least limiting water range may therefore be a sensitive indicator of soil
quality for plant growth.
4. POTENTIAL INDICATORS OF SOIL QUALITY FOR TEMPERATE FOREST ECOSYSTEMS: A CASE STUDY IN THE BASQUE COUNTRY
103
4.4.4. Identifying soil key properties
The ocurrence of singularities and multi-colinearities that are present when all the indicators are
used in the analysis were solved by use of the stepwise discriminant method (Stevens, 2002).
Furthermore, when groups are defined a priori (as in this study), stepwise discriminant analysis is
better than another commonly used method to describe multivariate data, namely Principal
Component Analysis (PCA) (Tabachnik and Fidell, 2001). The 7 soil properties selected by
discriminant function analysis represent the range of ecological indicator types that were
surveyed in the present study: soil chemical, physical and biological properties. Water content at
field capacity was consistently correlated with soil organic matter, and water content at 10 % air-
filled porosity with bulk density. The stretched attribute vector analysis revealed that these
physical parameters correspond to mature stands, which reflects the influence of logging
operations on both soil organic matter and soil physical structure. A shift in soil microbial
community was observed in the recently logged pine stand, and thus the ratio of Gram+/- bacteria
appears to be a promising microbial indicator for detecting changes caused by forest management.
The presence of phosphorus in discriminant function analysis reflects the nutritional stress in
these forest ecosystems. The results suggest that an adequate minimum dataset for evaluating the
sustainability of forest management should reflect this diversity.
4.5. Conclusions
Development of more sustainable forestry practices and credible certification systems relies on
continuous monitoring of indicators. The National Forest Inventory (NFI), which is the only
monitoring programme existing in Spain, provides information on the development of
aboveground forest resources. However, assessment of the sustainability of forest management
requires soil-based sustainability indicators as forestry largely affects soil systems. The
conclusions reached in the present study could be used as a starting point for planning soil
monitoring programmes.
Since the values of many soil properties, especially soil biological properties, decreased within
soil profile, the upper 5 cm of the mineral horizon may be recommended as the most appropriate
for evaluating changes due to forest management. Discriminant function analysis revealed that a
diverse set of ecological indicators may be needed to assess the impact of forest management on
soil quality. Parameters such as the ratio of Gram+/- bacteria, water content at field capacity and
concentration of phosphorus may be responsive to logging operations. LLWR may be effective at
reflecting changes in soil strength, pore size ditribution and water retention in a meaningful single
ESTRUCTURA Y DINÁMICA DE LA MATERIA ORGÁNICA DEL SUELO EN ECOSISTEMAS FORESTALES TEMPLADOS…
104
parameter. PLFA fingerprints (i.e. fungal biomarker) were also able to detect more subtle shifts in
soil function, probably due to changes in litter quality and quantity.
All of these properties may be valuable and complementary tools that provide insights into soil
ecosystem processes. However a characteristic of a good indicator of forest sustainability is how it
relates to a benchmark and/or target that defines a sustainable level, and further studies are needed
in temperate forest ecosystems to assess the boundaries for sustainability and the resilience of
these soil properties.
Acknowledgments
Funding for this study was provided by European Union ERDF-INTERREG IIIB Atlantic Area
and the Department of Agriculture, Fisheries and Food of the Basque Country. We thank Dr.
Javier Arostegui for helping with mineralogical analyses and Sabine Rudolph for her technical
assistance with PLFA analysis. We also thank Dr. Christine Francis for revising the English of the
manuscript.
4.6. References
Attiwill P.M. and Adams M.A., 1993. Nutrient cycling in forests. New phytologist 124, 561-582.
Bauhus J, Khanna P.K., Hopmans P. and Weston C., 2002. Is soil carbon a useful indicator of
sustainable forest soil management?-a case study from native eucalypt forests of south-eastern
Australia. Forest Ecology and Management 171:59-74.
Bending G.D., Turner M.K., Rayns F., Marx M.C. and Wood M., 2004. Microbial and
biochemical soil quality indicators and their potential for differentiating areas under
contrasting agricultural management regimes. Soil Biology and Biochemistry 36; 1785-1792.
Benjamin J.G., Nielsen D.C. and Vigil M.F., 2003. Quantifying effects of soil conditions on plant
growth and crop production. Geoderma 116: 137-148.
Betz, C.L., Allmaras, R.R., Copeland, S.M., Randall, G.W., 1998. Least limiting water range:
traffic and long-term tillage influences in a Webster soil. Soil Science Society of America
Journal 62, 1384-1393.
Binkley D., 1995. The influence of tree species on forest soils: processes and patterns. In: Mead
D.J. and Cornforth I.S. (Eds.), Proceedings of the Trees and Soil Workshop, Canterbury, New
Zealand, 28 Feb-2 Mar, 1994. Lincoln University Press, Canterbury, New Zealand, pp. 1-33.
4. POTENTIAL INDICATORS OF SOIL QUALITY FOR TEMPERATE FOREST ECOSYSTEMS: A CASE STUDY IN THE BASQUE COUNTRY
105
Bligh E.G. and Dyer W.J., 1959. A rapid method of total lipid extraction and purification.
Canadian Journal of Biochemistry Physics 37: 911-917.
Bonmati M.C., Ceccanti B. and Nannipieri P., 1991. Spatial variability of phosphatase, urease,
protease, organic carbon and total nitrogen in soil. Soil Biology and Biochemistry 23: 391-396.
Calderson F., Jackson L.E., Scow K.M. and Rolston D.E., 2001. Short-term dynamics of nitrogen,
microbial activity and phospholipid fatty acids after tillage. Soil Science Society of America
Journal 65: 118–126.
Cambardella C.A. and Elliot E.T., 1992. Particulate soil organic matter changes across a grassland
cultivation sequence. Soil Science Society of America Journal 56: 777-783.
Chan K.Y., Oates A., Swan A.D., Hayes R.C., Dear B.S., Peoples M.B., 2006. Agronomic
consequences of tractor wheel compaction on a clay soil. Soil and Tillage Research 89: 13-21.
Christensen B.T., 1992. Physical fractionation of soil and organic matter in primary particle size
and density separates. Advances in Soil Science 20: 2-38.
Clarholm M., 1993. Microbial biomass P, labile P, and acid phosphatase activity in the humus
layer of a spruce forest, after repeated additions of fertilizers. Biology and Fertility of Soils
16:287-292.
Dale V.H., Peacock A.D., Garten Jr. C.T., Sobek E., Wolfe A.K., 2007. Selecting indicators of
soil, microbial, and plant conditions to understand ecological changes in Georgia pine forests.
Ecological Indicators. In press
da Silva A.P. and Kay B.D., 1996. The sensitivity of shoot growth of corn to the least limiting
water range of soils. Plant and Soil 184, 323-329.
da Silva A.P. and Kay B.D., 1997b. Effect of soil water content on the variation in the least
limiting water range. Soil Science Society of America Journal 58: 1775-1781.
da Silva A.P. and Kay B.D., 2004. Linking process capability analysis and least limiting water
range for assessing soil physical quality. Soil and Tillage Research 79: 167-174.
Dix, N.J. and Webster, J., 1995. Fungal Ecology. Chapman & Hall, London.
Doran J.W., 2002. Soil health and global sustainability: Translating science into practice.
Agriculture, Ecosystems and Environment 88: 119-122.
Doran J.W. and Parkin T.B., 1994. Definning and assessing soil quality. SSSA Special
Publication, Madison, Wisconsin, EEUU 35: 3-21.
ESTRUCTURA Y DINÁMICA DE LA MATERIA ORGÁNICA DEL SUELO EN ECOSISTEMAS FORESTALES TEMPLADOS…
106
Federle T.W., 1986. Microbial distribution in soil- new techniques. Perspectives in microbial
ecology. Slovene Society for Microbiology, Ljubljana, Slovenia , 493-498.
Fortuna A., Harwood R.R. and Paul E.A., 2003. The effects of compost and crop rotations on
carbon turnover and the particulate organic matter fraction. Soil Science 168: 434-444.
Frostegard A. and Bååth E., 1996. The use of phospholipid fatty acid analysis to estimate bacterial
and fungal biomass in soil. Biology and Fertility of Soils 22: 59-65.
Frostegard A., Bååth E. and Tunlid A., 1993. Phospholipid fatty acid composition, biomass and
acitivity of microbial communities from two soil types experimentally exposed to different
heavy metals. Applied Environmental Microbiology 59: 3605-3617.
Gattinger A., Ruser R., Schloter M. and Munch J. C., 2002. Microbial community structure varies
in different soil zones in a potato field. Journal of Plant Nutrition and Soil Science 165: 421-
428.
Grable A.R. and Siemer E.G., 1968. Effects of bulk density, aggregate size, and soil water suction
on oxygen diffusion, redox potential elongation of corn roots. Soil Science Society of America
Journal 32: 180-186.
Greacen E.L. and Sands R., 1980. Compaction of forest soils: a review. Australian Journal of Soil
Research 18: 163-188.
Hackl E., Pfeffer M., Donat C., Bachmann G. and Zechmeister-Boltenstern S., 2005. Composition
of the microbial communities in the mineral soil under different types of natural forest. Soil
Biology and Biochemistry 37: 661-671
Hair, J.F., Anderson, R.E., Tatham, R.L., Black, W.C., 1995. Multivariate Data Analysis (4th ed.),
Prentice Hall, Englewood Cliffs, NJ, USA
Haise H.R., Haas H.J. and Jensen L.R., 1955. Soil moisture studies of some great plain soils. II
Field capacity as related to 1/3 atmosphere percentage, and “minimum point” as related to 15-
and 26-atmosphere percentage. Soil Science Society of America Journal 34: 20-25.
Hagen-Thorn A., Callesen I., Armolaitis K. and Nihlgård B., 2004. The impact of six European
tree species on the chemistry of mineral topsoil in forest plantations on former agricultural
land. Forest Ecology and Management 195: 373-384.
4. POTENTIAL INDICATORS OF SOIL QUALITY FOR TEMPERATE FOREST ECOSYSTEMS: A CASE STUDY IN THE BASQUE COUNTRY
107
Hasset J.E. and Zak D.R., 2005. Aspen harvest intensity decreases microbial biomass,
extracellular enzyme activity, and soil nitrogen cycling. Soil Science Society of Amrica
Journal 69: 227-235.
Hobbie S.E., 1992. Effects of plant species on nutrient cycling. Trends in Ecology and Evolution
7: 336-339.
Klute A., 1986. Water retention: Laboratory methods. In: Klute A., (ed) Methods of soil analysis.
Part 1, 2nd ed, Agronomy Monographs 9, Madison, WI, pp. 635-662.
Kramer C. and Gleixner G., 2008. Soil organic matter in soil depth profiles: Distinct carbon
preferences of microbial groups during carbon transformation. Soil Biology and Biochemistry
40: 425-433.
Larson J.L., Zak D.R. and Sinsabaugh R.L., 2002. Extracellular enzyme activity beneath
temperate trees growing under elevated carbon dioxide and ozone. Soil Science Society of
America Journal 66: 1848-1856.
Lajtha K., Schlesinger W.H., 1988. The biogeochemistry of phosphorus cycling and phosphorus
availability along a desert soil chronosequence. Ecology 69: 24-39.
Leão T.P., da Silva A.P., Macedo M.C.M., Imhoff S. and Euclides V.P.B., 2006. Least limiting
water range: A potential indicator of changes in near-surface soil physical quality after the
conversion of Brazilian Savanna into pasture. Soil and Tillage Research 88: 279-285.
Leckie S.E., Prescott C.E. and Grayston S.J., 2004. Forest floor microbial community response to
tree species and fertilization of regenerating coniferous forests. Canadian Journal of Forest
Research 34: 1426-1435.
Margesin R., Labbé D., Schinner F., Greer C. and Whyte L., 2003. Characterization of
hydrocarbon-degrading microbial populations in contaminated and pristine alpine soils.
Applied Environmental Microbiology 69: 3085-3092.
Margesin R., Hämmerle M. and Tscherko D., 2007. Microbial activity and community
composition during bioremediation of diesel-oil-contaminated soil: effects of hydrocarbon
concentration, fertilizers and incubation time. Microbial Ecology 53: 259-269.
McKenzie, D.C., McBratney, A.B., 2001. Assessment of cotton root growth in a compacted
Vertisol (Grey Vertosol). I. Prediction using strength measurements and "limiting water
ranges". Australian Journal of Soil Research 39, 1157-1168.
ESTRUCTURA Y DINÁMICA DE LA MATERIA ORGÁNICA DEL SUELO EN ECOSISTEMAS FORESTALES TEMPLADOS…
108
Mariani L., Chang S.X. and Kabzems R., 2006. Effects of tree harvesting, forest floor removal,
and compaction on soil microbial biomass, microbial respiration and N availability in a boreal
aspen forest in British Columbia. Soil Biology and Biochemistry 38: 1734-1744.
Marriott E.E. and Wander M.M., 2006. Total and labile soil organic matter in organic and
conventional farming systems. Soil Science Society of America Journal 70: 950-959.
Martínez de Arano I., 2001. Estado nutritivo y recomendaciones de fertilización para Pinus
radiata. Euskadi Forestal 61, 47-51.
Marx M.C., Wood M. and Jarvis S.C., 2001. A microplate fluorimetric assay for the study of
enzyme diversity in soils. Soil Biology and Biochemistry 33: 1633-1640.
Nambiar E.K.S., 1996. Sustained productivity of forests is a continuing challenge to soil science.
Soil Science Society of America Journal 60: 1629-1642.
Niemi R.M., Vepsäläinen M., Wallenius K., Simpanen S., Alakukku L. and Pietola L., 2005.
Temporal and soil depth-related variation in soil enzyme activities and in root growth of red
clover (Trifolium pratense) and timothy (Phleum pratense) in the field. Applied Soil Ecology
30: 113-125.
Olander L.P. and Vitousek P.M., 2000. Regulation of soil phosphatase and chitinase activity by N
and P availability. Biogeochemistry 49: 175-190.
Olsen S.R., Cole C.V., Watanabe F.S. and Dean L.A., 1954. Estimation of available phosphorus
in soils by extraction with sodium bicarbonate. U.S. Dep. of Agric. Circ. 939.
Olsson P.A., 1999. Signature fatty acids provide tools for determination of the distribution and
interactions of mycorrhizal fungi in soil. FEMS Microbiology Ecology 29: 303–310.
Ortubai, A., 1995. Relación clima-vegetación en la Comunidad Autónoma del País vasco. PhD
Thesis nº 27. Departamento de Industria, Agricultura y Pesca. Gobierno Vasco.
Raulund-Rasmussen K. and Vejre H., 1995. Effect of tree species and soil properties on nutrient
immobilization in the forest floor. Plant and Soil 169: 345-352.
Richards L.A. and Weaver L.R., 1944. Fifteen atmosphere percentage as related to the permanent
wilting point. Soil Science 56: 331-339.
Salas A.M., Elliott E.T., Westfall D.G., Cole C.V. and Six J., 2003. The role of particulate organic
matter in phosphorous cycling. Soil Science Society of America Journal 67: 181-189
Sánchez-Rodríguez F., Rodríguez-Soalleiro R., Español E., López C. A. and Merino A., 2002.

4. POTENTIAL INDICATORS OF SOIL QUALITY FOR TEMPERATE FOREST ECOSYSTEMS: A CASE STUDY IN THE BASQUE COUNTRY
109
Influence of edaphic factors and tree nutritive status on the productivity of Pinus radiata D.
Don plantations in northwestern Spain. Forest Ecology and Management 171: 181-189.
Sands R., Greacen E.L. and Gerard C.J., 1979. Compaction of sandy soils in radiata pine forests. I
A penetrometer study. Australian Journal of Soil Research 17: 101-113.
Santruckova H., Vrba J., Picek T. and Kopacek J., 2004. Soil biochemical activity and
phosphorous transformations and losses from acidified forest soils. Soil Biology and
Biochemistry 36: 1569-1576.
Shukla M.K., Lal R. and Ebinger M., 2006. Determinig soil quality indicators by factor analysis.
Soil Tillage and Research 87: 194-204.
Siira-Pietikäinen A., Haimi J., Kanninen A., Pietikäinen J. and Fritze H., 2001. Responses of
decomposer community to root-isolation and addition of slash. Soil Biology and Biochemistry
33: 1993-2004.
Sinsabaugh R.L., Saiya-Cork K., Long T., Osgood M.P., Neher D.A., Zak D.R. and Norby R.J.,
2003. Soil microbial activity in a Liquidambar plantation unresponsive to CO2-driven
increases in primary production. Applied Soil Ecology 24: 263-271.
Smith, S.E. and Read, D.J., 1997. Mycorhizal Symbiosis. Academic Press, San Diego.
Soil Survey Staff, 2006. Keys to Soil Taxonomy, 10th ed. USDA-Natural Resources Conservation
Service, Washington, DC.
Stevens, J.P., 2002. Applied Multivariate Statistics for the Social Sciences (4th ed.), Lawrence
Erlbaum Associates, Inc., Mahwah, New Jersey.
Tabachnick B.G., Fidell, L.S., 2001. Using Multivariate Statistics (4th ed.), Allyn and Bacon,
Boston, MA, USA.
Tarafdar J.C. and Jungk A., 1987. Phosphatase activity in the rhizosphere its relation to the
depletion of soil organic phosphorus. Soil Biology and Fertility of Soils 3: 199-204.
Tscherko D. and Kandeler E., 1999. Biomonitoring of soils - microbial biomass and enzymatic
processes as indicators for environmental change. Die Bodenkultur 50: 215-226.
Tscherko D., Kandeler E. and Bárdossy A., 2007. Fuzzy classification of soil microbial biomass
and enzyme activity in grassland soils. Soil Biology and Biochemistry 39: 1799-1808
ESTRUCTURA Y DINÁMICA DE LA MATERIA ORGÁNICA DEL SUELO EN ECOSISTEMAS FORESTALES TEMPLADOS…
110
Waldrop M.P., MacColl J.G. and Powers R.F., 2003. Effects of forest postharvest management
practices on enzyme activities in decomposing litter. Soil Science Society of America Journal
67: 1250-1256.
White D.C., Davis W.M., Nickels J.S., King J.C. and Bobbie R.J., 1979. Determination of
sedimentary microbial biomass by extractable lipid phosphate. Oecologia 40: 51-62.
Whyte L.G., Schultz A., van Beilen J.B., Luz A.P., Pellizari V., Labbé D. and Greer C.W., 2002.
Prevalence of alkane monooxygenase genes in Artic and Antartic hydrocarbon-contaminated
and pristine soils. FEMS Microbiol Ecol 41: 141-150.
Yong-Mei Z., Ning W., Guo-Yi Z., Wei-Kai B., 2005. Changes in enzyme activities of spruce
(Picea balfouriana) forest soil as related to burning in the eastern Qinghai-Tibetan Plateau.
Applied Soil Ecology 30: 215-225.
Zelles L., 1999. Fatty acid patterns of phospholipids and lipopolysaccharides in the
characterisation of microbial communities in soil: a review. Biology and Fertility of Soils 29:
111-129.
Zou C., Sands R., Buchan G. and Hudson I., 2000. Least limiting water range: a potential
indicator of physical quality of forest soil. Australian Journal of Soil Research 38: 947-958
5. Soil organic matter in soil physical fractions in adjacent seminatural and cultivated forests in the Basque Country Changes from natural tree species to rapidly growing exotic species as well as intensification of forestry operations can lead to changes in the quantity and quality of organic matter inputs to soil and disruption of soil physical structure, the two ecosystem properties that are most probably linked to organic matter dynamics. Five adjacent forest stands were selected to study soil organic matter dynamics in soil physical fractions. Two seminatural broadleaved forests (Quercus robur, Fagus sylvatica) and an adult radiata pine plantation (40-year-old,) in order to study the effect of species change, and, a chronosequence of Pinus radiata plantations (40-year-old; 16-year-old, and 3-year-old), to study the effect of mechanization during harvesting and site preparation. Samples of intact topsoil (0-5 cm) were collected and aggregate size distribution, mean weight diameter (MWD), total C and N, particulate organic matter (POM)-C, POM-N and microbial biomass were determined in each aggregate size fraction. Microbial respiration and nitrogen mineralization were also assessed in each aggregate size fraction, during a 28 day incubation period. Losses of POM-C and POM-N in the whole soil due to mechanical site preparation were high relative to total soil C and N, which suggests that POM is sensitive to the effect of mechanization. The proportion of C-POM:SOM was significantly related to MWD (R2 = 0.75, P < 0.001). Semi-natural forests were able to be distinguished from cultivated and from recently mechanized forests by the proportion of macroaggregates (0.25-2 mm). Megaaggregates (> 2 mm) were more abundant in mature stands (82-92 %), whereas macro- and microaggregates (< 2 mm) were more abundant in mechanically prepared Pinus radiata pine plantations (49 %). The concentrations of C and N in the soil under study were not higher in larger aggregates, which indicates that POM may play a key role in macroaggregate formation. Soil aggregate distribution and POM may be useful indicators for decision-making regarding the most appropriate management practices for increasing soil sustainability.

113
5.1. Introduction
Conversion of native forests and afforestation of agricultural or abandoned land into cultivated
forests of rapidly growing exotic species is a worldwide phenomenon induced by increasing
population growth and demand for wood and fibres. In addition, the increasing concurrence in
global markets is putting greater pressure on forest ecosystems, which is usually accompanied by
intensification of harvesting and site preparation practices. Cultivated radiata pine (Pinus radiata
D. Don) forests cover more than 4x10⁶ hectares in the southern hemisphere (mainly in Chile, New
Zealand, Australia and South Africa) but only around 300,000 ha in the northern hemisphere,
mostly in northern Spain (Lavery and Mead, 1998). Forests previously dominated by Quercus
robur L., were mostly felled by the end of the XIX century and were reforested during the XXth
century with radiata pines in the Basque Country. Dominant tree species affect the availability and
biochemical composition of organic matter inputs to soil (Leckie et al., 2004) and different root
systems also affect aggregation differently, in relation to different root properties, exudates and
functions (Chan and Heenan, 1999b).
The current plantation management in cultivated radiata pine forests in the Basque Country
involves a clear-cut regime with rotation lengths between 30 and 40 years, harvesting with saw
chain and skidding, and mechanical site preparation prior to planting with processes such as
blading and ripping. These forestry practices may alter the amount and turnover rates of soil
organic matter (SOM). Harvesting and site preparation result in considerable disturbance to the
forest floor and a consequent redistribution of organic matter across the site (Merino et al., 2004);
ripping breaks soil aggregates and exposes the previously protected organic matter to microbial
decomposition (Ashagrie et al., 2007). Apart from the detrimental effect of harvesting and site
preparation on soil structure and soil quality (Horn et al., 2004), the released organic C may
contribute to global warming (IPCC, 2000).
Maintenance or enhancement of SOM in forest ecosystems is crucial for sustainable use of forest
resources because of the multiple effects of SOM on nutrient dynamics (Binkley, 1995), C cycle
(Nambiar, 1996) and soil structure.
SOM improves soil structure by enhancing aggregation and therefore it influences soil water
movement and retention, aeration, erosion, nutrient recycling, root penetration and production
(Bronick and Lal, 2005). The role of physical structure in determining SOM sequestration and
turnover has generated much interest in recent years (Six et al., 2004, Liao et al., 2006). The
relationship between organic matter and soil aggregation was proposed by Tisdall and Oades
(1982) in a conceptual model and these authors considered three different cementing or binding
agents: temporary, transient and persistent. Persistent binding agents consist of degraded,
ESTRUCTURA Y DINÁMICA DE LA MATERIA ORGÁNICA DEL SUELO EN ECOSISTEMAS FORESTALES TEMPLADOS…
114
aromatic humic materials associated with polyvalent metals strongly sorbed to clays, responsible
for the construction of microaggregates (0.053-0.250 mm). In contrast, temporary and transient
binding agents such as polysaccharides, roots and hyphae are responsible for the stabilization of
microaggregates into macroaggregates (> 0.25 mm). Alternatively, macroaggregates may form
around particulate organic matter (POM). POM is composed of partially decomposed plant and
animal residues (Christensen, 2001) and as POM is decomposed and microbial exudates are
released, the macroaggregate becomes more stable, the C:N ratio decreases, and microaggregates
form inside (Oades, 1984). Because of the relatively labile nature of temporary and transient
binding agents, soil management has a greater effect on macroaggregates and the organic matter
retained on them, than on microaggregates, which have more stabilized and humified organic
matter (Six and Jastrow, 2002).
The effects of tree species on soil aggregation and of intensive forest practices on soil aggregate
distribution may be of great importance in regulating accretion or depletion of SOM in temperate
Atlantic forests. To gain insights into the interactions between SOM structure and dynamics in
temperate forests, natural aggregates from the field should be studied (Pulleman and Marinissen,
2004).
Understanding these relationships in mature semi-natural and cultivated forests and in plantations
differing in management intensity is of particular interest for developing sustainable forest
management practices. Five adjacent forest stands with different species, and in which different
silvicultural treatments had been applied, were selected as a case study. The main objective of this
case study was to gain insight into the following: i) the distribution of standing stock of soil C and
N pools in forest stands differing in tree species and in forest plantations with different
silvicultural history, ii) the effect of forest management (species change and mechanization) on
the temporary binding agents and its relationship with soil aggregation and iii) the role of soil
aggregates in active C and N pools in response to forest management.
5.2. Materials and methods
5.2.1. Site description
The study site (30T, 534075, 4783284) was selected as an example of the landscape of the Atlantic
forest landscape in the Basque Country. Climate in this region is mesothermic, characterized by
cool, moist summers and mild, wet winters. The mean air temperature is 18.7 ºC in summer and 9.6
ºC in winter. The mean annual precipitation ranges between 1200 and 2000 mm (Ortubai, 1995) and
5. SOIL ORGANIC MATTER IN SOIL PHYSICAL FRACTIONS IN ADJACENT SEMINATURAL AND CULTIVATED FORESTS IN THE BASQUE COUNTRY
113
is distributed rather evenly through the year, although maximum levels are observed in autumn and
in spring (González-Arias et al., 2006).
The study area is situated 600 m above sea level. Five different and adjacent forest systems
situated on a Typic Udorthent (SSS, 2006) and under the same climatic conditions, were selected.
Three mature stands were selected and the effects of tree species on soil aggregation and on soil
organic carbon (SOC) pools were evaluated. The dominant species in the stand were oak
(Quercus robur L.), beech (Fagus sylvatica L.) and pine (Pinus radiata D. Don):
(1) Oak: Semi-natural oak forest dominated by Quercus robur with Erica vagans, Ulex
europaeus, Rubus ulmifolius and Ilex aquifolium in the understorey and not managed over the last
century,
(2) Beech: Semi-natural beech forest characterized by Fagus sylvatica pollarded until mid 1940s
for firewood and charcoal and not managed in the last few decades.
(3) Pine40ys: an even-aged mature plantation plantation of Pinus radiata established around 40
years ago. At that time, sites were usually established manually. The understorey of this stand
consisted mainly of a sparse cover of ferns.
In addition, two younger pine stands adjacent to the above mentioned stands were selected, to
evaluate the effect of mechanized forestry practices in commercial cultivated forests relative to
the mature pine stand. These plantations were a 16 year old stand and a 3 year old stand; both
were established with the mechanized techniques shown below:
(4) Pine16ys: a 16 year-old even-aged second-rotation forest harvested with chainsaw felling and
mechanical snigging of logs to a landing with a skidder. Preparation of soil involved displacement
of logging slash residues and surface organic material out of the stand with a front-mounted
straight-blade; seedlings were planted after down-slope ripping.
(5) Pine3ys: A recently established 3 year-old pine plantation established after mechanized site
preparation similar to the previous one.
5.2.2. Soil sampling
Soil samples were collected from the first 5 cm of the mineral soil, by the pit method, in April of
2005. Within each stand, three pits were dug and undisturbed soil samples were taken from the
first 5 cm (≈ 2000 cm3) after removing forest floor material. After sampling, large soil clods were
broken gently by hand. Additional three 5 cm deep soil cores (ø: 5 cm) per stand were taken to
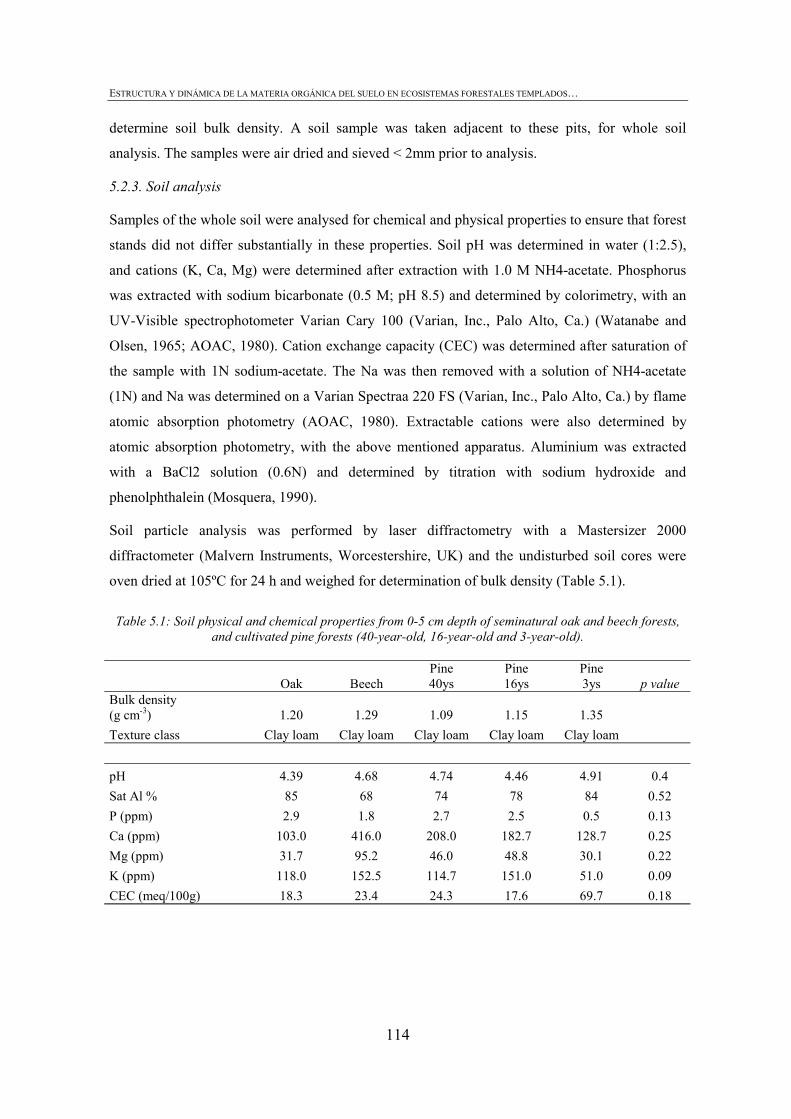
ESTRUCTURA Y DINÁMICA DE LA MATERIA ORGÁNICA DEL SUELO EN ECOSISTEMAS FORESTALES TEMPLADOS…
114
determine soil bulk density. A soil sample was taken adjacent to these pits, for whole soil
analysis. The samples were air dried and sieved < 2mm prior to analysis.
5.2.3. Soil analysis
Samples of the whole soil were analysed for chemical and physical properties to ensure that forest
stands did not differ substantially in these properties. Soil pH was determined in water (1:2.5),
and cations (K, Ca, Mg) were determined after extraction with 1.0 M NH4-acetate. Phosphorus
was extracted with sodium bicarbonate (0.5 M; pH 8.5) and determined by colorimetry, with an
UV-Visible spectrophotometer Varian Cary 100 (Varian, Inc., Palo Alto, Ca.) (Watanabe and
Olsen, 1965; AOAC, 1980). Cation exchange capacity (CEC) was determined after saturation of
the sample with 1N sodium-acetate. The Na was then removed with a solution of NH4-acetate
(1N) and Na was determined on a Varian Spectraa 220 FS (Varian, Inc., Palo Alto, Ca.) by flame
atomic absorption photometry (AOAC, 1980). Extractable cations were also determined by
atomic absorption photometry, with the above mentioned apparatus. Aluminium was extracted
with a BaCl2 solution (0.6N) and determined by titration with sodium hydroxide and
phenolphthalein (Mosquera, 1990).
Soil particle analysis was performed by laser diffractometry with a Mastersizer 2000
diffractometer (Malvern Instruments, Worcestershire, UK) and the undisturbed soil cores were
oven dried at 105ºC for 24 h and weighed for determination of bulk density (Table 5.1).
Table 5.1: Soil physical and chemical properties from 0-5 cm depth of seminatural oak and beech forests, and cultivated pine forests (40-year-old, 16-year-old and 3-year-old).
Oak Beech Pine 40ys
Pine 16ys
Pine 3ys p value
Bulk density (g cm-3) 1.20 1.29 1.09 1.15 1.35 Texture class Clay loam Clay loam Clay loam Clay loam Clay loam pH 4.39 4.68 4.74 4.46 4.91 0.4 Sat Al % 85 68 74 78 84 0.52 P (ppm) 2.9 1.8 2.7 2.5 0.5 0.13 Ca (ppm) 103.0 416.0 208.0 182.7 128.7 0.25 Mg (ppm) 31.7 95.2 46.0 48.8 30.1 0.22 K (ppm) 118.0 152.5 114.7 151.0 51.0 0.09 CEC (meq/100g) 18.3 23.4 24.3 17.6 69.7 0.18
5. SOIL ORGANIC MATTER IN SOIL PHYSICAL FRACTIONS IN ADJACENT SEMINATURAL AND CULTIVATED FORESTS IN THE BASQUE COUNTRY
115
5.2.4. Aggregate-size distribution
Soil samples were allowed to dry at 4 ºC to minimize the impact of air-drying on soil microbial
communities and activities (Schutter and Dick, 2002) until gravimetric water content of about 80
g H2O kg-1 soil was reached, and they were then divided into four portions. The soil was
fractionated into aggregates by a dry-sieving method because external mechanical stresses such as
ripping are thought to be the main causes of aggregate breakdown in the studied ecosystems,
rather than drying-rewetting cycles. Moreover, dry sieving of soil would disrupt the physical
habitat of soil microbial communities to lesser degree than wet-sieving (Schutter and Dick, 2002)
and some of the studied parameters are related to the microbial community and its function.
Fractionation was achieved by placing 100 g of each of the soil portions mentioned above on
nested sieves mounted on Retsch AS200 Control (Retsch Technology, Düsseldorf, Germany).
Sieves were mechanically shaken (amplitude 1.5 mm) for 2 min to separate soil into the following
aggregate size classes: > 20, 20-10, 10-5, 5-2 mm (large macroaggregates or megaaggregates),
2.0-0.25 (macroaggregates); 0.25-0.053 mm (microaggregates), and < 0.053 mm (silt+clay size
fraction).
Fractionated samples were later combined to make composite samples for each aggregate size
class. Mean weight diameter (MWD = Σ (percentage of sample weight on sieve x the mean
diameter of the size classes) was calculated as an index that characterizes the structure of the
whole soil (Six et al., 2000 b).
5.2.5. Soil Organic Matter and Particulate Organic Matter
Samples of whole soil and separated aggregates were air-dried and ground to pass a 250 μm sieve
for total carbon and nitrogen analysis in a LECO CNS 2000 autoanalyzer (LECO Corporation,
MI, USA).
Soil organic matter (SOM) was also fractionated in particulate organic matter (POM) in both
whole soil and soil aggregates. POM was defined as the organic matter in soil of size greater than
53 μm, and was determined according to the method of Cambardella and Elliot (1992) and
modified by Marriott and Wander (2006). Briefly, 10 grams of whole soil and soil aggregates
were dispersed with sodium hexametaphosphate (50 g L-1) in a reciprocal shaker at 180 rpm for 6
hours, after which the solution was passed through a 53 μm sieve and rinsed with distilled water
until a clear solution was obtained. The mixture of sand and POM was dried in an oven at 50 ºC
for 48 hours and the associated C and N determined in a LECO CNS 2000 analyser after the
mixture was ground to pass a 250 µm sieve.
ESTRUCTURA Y DINÁMICA DE LA MATERIA ORGÁNICA DEL SUELO EN ECOSISTEMAS FORESTALES TEMPLADOS…
116
The sand content (> 53 μm) of whole soil and aggregate fractions was determined and all carbon
and nitrogen contents were expressed as sand-free carbon or nitrogen (Six et al., 2002).
5.2.6. Mineralizable C and N
Mineralizable C and N were determined in the five macroaggregate classes, representing between
95 and 99 % of the whole soil, by use of an alkali absorption technique (incubation for 28 days at
30 ºC). Ten grams of each aggregate fraction (moistened with distilled water until two thirds of
field capacity) were placed in 250 ml beakers and incubated in the dark. The CO2 evolved was
trapped in 10 ml 0.2 N NaOH and determined on days 1, 2, 3, 8, 14, 22 and 28 by titration with
0.1 N HCl to the phenolphthalein endpoint, after precipitation of carbonates with BaCl2. Basal
respiration rate (BR) was expressed as microbial respiration rate at the end of incubation period
(μg C-CO2 g aggregate-1 h-1). Inorganic soil N (NH4+ and NO3
-) was determined at the
commencement and end of the incubation after extraction of 10 g of aggregate with 50 ml 2M
KCl and posterior analysis with a flow injection autoanalyser (Alpkem, MD, USA). Mineralizable
N (Nmin) was calculated as the difference between N contents before and after the incubation
period and expressed as mg Nmin kg aggregate-1.
5.2.7. Microbial biomass carbon
Microbial biomass carbon was determined for the whole soil and for the three smallest
macroaggregate sizes (5-10, 5-2, and 2.0-0.25 mm). It was determined by fumigation-extraction
method (Vance et al., 1987). Ten grams of moist whole soil and aggregate fraction were
fumigated with alcohol-free chloroform for 48 h in an evacuated dessicator. Fumigated and non-
fumigated samples were extracted with 40 ml 0.5 M K2SO4 and shaken for 1 h on a reciprocal
shaker. The extracts were filtered using Whatman nº 42 papers and maintained frozen at -20ºC
until analysis. Extractable C was determined by oxidation with chromic acid and colorimetric
determination. Microbial biomass carbon (MBc) was calculated as the difference between
fumigated and non-fumigated samples divided by K2SO4 extract efficiency factor for microbial C
(kc = 0.379, Vance et al., 1987).
5.2.8. Statistical analyses
Statistical analyses performed to show differences among stands and aggregate fractions within a
stand were carried out with Statview 5.0 (SAS, 1998). Variables were tested for normality and
Levene´s test for homogeneity of variances prior to one-way analysis of variance (ANOVA), and
a protected least-significant difference (PLSD) test was used to determine the significance of the
main effects determined by ANOVA. These statistical analyses were performed to gain a deeper
5. SOIL ORGANIC MATTER IN SOIL PHYSICAL FRACTIONS IN ADJACENT SEMINATURAL AND CULTIVATED FORESTS IN THE BASQUE COUNTRY
117
insight into the data structure. Nevertheless, because of the inherent large variability usually found
in forest ecosystems and the lack of stand replicates, statistical analyses were used to show trends
in change among the studied stands rather than to draw absolute conclusions about the effects of
species change or mechanical operations on soil. As such, significant differences at P< 0.10 were
also considered (Six et al., 2002).
Reduced major axis regressions between different organic matter fractions were used to gain an
insight into the relationships. PAST software was used for this purpose (Hammer et al., 2001).
5.3. Results
5.3.1. Distribution of soil aggregate fractions
The aggregate fractions obtained by dry-sieving in mature stands (oak, beech and pine 40ys)
consisted mainly of megaaggregates (82-92 %), mixed with relatively small amounts of
macroaggregates and microaggregates. In contrast, a drastic decrease in megaaggregates and a
simultaneous increase in macroaggregates + microaggregates were observed in the recently
established pine 3ys stand (Table 5.2). Macro and microaggregates represented 48 % of the whole
soil in pine 3ys. In pines 16ys and 40ys these aggregates made up 18-21 % of the total.
These differences in aggregate distribution also induced changes in mean weight diameter
(MWD) for the effect of tree species (F= 7.27, P < 0.05) and time since perturbation (F= 25.07, P
< 0.0001). Both seminatural stands (oak and beech) showed significantly higher MWD than pine
40ys stand. Among Pinus radiata plantations, the pine3 stand showed the significantly smallest
MWD while pine 16ys showed similar MWD to that observed in mature pine stand (Table 5.2).
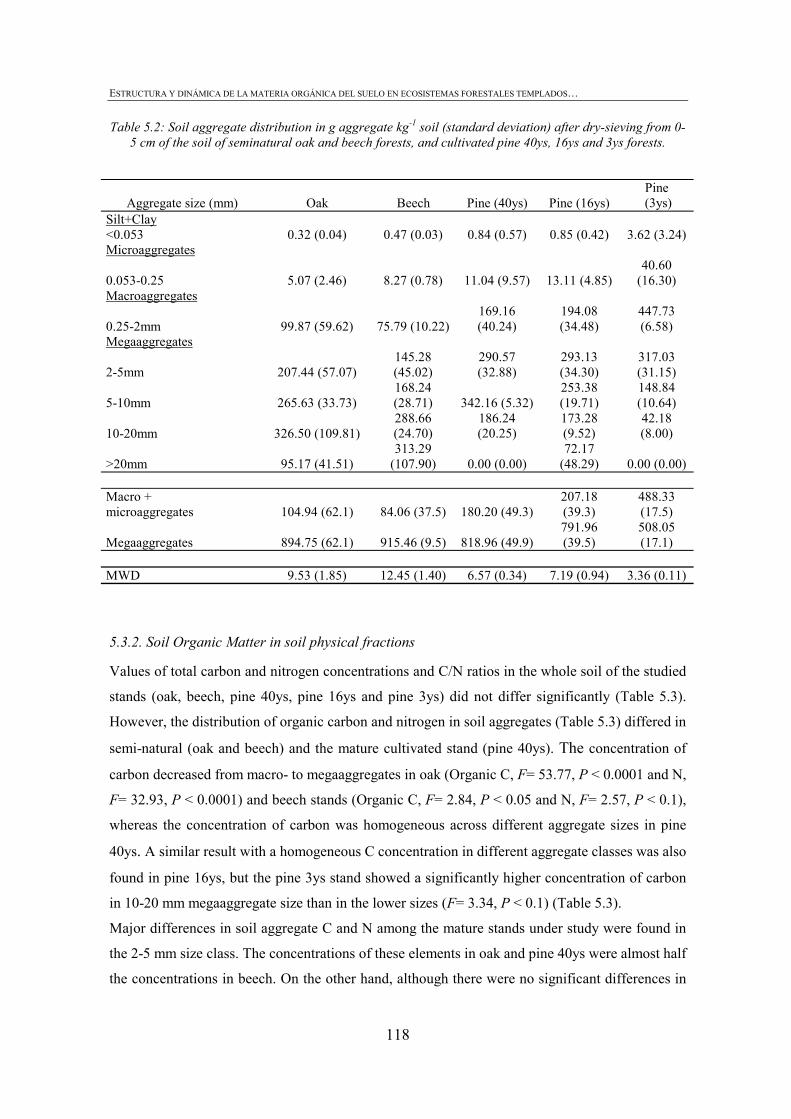
ESTRUCTURA Y DINÁMICA DE LA MATERIA ORGÁNICA DEL SUELO EN ECOSISTEMAS FORESTALES TEMPLADOS…
118
Table 5.2: Soil aggregate distribution in g aggregate kg-1 soil (standard deviation) after dry-sieving from 0-5 cm of the soil of seminatural oak and beech forests, and cultivated pine 40ys, 16ys and 3ys forests.
5.3.2. Soil Organic Matter in soil physical fractions
Values of total carbon and nitrogen concentrations and C/N ratios in the whole soil of the studied
stands (oak, beech, pine 40ys, pine 16ys and pine 3ys) did not differ significantly (Table 5.3).
However, the distribution of organic carbon and nitrogen in soil aggregates (Table 5.3) differed in
semi-natural (oak and beech) and the mature cultivated stand (pine 40ys). The concentration of
carbon decreased from macro- to megaaggregates in oak (Organic C, F= 53.77, P < 0.0001 and N,
F= 32.93, P < 0.0001) and beech stands (Organic C, F= 2.84, P < 0.05 and N, F= 2.57, P < 0.1),
whereas the concentration of carbon was homogeneous across different aggregate sizes in pine
40ys. A similar result with a homogeneous C concentration in different aggregate classes was also
found in pine 16ys, but the pine 3ys stand showed a significantly higher concentration of carbon
in 10-20 mm megaaggregate size than in the lower sizes (F= 3.34, P < 0.1) (Table 5.3).
Major differences in soil aggregate C and N among the mature stands under study were found in
the 2-5 mm size class. The concentrations of these elements in oak and pine 40ys were almost half
the concentrations in beech. On the other hand, although there were no significant differences in
Aggregate size (mm) Oak Beech Pine (40ys) Pine (16ys) Pine
(3ys) Silt+Clay <0.053 0.32 (0.04) 0.47 (0.03) 0.84 (0.57) 0.85 (0.42) 3.62 (3.24) Microaggregates
0.053-0.25 5.07 (2.46) 8.27 (0.78) 11.04 (9.57) 13.11 (4.85) 40.60
(16.30) Macroaggregates
0.25-2mm 99.87 (59.62) 75.79 (10.22)169.16 (40.24)
194.08 (34.48)
447.73 (6.58)
Megaaggregates
2-5mm 207.44 (57.07) 145.28 (45.02)
290.57 (32.88)
293.13 (34.30)
317.03 (31.15)
5-10mm 265.63 (33.73) 168.24 (28.71) 342.16 (5.32)
253.38 (19.71)
148.84 (10.64)
10-20mm 326.50 (109.81) 288.66 (24.70)
186.24 (20.25)
173.28 (9.52)
42.18 (8.00)
>20mm 95.17 (41.51) 313.29
(107.90) 0.00 (0.00) 72.17
(48.29) 0.00 (0.00) Macro + microaggregates 104.94 (62.1) 84.06 (37.5) 180.20 (49.3)
207.18 (39.3)
488.33 (17.5)
Megaaggregates 894.75 (62.1) 915.46 (9.5) 818.96 (49.9)791.96 (39.5)
508.05 (17.1)
MWD 9.53 (1.85) 12.45 (1.40) 6.57 (0.34) 7.19 (0.94) 3.36 (0.11)

5. SOIL ORGANIC MATTER IN SOIL PHYSICAL FRACTIONS IN ADJACENT SEMINATURAL AND CULTIVATED FORESTS IN THE BASQUE COUNTRY
119
concentrations of C and N in the studied pine stands in any of the aggregate sizes, values of these
parameters in pine 3ys were as much as half of the values in pine 40ys in the macroaggregate size
class.
The ratios of C/N did not differ significantly in the whole soil and soil aggregates (Table 5.3) in
the studied stands, which shows that this may be a very conservative characteristic that may not
be affected by forest species or management intensity.
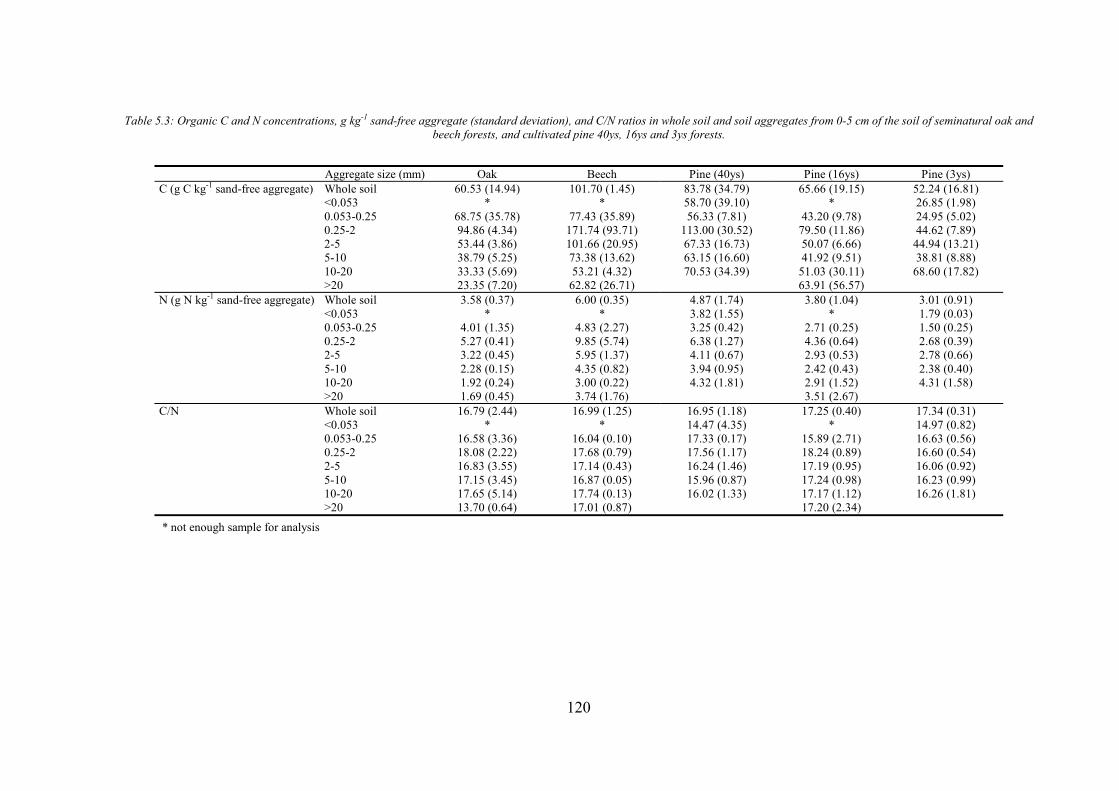
120
Table 5.3: Organic C and N concentrations, g kg-1 sand-free aggregate (standard deviation), and C/N ratios in whole soil and soil aggregates from 0-5 cm of the soil of seminatural oak and beech forests, and cultivated pine 40ys, 16ys and 3ys forests.
Aggregate size (mm) Oak Beech Pine (40ys) Pine (16ys) Pine (3ys) C (g C kg-1 sand-free aggregate) Whole soil 60.53 (14.94) 101.70 (1.45) 83.78 (34.79) 65.66 (19.15) 52.24 (16.81)
<0.053 * * 58.70 (39.10) * 26.85 (1.98) 0.053-0.25 68.75 (35.78) 77.43 (35.89) 56.33 (7.81) 43.20 (9.78) 24.95 (5.02)
0.25-2 94.86 (4.34) 171.74 (93.71) 113.00 (30.52) 79.50 (11.86) 44.62 (7.89) 2-5 53.44 (3.86) 101.66 (20.95) 67.33 (16.73) 50.07 (6.66) 44.94 (13.21) 5-10 38.79 (5.25) 73.38 (13.62) 63.15 (16.60) 41.92 (9.51) 38.81 (8.88) 10-20 33.33 (5.69) 53.21 (4.32) 70.53 (34.39) 51.03 (30.11) 68.60 (17.82) >20 23.35 (7.20) 62.82 (26.71) 63.91 (56.57)
N (g N kg-1 sand-free aggregate) Whole soil 3.58 (0.37) 6.00 (0.35) 4.87 (1.74) 3.80 (1.04) 3.01 (0.91) <0.053 * * 3.82 (1.55) * 1.79 (0.03)
0.053-0.25 4.01 (1.35) 4.83 (2.27) 3.25 (0.42) 2.71 (0.25) 1.50 (0.25) 0.25-2 5.27 (0.41) 9.85 (5.74) 6.38 (1.27) 4.36 (0.64) 2.68 (0.39) 2-5 3.22 (0.45) 5.95 (1.37) 4.11 (0.67) 2.93 (0.53) 2.78 (0.66) 5-10 2.28 (0.15) 4.35 (0.82) 3.94 (0.95) 2.42 (0.43) 2.38 (0.40) 10-20 1.92 (0.24) 3.00 (0.22) 4.32 (1.81) 2.91 (1.52) 4.31 (1.58) >20 1.69 (0.45) 3.74 (1.76) 3.51 (2.67)
C/N Whole soil 16.79 (2.44) 16.99 (1.25) 16.95 (1.18) 17.25 (0.40) 17.34 (0.31) <0.053 * * 14.47 (4.35) * 14.97 (0.82) 0.053-0.25 16.58 (3.36) 16.04 (0.10) 17.33 (0.17) 15.89 (2.71) 16.63 (0.56)
0.25-2 18.08 (2.22) 17.68 (0.79) 17.56 (1.17) 18.24 (0.89) 16.60 (0.54) 2-5 16.83 (3.55) 17.14 (0.43) 16.24 (1.46) 17.19 (0.95) 16.06 (0.92) 5-10 17.15 (3.45) 16.87 (0.05) 15.96 (0.87) 17.24 (0.98) 16.23 (0.99) 10-20 17.65 (5.14) 17.74 (0.13) 16.02 (1.33) 17.17 (1.12) 16.26 (1.81)
>20 13.70 (0.64) 17.01 (0.87) 17.20 (2.34)
* not enough sample for analysis
5. SOIL ORGANIC MATTER IN SOIL PHYSICAL FRACTIONS IN ADJACENT SEMINATURAL AND CULTIVATED FORESTS IN THE BASQUE COUNTRY
121
5.3.3. Particulate Organic Matter in soil physical fractions
The quantity of POM-C in the whole soil sample amounted to 17-22 % of the total organic carbon
in mature stands (Table 5.4). This parameter was reduced to 14 % in pine 16ys and to 5 % of the
total organic carbon in pine 3ys stand, which was significantly lower than that observed in mature
pine (F= 12.54, P < 0.05). The percentage of POM-N from total N showed a similar pattern. The
POM-N fraction amounted to 15 % of total N in oak stand and 13 % in beech and pine 40ys stand.
POM-N fraction represented 8 % of the total N in pine 16ys stand and it was reduced
significantly, to 2 %, in pine 3ys stand (F= 9.54, P < 0.05). The C/N ratio of POM fraction, which
is usually considered as an indicator of the quality of this fraction, did not differ significantly
among mature stands. On the other hand, this parameter increased significantly in the plantations
in which soil disturbance took place (F= 45.89, P < 0.001) (Table 5.4), with the highest value in
pine 3ys and an intermediate value in pine 16ys.
The importance of POM fraction in soil aggregation was reflected in the significant exponential
relationship between MWD and mg POM-C g-1 C total (R2 = 0.68, P < 0.05).
The concentrations of POM-C and POM-N were significantly higher in aggregates of 0.25-2 mm
than in the rest of aggregate sizes in all mature stands (Oak, POM-C F= 7.07, P < 0.05 and POM-
N F= 6.13, P < 0.05), (Beech, POM-C F= 3.45, P < 0.1 and POM-N F= 2.58, P < 0.1), (Pine 40ys,
POM-C F= 3.30, P < 0.1 and POM-N F= 2.61, P = 0.1). Although the concentrations were lower
in the pine 16ys stand, the trend was the same as in the mature stands, with the highest
concentrations of POM-C and POM-N in the macroaggregates (POM-C F= 10.64, P < 0.01 and
POM-N F= 8.24, P < 0.01). In contrast, a homogeneous distribution POM was observed across all
aggregate sizes in pine 3ys stand (Table 5.4).
Oak, beech and mature pine stands did not differ significantly in terms of the C-POM and POM-N
in any aggregate size class (Table 5.4). However, concentrations of POM-C and POM-N were
higher in the pine 40ys stand than in younger and disturbed stands, in the macroaggregate size
class (0.25-2 mm) (POM-C, F= 8.38, P < 0.05 and POM-N, F= 8.80, P < 0.05). Finally, as
observed in whole soil samples, the C/N ratios of POM in each aggregate size class in pine 40ys
differed significantly from the C/N ratio present in pine 16ys and pine 3ys (Table 5.4).
5.3.4. Mineralizable C and N and microbial biomass C in soil physical fractions
A high variance was encountered in all studied microbial parameters, mainly in microbial biomass
carbon in soil physical fractions. This caused non-significant differences, despite huge differences
in mean values (Table 5.5). Therefore, the methodological approach for determining microbial
ESTRUCTURA Y DINÁMICA DE LA MATERIA ORGÁNICA DEL SUELO EN ECOSISTEMAS FORESTALES TEMPLADOS…
122
biomass carbon in soil aggregates should be improved due to the difficulties related to working
with undisturbed soil fractions, and more replicates are recommended. However, some
statistically significant differences were found in mineralizable C and N.
Basal respiration rates were significantly higher in the macroaggregates (0.25-2 mm) than in the
megaaggregates (> 2 mm) in all mature stands (Oak, F= 4.03, P < 0.05; Beech, F= 3.95, P < 0.05
and Pine 40ys, F= 4.36, P < 0.05), but there were no significant difference among tree species.
Conversely, homogeneous Cmin rates were observed across all aggregate sizes in the two soils
under younger stands subjected to mechanical site preparation (pine 16ys and pine 3ys).
Nevertheless, the intensive mechanization in the recently established plantation (pine 3ys)
significantly reduced the mineralizable C relative to pine 40ys (F= 7.83, P < 0.05) (Table 5.5).
In a similar way, mineralizable N differed significantly among different aggregate size classes in
semi-natural mature forests. Mineralizable N tended to be reciprocally related to the aggregate
size in oak and beech stands (Oak, F= 4.57, P < 0.05 and Beech, F= 4.74, P < 0.05); however, in
pine 40ys, a the value of Nmin was homogeneous across all aggregate sizes. Similarly, there were
no significant differences in Nmin among aggregate sizes in younger and disturbed stands.
Although the dynamics observed in all studied pine stands was similar, pine 3ys showed lower
mineralization of N than pine 40ys in the macroaggregate size class and in the 5-10 mm size class.
Pine16ys again showed an intermediate value, suggesting that mechanization may also reduce the
amount of mineralizable N and showing a trend towards recovery with time, but that 16 years may
not be sufficient time (Table 5.5).
The metabolic quotient (qCO2) showed similar trends in all stands except the pine 3ys stand. The
qCO2 values were higher in aggregates of size 0.25-2 mm than in larger aggregates. This trend
was significant in oak stand (F= 3.79, P < 0.05). On the other hand, qCO2 values were lower in
pine 3ys than in pine 40ys in all size classes, which shows that mechanization may tend to
increase the efficiency in C use in all aggregate sizes (Table 5.5).
The microbial parameters studied were significantly related to soil organic matter fractions.
Mineralizable C was significantly and positively related to POM-C (r = 0.85, P < 0.0001), and
mineralizable N was also significantly (although less so) related to POM-N (r=0.37 P < 0.01) and
basal respiration (r= 0.39 P < 0.01).
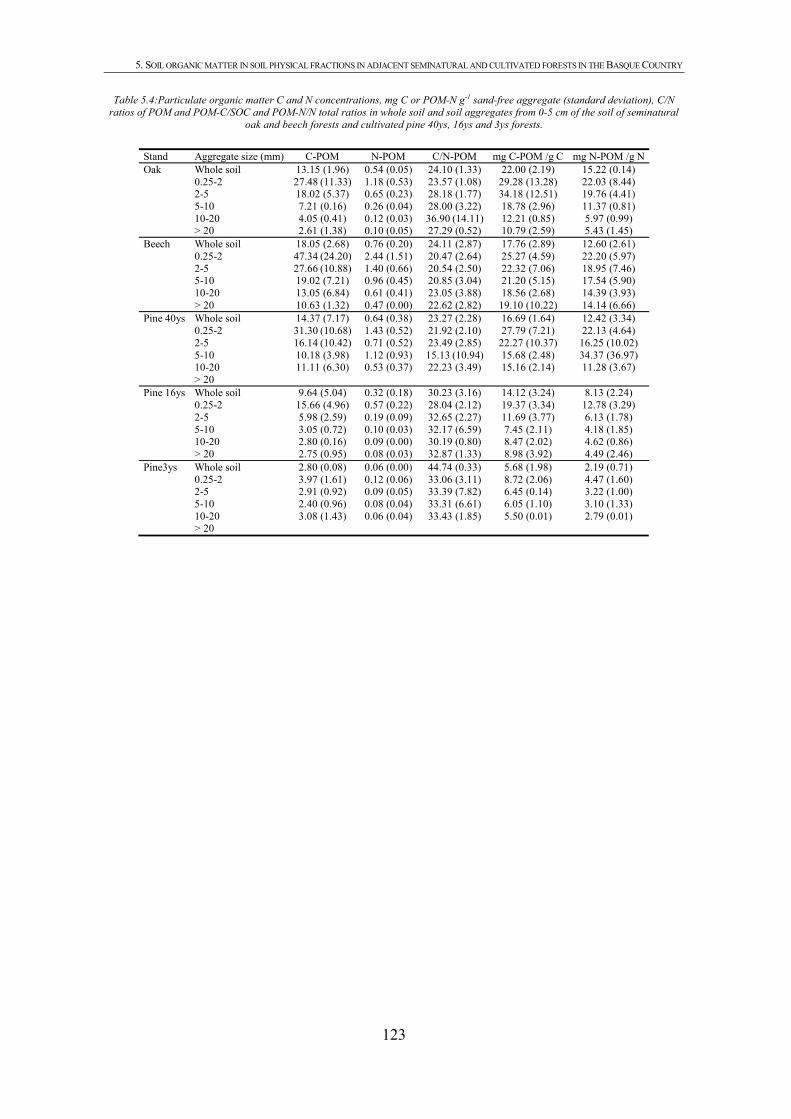
5. SOIL ORGANIC MATTER IN SOIL PHYSICAL FRACTIONS IN ADJACENT SEMINATURAL AND CULTIVATED FORESTS IN THE BASQUE COUNTRY
123
Table 5.4:Particulate organic matter C and N concentrations, mg C or POM-N g-1 sand-free aggregate (standard deviation), C/N ratios of POM and POM-C/SOC and POM-N/N total ratios in whole soil and soil aggregates from 0-5 cm of the soil of seminatural
oak and beech forests and cultivated pine 40ys, 16ys and 3ys forests.
Stand Aggregate size (mm) C-POM N-POM C/N-POM mg C-POM /g C mg N-POM /g N Oak Whole soil 13.15 (1.96) 0.54 (0.05) 24.10 (1.33) 22.00 (2.19) 15.22 (0.14) 0.25-2 27.48 (11.33) 1.18 (0.53) 23.57 (1.08) 29.28 (13.28) 22.03 (8.44) 2-5 18.02 (5.37) 0.65 (0.23) 28.18 (1.77) 34.18 (12.51) 19.76 (4.41) 5-10 7.21 (0.16) 0.26 (0.04) 28.00 (3.22) 18.78 (2.96) 11.37 (0.81) 10-20 4.05 (0.41) 0.12 (0.03) 36.90 (14.11) 12.21 (0.85) 5.97 (0.99) > 20 2.61 (1.38) 0.10 (0.05) 27.29 (0.52) 10.79 (2.59) 5.43 (1.45) Beech Whole soil 18.05 (2.68) 0.76 (0.20) 24.11 (2.87) 17.76 (2.89) 12.60 (2.61) 0.25-2 47.34 (24.20) 2.44 (1.51) 20.47 (2.64) 25.27 (4.59) 22.20 (5.97) 2-5 27.66 (10.88) 1.40 (0.66) 20.54 (2.50) 22.32 (7.06) 18.95 (7.46) 5-10 19.02 (7.21) 0.96 (0.45) 20.85 (3.04) 21.20 (5.15) 17.54 (5.90) 10-20 13.05 (6.84) 0.61 (0.41) 23.05 (3.88) 18.56 (2.68) 14.39 (3.93) > 20 10.63 (1.32) 0.47 (0.00) 22.62 (2.82) 19.10 (10.22) 14.14 (6.66) Pine 40ys Whole soil 14.37 (7.17) 0.64 (0.38) 23.27 (2.28) 16.69 (1.64) 12.42 (3.34) 0.25-2 31.30 (10.68) 1.43 (0.52) 21.92 (2.10) 27.79 (7.21) 22.13 (4.64) 2-5 16.14 (10.42) 0.71 (0.52) 23.49 (2.85) 22.27 (10.37) 16.25 (10.02) 5-10 10.18 (3.98) 1.12 (0.93) 15.13 (10.94) 15.68 (2.48) 34.37 (36.97) 10-20 11.11 (6.30) 0.53 (0.37) 22.23 (3.49) 15.16 (2.14) 11.28 (3.67) > 20 Pine 16ys Whole soil 9.64 (5.04) 0.32 (0.18) 30.23 (3.16) 14.12 (3.24) 8.13 (2.24) 0.25-2 15.66 (4.96) 0.57 (0.22) 28.04 (2.12) 19.37 (3.34) 12.78 (3.29) 2-5 5.98 (2.59) 0.19 (0.09) 32.65 (2.27) 11.69 (3.77) 6.13 (1.78) 5-10 3.05 (0.72) 0.10 (0.03) 32.17 (6.59) 7.45 (2.11) 4.18 (1.85) 10-20 2.80 (0.16) 0.09 (0.00) 30.19 (0.80) 8.47 (2.02) 4.62 (0.86) > 20 2.75 (0.95) 0.08 (0.03) 32.87 (1.33) 8.98 (3.92) 4.49 (2.46) Pine3ys Whole soil 2.80 (0.08) 0.06 (0.00) 44.74 (0.33) 5.68 (1.98) 2.19 (0.71) 0.25-2 3.97 (1.61) 0.12 (0.06) 33.06 (3.11) 8.72 (2.06) 4.47 (1.60) 2-5 2.91 (0.92) 0.09 (0.05) 33.39 (7.82) 6.45 (0.14) 3.22 (1.00) 5-10 2.40 (0.96) 0.08 (0.04) 33.31 (6.61) 6.05 (1.10) 3.10 (1.33) 10-20 3.08 (1.43) 0.06 (0.04) 33.43 (1.85) 5.50 (0.01) 2.79 (0.01) > 20
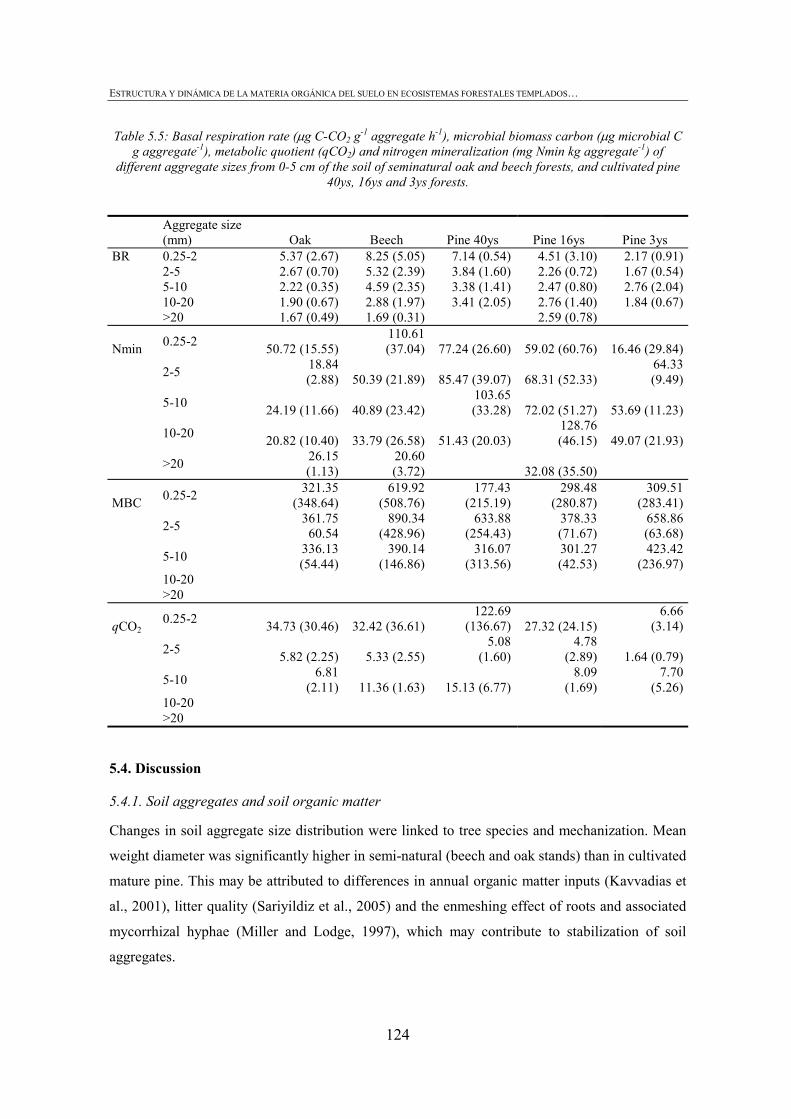
ESTRUCTURA Y DINÁMICA DE LA MATERIA ORGÁNICA DEL SUELO EN ECOSISTEMAS FORESTALES TEMPLADOS…
124
Table 5.5: Basal respiration rate (μg C-CO2 g-1 aggregate h-1), microbial biomass carbon (μg microbial C g aggregate-1), metabolic quotient (qCO2) and nitrogen mineralization (mg Nmin kg aggregate-1) of
different aggregate sizes from 0-5 cm of the soil of seminatural oak and beech forests, and cultivated pine 40ys, 16ys and 3ys forests.
5.4. Discussion
5.4.1. Soil aggregates and soil organic matter
Changes in soil aggregate size distribution were linked to tree species and mechanization. Mean
weight diameter was significantly higher in semi-natural (beech and oak stands) than in cultivated
mature pine. This may be attributed to differences in annual organic matter inputs (Kavvadias et
al., 2001), litter quality (Sariyildiz et al., 2005) and the enmeshing effect of roots and associated
mycorrhizal hyphae (Miller and Lodge, 1997), which may contribute to stabilization of soil
aggregates.
Aggregate size (mm) Oak Beech Pine 40ys Pine 16ys Pine 3ys
BR 0.25-2 5.37 (2.67) 8.25 (5.05) 7.14 (0.54) 4.51 (3.10) 2.17 (0.91) 2-5 2.67 (0.70) 5.32 (2.39) 3.84 (1.60) 2.26 (0.72) 1.67 (0.54) 5-10 2.22 (0.35) 4.59 (2.35) 3.38 (1.41) 2.47 (0.80) 2.76 (2.04) 10-20 1.90 (0.67) 2.88 (1.97) 3.41 (2.05) 2.76 (1.40) 1.84 (0.67) >20 1.67 (0.49) 1.69 (0.31) 2.59 (0.78)
Nmin 0.25-2 50.72 (15.55)110.61 (37.04) 77.24 (26.60) 59.02 (60.76) 16.46 (29.84)
2-5 18.84 (2.88) 50.39 (21.89) 85.47 (39.07) 68.31 (52.33)
64.33 (9.49)
5-10 24.19 (11.66) 40.89 (23.42)103.65 (33.28) 72.02 (51.27) 53.69 (11.23)
10-20 20.82 (10.40) 33.79 (26.58) 51.43 (20.03)128.76 (46.15) 49.07 (21.93)
>20 26.15 (1.13)
20.60 (3.72) 32.08 (35.50)
MBC 0.25-2 321.35 (348.64)
619.92 (508.76)
177.43(215.19)
298.48 (280.87)
309.51 (283.41)
2-5 361.7560.54
890.34 (428.96)
633.88(254.43)
378.33 (71.67)
658.86 (63.68)
5-10 336.13(54.44)
390.14 (146.86)
316.07 (313.56)
301.27 (42.53)
423.42 (236.97)
10-20 >20
qCO2 0.25-2 34.73 (30.46) 32.42 (36.61)
122.69 (136.67) 27.32 (24.15)
6.66 (3.14)
2-5 5.82 (2.25) 5.33 (2.55)5.08
(1.60)4.78
(2.89) 1.64 (0.79)
5-10 6.81 (2.11) 11.36 (1.63) 15.13 (6.77)
8.09 (1.69)
7.70 (5.26)
10-20 >20
5. SOIL ORGANIC MATTER IN SOIL PHYSICAL FRACTIONS IN ADJACENT SEMINATURAL AND CULTIVATED FORESTS IN THE BASQUE COUNTRY
125
Mechanization reduced the amount of soil in megaaggregate size classes and significantly
increased the amount of macroaggregates and microaggregates in the recently established stand.
However, in contrast to findings in agricultural soils (Grandy and Robertson, 2006; De Gryze et
al., 2004), 16 years after disturbance the soil physical structure represented by the mean weight
diameter was similar to that in mature stands.
Differences in total carbon and nitrogen due to changes in tree species and mechanical site
preparation were not detected in the whole soil, because of the relatively high background levels
of soil C (Bossuyt et al., 2002) and because site had a greater influence on soil C stocks than tree
species (Ladegaard-Pedersen et al., 2005). As regards SOM loss following mechanical site
preparation, the data obtained from prior studies in temperate ecosystems was inconclusive. For
example, Oliver et al. (2004), found a significant reduction in the concentrations of soil C in the
first 10 cm of Pinus radiata plantations in which a bulldozer and excavator were used after
harvesting, however, Piatek et al. (2003) did not find any significant effects on soil organic C and
N in scarified plots of Douglas fir in which mineral soil was exposed by a bulldozer with a blade.
Despite the lack of change in total soil C and N, the POM fraction was significantly affected by
mechanical site preparation in Pinus radiata cultivated forests. Mechanization was also found by
Mubarak et al. (2005) to have such an effect. Reduction of the POM-C fraction induced by
mechanical site preparation may also affect the aggregate size distribution, because this physically
uncomplexed OM is highly susceptible to breakdown when the soil is disturbed at a very rapid
turn-over rate (Henderson et al., 2004; Baisden et al., 2002).
The functional role of POM-C fraction in soil aggregation was reflected in this study by the
relationship between MWD and POM-C:SOM. Pikul et al. (2007) also found a relationship
between aggregation and fine POM-C:SOM. The latter authors concluded, in a similar way as
Gale et al. (2000b), that in undisturbed soils, POM is derived primarily from roots, and that new
microaggregates are formed around decomposing pieces of POM inside macroaggregates.
5.4.2. Soil aggregate C and dynamics
The concentrations of SOC did not increase with increasing aggregate size class in any of the
studied forests, except in the pine3ys stand. It appears that the concept of aggregate hierarchy
proposed for agricultural soils according to which microaggregates are bound together into
macroaggregates by transient binding agents (Tisdall and Oades, 1982), only occurred in the
recently mechanized stand. Mechanization in this stand may produce similar effects to those
undergone in agricultural soils. Harvesting and mechanical site preparation induce more intense
ESTRUCTURA Y DINÁMICA DE LA MATERIA ORGÁNICA DEL SUELO EN ECOSISTEMAS FORESTALES TEMPLADOS…
126
soil disturbance than agricultural practices, but each of these occurs only once in the rotation
period while the disturbance induced by agricultural practices is repeated every year.
The aggregation in mature forest soils may be linked to the POM fraction, as reflected by higher
concentrations of POM-C in macroaggregates and lower C:N ratios in this POM fraction.
Decomposition of POM is thought to release microbial exudates that stabilize macroaggregates
(Oades, 1984, Six et al., 2000a) and, in this way, new microaggregates are formed inside the
existing macroaggregates (Gale et al., 2000b). The significant relationships found in the present
study between (i) POM-C and respired CO2 and (ii) POM-N and mineralized N suggest that
biological activity was more intense in this POM fraction than in any other one. Magid and
Kjaegaard (2001) reached the same conclusion, with results similar to present ones. Moreover, it
must be remembered that the POM fraction is the fraction most affected by mechanization.
In mature forests, macroaggregates (0.25-2 mm) showed higher rates of soil respiration, metabolic
quotients and nitrogen mineralization (not in pine 40ys) than megaaggregates. In less disturbed
ecosystems, the organic matter within macroaggregates may be the free light POM fraction
(Cambardella and Elliot, 1993) and these macroaggregates may be of special interest in aggregate
dynamics. However, in more disturbed ecosystems (pine 16ys and pine 3ys), the significant loss
of this fraction may alter the aggregate dynamics, because the same trends were not detected in
these stands.
5.5. Conclusions
In temperate forest ecosystems, there are certain problems related to the cultivation of rapidly
growing exotic species and intensive forest management with mechanized methods. Importantly,
the present results show that indicators for sustainable forest management related to soil organic
matter should not only be assessed in terms of total C stocks but also with respect to organic
matter composition and stability.
The consistent relationship between POM-C:SOM of the whole soil and MWD led us to conclude
that aggregate formation may be directly related to POM dynamics in these forest soils,
independently of tree species. Because POM has been shown to be a labile fraction of SOM
(relationship with soil respiration and nitrogen mineralization), an effort should be made to
conserve this OM pool in sustainable forest management in order to maintain long-term
ecosystem functioning.
The intensive mechanization during establishment of Pinus radiata plantations resulted in
physical disruption of soil structure and a significant reduction in the POM fraction in the top 5
5. SOIL ORGANIC MATTER IN SOIL PHYSICAL FRACTIONS IN ADJACENT SEMINATURAL AND CULTIVATED FORESTS IN THE BASQUE COUNTRY
127
cm of soil. Although the MWD and the amounts of POM had recovered 16 years after
disturbance, the quality of POM fraction was still significantly different.
Finally, it appears that macroaggregates (0.25-2 mm) may play an important role in aggregate
dynamics in mature forests, independently of tree species.
Acknowledgements
Funding for this study was provided by European Union ERDF-INTERREG IIIB Atlantic Area
and the Department of Agriculture, Fisheries and Food of the Basque Country. We also thank the
University of the Basque Country for supporting us with computer facilities and software
packages and Dr. Christine Francis for revising the English of the manuscript.
5.6. References
AOAC, 1980. Official methods of analysis of the Association of Official Analytical Chemists. In:
W. Harwitte (ed.), 13th ed. Washington DC, USA.
Ashagrie, Y., Zech, W., Guggenberger, G., Mamo, T., 2007. Soil aggregation, and total and
particulate organic matter following conversion of native forests to continuous cultivation in
Ethiopia. Soil and Tillage Research 94 (1), 101-108
Baisden W.T., Amundson, R., Cook, A.C., Brenner, D.L., 2002. Turnover and storage of C and N in
five density fractions from California annual grassland surface soils. Global Biogeochemical
Cycles 16, 1117
Binkley, D., 1995. The influence of tree species on forest soils: processes and patterns. in: Mead
D.J. and Cornforth, I.S. (Eds.), Proceedings of the Trees and Soil Workshop, Canterbury, New
Zealand, 28 Feb-2 Mar, 1994. Lincoln University Press, Canterbury, New Zealand, pp. 1-33
Bossuyt, H., Six, J., Hendrix, P.F., 2002. Aggregate-protected carbon in no-tillage and conventional
tillage agroecosystems using carbon-14 labeled plant residue. Soil Science Society of America
Journal 66, 1965-1973
Bronick, C.J., Lal., R., 2005. Soil structure and management: a review. Geoderma 124, 3-22
Cambardella, C.A., Elliot, E.T., 1992. Particulate soil organic matter changes across a grassland
cultivation sequence. Soil Science Society of America Journal 56, 777-783
Cambardella, C.A., Elliot, E.T., 1993. Carbon and nitrogen distribution in aggregates from
cultivated and grassland soils. Soil Science Society of America Journal 57, 1071-1076
Chan, K.Y., Heenan, D.P., 1999b. Microbial-induced soil aggregate stability under different crop
rotations. Biology and Fertility of Soils 30, 29-32
ESTRUCTURA Y DINÁMICA DE LA MATERIA ORGÁNICA DEL SUELO EN ECOSISTEMAS FORESTALES TEMPLADOS…
128
Christensen, B.T., 2001. Physical fractionation of soil and structural and functional complexity in
organic matter turnover. European Journal of Soil Science 52, 345-353
De Gryze, S., Six, J., Paustian, K., Morris, S.J., Paul, E.A., Merckx, R.. 2004. Soil organic carbon
pool changes following land-use conversions. Global Change Biology 10, 1120–1132
Gale, W.J., Cambardella, C.A., Bailey, T.B., 2000b. Root-derived carbon and the formation and
stabilization of aggregates. Soil Science Society of America Journal 67, 201-207
González-Arias, A., Martínez de Arano, I., Bárcena-Ruíz, M.J., Besga, G. and Onaindia, M., 2006.
Origin of atmospheric deposition and canopy buffering capacity in stands of radiata pine and
pedunculate oak in the Basque Country. Forest Ecology and Management 229, 268-284
Grandy, A.S., Robertson, G.P., 2006. Land use intensity effects on soil C accumulation rates and
mechanisms. Ecosystems 10, 59-74
Hammer, Ø., Harper, D.A.T., and P. D. Ryan, 2001. PAST: Paleontological Statistics Software
Package for Education and Data Analysis. Palaeontologia Electronica 4(1): 9pp. http://palaeo-
electronica.org/2001_1/past/issue1_01.htm
Henderson, D.C., Ellert, B.H., Naeth, M.A., 2004. Utility of 13C for ecosystem carbon turnover
estimation in grazed mixed grass prairie. Geoderma 119, 219–231
Horn, R., Vossbrink, J., Becker, S., 2004. Modern forestry vehicles and theirs impacts on soil
physical properties. Soil and Tillage Research 79, 207-219
IPCC, 2000. Land Use, Land Use Change and Forestry. Special Report, Inter-Governmental Panel
on Climate Change. Cambridge University Press, Cambridge, UK, pp. 127–180
Kavvadias, V.A., Alifragis, D., Tsiontsis, A., Brofas, G., Stamatelos, G., 2001. Litterfall, litter
accumulation and litter decomposition rates in four forest ecosystems in northern Greece.
Forest Ecology and Management 144, 113-127.
Ladegaard-Pedersen, P., Elberling, B., Vesterdal, L., 2005. Soil carbon stocks, mineralization rates,
and CO2 effluxes under 10 tree species on contrasting soil types. Canadian Journal of Forest
Research 35, 1277-1284
Lavery, P.B., Mead, D.J., 1998. Pinus radiata: a narrow endemic from North America takes on the
world. In: Richardson, D.M. (Ed.), Ecology and Biogeography of Pinus. Cambridge University
Press, Cambridge, pp. 432–449
Leckie, S.E., Prescott, C.E., Grayston, S.J., 2004. Forest floor microbial community response to tree
species and fertilization of regenerating coniferous forests. Canadian Journal of Forest
Research 34, 1426-1435
5. SOIL ORGANIC MATTER IN SOIL PHYSICAL FRACTIONS IN ADJACENT SEMINATURAL AND CULTIVATED FORESTS IN THE BASQUE COUNTRY
129
Liao, J.D., Boutton, T.W., Jastrow, J.D., 2006. Storage and dynamics of carbon and nitrogen in soil
physical fractions following woody plant invasion of grassland. Soil Biology & Biochemistry
38, 3184-3196
Magid, J., and C. Kjærgaard. 2001. Recovering decomposing plant residues from the particulate soil
organic matter fraction: Size versus density separation. Biology and Fertility of Soils 33, 252–
257
Marriott, E.E., Wander, M., 2006. Qualitative and quantitative differences in particulate organic
matter fractions in organic and conventional farming systems. Soil Biology and Biochemistry
38, 1527-1536
Merino, A., Fernández-López, A., Solla-Gullón, F., Edeso, J.M., 2004. Soil changes and tree growth
in intensively managed Pinus radiata in northern Spain. Forest Ecology and Management 196,
393-404
Miller, R.M., Lodge, J.D., 1997. The contributions of fungi to agriculture and forestry. In: Wicklow,
D., Soderstrom, B. (eds.) The Mycota, Vol. IV. Springer-Verlag, Berlin. pp. 6584
Mosquera, A.C. 1990. Comparison of indirect methods for the determination of percent
exchangeable aluminum in acid soils of Galicia (NW Spain). Communications in Soil
Science and Plant Analysis 21: 365-375.
Mubarak, A.R., Elshami, O.M.E., Azhari, A.A., 2005. Long- and short-term effects of cultivation on
properties of a Vertisol under sugarcane plantation. Soil and Tillage Research 84, 1-6
Nambiar, E.K.S., 1996. Sustained productivity of forests is a continuing challenge to soil science.
Soil Science Society of America Journal 60, 1629-1642
Oades, J.M., 1984. Soil organic matter and structural stability: mechanisms and implications for
management. Plant and Soil 76, 319-337
Oliver, G.R., Beets, P.N., Garrett, L.G., Pearce, S.H., Kimberly, M.O., Ford-Robertson, J.B.,
Robertson, K.A., 2004. Variation in soil carbon in pine plantations and implications for
monitoring soil carbon stocks in relation to land-use change and forest site management in New
Zealand. Forest Ecology and Management 203, 283-295
Ortubai, A., 1995. Relación clima-vegetación en la Comunidad Autónoma del País vasco. PhD
Thesis nº 27. Departamento de Industria, Agricultura y Pesca. Gobierno Vasco.
Piatek, K.B., Harrington, C.A., DeBell, C.S., 2003. Site preparation effects on 20 year survival and
growth of Douglas-fir (Pseudotsuga menziesii) and on selected soil properties. Western Journal
of Applied Forestry 18, 44-51
ESTRUCTURA Y DINÁMICA DE LA MATERIA ORGÁNICA DEL SUELO EN ECOSISTEMAS FORESTALES TEMPLADOS…
130
Pikul, J.L., Osborne, S., Ellsbury, M., Riedell, W., 2007. Particulate organic matter and water-stable
aggregation of soils under contrasting management. Soil Science Society of America Journal
71, 766-776
Pulleman, M.M., Marinissen, J.C.Y., 2004. Physical protection of mineralizable C in aggregates
from long-term pasture and arable soil. Geoderma 120, 273-282
Sariyildiz, T., Anderson, J.M., kucuk, M., 2005. Effects of tree species and topography on soil
chemistry, litter quality and decomposition in Northeast Turkey. Soil Biology and
Biochemistry 37, 1695-1706
SAS, 1998. SAS/SAT User’s Guide, Version 7. Statistical Analysis System Institute, Cary, NC.
Schutter, M.E., Dick, R.P., 2002. Microbial community profiles and activities among aggregates of
winter fallow and cover-cropped soil. Soil Science Society of America Journal 66, 142-153
Six, J., Bossuyt, H., Degryze, S., Denef, K., 2004. A history of research on the link between
(micro)aggregates, soil biota, and soil organic matter dynamics. Soil and Tillage Research 79,
7-31
Six, J., Jastrow, J.D., 2002. Organic matter turnover. In: Lal, T. (Ed.), Encyclopedia of Soil Science.
Marcell Dekker, New York, pp. 936-942
Six, J., Elliott, E.T., Paustian, K., 2000a. Soil macroaggregate turnover and microaggregate
formation: a mechanism for C sequestration under no-tillage agriculture. Soil Biology and
Biochemistry 32, 2099-2103
Six, J., Paustian, K., Elliott, E.T., Combrink, C., 2000b. Soil structure and organic matter: I.
Distribution of aggregate-size classes and aggregate-associated carbon. Soil Science Society of
America Journal 64, 681-689
Soil Survey Staff (SSS), 2006. Keys to Soil Taxonomy, 10th ed. USDA-Natural Resources
Conservation Service, Washington, DC.
Tisdall, J.M., Oades, J.M., 1982. Organic matter and water-stable aggregates in soils. Journal of Soil
Science 33, 141-163
Vance, E.D., Brookes, P.C., Jenkinson, D.S., 1987. An extraction method for measuring soil
microbial biomass-C. Soil Biology and Biochemistry 19, 703-707
Watanabe F.S. and Olsen S.R. 1965. Test of an ascorbic acid method for determining Phosphorus in
Water and NaHCO3 extracts from soil. Soil Science Society Proceedings. 677-678.
6. Landscape-level patterns of soil microbial community level physiological profiles in temperate forest ecosystems Soil microbial communities govern important biogeochemical processes, including organic matter dynamics, and differences in microbial communities associated with plant species are thought to result from variations in the quantity and quality of carbon inputs. However, landscape-level differences should be considered in forest ecosystems because plant litter can vary widely in its chemical constituents at this scale. Forest ecosystems that differ in tree species (Quercus robur L., Fagus sylvatica L., Quercus ilex L. and Pinus radiata D.Don) were studied in order to evaluate the amount and quality of forest floor and its influence on the function of the soil microbial community over a wide geographical range (the Ibaizabal basin) in the Basque Country. Samples of forest floor and soil (0-30 cm and 30-60 cm) were collected from 42 temperate forests. Forest floor properties were determined, by chemical and proximate analysis, and community-level physiological profiles (CLPP) were constructed by use of a MicroRespTM assay. Canonical variate analysis (CVA) of the forest floor data differentiated holm oak and oak forest floors from beech and pine forest floors, but forest floors from beech and pine could not be distinguished. However, CVA of the CLPP data differentiated microbial communities from both soil depths (0-30 cm compared with 30-60cm) and tree species. CLPP were highly correlated with soil properties related to organic matter, such as carbon, nitrogen, phosphorus and water holding capacity, and soil properties related to parent material, such as calcium concentration.

6. LANDSCAPE-LEVEL PATTERNS OF SOIL MICROBIAL COMMUNITY LEVEL PHYSIOLOGICAL PROFILES IN TEMPERATE FOREST ECOSYSTEMS
133
6.1. Introduction
Soil microbial communities mediate many biogeochemical processes that are central to ecosystem
functioning. Balser and F
irestone (2005) found that although microbial biomass was not affected by soil transplanted from
grassland to a conifer forest ecosystem, characteristics of microbial communities, such as
substrate utilization patterns, were related to soil processes, such as in situ N mineralization.
Griffiths et al. (2000) also found that as soil microbial diversity decreased with intensive
agricultural management practices, nitrification also decreased and decomposition increased.
Therefore, in order to study the soil ecosystem or to observe the impact of human activities on the
ecosystem, it is essential to characterize soil microbial communities.
The Biolog® system of community-level physiological profiling (CLPP) of the microbial
community has been widely used to characterize microbial communities on the basis of a pattern
of substrate utilization in 96-well microtitre plates (Garland and Mills, 1991). The Biolog®
method has been used to characterize microbial communities associated with tilled agricultural
soils (Lupwayi et al., 2001), plant rhizospheres (Grayston et al., 1998) and tree species (Priha et
al., 2001). In fact, Priha et al. (2001) were not able to detect any difference in the function of
microbial communities in forest soils developed under Scots pine, Norway spruce or Silver birch
with the Biolog® system. However, differences in the composition of soil microbial communities
were reflected by PLFA analysis (Priha et al, 2001). Problems related to culturability and growth
of bacteria have generated some criticism of the Biolog® method (Konopka et al., 1998;
Campbell et al., 2003; Ritz 2007). Bearing this in mind, the MicroRespTM assay may be a novel
approach that could provide meaningful and comparable data for substrate induced responses of
soil microorganisms. The MicroRespTM method combines the advantages of Biolog® method, in
which microtitre-based detection plates are used, with the ability to measure release of carbon
dioxide from the whole microbial community present in the soil and not just from the culturable
bacteria. Community-level physiological profiles (CLPP) obtained from MicroRespTM are used in
this study as a measure of functional diversity of the whole microbial community.
The majority of soil microbial community characterizations have been conducted over small
spatial scales or at relatively few sites. However, landscape-level differences may be considered
in forest ecosystems as many important parameters that affect microbial community differ greatly
at this scale; e.g. (i) plant litter can vary widely in its chemical constituents, (ii) plant community
composition can also vary at this scale and may directly influence microbial community
composition (Myers et al., 2001). In New Zealand, Stevenson (2004) found evidence that pine
ESTRUCTURA Y DINÁMICA DE LA MATERIA ORGÁNICA DEL SUELO EN ECOSISTEMAS FORESTALES TEMPLADOS…
134
forests and native forests differed in substrate utilization patterns constructed with catabolic
response profiles (CRP) on the basis of the method of Degens and Vojvodic-Vukovic (1999).
Notwithstanding these observations, understanding of the manner in which the broader soil
microbial community varies with plant community composition at a landscape-level in temperate
ecosystems is limited.
The aims of the present study were: i) to elucidate whether differences in litter quality under
Quercus robur, Fagus sylvatica, Quercurs ilex and Pinus radiata forests were consistent at a
landscape level, ii) to evaluate whether community level physiological profiles (CLPP)
established with whole microbial community of the soil could be used at this scale to differentiate
different forests and iii) to examine the relationship between microbial CLPP and selected forest
floor and soil properties.
6.2. Materials and Methods
6.2.1. Sites and sampling
Forty-two forest stands were sampled during the summer of 2006 within a geographical range of
approximately 450 km2 in the Ibaizabal basin, in the Atlantic zone of the Basque Country (43º
07´N 2º 51´W). The territory is steeply sloping, with altitudes of between <50 m near the coast
and 1200 m at the mountain tops, at distances of <30–50 km, resulting in frequent slopes of 40–
60%. Rainfall ranges from 800–1200 mm and the heaviest rainfalls occur between September and
May. Limestone, loam and dolomites predominate in the territory, as do Leptosols, Regosols and
Cambisols (FAO, 1988). The upper horizons generally show advanced development, sometimes
surpassing 50 cm.
All sampled forests conformed with those used in the National Forest Inventory (IFN, 2005) and
represented semi-natural and mature cultivated forests in the Atlantic region of the Basque
Country. Pinus radiata D.Don forests (12 plots) were productive cultivated monospecific stands.
All of them were characterized by being older than 20 years, and taking into account the forest
management history, these forests were probably not managed with heavy machinery, so soil
disturbance may be minimal at stand establishment. Quercus robur L. (14 plots), Fagus sylvatica
L. (9 plots) and Quercus ilex L. forests (7 plots) represented semi-natural temperate forests.
Quercus robur forests (namely oak) represented mixed forests dominated by oak, chestnut and
birch, with Erica vagans L., Ulex europaeus L., Rubus ulmifolius Schott and Ilex aquifolium L. in
the understorey. Until the mid 1940s, Fagus sylvatica (beech) forests were characterized by
pollarded beeches used for firewood and charcoal and not managed in the last decades. Quercus
6. LANDSCAPE-LEVEL PATTERNS OF SOIL MICROBIAL COMMUNITY LEVEL PHYSIOLOGICAL PROFILES IN TEMPERATE FOREST ECOSYSTEMS
135
ilex forests (namely holm oak) were semi-natural forests established in very shallow soils, also
managed for charcoal production some decades ago and not managed in the past few decades.
Samples were collected from 5 by 5 m plots following a systematic sampling in a criss-cross
pattern. Ten cores (40 mm diam. by 1 m depth) were sampled on two lines that crossed the centre
of the NFI plot. Soil samples were divided into 0-30 cm and 30-60 cm subsamples, composited
for each depth and split into field-moist and dry portions. The field-moist portion was sieved to <
2 mm to remove large woody debris and stones, and maintained at 4ºC. The dry portion was dried
at 30ºC and also sieved to <2 mm. Additionally, 3 forest floor samples were collected at 3
sampling points, where forest floor quantity was representative of the plot. Forest floor was
sampled with a 30 x 30 cm template, air-dried, weighed and ground to pass a 1 mm mesh for
proximate analysis and < 0.5 mm for chemical analysis.
6.2.2. Forest floor analyses
Organic C and total N were analysed in a LECO CNS 2000 analyser (LECO Corporation, MI,
USA). Total concentrations of P, Ca, Mg, K and Na were determined in aqueous extracts after wet
digestion with nitric-perchloric acid by Inductively Coupled Plasma Emission Spectroscopy
(Varian Iberica S.L., Barcelona, Spain). The water-soluble carbohydrates (WSC) were determined
colorimetrically by the anthrone method in water extracts, according to Deriaz (1961). Acid-
detergent fibre (ADF) and acid-detergent lignin (ADL) were determined with an ANKOM220 fiber
analyzer (ANKOM Technology, NY, USA) (van Soest et al., 1991). The cellulose fraction was
calculated as (CEL=ADF−ADL) and the ADL fraction was referred to as lignin, although it
included recalcitrant by-products of decomposition. Ash (ASH) was determined after combustion
for 4 h at 550 °C.
6.2.3. Soil chemical and physical analyses
Total organic C and N were measured with a LECO CNS 2000 autoanalyser (LECO Corporation,
MI, USA). Soil pH was determined in water (1:2.5) and cations (K, Ca, Mg, Na) after extraction
with NH4-acetate 1.0 M. Phosphorus was extracted with sodium bicarbonate (0.5 M; pH 8.5) and
determined by colorimetry in an UV-Visible spectrophotometer Varian Cary 100 (Varian, Inc.,
Palo Alto, Ca.) (Watanabe and Olsen 1965; AOAC, 1980). Cation exchange capacity (CEC) was
determined after saturation of the sample with 1N sodium-acetate. The Na was removed with a
solution of NH4-acetate (1N) and Na was determined on a Varian Spectra 220 FS (Varian, Inc.,
Palo Alto, Ca.) by flame atomic absorption photometry (AOAC, 1980). Extractable cations were
also determined by atomic absorption photometry with the above mentioned apparatus.

ESTRUCTURA Y DINÁMICA DE LA MATERIA ORGÁNICA DEL SUELO EN ECOSISTEMAS FORESTALES TEMPLADOS…
136
Aluminium was extracted with a BaCl2 solution (0.6N) and determined by titration with sodium
hydroxide and phenophtalein (Mosquera, 1990).
Soil particle analysis was performed by laser diffractometry, with a Mastersizer 2000 (Malvern
Instruments, Worcestershire, UK), and soil water holding capacity (WHC) was determined by
water content at -33KPa in standard tension plates (Klute, 1986).
6.2.4. MicroRespTM assay
The MicroRespTM methodology used in the study is described in Campbell et al. (2003). In brief,
the system consisted of two microtitre wells placed face to face and connected with MicroRespTM
seal. Freshly collected soils were preadjusted to 40 % of the water holding capacity so that after
the carbon source solution was added, the moisture content was 60 % of the soil water holding
capacity. The carbon sources used in the present study were selected from those described by
Stevenson et al., 2004, on the basis of their ecological relevance to the soil microbial community
(e.g. plant root exudates) and on their ability to be dissolved in water. The 15 carbon substrates
included in the assay were: two amines (L-glutamine and N-acetyl-D-glucosamine), four amino
acids (L-arginine, L-lysine, L-cysteine and L-phenylalanine), two carbohydrates (D-glucose and
D-fructose), six carboxylic acids (L-ascorbic acid, citric acid, α-ketoglutaric acid, succinic acid,
pantothenic acid and coumaric acid) and one phenolic acid (vainilline). The substrates were used
at the following concentrations: amino acid and amine solutions, 15 mM, carboxylic acid
solutions, 100 mM and carbohydrate solutions, 75 mM.
Soils were preincubated in the dark for 5 days at 28ºC and then added to deep wells containing
carbon sources. Each well was then immediately sealed with the detection plate. This plate
consisted of a gel containing a pH indicator dye (Rowell, 1995), which causes a colour change
with absorption of CO2. For colorimetric detection of CO2 produced by soil microorganisms, the
detection plate was read immediately before and 6 h after incubation at 28ºC, in a microtitre plate
reader (Zenyth 3100, Anthos Labtec Instruments, Salzburg, Austria), at 570 nm. The absorbances
recorded before and after incubation period were normalized and converted to the headspace CO2
concentrations by use of the corresponding calibration curve. A calibration curve for absorbance
plotted against headspace equilibrium CO2 concentration was determined by equilibrating dye
solutions at different CO2 concentrations prepared with standard gas mixtures (Fig 1). The best-fit
curve was determined by regression analysis and the result was as follows (R2= 0.99, P < 0.001):
%CO2 = A + B x , where A= -6.66, B= 7.34 and x was the absorbance data after 6 hours of
incubation.
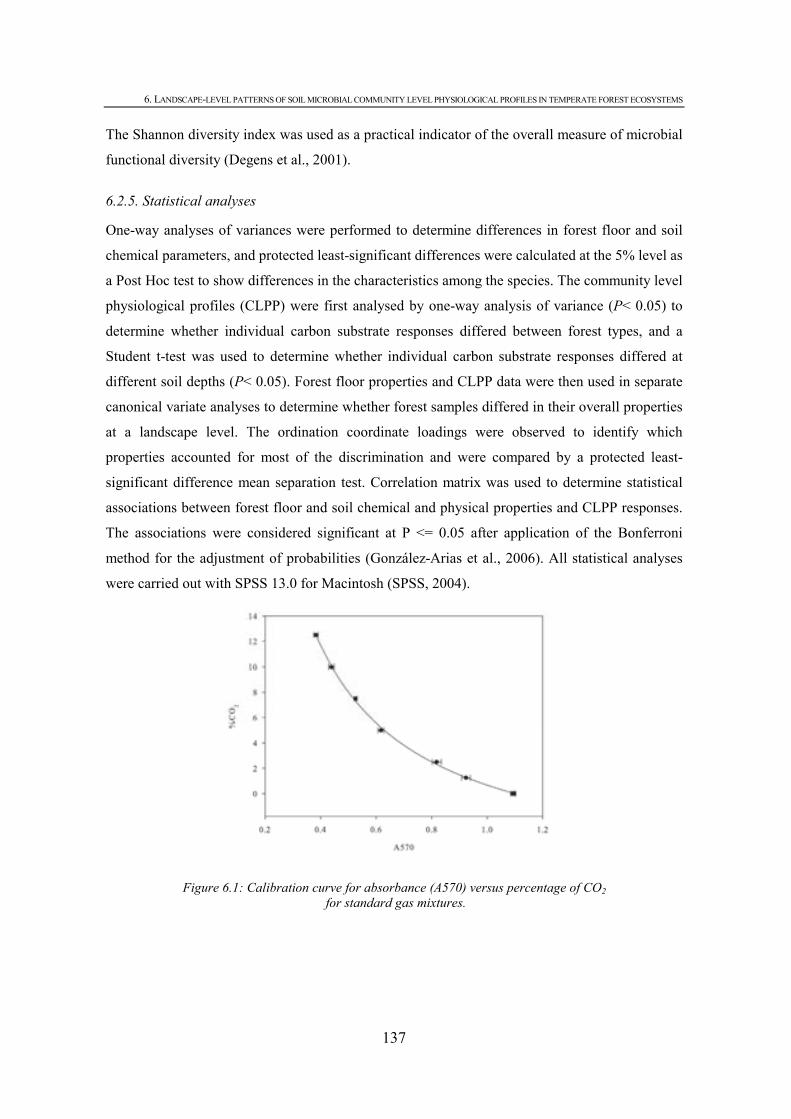
6. LANDSCAPE-LEVEL PATTERNS OF SOIL MICROBIAL COMMUNITY LEVEL PHYSIOLOGICAL PROFILES IN TEMPERATE FOREST ECOSYSTEMS
137
The Shannon diversity index was used as a practical indicator of the overall measure of microbial
functional diversity (Degens et al., 2001).
6.2.5. Statistical analyses
One-way analyses of variances were performed to determine differences in forest floor and soil
chemical parameters, and protected least-significant differences were calculated at the 5% level as
a Post Hoc test to show differences in the characteristics among the species. The community level
physiological profiles (CLPP) were first analysed by one-way analysis of variance (P< 0.05) to
determine whether individual carbon substrate responses differed between forest types, and a
Student t-test was used to determine whether individual carbon substrate responses differed at
different soil depths (P< 0.05). Forest floor properties and CLPP data were then used in separate
canonical variate analyses to determine whether forest samples differed in their overall properties
at a landscape level. The ordination coordinate loadings were observed to identify which
properties accounted for most of the discrimination and were compared by a protected least-
significant difference mean separation test. Correlation matrix was used to determine statistical
associations between forest floor and soil chemical and physical properties and CLPP responses.
The associations were considered significant at P <= 0.05 after application of the Bonferroni
method for the adjustment of probabilities (González-Arias et al., 2006). All statistical analyses
were carried out with SPSS 13.0 for Macintosh (SPSS, 2004).
Figure 6.1: Calibration curve for absorbance (A570) versus percentage of CO2 for standard gas mixtures.
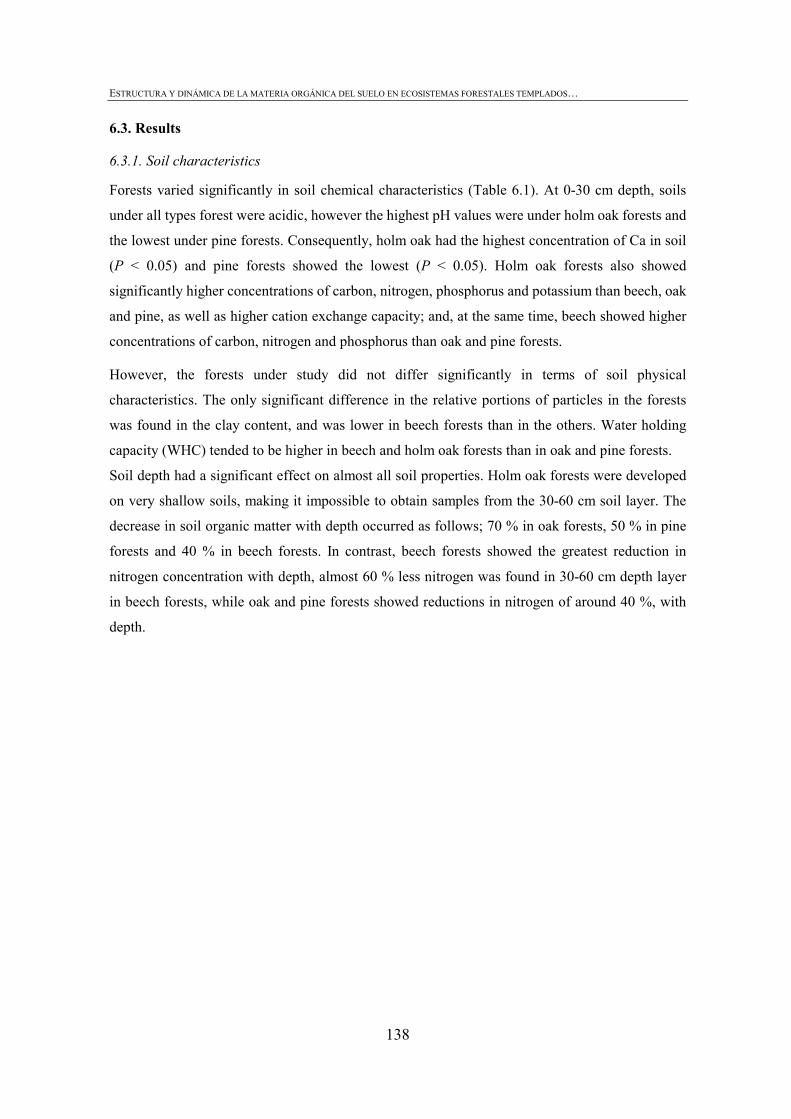
ESTRUCTURA Y DINÁMICA DE LA MATERIA ORGÁNICA DEL SUELO EN ECOSISTEMAS FORESTALES TEMPLADOS…
138
6.3. Results
6.3.1. Soil characteristics
Forests varied significantly in soil chemical characteristics (Table 6.1). At 0-30 cm depth, soils
under all types forest were acidic, however the highest pH values were under holm oak forests and
the lowest under pine forests. Consequently, holm oak had the highest concentration of Ca in soil
(P < 0.05) and pine forests showed the lowest (P < 0.05). Holm oak forests also showed
significantly higher concentrations of carbon, nitrogen, phosphorus and potassium than beech, oak
and pine, as well as higher cation exchange capacity; and, at the same time, beech showed higher
concentrations of carbon, nitrogen and phosphorus than oak and pine forests.
However, the forests under study did not differ significantly in terms of soil physical
characteristics. The only significant difference in the relative portions of particles in the forests
was found in the clay content, and was lower in beech forests than in the others. Water holding
capacity (WHC) tended to be higher in beech and holm oak forests than in oak and pine forests.
Soil depth had a significant effect on almost all soil properties. Holm oak forests were developed
on very shallow soils, making it impossible to obtain samples from the 30-60 cm soil layer. The
decrease in soil organic matter with depth occurred as follows; 70 % in oak forests, 50 % in pine
forests and 40 % in beech forests. In contrast, beech forests showed the greatest reduction in
nitrogen concentration with depth, almost 60 % less nitrogen was found in 30-60 cm depth layer
in beech forests, while oak and pine forests showed reductions in nitrogen of around 40 %, with
depth.
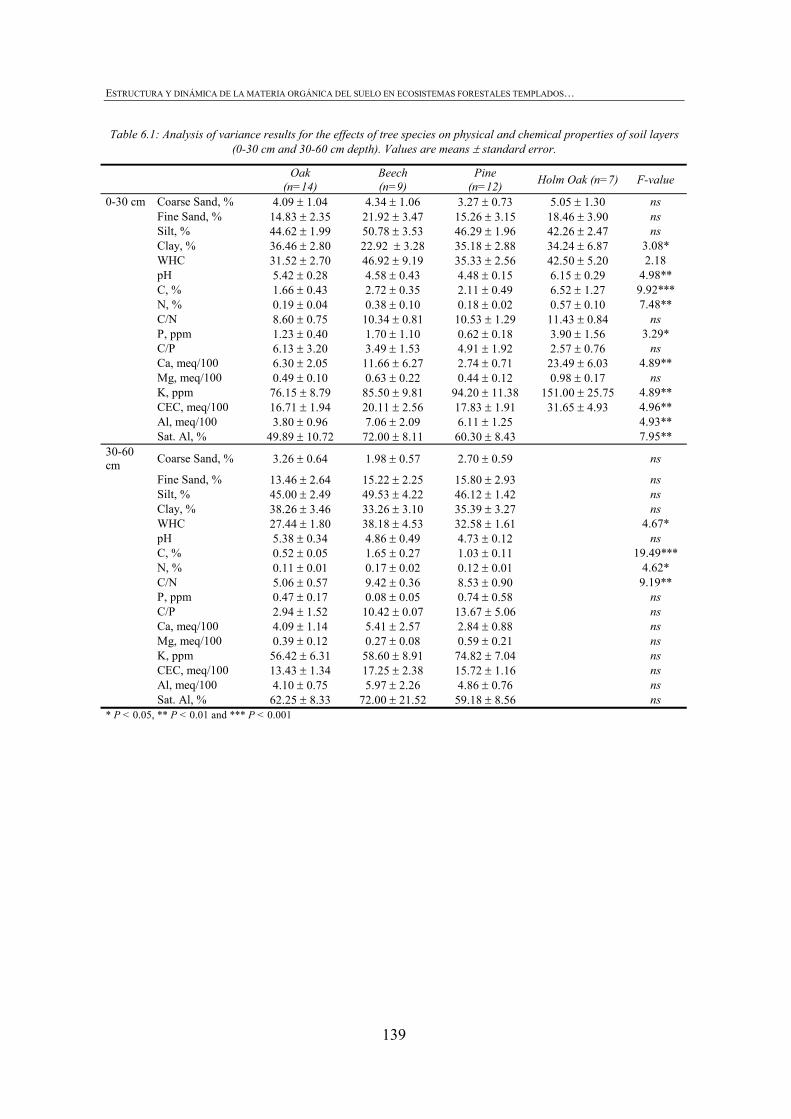
ESTRUCTURA Y DINÁMICA DE LA MATERIA ORGÁNICA DEL SUELO EN ECOSISTEMAS FORESTALES TEMPLADOS…
139
Table 6.1: Analysis of variance results for the effects of tree species on physical and chemical properties of soil layers (0-30 cm and 30-60 cm depth). Values are means ± standard error.
Oak (n=14)
Beech (n=9)
Pine (n=12) Holm Oak (n=7) F-value
0-30 cm Coarse Sand, % 4.09 ± 1.04 4.34 ± 1.06 3.27 ± 0.73 5.05 ± 1.30 ns Fine Sand, % 14.83 ± 2.35 21.92 ± 3.47 15.26 ± 3.15 18.46 ± 3.90 ns Silt, % 44.62 ± 1.99 50.78 ± 3.53 46.29 ± 1.96 42.26 ± 2.47 ns Clay, % 36.46 ± 2.80 22.92 ± 3.28 35.18 ± 2.88 34.24 ± 6.87 3.08* WHC 31.52 ± 2.70 46.92 ± 9.19 35.33 ± 2.56 42.50 ± 5.20 2.18 pH 5.42 ± 0.28 4.58 ± 0.43 4.48 ± 0.15 6.15 ± 0.29 4.98** C, % 1.66 ± 0.43 2.72 ± 0.35 2.11 ± 0.49 6.52 ± 1.27 9.92*** N, % 0.19 ± 0.04 0.38 ± 0.10 0.18 ± 0.02 0.57 ± 0.10 7.48** C/N 8.60 ± 0.75 10.34 ± 0.81 10.53 ± 1.29 11.43 ± 0.84 ns P, ppm 1.23 ± 0.40 1.70 ± 1.10 0.62 ± 0.18 3.90 ± 1.56 3.29* C/P 6.13 ± 3.20 3.49 ± 1.53 4.91 ± 1.92 2.57 ± 0.76 ns Ca, meq/100 6.30 ± 2.05 11.66 ± 6.27 2.74 ± 0.71 23.49 ± 6.03 4.89** Mg, meq/100 0.49 ± 0.10 0.63 ± 0.22 0.44 ± 0.12 0.98 ± 0.17 ns K, ppm 76.15 ± 8.79 85.50 ± 9.81 94.20 ± 11.38 151.00 ± 25.75 4.89** CEC, meq/100 16.71 ± 1.94 20.11 ± 2.56 17.83 ± 1.91 31.65 ± 4.93 4.96** Al, meq/100 3.80 ± 0.96 7.06 ± 2.09 6.11 ± 1.25 4.93** Sat. Al, % 49.89 ± 10.72 72.00 ± 8.11 60.30 ± 8.43 7.95** 30-60 cm Coarse Sand, % 3.26 ± 0.64 1.98 ± 0.57 2.70 ± 0.59 ns
Fine Sand, % 13.46 ± 2.64 15.22 ± 2.25 15.80 ± 2.93 ns Silt, % 45.00 ± 2.49 49.53 ± 4.22 46.12 ± 1.42 ns Clay, % 38.26 ± 3.46 33.26 ± 3.10 35.39 ± 3.27 ns WHC 27.44 ± 1.80 38.18 ± 4.53 32.58 ± 1.61 4.67* pH 5.38 ± 0.34 4.86 ± 0.49 4.73 ± 0.12 ns C, % 0.52 ± 0.05 1.65 ± 0.27 1.03 ± 0.11 19.49*** N, % 0.11 ± 0.01 0.17 ± 0.02 0.12 ± 0.01 4.62* C/N 5.06 ± 0.57 9.42 ± 0.36 8.53 ± 0.90 9.19** P, ppm 0.47 ± 0.17 0.08 ± 0.05 0.74 ± 0.58 ns C/P 2.94 ± 1.52 10.42 ± 0.07 13.67 ± 5.06 ns Ca, meq/100 4.09 ± 1.14 5.41 ± 2.57 2.84 ± 0.88 ns Mg, meq/100 0.39 ± 0.12 0.27 ± 0.08 0.59 ± 0.21 ns K, ppm 56.42 ± 6.31 58.60 ± 8.91 74.82 ± 7.04 ns CEC, meq/100 13.43 ± 1.34 17.25 ± 2.38 15.72 ± 1.16 ns Al, meq/100 4.10 ± 0.75 5.97 ± 2.26 4.86 ± 0.76 ns Sat. Al, % 62.25 ± 8.33 72.00 ± 21.52 59.18 ± 8.56 ns * P < 0.05, ** P < 0.01 and *** P < 0.001
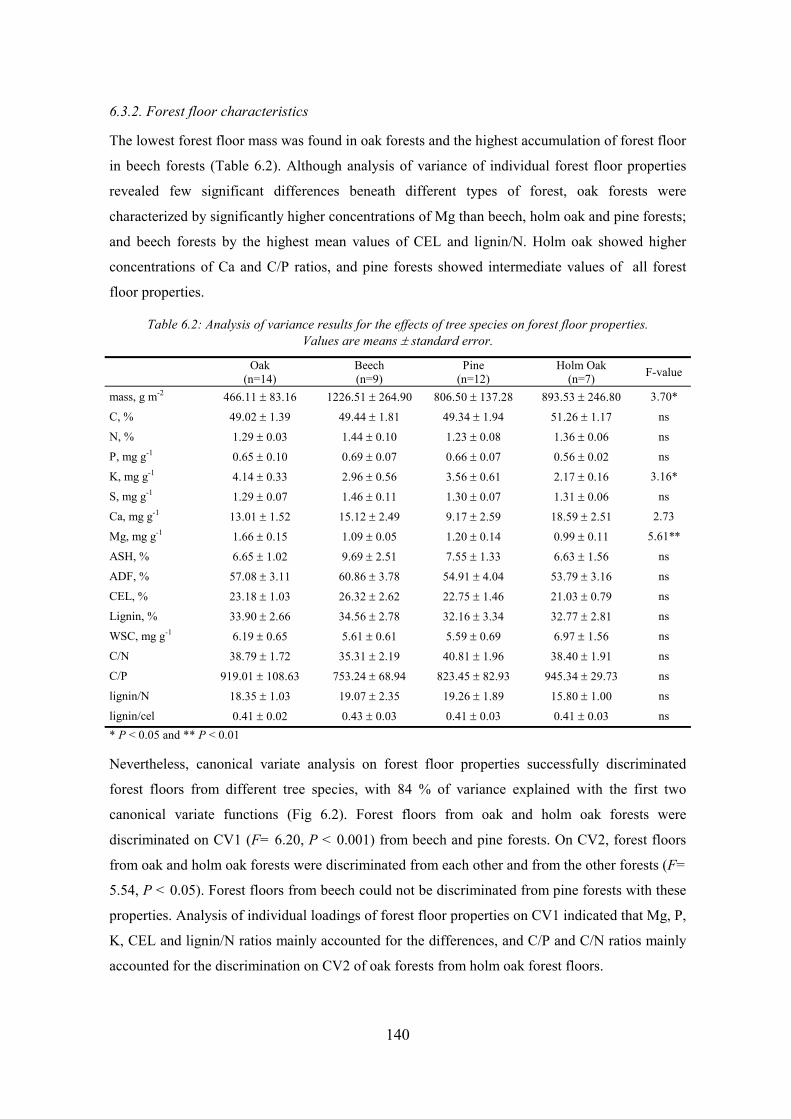
140
6.3.2. Forest floor characteristics
The lowest forest floor mass was found in oak forests and the highest accumulation of forest floor
in beech forests (Table 6.2). Although analysis of variance of individual forest floor properties
revealed few significant differences beneath different types of forest, oak forests were
characterized by significantly higher concentrations of Mg than beech, holm oak and pine forests;
and beech forests by the highest mean values of CEL and lignin/N. Holm oak showed higher
concentrations of Ca and C/P ratios, and pine forests showed intermediate values of all forest
floor properties.
Table 6.2: Analysis of variance results for the effects of tree species on forest floor properties. Values are means ± standard error.
Oak (n=14)
Beech (n=9)
Pine (n=12)
Holm Oak (n=7) F-value
mass, g m-2 466.11 ± 83.16 1226.51 ± 264.90 806.50 ± 137.28 893.53 ± 246.80 3.70*
C, % 49.02 ± 1.39 49.44 ± 1.81 49.34 ± 1.94 51.26 ± 1.17 ns
N, % 1.29 ± 0.03 1.44 ± 0.10 1.23 ± 0.08 1.36 ± 0.06 ns
P, mg g-1 0.65 ± 0.10 0.69 ± 0.07 0.66 ± 0.07 0.56 ± 0.02 ns
K, mg g-1 4.14 ± 0.33 2.96 ± 0.56 3.56 ± 0.61 2.17 ± 0.16 3.16*
S, mg g-1 1.29 ± 0.07 1.46 ± 0.11 1.30 ± 0.07 1.31 ± 0.06 ns
Ca, mg g-1 13.01 ± 1.52 15.12 ± 2.49 9.17 ± 2.59 18.59 ± 2.51 2.73
Mg, mg g-1 1.66 ± 0.15 1.09 ± 0.05 1.20 ± 0.14 0.99 ± 0.11 5.61**
ASH, % 6.65 ± 1.02 9.69 ± 2.51 7.55 ± 1.33 6.63 ± 1.56 ns
ADF, % 57.08 ± 3.11 60.86 ± 3.78 54.91 ± 4.04 53.79 ± 3.16 ns
CEL, % 23.18 ± 1.03 26.32 ± 2.62 22.75 ± 1.46 21.03 ± 0.79 ns
Lignin, % 33.90 ± 2.66 34.56 ± 2.78 32.16 ± 3.34 32.77 ± 2.81 ns
WSC, mg g-1 6.19 ± 0.65 5.61 ± 0.61 5.59 ± 0.69 6.97 ± 1.56 ns
C/N 38.79 ± 1.72 35.31 ± 2.19 40.81 ± 1.96 38.40 ± 1.91 ns
C/P 919.01 ± 108.63 753.24 ± 68.94 823.45 ± 82.93 945.34 ± 29.73 ns
lignin/N 18.35 ± 1.03 19.07 ± 2.35 19.26 ± 1.89 15.80 ± 1.00 ns
lignin/cel 0.41 ± 0.02 0.43 ± 0.03 0.41 ± 0.03 0.41 ± 0.03 ns * P < 0.05 and ** P < 0.01
Nevertheless, canonical variate analysis on forest floor properties successfully discriminated
forest floors from different tree species, with 84 % of variance explained with the first two
canonical variate functions (Fig 6.2). Forest floors from oak and holm oak forests were
discriminated on CV1 (F= 6.20, P < 0.001) from beech and pine forests. On CV2, forest floors
from oak and holm oak forests were discriminated from each other and from the other forests (F=
5.54, P < 0.05). Forest floors from beech could not be discriminated from pine forests with these
properties. Analysis of individual loadings of forest floor properties on CV1 indicated that Mg, P,
K, CEL and lignin/N ratios mainly accounted for the differences, and C/P and C/N ratios mainly
accounted for the discrimination on CV2 of oak forests from holm oak forest floors.
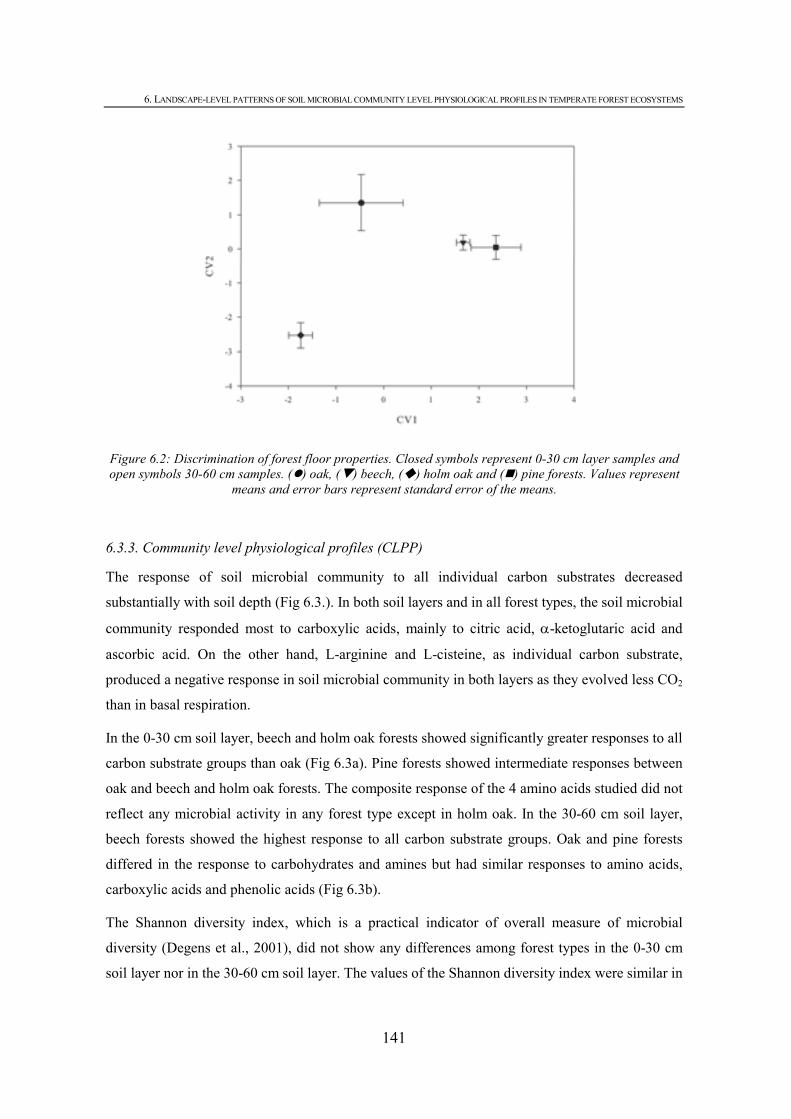
6. LANDSCAPE-LEVEL PATTERNS OF SOIL MICROBIAL COMMUNITY LEVEL PHYSIOLOGICAL PROFILES IN TEMPERATE FOREST ECOSYSTEMS
141
Figure 6.2: Discrimination of forest floor properties. Closed symbols represent 0-30 cm layer samples and open symbols 30-60 cm samples. ( ) oak, ( ) beech, ( ) holm oak and ( ) pine forests. Values represent
means and error bars represent standard error of the means.
6.3.3. Community level physiological profiles (CLPP)
The response of soil microbial community to all individual carbon substrates decreased
substantially with soil depth (Fig 6.3.). In both soil layers and in all forest types, the soil microbial
community responded most to carboxylic acids, mainly to citric acid, α-ketoglutaric acid and
ascorbic acid. On the other hand, L-arginine and L-cisteine, as individual carbon substrate,
produced a negative response in soil microbial community in both layers as they evolved less CO2
than in basal respiration.
In the 0-30 cm soil layer, beech and holm oak forests showed significantly greater responses to all
carbon substrate groups than oak (Fig 6.3a). Pine forests showed intermediate responses between
oak and beech and holm oak forests. The composite response of the 4 amino acids studied did not
reflect any microbial activity in any forest type except in holm oak. In the 30-60 cm soil layer,
beech forests showed the highest response to all carbon substrate groups. Oak and pine forests
differed in the response to carbohydrates and amines but had similar responses to amino acids,
carboxylic acids and phenolic acids (Fig 6.3b).
The Shannon diversity index, which is a practical indicator of overall measure of microbial
diversity (Degens et al., 2001), did not show any differences among forest types in the 0-30 cm
soil layer nor in the 30-60 cm soil layer. The values of the Shannon diversity index were similar in
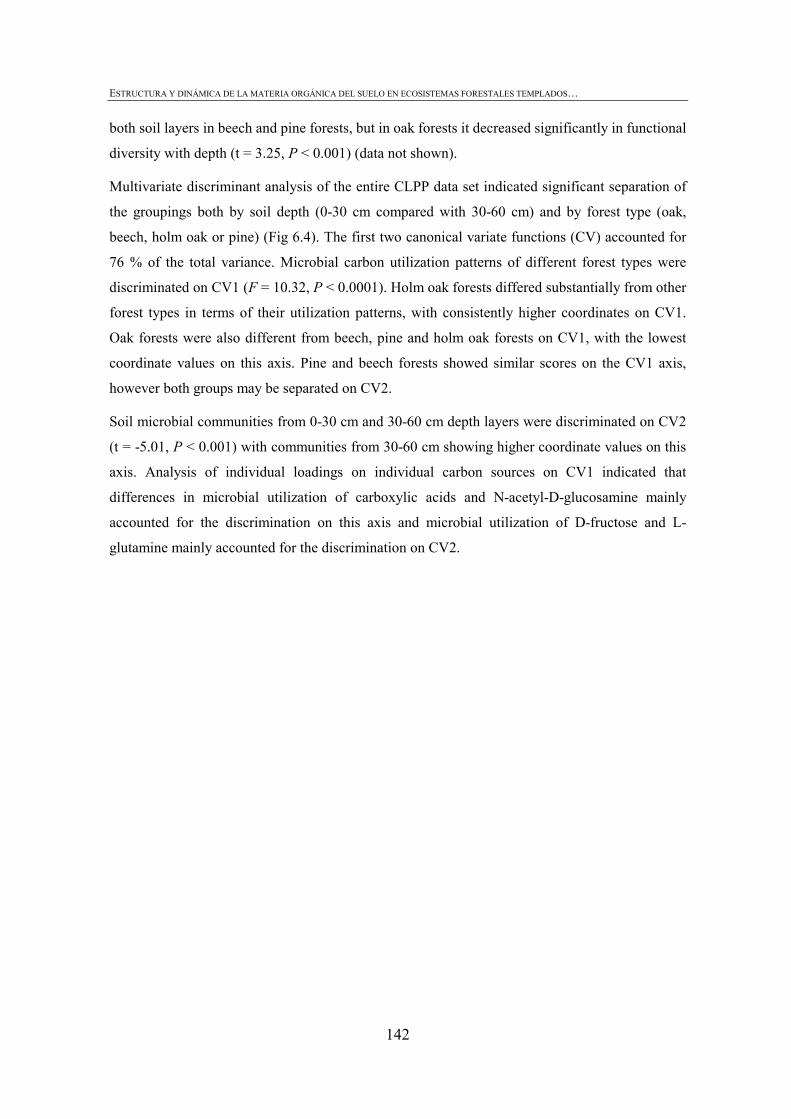
ESTRUCTURA Y DINÁMICA DE LA MATERIA ORGÁNICA DEL SUELO EN ECOSISTEMAS FORESTALES TEMPLADOS…
142
both soil layers in beech and pine forests, but in oak forests it decreased significantly in functional
diversity with depth (t = 3.25, P < 0.001) (data not shown).
Multivariate discriminant analysis of the entire CLPP data set indicated significant separation of
the groupings both by soil depth (0-30 cm compared with 30-60 cm) and by forest type (oak,
beech, holm oak or pine) (Fig 6.4). The first two canonical variate functions (CV) accounted for
76 % of the total variance. Microbial carbon utilization patterns of different forest types were
discriminated on CV1 (F = 10.32, P < 0.0001). Holm oak forests differed substantially from other
forest types in terms of their utilization patterns, with consistently higher coordinates on CV1.
Oak forests were also different from beech, pine and holm oak forests on CV1, with the lowest
coordinate values on this axis. Pine and beech forests showed similar scores on the CV1 axis,
however both groups may be separated on CV2.
Soil microbial communities from 0-30 cm and 30-60 cm depth layers were discriminated on CV2
(t = -5.01, P < 0.001) with communities from 30-60 cm showing higher coordinate values on this
axis. Analysis of individual loadings on individual carbon sources on CV1 indicated that
differences in microbial utilization of carboxylic acids and N-acetyl-D-glucosamine mainly
accounted for the discrimination on this axis and microbial utilization of D-fructose and L-
glutamine mainly accounted for the discrimination on CV2.
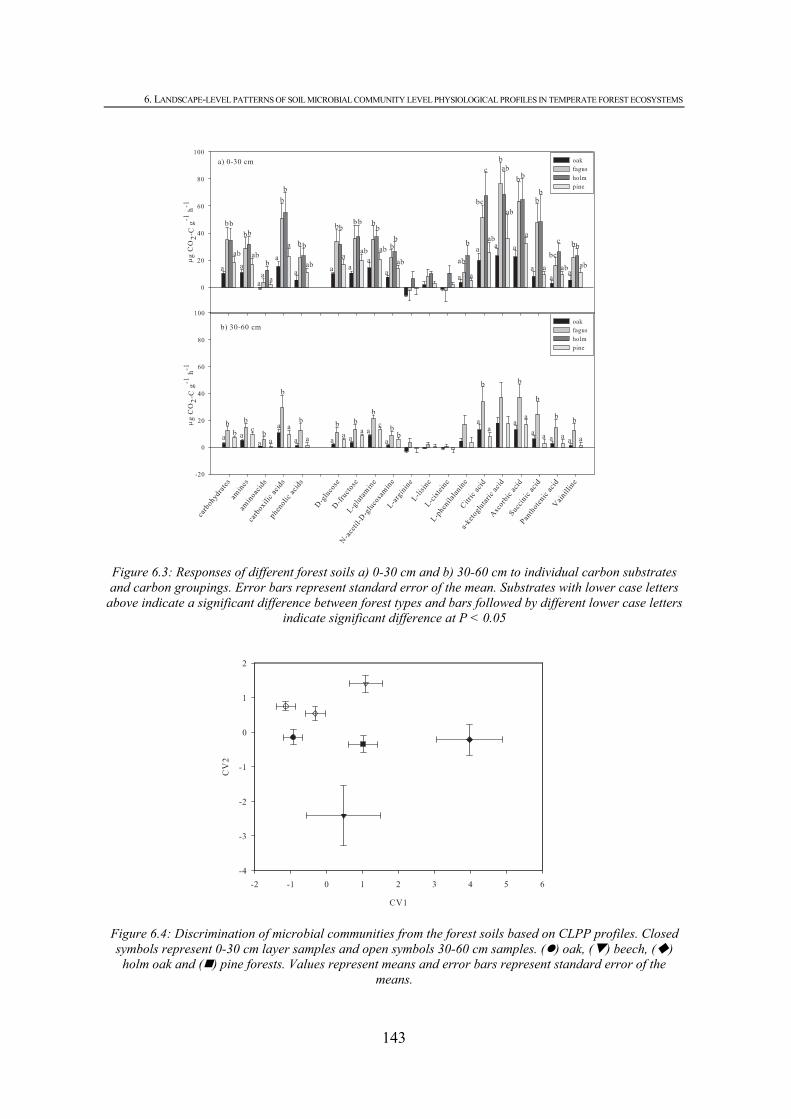
6. LANDSCAPE-LEVEL PATTERNS OF SOIL MICROBIAL COMMUNITY LEVEL PHYSIOLOGICAL PROFILES IN TEMPERATE FOREST ECOSYSTEMS
143
Figure 6.3: Responses of different forest soils a) 0-30 cm and b) 30-60 cm to individual carbon substrates and carbon groupings. Error bars represent standard error of the mean. Substrates with lower case letters
above indicate a significant difference between forest types and bars followed by different lower case letters indicate significant difference at P < 0.05
Figure 6.4: Discrimination of microbial communities from the forest soils based on CLPP profiles. Closed symbols represent 0-30 cm layer samples and open symbols 30-60 cm samples. ( ) oak, ( ) beech, ( )
holm oak and ( ) pine forests. Values represent means and error bars represent standard error of the means.
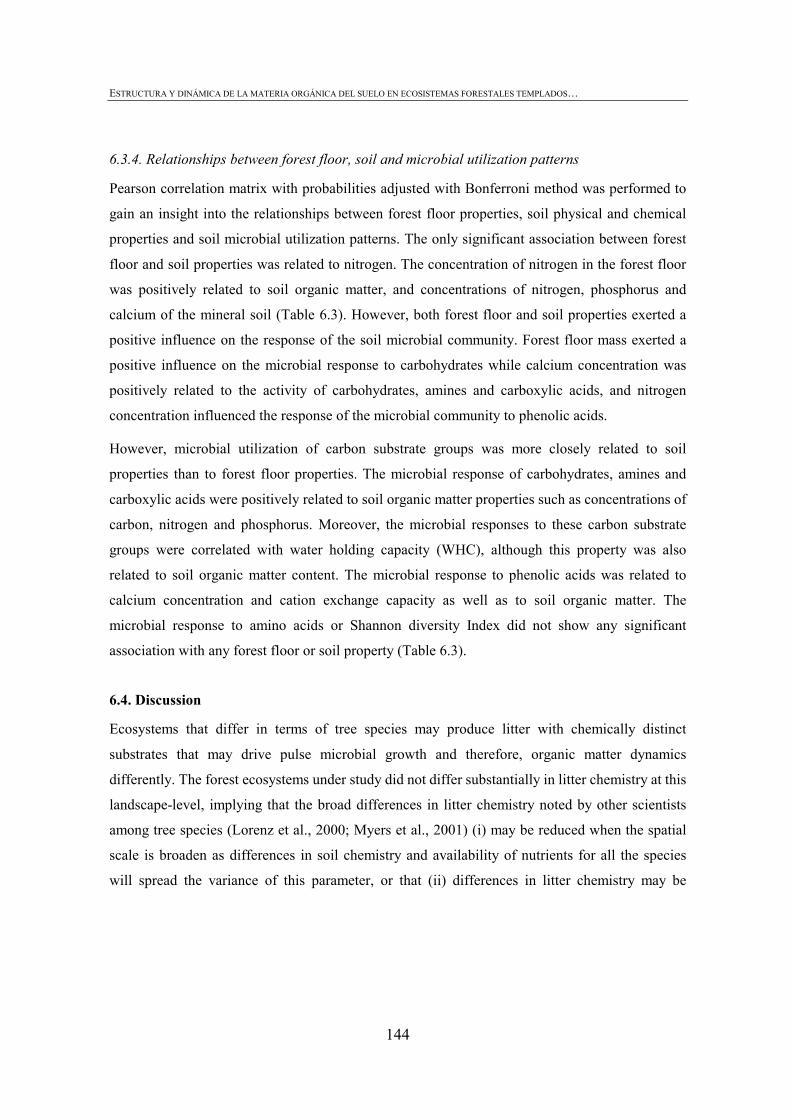
ESTRUCTURA Y DINÁMICA DE LA MATERIA ORGÁNICA DEL SUELO EN ECOSISTEMAS FORESTALES TEMPLADOS…
144
6.3.4. Relationships between forest floor, soil and microbial utilization patterns
Pearson correlation matrix with probabilities adjusted with Bonferroni method was performed to
gain an insight into the relationships between forest floor properties, soil physical and chemical
properties and soil microbial utilization patterns. The only significant association between forest
floor and soil properties was related to nitrogen. The concentration of nitrogen in the forest floor
was positively related to soil organic matter, and concentrations of nitrogen, phosphorus and
calcium of the mineral soil (Table 6.3). However, both forest floor and soil properties exerted a
positive influence on the response of the soil microbial community. Forest floor mass exerted a
positive influence on the microbial response to carbohydrates while calcium concentration was
positively related to the activity of carbohydrates, amines and carboxylic acids, and nitrogen
concentration influenced the response of the microbial community to phenolic acids.
However, microbial utilization of carbon substrate groups was more closely related to soil
properties than to forest floor properties. The microbial response of carbohydrates, amines and
carboxylic acids were positively related to soil organic matter properties such as concentrations of
carbon, nitrogen and phosphorus. Moreover, the microbial responses to these carbon substrate
groups were correlated with water holding capacity (WHC), although this property was also
related to soil organic matter content. The microbial response to phenolic acids was related to
calcium concentration and cation exchange capacity as well as to soil organic matter. The
microbial response to amino acids or Shannon diversity Index did not show any significant
association with any forest floor or soil property (Table 6.3).
6.4. Discussion
Ecosystems that differ in terms of tree species may produce litter with chemically distinct
substrates that may drive pulse microbial growth and therefore, organic matter dynamics
differently. The forest ecosystems under study did not differ substantially in litter chemistry at this
landscape-level, implying that the broad differences in litter chemistry noted by other scientists
among tree species (Lorenz et al., 2000; Myers et al., 2001) (i) may be reduced when the spatial
scale is broaden as differences in soil chemistry and availability of nutrients for all the species
will spread the variance of this parameter, or that (ii) differences in litter chemistry may be
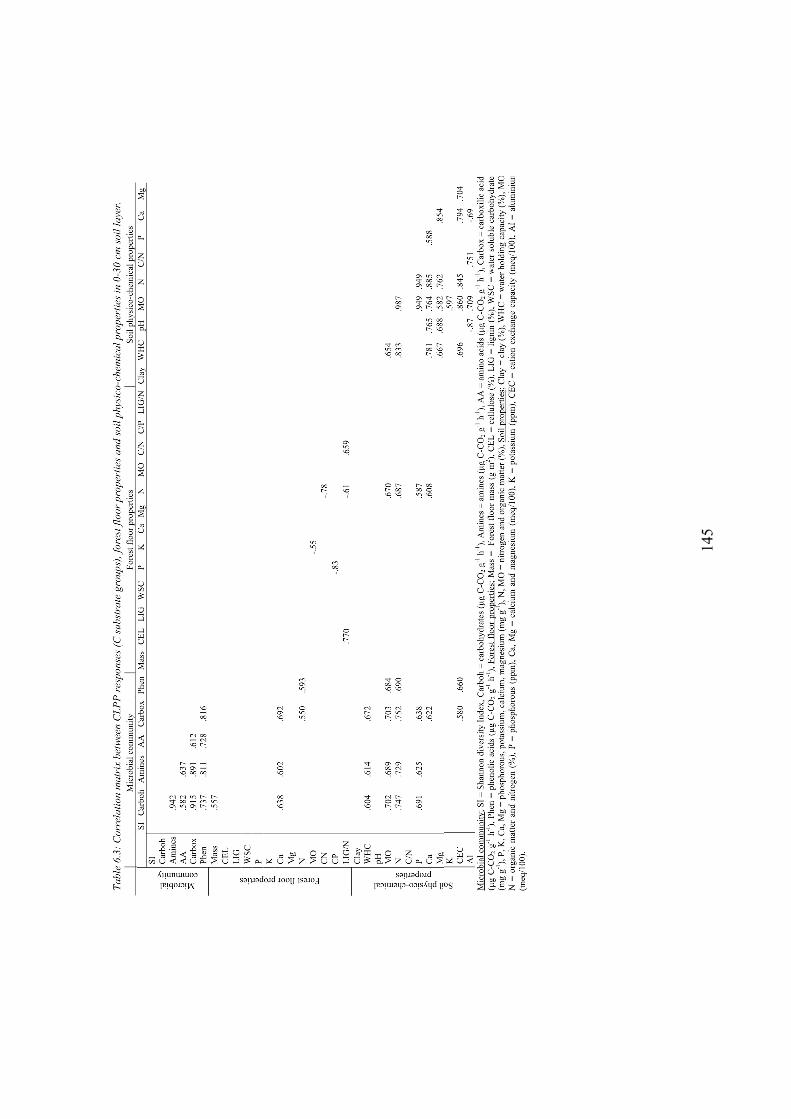
14
5
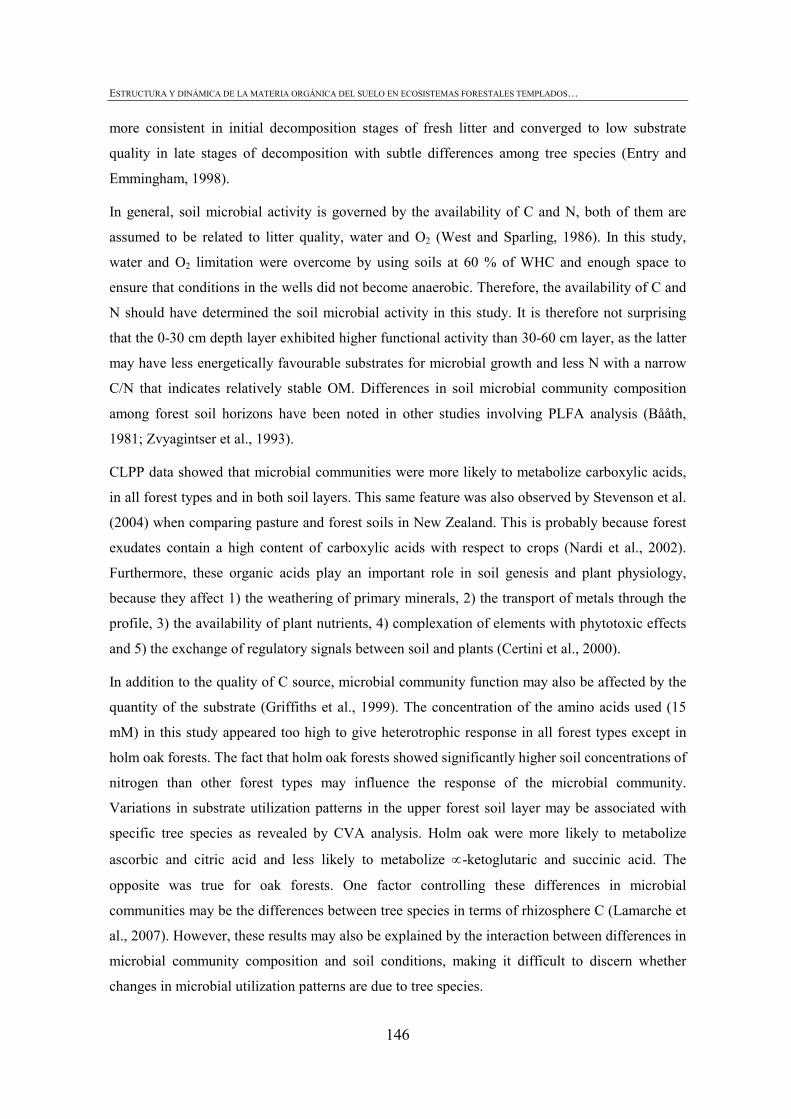
ESTRUCTURA Y DINÁMICA DE LA MATERIA ORGÁNICA DEL SUELO EN ECOSISTEMAS FORESTALES TEMPLADOS…
146
more consistent in initial decomposition stages of fresh litter and converged to low substrate
quality in late stages of decomposition with subtle differences among tree species (Entry and
Emmingham, 1998).
In general, soil microbial activity is governed by the availability of C and N, both of them are
assumed to be related to litter quality, water and O2 (West and Sparling, 1986). In this study,
water and O2 limitation were overcome by using soils at 60 % of WHC and enough space to
ensure that conditions in the wells did not become anaerobic. Therefore, the availability of C and
N should have determined the soil microbial activity in this study. It is therefore not surprising
that the 0-30 cm depth layer exhibited higher functional activity than 30-60 cm layer, as the latter
may have less energetically favourable substrates for microbial growth and less N with a narrow
C/N that indicates relatively stable OM. Differences in soil microbial community composition
among forest soil horizons have been noted in other studies involving PLFA analysis (Bååth,
1981; Zvyagintser et al., 1993).
CLPP data showed that microbial communities were more likely to metabolize carboxylic acids,
in all forest types and in both soil layers. This same feature was also observed by Stevenson et al.
(2004) when comparing pasture and forest soils in New Zealand. This is probably because forest
exudates contain a high content of carboxylic acids with respect to crops (Nardi et al., 2002).
Furthermore, these organic acids play an important role in soil genesis and plant physiology,
because they affect 1) the weathering of primary minerals, 2) the transport of metals through the
profile, 3) the availability of plant nutrients, 4) complexation of elements with phytotoxic effects
and 5) the exchange of regulatory signals between soil and plants (Certini et al., 2000).
In addition to the quality of C source, microbial community function may also be affected by the
quantity of the substrate (Griffiths et al., 1999). The concentration of the amino acids used (15
mM) in this study appeared too high to give heterotrophic response in all forest types except in
holm oak forests. The fact that holm oak forests showed significantly higher soil concentrations of
nitrogen than other forest types may influence the response of the microbial community.
Variations in substrate utilization patterns in the upper forest soil layer may be associated with
specific tree species as revealed by CVA analysis. Holm oak were more likely to metabolize
ascorbic and citric acid and less likely to metabolize ∝-ketoglutaric and succinic acid. The
opposite was true for oak forests. One factor controlling these differences in microbial
communities may be the differences between tree species in terms of rhizosphere C (Lamarche et
al., 2007). However, these results may also be explained by the interaction between differences in
microbial community composition and soil conditions, making it difficult to discern whether
changes in microbial utilization patterns are due to tree species.
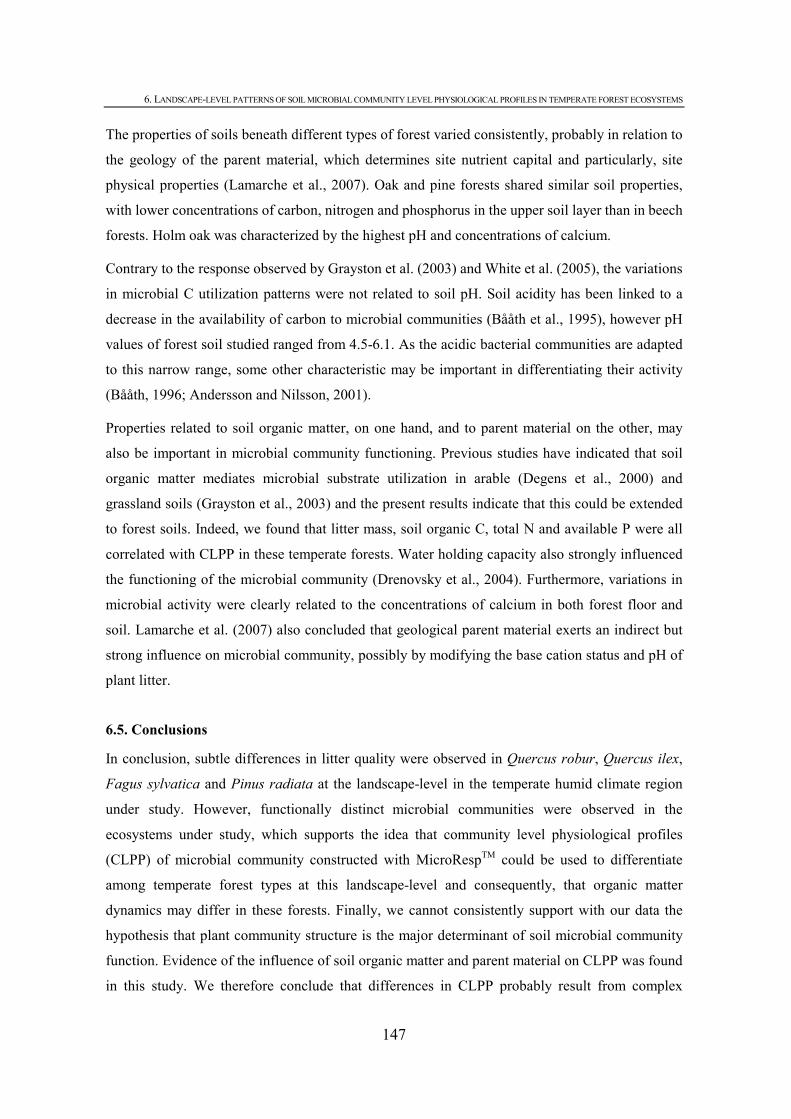
6. LANDSCAPE-LEVEL PATTERNS OF SOIL MICROBIAL COMMUNITY LEVEL PHYSIOLOGICAL PROFILES IN TEMPERATE FOREST ECOSYSTEMS
147
The properties of soils beneath different types of forest varied consistently, probably in relation to
the geology of the parent material, which determines site nutrient capital and particularly, site
physical properties (Lamarche et al., 2007). Oak and pine forests shared similar soil properties,
with lower concentrations of carbon, nitrogen and phosphorus in the upper soil layer than in beech
forests. Holm oak was characterized by the highest pH and concentrations of calcium.
Contrary to the response observed by Grayston et al. (2003) and White et al. (2005), the variations
in microbial C utilization patterns were not related to soil pH. Soil acidity has been linked to a
decrease in the availability of carbon to microbial communities (Bååth et al., 1995), however pH
values of forest soil studied ranged from 4.5-6.1. As the acidic bacterial communities are adapted
to this narrow range, some other characteristic may be important in differentiating their activity
(Bååth, 1996; Andersson and Nilsson, 2001).
Properties related to soil organic matter, on one hand, and to parent material on the other, may
also be important in microbial community functioning. Previous studies have indicated that soil
organic matter mediates microbial substrate utilization in arable (Degens et al., 2000) and
grassland soils (Grayston et al., 2003) and the present results indicate that this could be extended
to forest soils. Indeed, we found that litter mass, soil organic C, total N and available P were all
correlated with CLPP in these temperate forests. Water holding capacity also strongly influenced
the functioning of the microbial community (Drenovsky et al., 2004). Furthermore, variations in
microbial activity were clearly related to the concentrations of calcium in both forest floor and
soil. Lamarche et al. (2007) also concluded that geological parent material exerts an indirect but
strong influence on microbial community, possibly by modifying the base cation status and pH of
plant litter.
6.5. Conclusions
In conclusion, subtle differences in litter quality were observed in Quercus robur, Quercus ilex,
Fagus sylvatica and Pinus radiata at the landscape-level in the temperate humid climate region
under study. However, functionally distinct microbial communities were observed in the
ecosystems under study, which supports the idea that community level physiological profiles
(CLPP) of microbial community constructed with MicroRespTM could be used to differentiate
among temperate forest types at this landscape-level and consequently, that organic matter
dynamics may differ in these forests. Finally, we cannot consistently support with our data the
hypothesis that plant community structure is the major determinant of soil microbial community
function. Evidence of the influence of soil organic matter and parent material on CLPP was found
in this study. We therefore conclude that differences in CLPP probably result from complex
ESTRUCTURA Y DINÁMICA DE LA MATERIA ORGÁNICA DEL SUELO EN ECOSISTEMAS FORESTALES TEMPLADOS…
148
interactions between soil properties that mediate substrate availability, abiotic factors that mediate
cation base status, and vegetation type, which mediates substrate quality.
Acknowledgements
Funding for this study was provided by European Union ERDF-INTERREG IIIB Atlantic Area
and the Department of Agriculture, Fisheries and Food of the Basque Country. We are grateful to
Clare Cameron and Dr. Colin Campbell from Macaulay Institute for supporting us with the
MicroRespTM analyses. We also thank Dr. Christine Francis for revising the English of the
manuscript.
6.6. References
Andersson, S., Ingvar Nilsson, S., 2001. Influence of pH and temperature on microbial activity,
substrate availability of soil-solution bacteria and leaching of dissolved organic carbon in a
mor humus. Soil Biology and Biochemsitry 33, 1181–1191.
AOAC, 1980. Official methods of analysis of the Association of Official Analytical Chemists. In:
W. Harwitte (ed.), 13th ed. Washington DC, USA.
Bååth, E., 1981. Microfungi in a clear-cut pine forest soil in central Sweden. Can J Bot 59:1331–
1337
Bååth, E., 1996. Adaptation of soil bacterial communities to prevailing pH in different soils. FEMS
MicroBiology Ecology 19, 227-237.
Bååth, E., Frostegård, A., Pennanen, T., Fritze, H., 1995. Microbial community structure and pH
response in relation to soil organic matter quality in wood–ash fertilized, clear-cut or burned
coniferous forest soils. Soil Biology and Biochemsitry 27, 229-240.
Balser, T.C. and Firestone, M.K., 2005. Linking microbial community composition and soil
processes in a California annual grassland and mixed-conifer forest. Biogeochemistry 73:
395-415.
Campbell, C.D., S.J. Chapman, C.D. Cameron, M.S. Davidson and J.M. Potts, 2003. A rapid
microtiter plate method to measure carbon dioxide evolved from carbon substrate
amendments so as to determine the physiological profiles of soil microbial communities by
using whole soil. Applied and Environmental Microbiology 69, 3593-3599.
Certini, G., Corti, G., Ugolini, F.C., 2000. Vertical trends of oxalate concentration in two soils under
Abies alba from Tuscany (Italy). Journal of Plant Nutrition and Soil Science 163, 173-177.
Degens B.P., L. A. Schipper, G. P. Sparling and L. C. Duncan, 2001. Is the microbial community in
a soil with reduced catabolic diversity less resistant to stress or disturbance? Soil Biology and
6. LANDSCAPE-LEVEL PATTERNS OF SOIL MICROBIAL COMMUNITY LEVEL PHYSIOLOGICAL PROFILES IN TEMPERATE FOREST ECOSYSTEMS
149
Biochemistry 33, 1143-1153.
Degens, B.P., Vojvodic-Vukovic, M., 1999. A sampling strategy to assess the effects of land use on
microbial functional diversity in soils. Australian Journal of Soil Research 37, 593-601.
Deriaz, R.E.,1961. The routine analysis of carbohydrates and lignin in herbage. Journal of Science
of Food and Agriculture 12, 152-160.
Drenovsky, R.E., Vo, D., Graham, K.J., Scow, K.M., 2004. Soil water and organic carbon
availability are major determinants of soil microbial community composition. Microbial
Ecology 48, 424-430.
Entry, J.A., Emmingham, W.H., 1998. Influence of forest age on forms of carbon in Douglas fir soil
the Oregon coast range. Canadian Journal of Forest Research 28, 390-395.
FAO, 1988. FAO-UNESCO Soil Map of the World: Revised Legend. FAO World Soil Resources
Reports nº 60, Rome. 119 pp.
Garland, J.L., and A.L. Mills. 1991. Classification and characterization of heterotrophic microbial
communities on the basis of patterns of community-level sole-carbon-source utilization.
Applied and Environmental Microbiology 57, 2351–2359.
González-Arias, A., I. Martínez de Arano, M.J. Bárcena-Ruíz, G. Besga and M. Onaindia, 2006.
Origin of atmospheric deposition and canopy buffering capacity in stands of radiata pine and
pedunculate oak in the Basque Country. Forest Ecology and Management 229, 268-284.
Grayston, S.J., Campbell, C.D., Bardgett, R.D., Mawdsley, J.L., Mawdsley, Clegg, C.D., Ritz, K.,
Griffiths, B.S., Rodwell, J.S., Edwards, S.J., Davies, W.J., Elston, D.J., Millard, P., 2003.
Assessing shifts in microbial community structure across a range of grasslands of differing
management intensity using CLPP, PLFA and community DNA techniques. Applied Soil
Ecology 25, 63-84.
Grayston, S.J., S. Wang, C. D. Campbell and A.C. Edwards, 1998. Selective influence of plant
species on microbial diversity in the rhizosphere. Soil Biology and Biochemistry 30, 369-378.
Griffiths B. S., K. Ritz, R. D. Bardgett, R. Cook, S. Christensen, F. Ekelund, S. J. Sørensen, E.
Bååth, J. Bloem, P. C. de Ruiter, J. Dolfing, B. Nicolardot, 2000. Ecosystem response of
pasture soil communities to fumigation-induced microbial diversity reductions: an
examination of the biodiversity-ecosystem function relationship. Oikos 90, 279-294.
Griffiths, B.S., K. Ritz, N. Ebbelwhite and G. Dobson, 1999. Soil microbial community structure:
effects of substrate loading rates. Soil Biology and Biochemistry 31, 145-153.
IFN, 2005. Cuarto Inventario Forestal Nacional 1995-2005. Ministerio de Medio Ambiente.
ESTRUCTURA Y DINÁMICA DE LA MATERIA ORGÁNICA DEL SUELO EN ECOSISTEMAS FORESTALES TEMPLADOS…
150
Dirección General de Conservación de la Naturaleza, Madrid, Spain
Klute A., 1986. Water retention: Laboratory methods. In: Klute A., (ed) Methods of soil analysis.
Part 1, 2nd ed, Agronomy Monographs 9, Madison, WI, pp. 635-662.
Konopka, A., L. Oliver, and R.F. Turco. 1998. The use of carbon substrate utilization patterns in
environmental and ecological microbiology. Microbial Ecology 35, 103–115.
Lamarche, J., Bradley, R.L., Hooper, E., Shipley, B., Simao Beaunoir, A.M., Beaulieu, C., 2007.
Forest floor bacterial community composition and catabolic profiles in relation to landscape
features in Québec's southern boreal forest. Microbial Ecology 54, 10-20.
Lorenz, K., Preston, C.M., Raspe, S., Morrison, I.K., Feger, K.H., 2000. Litter decomposition and
humus characteristics in Canadian and German spruce ecosystems: information from tannin
analysis and 13C CPMASS NMR. Soil Biology and Biochemistry 32, 779-792
Lupwayi, N. Z., M. A. Arshad, W. A. Rice and G. W. Clayton, 2001. Bacterial diversity in water-
stable aggregates of soils under conventional and zero tillage management. Applied Soil
Ecology 16 (3), 251-26.
Mosquera, A.C. 1990. Comparison of indirect methods for the determination of percent
exchangeable aluminum in acid soils of Galicia (NW Spain). Communications in Soil
Science and Plant Analysis 21: 365-375.
Myers, R.T., D.R. Zak, D.C. White and A. Peacock, 2001. Landscape-level patterns of microbial
commnunity composition and substrate use in upland forest ecosystems. Soil Science Society
of America Journal 65, 359-367.
Nardi, S., Sessi., E., Pizzeghello, E., Sturaro, A., Rella, R., Parvoli, G., 2002. Biological activity of
soil organic matter mobilized by root exudates. Chemosphere 46, 1075-1081
Priha, O., S.J. Grayston, R. Hiukka, T. Pennanen and A. Smolander, 2001. Microbial community
structure and characteristics of the organic matter in soils under Pinus sylvestris, Pices abies
and Betula pendula at two forest sites. Biology and Fertility of Soils 33, 17-24.
Ritz, K., 2007. The Plate Debate: Cultivable communities have no utility in contemporary
environmental microbial ecology. FEMS Microbiology Ecology 60 (3), 358–362.
Rowell, M.J., 1995. Colorimetric method for CO2 measurement in soil. Soil Biology and
Biochemistry 27, 373-375.
SPSS, 2004. SPSS 13.0 for Mac® OS X. SPSS Inc., Chicago, USA.
6. LANDSCAPE-LEVEL PATTERNS OF SOIL MICROBIAL COMMUNITY LEVEL PHYSIOLOGICAL PROFILES IN TEMPERATE FOREST ECOSYSTEMS
151
Stevenson, B.A., G.P. Sparling, L.A. Schipper, B.P. Degens and L.C. Duncan, 2004. Pasture and
forest soil microbial communities show distinct patterns their catabolic respiration responses
at a landscape scale. Soil Biology and Biochemistry 36, 49-55.
Van Soest, P.J., Robertson, J. B. and Lewis, B. A. 1991. Symposium: Carbohydrate, methodology,
metabolism and nutritional implications in dairy cattle, Methods for dietary fiber, neutral
detergent fiber and nonstarch polysaccharides in relation to animal nutrition. Journal of Dairy
Science 74, 3583-3597.
Watanabe F.S. and Olsen S.R. 1965. Test of an ascorbic acid method for determining Phosphorus in
Water and NaHCO3 extracts from soil. Soil Science Society Proceedings. 677-678.
West, A. W. and G. P. Sparling, 1986. Modifications to the substrate-induced respiration method to
permit measurement of microbial biomass in soils of differing water contents. Journal of
Microbiological Methods 5, 177-189.
White, C., J.C. Tardif, A. Adkins and R. Staniforth, 2005. Functional diversity of microbial
communities in the mixed boreal plain forest of central Canada. Soil Biology and
Biochemistry 37, 1359-1372.
Zvyagintsev, D.G., I.P. Bab’eva, T.G. Dobrovol’skaya, G.M. Zenova, L.V. Lysak, T.G. Mirchink,
1993. Vertically layered organization of microbial communities in forest biogenocenoses.
Microbiology: New York 62:1-24


7. Conclusiones Generales

155
EFECTO DEL CAMBIO DE ESPECIE FORESTAL EN LA ESTRUCTURA Y DINÁMICA DE LA MO:
• La dinámica y estructura de la MO del mantillo es diferente bajo cubiertas forestales de roble,
haya o pino bajo condiciones climáticas, geomorfológicas y edáficas similares. La tasa de
descomposición más lenta se observa en el pinar maduro debido principalmente a la calidad
del matillo (pH más acido, ratios de C/N y lignina/N más elevados y mayor concentración de
grupos fenólicos en el horizonte FH). El robledal, con la ausencia total del horizonte FH del
mantillo presenta la tasa de descomposición más rápida mientras que el hayedo presenta una
tasa de descomposición intermedia. La diferencia en la dinámica de la MO en los bosques
seminaturales se debe principalmente a diferencias en la comunidad microbiana. El hayedo con
un porcentaje de humedad más elevado podría tener un ratio de bacteria/hongos más elevado
que el robledal, influyendo de esta manera en la dinámica de la MO.
• El horizonte superficial del suelo (0-5 cm) se percibe más sensible que el subsuperficial (5-15
cm) para detectar los cambios producidos en el funcionamiento del mismo por la
intensificación de la gestión forestal.
• El suelo del pinar maduro presenta valores muy elevados de actividad de fosfatasa ácida y un
alto porcentaje del fosfolípido 18:2ω6 (indicador fúngico) frente al total, reflejando el
importante estrés nutritivo de fósoforo de los pinares.
• El conjunto mínimo de parámetros que mejor describe los cambios producidos en el suelo de
los sistemas forestales estudiados son: físicos como el contenido de agua a capacidad de
campo (-33KPa) y el contenido de agua cuando el 10% de la porosidad del suelo está llena de
aire; químicos como pH y la concentración de fósforo disponible; y biológicos como la
relación entre bacterias Gram+ y Gram- .
• El diámetro medio de agregado (MWD) es mayor en los rodales seminaturales (roble y haya)
que en el pinar maduro.
• La teoría jerarquica de Tisdall y Oades (1982) no se cumple en estas parcelas forestales y la
relación de C-POM/C-total con el MWD nos hace concluir que en este tipo de sistemas la
fracción POM juega un papel de primer orden en la agregación.
• Las diferencias observadas en el estudio particular del mantillo se disipan cuando analizamos
los mantillos sin separación de horizontes y escala de paisaje.
• MicroRespTM parece una metodología adecuada y prometedora para el estudio de la
comunidad microbiana a dicha escala.
ESTRUCTURA Y DINÁMICA DE LA MATERIA ORGÁNICA DEL SUELO EN ECOSISTEMAS FORESTALES TEMPLADOS…
156
EFECTO DE TÉCNICAS DE PREPARACIÓN DE SUELO MECANIZADAS SOBRE LA ESTRUCTURA Y DINÁMICA DE LA MO:
• El establecimiento de plantaciones forestales de pino mediante mecanización intensiva hace
desaparecer la totalidad del mantillo del suelo forestal. La cantidad de mantillo es todavía un
50% menor que en un pinar maduro 16 años después de la mecanización. Además, la tasa de
descomposición de este pinar es mayor que la del maduro y su comunidad microbiana presenta
un índice de diversidad funcional menor.
• El efecto de la mecanización sobre la física del suelo queda reflejada en una gran disminución
del LLWR (Least Limiting Water Range) debido al incremento de la densidad aparente.
Dieciseis años después de la mecanización este indicador de la perturbación física (LLWR)
sigue siendo menor que en el pinar maduro. El LLWR se muestra como un indicador más
robusto frente a las pertubaciones derivadas de la mecanización que el agua útil.
• La mecanización disminuye drásticamente el diámetro medio de agregado (MWD). Este
parámetro parece recuperarse tras 16 años.
• La mecanización disminuye la cantidad de la fracción más lábil de MO (C-POM) que no se ha
recupera tras 16 años y su calidad sigue siendo diferente (C/N-POM). Dicha fracción lábil se
correlaciona positivamente con la respiración microbiana y la mineralización de nitrógeno, por
lo que el efecto de la mecanización en este reservorio puede tener consecuencias en la fertlidad
a largo plazo en las plantaciones forestales mecanizadas.
6. LANDSCAPE-LEVEL PATTERNS OF SOIL MICROBIAL COMMUNITY LEVEL PHYSIOLOGICAL PROFILES IN TEMPERATE FOREST ECOSYSTEMS
157
EFFECT OF SPECIES CHANGE ON ORGANIC MATTER STRUCTURE AND DYNAMICS IN FOREST STANDS:
• The dynamics and structure of forest floor organic matter differ in oak, beech and pine stands
under similar climatic, geomorphological and edaphic conditions. The slowest rate of
decomposition was observed in the mature pine stand, mainly because of the quality of the
humus (more acidic, higher ratios of C/N and lignin/N and higher concentrations of phenolic
groups in the FH horizon than in the other stands). The fastest rate of decomposition was
observed in the oak stand, in which there was no FH horizon. An intermediate rate of
decomposition was observed in the beech stand. The difference in the OM dynamics in semi-
natural forests is mainly due to differences in the microbial community. The moisture content
of the soil under the beech stand was high and therefore the ratio of bacteria/fungi may be
higher than in the oak, which would therefore affect the OM dynamics.
• The surface horizon of the soil (0-5 cm) was more sensitive than the subsurface horizon (5-15
cm) in terms of indicating the changes produced in the functioning by the management
techniques applied.
• High values of acid phosphatase activity and a high percentage of phospholipid 18:2ω6 (a
fungal indicator) were observed in the soil under the mature pine, reflecting the high degree of
nutritive stress on phosphorus in pine stands.
• The minimum set of parameters that best describes the changes produced in the soil in the
forest systems studied were: physical, such as the water content at field capacity (-33KPa) and
the water content when 10% of the soil pores are filled with air; chemical, such as pH and the
concentration of available phosphorus, and biological, such as the ratio between Gram +ve and
Gram-ve bacteria.
• The mean weight diameter (MWD) of the aggregate is higher in the semi-natural stands (oak
and beech) than in the mature pine.
• The hierarchical theory of Tisdall and Oades (1982) does not hold in the forest stands under
study and the relation between POM-C/ total-C and the MWD allows us to conclude that the
POM fraction plays a major role in aggregation.
• The differences observed in the study, particularly as regards the forest floor layer, disappeared
when the forest floor layers were analysed without separating the horizons, and at landscape
scale.
• MicroRespTM appears to be an adequate and promising method for the study of the microbial
community at the landscape scale.
ESTRUCTURA Y DINÁMICA DE LA MATERIA ORGÁNICA DEL SUELO EN ECOSISTEMAS FORESTALES TEMPLADOS…
158
EFFECT OF MECHANIZED SOIL PREPARATION TECHNIQUES ON THE ORGANIC MATTER STRUCTURE AND DYNAMICS:
• The establishment of pine stands by intensive, mechanized techniques results in total loss of
the forest floor layer of the forest soil. The quantity of the forest floor layer was still 50% less
than in a mature pine stand, 16 years after the mechanized treatment. In addition, the rate of
decomposition in this stand was greater than in the mature stand and the functional diversity
index of the microbial community was lower.
• The effects of mechanized treatments on the physical aspects of the soil were reflected in the
large decrease in the LLWR (Least Limiting Water Range) due to the increase in apparent
density. Sixteen years after the mechanized treatment, this indicator of physical disturbance
(LLWR) was still lower than in the mature pine. The LLWR was observed to be a more robust
indicator of the disturbances derived from the mechanized treatments than the available water.
• The mechanized treatments resulted in a drastic decrease in the mean weight diameter (MWD)
of the aggregates. The parameter appeared to have recovered 16 years after stand
establishment.
• The mechanized treatments resulted in a decrease in the amount of the most labile fraction of
the OM (POM-C), which had not recovered 16 years after establishment and the quality still
differed (POM-C/ POM-N). The labile fraction was positively correlated with microbial
respiration and nitrogen mineralization, and therefore the effect of mechanization on this
reservoir may have consequences for the long term fertility of the soils in mechanized forest
stands.
6. LANDSCAPE-LEVEL PATTERNS OF SOIL MICROBIAL COMMUNITY LEVEL PHYSIOLOGICAL PROFILES IN TEMPERATE FOREST ECOSYSTEMS
159
ESPEZIE ALDAKETAREN ERAGINA MATERIA ORGANIKOAREN EGITURA ETA DINAMIKAN BASO-EKOSISTEMETAN:
• Orbelaren egitura eta dinamika ezberdinak dira haritz, pago edo pinupean, nahiz eta baldintza
klimatiko, geomorfologiko eta edafiko antzekoetan garatu. Materia organikoaren
deskonposizio tasarik geldoena pinudian ematen da, batik bat orbelaren kalitatea dela eta (pH
azidoagoa, C/N eta lignina/N erlazio altuagoa eta konposatu fenolikoen kontzentrazio altuagoa
FH horizontean). Hariztiak, FH horizonterik gabe, deskonposizio tasarik bizkorrena du eta
pagadiak tarteko deskonposizio abiadura erakutsi du. Harizti eta pagadiaren arteko
deskonposizio tasa ezberdintasuna orbeleko mikrobio-komunitatearen araberako da. Pagadiak
orbel hezeagoa du eta horrek, hariztiak baino bakterio/onddo erlazio altuagoa izatea suposa
lezake, materia organikoaren dinamikan eraginez.
• Lurzoruko goi horizontea (0-5 cm) baso-jardueren areagotzeak beronen funtzionamenduan
eragiten dituen aldaketak hautemateko sentikorragoa da lurzoruko behe horizontea (5-15 cm)
baino.
• Pinudiko lurzoruak fosfatasa azidoaren eta 18:2ω6 fosfolipidoaren (onddoen indikatzailea)
balio oso altuak erakusten ditu, pinudiek fosforo eskasia dutela bistaratuz.
• Ikertutako baso-ekosistema epeletan, baso-jardueren eraginez lurzoruan sortutako aldaketak
hoberen deskribatzen duen gutxieneko parametro multzoa honakoa da: parametro fisikoak,
lurzoruaren ur edukiera eremu kapazitatean (-33KPa) eta poroen %10 airez beterik
dagoeneakoa; parametro kimikoak, pH eta fosforo erabilgarria; eta parametro biologikoak,
bakterio Gram-positibo eta Gram-negatiboen arteko erlazioa, adibidez.
• Lurzoruko agregatuen batazbesteko diametroa (MWD) handiagoa da harizti eta pagadian
pinudian baino.
• Tisdall eta Oades (1982)-en agregatuen sorkuntzarako teoria hierarkikoa ez da betetzen
ikertutako baso-ekosistemetan. Baso hauetan materia organikoaren frakzioa labilak agregatuen
sorkuntzan papel berezia betetzen duela ondorioztatzen da, C-POM/C-total eta MWD-ren
arteko erlazio sendotik.
• Orbelaren ikerketa zehatzean espezie ezberdinen artean behatutako orbelaren ezaugarrietan
diferentziak desagertu egiten dira ezaugarri hauek paisaia eskala batean neurtzen badira eta
orbela ez bada horizonte ezberdinetan banatzen.
• MicroRespTM metodologia egokia eta etorkizun handikoa da lurzoruko mikrobio
komunitatearen azterketak paisaia eskalan garatzeko.
ESTRUCTURA Y DINÁMICA DE LA MATERIA ORGÁNICA DEL SUELO EN ECOSISTEMAS FORESTALES TEMPLADOS…
160
LURZORU PRESTAKUNTZA MEKANIZATUEN ERAGINA MATERIA ORGANIKOAREN EGITURA ETA DINAMIKAN BASO-EKOSISTEMETAN:
• Baso-landaketak ezartzeko erabilitako baso-jarduera mekanizatuek orbela bere osotasunean
desagertarazten dute eta pinudi heldu batekin alderatuz, oraindik %50 baxuagoa da
mekanizazioa gertatu eta 16 urte beranduago. Gainera, orbelaren deskonposizio tasa altuagoa
eta mikrobio komunitatearen dibertsitate funtzionalaren indizea baxuagoa dira 16 urteko
pinudi honetan pinudi helduan baino.
• Mekanizazioaren eragina lurzoruko egitura fisikoan LLWR (Least Limiting Water Range)
parametro konposatuaren itzelezko murrizketan islatu da, gehienbat itxurazko dentsitatearen
areagotzearen ondorioz. Mekanizazioa gertatu eta hamasei urte beranduago, perturbazio
fisikoaren indikatzaile hau (LLWR) oraindik ere pinudi helduan baino baxuagoa da. LLWR,
mekanizazioak ur erabilgarriaren gainean duen eragina aztertzeko indikatzaile egokia da.
• Lurzoru prestakuntza mekanizatuak lurzoruko agregatuen batazbesteko diametroa (MWD)
izugarri txikitzen du, nahiz eta parametro hau 16 urteren buruan berreskuratu egiten den.
• Mekanizazioak lurzoruko materia organikoaren frakzio labila murrizten du (C-POM) eta
frakzio hau ez da berreskuratzen 16 urteren buruan ez kantitatean ez kalitatean. Gainera,
frakzio labil hau lurzoruko mikrobio biomasaren arnasketarekin eta nitrogeno
mineralizazioarekin positiboki erlazionatzen da, beraz, mekanizazioak materia organikoaren
erreserba honetan izan dezakeen eraginak baso-landeketen epe luzeko emankortasunean
ondorio zuzena izan dezake.
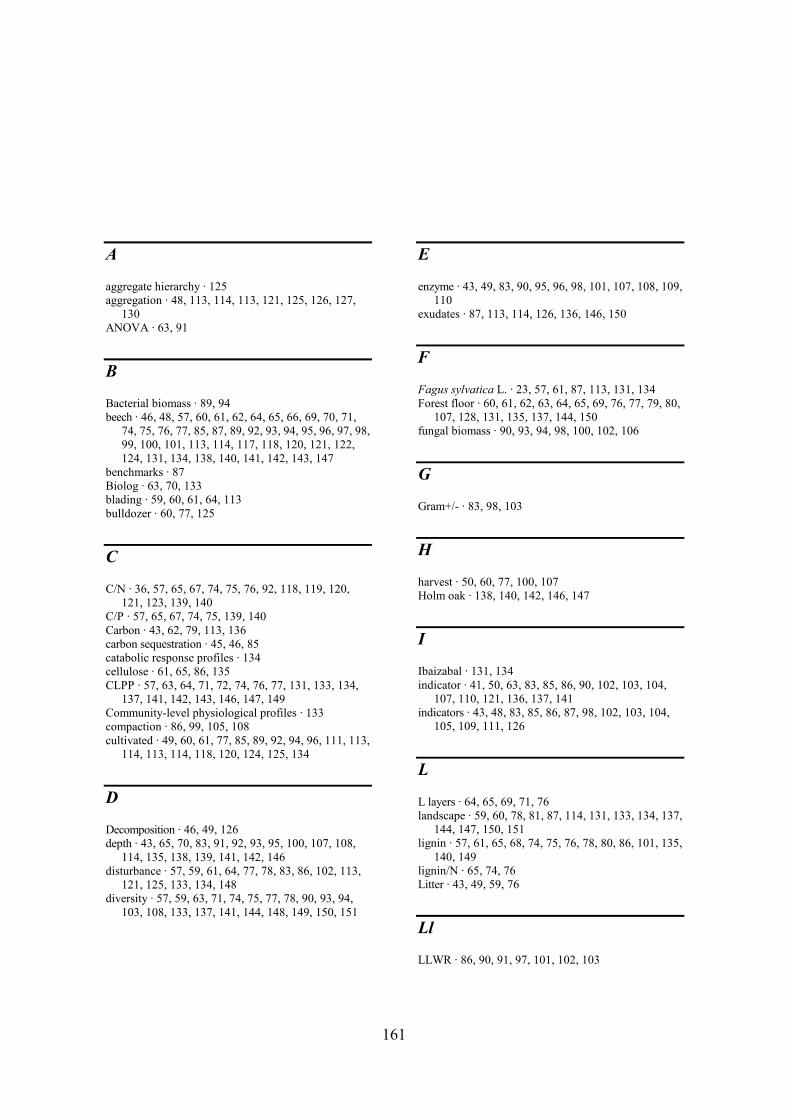
161
A
aggregate hierarchy · 125 aggregation · 48, 113, 114, 113, 121, 125, 126, 127,
130 ANOVA · 63, 91
B
Bacterial biomass · 89, 94 beech · 46, 48, 57, 60, 61, 62, 64, 65, 66, 69, 70, 71,
74, 75, 76, 77, 85, 87, 89, 92, 93, 94, 95, 96, 97, 98, 99, 100, 101, 113, 114, 117, 118, 120, 121, 122, 124, 131, 134, 138, 140, 141, 142, 143, 147
benchmarks · 87 Biolog · 63, 70, 133 blading · 59, 60, 61, 64, 113 bulldozer · 60, 77, 125
C
C/N · 36, 57, 65, 67, 74, 75, 76, 92, 118, 119, 120, 121, 123, 139, 140
C/P · 57, 65, 67, 74, 75, 139, 140 Carbon · 43, 62, 79, 113, 136 carbon sequestration · 45, 46, 85 catabolic response profiles · 134 cellulose · 61, 65, 86, 135 CLPP · 57, 63, 64, 71, 72, 74, 76, 77, 131, 133, 134,
137, 141, 142, 143, 146, 147, 149 Community-level physiological profiles · 133 compaction · 86, 99, 105, 108 cultivated · 49, 60, 61, 77, 85, 89, 92, 94, 96, 111, 113,
114, 113, 114, 118, 120, 124, 125, 134
D
Decomposition · 46, 49, 126 depth · 43, 65, 70, 83, 91, 92, 93, 95, 100, 107, 108,
114, 135, 138, 139, 141, 142, 146 disturbance · 57, 59, 61, 64, 77, 78, 83, 86, 102, 113,
121, 125, 133, 134, 148 diversity · 57, 59, 63, 71, 74, 75, 77, 78, 90, 93, 94,
103, 108, 133, 137, 141, 144, 148, 149, 150, 151
E
enzyme · 43, 49, 83, 90, 95, 96, 98, 101, 107, 108, 109, 110
exudates · 87, 113, 114, 126, 136, 146, 150
F
Fagus sylvatica L. · 23, 57, 61, 87, 113, 131, 134 Forest floor · 60, 61, 62, 63, 64, 65, 69, 76, 77, 79, 80,
107, 128, 131, 135, 137, 144, 150 fungal biomass · 90, 93, 94, 98, 100, 102, 106
G
Gram+/- · 83, 98, 103
H
harvest · 50, 60, 77, 100, 107 Holm oak · 138, 140, 142, 146, 147
I
Ibaizabal · 131, 134 indicator · 41, 50, 63, 83, 85, 86, 90, 102, 103, 104,
107, 110, 121, 136, 137, 141 indicators · 43, 48, 83, 85, 86, 87, 98, 102, 103, 104,
105, 109, 111, 126
L
L layers · 64, 65, 69, 71, 76 landscape · 59, 60, 78, 81, 87, 114, 131, 133, 134, 137,
144, 147, 150, 151 lignin · 57, 61, 65, 68, 74, 75, 76, 78, 80, 86, 101, 135,
140, 149 lignin/N · 65, 74, 76 Litter · 43, 49, 59, 76
Ll
LLWR · 86, 90, 91, 97, 101, 102, 103
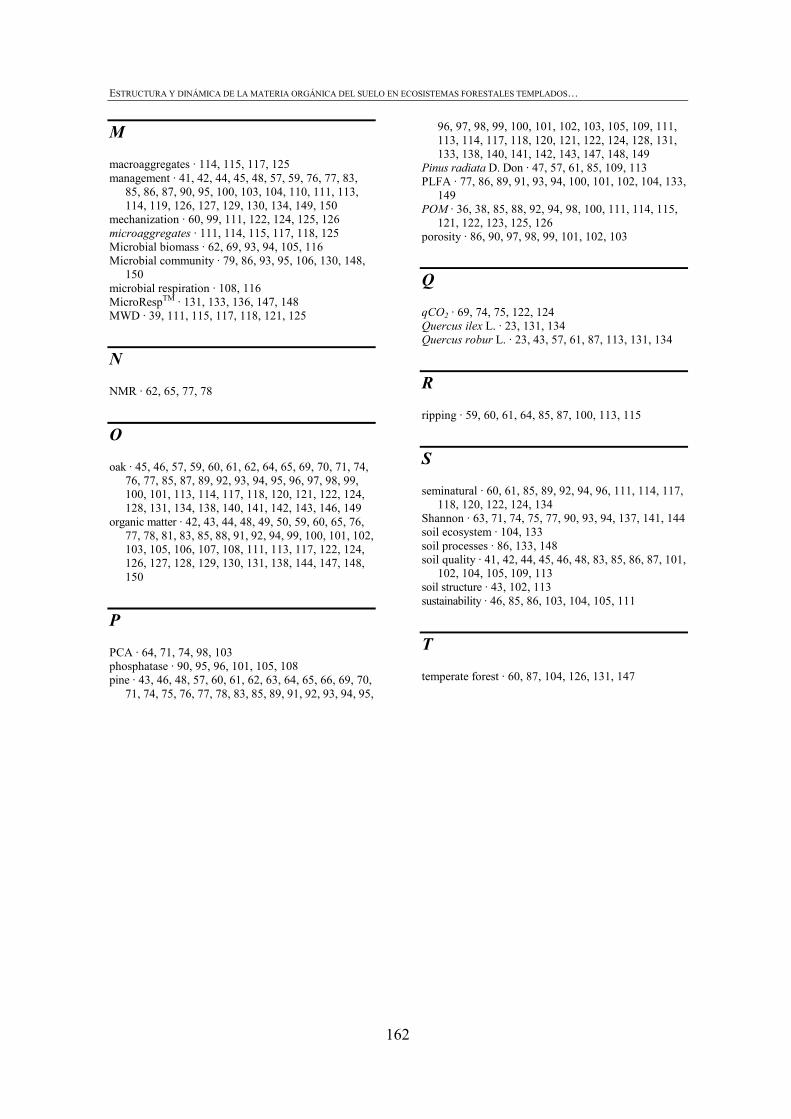
ESTRUCTURA Y DINÁMICA DE LA MATERIA ORGÁNICA DEL SUELO EN ECOSISTEMAS FORESTALES TEMPLADOS…
162
M
macroaggregates · 114, 115, 117, 125 management · 41, 42, 44, 45, 48, 57, 59, 76, 77, 83,
85, 86, 87, 90, 95, 100, 103, 104, 110, 111, 113, 114, 119, 126, 127, 129, 130, 134, 149, 150
mechanization · 60, 99, 111, 122, 124, 125, 126 microaggregates · 111, 114, 115, 117, 118, 125 Microbial biomass · 62, 69, 93, 94, 105, 116 Microbial community · 79, 86, 93, 95, 106, 130, 148,
150 microbial respiration · 108, 116 MicroRespTM · 131, 133, 136, 147, 148 MWD · 39, 111, 115, 117, 118, 121, 125
N
NMR · 62, 65, 77, 78
O
oak · 45, 46, 57, 59, 60, 61, 62, 64, 65, 69, 70, 71, 74, 76, 77, 85, 87, 89, 92, 93, 94, 95, 96, 97, 98, 99, 100, 101, 113, 114, 117, 118, 120, 121, 122, 124, 128, 131, 134, 138, 140, 141, 142, 143, 146, 149
organic matter · 42, 43, 44, 48, 49, 50, 59, 60, 65, 76, 77, 78, 81, 83, 85, 88, 91, 92, 94, 99, 100, 101, 102, 103, 105, 106, 107, 108, 111, 113, 117, 122, 124, 126, 127, 128, 129, 130, 131, 138, 144, 147, 148, 150
P
PCA · 64, 71, 74, 98, 103 phosphatase · 90, 95, 96, 101, 105, 108 pine · 43, 46, 48, 57, 60, 61, 62, 63, 64, 65, 66, 69, 70,
71, 74, 75, 76, 77, 78, 83, 85, 89, 91, 92, 93, 94, 95,
96, 97, 98, 99, 100, 101, 102, 103, 105, 109, 111, 113, 114, 117, 118, 120, 121, 122, 124, 128, 131, 133, 138, 140, 141, 142, 143, 147, 148, 149
Pinus radiata D. Don · 47, 57, 61, 85, 109, 113 PLFA · 77, 86, 89, 91, 93, 94, 100, 101, 102, 104, 133,
149 POM · 36, 38, 85, 88, 92, 94, 98, 100, 111, 114, 115,
121, 122, 123, 125, 126 porosity · 86, 90, 97, 98, 99, 101, 102, 103
Q
qCO2 · 69, 74, 75, 122, 124 Quercus ilex L. · 23, 131, 134 Quercus robur L. · 23, 43, 57, 61, 87, 113, 131, 134
R
ripping · 59, 60, 61, 64, 85, 87, 100, 113, 115
S
seminatural · 60, 61, 85, 89, 92, 94, 96, 111, 114, 117, 118, 120, 122, 124, 134
Shannon · 63, 71, 74, 75, 77, 90, 93, 94, 137, 141, 144 soil ecosystem · 104, 133 soil processes · 86, 133, 148 soil quality · 41, 42, 44, 45, 46, 48, 83, 85, 86, 87, 101,
102, 104, 105, 109, 113 soil structure · 43, 102, 113 sustainability · 46, 85, 86, 103, 104, 105, 111
T
temperate forest · 60, 87, 104, 126, 131, 147
TESIS DOCTORALES PUBLICADAS
Nº 1. La raza Latxa: Sistemas de producción y características reproductivas. Eduardo uriartE EgurcEgui
Nº 2. Estudio y puesta a punto de un método simplificado de control lechero cualitativo en la raza ovina Latxa y su inclusión en el plan de selección. gustavo adolfo Maria lEvrino
Nº 3. Implicaciones tecnológicas de la composición química del pescado con especial referencia a los lípidos. rogElio Pozo carro
Nº 4. Estudio de suelos de Vizkaia. Margarita doMingo urartE
Nº 5. El Maedi o neumonía progresiva en el conjunto de las enfermedades respiratorias crónicas del ganado ovino en la Comunidad Autónoma Vasca. lorEnzo gonzálEz angulo
Nº 6. Estudio experimental de las fases iniciales de la paratuberculosis ovina. raMón a. JustE Jordan
Nº 7. Identificación, origen y factores fisicoquímicos que condicionan la contaminación por elementos metálicos de sedimentos de ríos. Estilita ruiz roMEra
Nº 8. Análisis financiero de proyectos de inversión en repoblaciones forestales. álavaro aunos góMEz
Nº 9. Desarrollo y evaluación del sistema integrado de diagnóstico y recomendación (DRIS) para la fertilización de las praderas permanentes. Marta Rodríguez Julia
Nº 10. Estudio de las mieles producidas en la Comunidad Autónoma del País Vasco. María tErEsa sancho ortiz
Nº 11. La biomasa microbiana como agente de las transformaciones de nitrógeno en el suelo tras el enterrado de la paja de cereal. JEsús ángEl ocio arMEntia
Nº 12. Análisis jurídico y económico de la implementación de la política agraria comunitaria en la Comunidad Autónoma del País Vasco. BEatriz PérEz dE las hEras
Nº 13. Nemátodos formadores de quistes (Globodera spp.) en patata (Solanum tuberosum L.): caracteri-zación taxonómica, reproducción y actividad de las formas juveniles. azucEna salazar Bayona
Nº 14. Ensayo comparativo de tres métodos de tratamiento antihelmítico estratégico en rebaños de ove-jas latxas. ana luisa gracia PérEz
Nº 15. Estudio sobre una encefalitis vírica similar al Louping-ill en el ganado ovino de la Comunidad Autónoma Vasca. daniEl fErnándEz dE luco Martinéz
Nº 16. Análisis de caracteres involucrados en la selección y mejora de Lupinus hispanicus Boiss. et Reuter. vErónica arriEta Pico
Nº 17. Contribución al estudio de fermentaciones artesanales e industriales de Rioja Alavesa. Milagros viñEgra garcía
Nº 18. Estudio del manejo de la alimentación en los rebaños ovinos de raza Latxa y su influencia sobre los resultados reproductivos y de producción de leche. luis Mª. orEgui lizarraldE
Nº 19. El sector pesquero vizcaíno, 1800-1960. Análisis de la interacción de los elementos ambiental, extractivo y comercial en la pesquería. José agustín Maiz alcorta
Nº 20. Epidemiología, diagnóstico y control de la paratuberculosis ovina en la Comunidad Autónoma del País Vasco. J. J. aduriz rEcaldE
Nº 21. Agrupación de poblaciones locales de maíz (Zea mays L.) mediante caracteres morfológicos y parámetros ambientales. José ignacio ruiz dE galarrEta góMEz
Nº 22. Estudio del potencial melífero de Bizkaia. aMElia cErvEllo MartínEz
Nº 23. Influencia de los procesos de salado y ahumado sobre las características fisicoquímicas del queso Idiazabal (compuestos nitrogenados). francisco c. iBañEz Moya
Nº 24. El Euskal Artzain Txakurra (el perro pastor vasco) descripción y tipificación racial. Mariano góMEz fErnándEz
Nº 25. Evaluación de diferentes ciclos de selección recurrente en dos poblaciones sintéticas de maíz. gotzonE garay solachi
Nº 26. Valoración agronómica de la gallinaza: Compostaje. adolfo MEnoyo PuEllEs
Nº 27. Relación clima-vegetación en la Comunidad Autónoma del País Vasco. aMElia ortuBay fuEntEs
Nº 28. Influencia de los procesos de salado y ahumado tradicional sobre las características microbioló-gicas y organolépticas del queso Idiazabal. francisco J. PérEz Elortondo
Nº 29. Mastitis en la oveja Latxa: epidemiología, diagnóstico y control. Juan c. Marco MElEro
Nº 30. Contribución al conocimiento anatomopatológico y diagnóstico de la tuberculosis caprina y ovina por Mycobacterium bovis. M.ª MontsErrat gutiérrEz cancEla
Nº 31. Estudio de factores que pueden influir en la calidad de la pluma de gallos Eusko-oiloa (Variedad Marradune) para la fabricación de moscas artificiales utilizadas en la pesca de la trucha. rosa M.ª Echarri toMé
Nº 32. Estudio de la fracción lipídica durante la maduración del queso Idiazabal. Influencia de los pro-cesos tecnológicos del tiempo de permanencia en salmuera y ahumado. ana isaBEl náJEra ortigosa
Nº 33.- Influencia del tipo de cuajo y adición de cultivo iniciador sobre los compuestos nitrogenados durante la maduración del queso Idiazabal. M.ª solEdad vicEntE Martín
Nº 34. Estudio de la infección por Borrelia burgdorferi, grupo Ehrlichia phagocytophila y virus de la encefalitis ovina en las poblaciones de ixódidos de la Comunidad Autónoma Vasca. Marta Barral lahidalga
Nº 35. Lipolisis en el queso Idiazabal: efecto de la época de elaboración, del cultivo iniciador, de la pasteurización y del tipo de cuajo. fElisa chavarri díaz dE cErio
Nº 36. Aspectos inmunopalógicos de la paratuberculosis de los pequeños rumiantes. Respuesta inmune asociada a la vacunación. Juan ManuEl corPa arEnas
Nº 37. Desarrollo y evaluación de nuevas técnicas de diagnóstico del Maedi-Visna. ana BElén ExtraMiana alonso
Nº 38. Estudios sobre Patogenia y Diagnóstico de la Adenomatosis Pulmonar Ovina. María MErcEdEs garcía goti
Nº 39. Análisis de los factores de explotación que afectan a la producción lechera en los rebaños de raza Latxa de la CAPV. roBErto J. ruiz santos
Nº 40. Crecimiento y producción de repoblaciones de Pinus radiata D. Don en el Territorio Histórico de Gipuzkoa (País Vasco). luis Mario chauchard Badano
Nº 41. Puesta a punto de técnicas PCR en heces y de Elisa para el diagnóstico de la Paratuberculosis. Estudio de prevalencia en ganado bovino. JosEBa M. garrido urkullu
Nº 42. Epidemiología y diagnóstico de la leptospirosis y la neosporosis en explotaciones de bovino lechero de la CAPV. raquEl achaErandio galdos
Nº 43. Relaciones aire-agua en sustratos de cultivo como base para el control del riego. Metodología de laboratorio y modelización. valEntín tErés tErés
Nº 44. Zonas endémicas de enfermedad de Lyme en la CAPV: estudio del papel de los micromamíferos en el mantenimiento de Borrelia burgdorferi sensu lato en el medio natural. horacio gil gil
Nº 45. Optimización del esquema de mejora de la raza Latxa: análisis del modelo de valoración e intro-ducción de nuevos caractéres en el objetivo de selección. andrés lEgarza alBizu
Nº 46. Influencia de las condiciones de almacenamiento, reimplantación y lluvia ácida en la viabilidad de Pinus radiata D. Don. MirEn aMaia MEna PEtitE
Nº 47. Estudio sobre encefalopatías en peces: patogenicidad del nodavirus causante de la enfermedad y retinopatía vírica (ERV) y transmisión experimental del prión scrapie a peces. raquEl arangurEn ruiz
Nº 48. Enfermedades transmitidas por semilla en judía-grano (Phaseolus vulgaris L.): detección, control sanitario y mejora genética. ana María díEz navaJas
Nº 49. Pastoreo del ganado vacuno en zonas de montaña y su integración en los sistemas de producción de la CAPV. nErEa Mandaluniz astigarraga
Nº 50. Aspectos básicos de la mejora genética de patata (Solanum tuberosum L.) a nivel diploide. lEirE Barandalla urtiaga
nº 51. El cuajo de cordero en pasta: preparación y efecto en los procesos proteolíticos y lipolíticos de la maduración del queso de Idiazabal. Mª. ángElEs BustaMantE gallEgo
Nº 52. Dinámica de la población de atún blanco (Thunnus alalunga Bonnaterre 1788) del Atlántico Norte. Josu santiago Burrutxaga
nº 53. El pino radiata (Pinus radiata D.Don) en la historia forestal de la Comunidad Autónoma de eus-kadi. Análisis de un proceso de forestalismo intensivo. Mario MichEl rodríguEz
nº 54. Balance hídrico y mineral del pimiento de Gernika (Capsicum annuum L., cv Derio) en cultivo hidropónico. Relaciones con la producción. hugo Macía olivEr
nº 55. Desarrollo de métodos moleculares y su aplicación al estudio de la resistencia genética y patoge-nia molecular del Scrapie. david garcía crEsPo
nº 56. Estudio epidemiológico y experimental de la transmisión y control del virus Maedi-Visna en ovino lechero de raza Latxa del País Vasco. vEga álvarEz MaiztEgui
nº 57. Desarrollo y aplicación de técnicas de diagnóstico serológico para el estudio de la transmisión calostral y horizontal del virus Maedi-Visna (VMV) en ovino. Mara Elisa daltaBuit tEst
nº 58. Integral Study of Calving Ease in Spanish Holstein Population. EvangElina lóPEz dE Maturana lóPEz dE lacallE
nº 59. Caracterización Molecular, Detección y Resistencia de Mycobacterium avium subespecie paratu-berculosis. ikEr sEvilla agirrEgoMoskorta
nº 60. Desarrollo de un sistema de fertilización nitrogenada racional en trigo blando de invierno bajo condiciones de clima mediterráneo húmedo. M.ª arritokiEta ortuzar iragorri

P.V.P.: 12 E
ISBN: 978-84-457-2960-1
9 788445 729601