Embed Size (px)
Citation preview
UNIVERSIDAD DE LAS PALMAS DE GRAN CANARIA
DOCTORADO EN EMPRESA, INTERNET Y TECNOLOGÍAS DE LAS
COMUNICACIONES
MODELOS DE PREDICCIÓN METEOROLÓGICA
BASADOS EN MÉTODOS DE CLASIFICACIÓN
ORIENTADOS A LA MEJORA DE LA EFICIENCIA
ENERGÉTICA EN LOS PROCESOS DE GENERACIÓN
TESIS DOCTORAL
José Gustavo Hernández Travieso
Octubre de 2018
Las Palmas de Gran Canaria


� UNIVERSIDAD DE LAS PALMASf ""1ti. DE GRAN CANARIA
D. Miguel Ángel Ferrer Ballester COORDINADOR DELPROGRAMA DEDOCTORADO Empresa, Internet y Tecnologías de la Información y
Comunicaciones DE LA UNIVERSIDAD DE LAS PALMAS DE GRAN CANARIA,
INFORMA,
Que la Comisión Académica del Programa de Doctorado,
en su sesión de fecha 12 de septiembre de 2018, tomó el acuerdo de dar el consentimiento para su tramitación, a la tesis doctoral titulada "Modelos de predicción meteorológica basados en métodos de clasificación orientados a la mejora de la eficiencia energética en los procesos de generación" presentada por el doctorando D. José Gustavo Hernández Travieso y dirigida por el Doctor D. Carlos Manuel Travieso González
Y para que así conste, y a efectos de lo previsto en el Artº 11 del Reglamento de Estudios de Doctorado (BOULPGC 7/10/2016) de la Universidad de Las Palmas de Gran Canaria, firmo la presente en Las Palmas de Gran Canaria, a doce de septiembre de dos mil dieciocho


,.., UNIVERSIDAD DE LAS PALMASf "" DE GRAN CANARIA
UNIVERSIDAD DE LAS PALMAS DE GRAN CANARIA
ESCUELA DE DOCTORADO
Programa de doctorado EMPRESA, INTERNET Y TECNOLOGÍAS DE LAS COMUNICACIONES
Título de la Tesis
MODELOS DE PREDICCIÓN METEOROLÓGICA BASADOS EN MÉTODOS DE CLASIFICACIÓN ORIENTADOS A LA MEJORA DE LA EFICIENCIA ENERGÉTICA EN LOS PROCESOS DE GENERACIÓN
Tesis Doctoral presentada por D. JOSÉ GUSTAVO HERNÁNDEZ TRAVIESO
Dirigida por el Dr. D. CARLOS MANUEL TRAVIESO GONZÁLEZ
El Director, El Doctorando,
Las Palmas de Gran Canaria, OCTUBRE de 2018


A mis padres…
Y a ti por cambiarme la vida…


Agradecimientos
“El saber a quién ves hace que la distancia no sea un problema…”
Quiero agradecer desde estas líneas a todas las personas que
han ayudado a lo largo de toda mi vida a alcanzar este objetivo, algo que jamás llegué a imaginar cuando años atrás abandoné la carrera con la sensación de haber fracasado y de haber decepcionado…
Años después, al volver en un intento de probar si algo había cambiado en mí, pude comprobar que todo aquello que me generaba ansiedad y desesperación fue superado y logré el objetivo inicial…
Ahora, al acabar esta etapa formativa, miro hacia atrás y sé que todo ese camino de espinas, dudas y estrés valió la pena…
Teleco me ha cambiado la vida…
Muchas gracias a mis padres por todo el amor incondicional y el apoyo que siempre me han dado sin dejar de confiar en mis posibilidades…
Gracias a ti, que estás leyendo esto y sabes bien quién eres. El mundo es maravilloso gracias a ti…
Gracias a mi familia por estar siempre animando…
Gracias a mis amigos, los verdaderos, por ser amigos y estar ahí…
Gracias a mi Tutor/Director y acompañante en todo este camino a lo largo del PFC, TFM y Tesis Doctoral, Carlos Travieso por tus palabras, ánimo, dedicación, paciencia y comprensión…
GRACIAS A TODOS, SIN VOSOTROS NADA DE ESTO HUBIERA SIDO POSIBLE…

MODELOS DE PREDICCIÓN METEOROLÓGICA BASADOS EN MÉTODOS DE CLASIFICACIÓN ORIENTADOS A LA MEJORA
DE LA EFICIENCIA ENERGÉTICA EN LOS PROCESOS DE GENERACIÓN.
TESIS DOCTORAL JOSÉ GUSTAVO HERNÁNDEZ TRAVIESO
I
Índice
Introducción ..................................................................................................................... 1
Estado del Arte .............................................................................................................. 3
Hipótesis ..................................................................................................................... 14
Objetivo ....................................................................................................................... 14
Metodología ................................................................................................................ 17
Unidad temática de la Tesis Doctoral por Compendio de Publicaciones ................... 26
Presentación de los trabajos publicados .................................................................... 28
Trabajos publicados ........................................................................................................ 31
Resumen Artículo “Modeling a robust wind-speed forecasting to apply to wind-energy
production” ................................................................................................................. 33
Resumen Artículo “Neural networks fusion for temperature forecasting” ............... 41
Resumen Artículo “Temperature Control by Its Forecasting Applying Score Fusion for
Sustainable Development” ......................................................................................... 49
Modeling a robust wind-speed forecasting to apply to wind-energy production ..... 57
Neural networks fusion for temperature forecasting ................................................ 75
Temperature Control by Its Forecasting Applying Score Fusion for Sustainable
Development .............................................................................................................. 89
Discusión ................................................................................................................... 109
Conclusiones ................................................................................................................. 115
Bibliografía .................................................................................................................... 121
Anexo I .......................................................................................................................... 131
Anexo II ......................................................................................................................... 133

MODELOS DE PREDICCIÓN METEOROLÓGICA BASADOS EN MÉTODOS DE CLASIFICACIÓN ORIENTADOS A LA
MEJORA DE LA EFICIENCIA ENERGÉTICA EN LOS PROCESOS DE GENERACIÓN.
TESIS DOCTORAL JOSÉ GUSTAVO HERNÁNDEZ TRAVIESO
II
MODELOS DE PREDICCIÓN METEOROLÓGICA BASADOS EN MÉTODOS DE CLASIFICACIÓN ORIENTADOS A LA
MEJORA DE LA EFICIENCIA ENERGÉTICA EN LOS PROCESOS DE GENERACIÓN.
TESIS DOCTORAL JOSÉ GUSTAVO HERNÁNDEZ TRAVIESO
II
Índice de Ilustraciones
Ilustración 1: Ejemplo de nota explicativa de los datos de temperatura. ..................... 19
Ilustración 2: Ejemplo de datos contenidos en base de datos original. ......................... 20
Ilustración 3: Ventana deslizante. .................................................................................. 24
Ilustración 4: Diagrama de bloques del Modelo Predictivo. .......................................... 28
Ilustración 5: Diagrama de bloques del Modelo Predictivo para el artículo Modeling a
robust wind-speed forecasting to apply to wind-energy production ....... 29
Ilustración 6: Diagrama de bloques del Modelo Predictivo para el artículo Neural
networks fusion for temperature forecasting .......................................... 29
Ilustración 7: Diagrama de bloques del Modelo Predictivo para el artículo Temperature
Control by Its Forecasting Applying Score Fusion for Sustainable
Development. ............................................................................................ 30
Ilustración 8: Radiación solar en el Aeropuerto de Gran Canaria, utilizando el modelo
predictivo entrenado para el Aeropuerto Tenerife Sur. ......................... 131
Ilustración 9: Velocidad del viento en el Aeropuerto de Tenerife Sur, utilizando el modelo
predictivo entrenado para el Aeropuerto Gran Canaria. ........................ 132

MODELOS DE PREDICCIÓN METEOROLÓGICA BASADOS EN MÉTODOS DE CLASIFICACIÓN ORIENTADOS A LA
MEJORA DE LA EFICIENCIA ENERGÉTICA EN LOS PROCESOS DE GENERACIÓN.
TESIS DOCTORAL JOSÉ GUSTAVO HERNÁNDEZ TRAVIESO
II
MODELOS DE PREDICCIÓN METEOROLÓGICA BASADOS EN MÉTODOS DE CLASIFICACIÓN ORIENTADOS A LA
MEJORA DE LA EFICIENCIA ENERGÉTICA EN LOS PROCESOS DE GENERACIÓN.
TESIS DOCTORAL JOSÉ GUSTAVO HERNÁNDEZ TRAVIESO
III
Índice de Tablas
Tabla 1: Dimensiones de los ficheros proporcionados por AEMET. .............................. 20
Tabla 2: Unidades en que se presentan los datos de la AEMET. .................................... 21
Tabla 3: Número de muestras por estación y año. ........................................................ 23
Tabla 4: Unidades de los datos utilizados en los experimentos. .................................... 25
Tabla 5: Comparativa de los resultados obtenidos en Predicción de Temperatura. ... 110
Tabla 6: Comparativa de los resultados obtenidos en Predicción de Velocidad del Viento.
...................................................................................................................................... 110
Tabla 7: Comparativa de los resultados obtenidos en Predicción de Radiación Solar 111

MODELOS DE PREDICCIÓN METEOROLÓGICA BASADOS EN MÉTODOS DE CLASIFICACIÓN ORIENTADOS A LA
MEJORA DE LA EFICIENCIA ENERGÉTICA EN LOS PROCESOS DE GENERACIÓN.
TESIS DOCTORAL JOSÉ GUSTAVO HERNÁNDEZ TRAVIESO
IV

MODELOS DE PREDICCIÓN METEOROLÓGICA BASADOS EN MÉTODOS DE CLASIFICACIÓN ORIENTADOS A LA
MEJORA DE LA EFICIENCIA ENERGÉTICA EN LOS PROCESOS DE GENERACIÓN.
TESIS DOCTORAL JOSÉ GUSTAVO HERNÁNDEZ TRAVIESO
IV
Glosario
AEMET: Agencia Estatal de Mateorología.
ANN: Red Neuronal Artificial (Artificial Neural Network).
ARIMA: Modelo Autorregresivo Integrado de Media Móvil (Autoregressive
Integrated Moving Average).
ARMA: Modelo Autorregresivo de Media Móvil (Autoregressive Moving
Average).
BP: Propagación hacia atrás (Back-propagation).
DBN: Red de Creencia Profunda (Deep Belief Network).
DSS: Sistema de Soporte a las Decisiones (Decision Support System).
ESN: Echo State Network.
GA: Algoritmo genético (Genetic Algorithm).
GC: Aeropuerto de Gran Canaria.
IF: Índice de impacto (Impact Factor).
JCR: Journal Citation Report.
kJ/m2: Kilojulio por metro cuadrado.
km: Kilómetro.
km/h: Kilómetro por hora.
kWh/ m2: Kilovatio hora por metro cuadrado.
MAE: Error Medio Absoluto (Mean Absolute Error).
mm: Milímetro.
m/s: Metro por segundo.
NWP: Predicciones Numéricas del Tiempo (Numerical Weather Predictions).
sg: Segundo
SVM: Máquina de Soporte Vectorial (Support Vector Machine).
SVR: Regresión de Soporte Vectorial (Support Vector Regression).
TF: Aeropuerto Tenerife Sur.
W/m2: Vatio por metro cuadrado.

MODELOS DE PREDICCIÓN METEOROLÓGICA BASADOS EN MÉTODOS DE CLASIFICACIÓN ORIENTADOS A LA
MEJORA DE LA EFICIENCIA ENERGÉTICA EN LOS PROCESOS DE GENERACIÓN.
TESIS DOCTORAL JOSÉ GUSTAVO HERNÁNDEZ TRAVIESO
IV

MODELOS DE PREDICCIÓN METEOROLÓGICA BASADOS EN MÉTODOS DE CLASIFICACIÓN ORIENTADOS A LA
MEJORA DE LA EFICIENCIA ENERGÉTICA EN LOS PROCESOS DE GENERACIÓN.
TESIS DOCTORAL JOSÉ GUSTAVO HERNÁNDEZ TRAVIESO
1
Introducción
A raíz de la observación de las condiciones medioambientales existentes en
Gran Canaria, donde es posible estar en Tejeda, la cumbre de la isla, con los pies en la
nieve, cuando ésta llega, y ver al fondo el paisaje de las Dunas de Maspalomas con un
sol radiante, surge la inquietud de intentar investigar la variabilidad climática existente
en las Islas Canarias.
En las Islas Canarias se dan cada cierto tiempo una serie de alertas y avisos a la
población por condiciones meteorológicas adversas que en ocasiones no causan los
efectos pronosticados a priori, y viceversa, no se dan avisos y sin embargo se producen
fenómenos que causan gran cantidad de daños.
Además, y fruto de la ubicación geográfica de las Islas Canarias, con zonas donde
existen vientos fuertes y en las que el sol forma parte del coexistir diario de los canarios,
se abre la posibilidad de generar energía mediante la utilización de fuentes renovables,
mucho más limpias con el medio ambiente y sin la preocupación por su durabilidad
como ocurre con las fuentes provenientes de combustibles fósiles.

MODELOS DE PREDICCIÓN METEOROLÓGICA BASADOS EN MÉTODOS DE CLASIFICACIÓN ORIENTADOS A LA
MEJORA DE LA EFICIENCIA ENERGÉTICA EN LOS PROCESOS DE GENERACIÓN.
TESIS DOCTORAL JOSÉ GUSTAVO HERNÁNDEZ TRAVIESO
2
Es por todo lo anteriormente expuesto, que surge la motivación de realizar un
estudio de las condiciones meteorológicas para, a través de una eficiente y precisa
predicción, servir de herramienta de apoyo en la generación de energías renovables.
Ante esta motivación se realiza un estudio acerca de los diferentes modos de
realizar una predicción meteorológica. Se observa que éstas se realizan en su gran
mayoría haciendo uso de imágenes satélite, imágenes radar y diversas herramientas de
análisis matemático. Por tanto son medios costosos y que requieren de una
infraestructura de grandes dimensiones, además de ser predicciones para unas zonas
geográficas muy amplias.
Además este sistema será de predicciones a corto plazo, ya que queda
comprobada la importancia de obtener predicciones precisas que cumplan esta
característica en los procesos de generación energéticos [IIC, 2016a; IIC 2016b;
ITC, 2018; ULL, 2018]
La presente Tesis Doctoral por Compendio de Publicaciones sigue la siguiente
distribución.
En primer lugar, la Introducción, que contiene además el Estado del Arte,
Hipótesis, Objetivo, Metodología, justificación de la Unidad temática de la Tesis Doctoral
por Compendio de Publicaciones y Presentación de los trabajos publicados.
En segundo lugar se adjuntan los trabajos publicados. Habida cuenta de que han
sido publicados en lengua inglesa, se presenta primeramente un resumen de cada uno
de ellos en español. Seguidamente se añaden las copias de los trabajos contenidos en el
Compendio de Publicaciones, y se termina con un apartado de Discusión.
En tercer lugar se presentan las Conclusiones de esta Tesis Doctoral, incluyendo
las líneas futuras.
En cuarto lugar se muestra la bibliografía utilizada para la redacción de esta Tesis
Doctoral por Compendio de Publicaciones.
Seguidamente, y para finalizar, se presentan los Anexos I y II.
Una vez acabada esta introducción, se continúa con el Estado del Arte

MODELOS DE PREDICCIÓN METEOROLÓGICA BASADOS EN MÉTODOS DE CLASIFICACIÓN ORIENTADOS A LA
MEJORA DE LA EFICIENCIA ENERGÉTICA EN LOS PROCESOS DE GENERACIÓN.
TESIS DOCTORAL JOSÉ GUSTAVO HERNÁNDEZ TRAVIESO
3
Estado del Arte
Dentro de la gran cantidad de estudios realizados, y teniendo en cuenta que esta
Tesis Doctoral es por Compendio de Publicaciones, se presentan los siguientes trabajos,
incluyendo algunas patentes relacionadas:
En [Ellouz et al., 2009], se utilizaron Redes Neuronales Artificiales (Artificial
Neural Network, ANN) para proponer una herramienta que ayudará a evaluar los
aspectos del intercambio de calor entre el subsuelo y el aire a fin de lograr una mejora
en las condiciones climáticas de un edificio de viviendas situado en la localidad tunecina
de Sfax. Obtuvieron un error en las predicciones de 1°C. Logrando de este modo una
mejora energética en las viviendas, ya que el consumo se ve reducido debido a la
utilización de tuberías enterradas que consiguen refrescar o calentar el ambiente
mediante el balance térmico del aire circulante por su interior.
En [Shu et al., 2010], se realizó un pronóstico de carga de los sistemas de
generación eléctrica en una instalación del Medio-Oeste norteamericano en un área
extensa considerando predicciones meteorológicas. Basándose en ellas, obtuvieron un
pronóstico de carga bastante preciso, colaborando a la eficiente generación eléctrica en
los momentos puntuales de mayor demanda energética.
En [Rastogi et al., 2011], se utilizó análisis de patrones para obtener una
predicción de temperatura mediante ANN. Los resultados obtenidos, demostraron la
eficiencia del modelo propuesto, consiguiendo una gran precisión del comportamiento
de la representación de la predicción de temperaturas.
En [Chen y Xu, 2011], mediante la utilización de ANN, se realizó un modelo para
la predicción de la temperatura y la humedad en las vías interiores de los túneles de las
minas de carbón. Los resultados obtenidos tenían un rango de error del 0.2% al 4.9%,
los cuales estaban dentro de los límites de precisión marcados por dicho proyecto.
En [Demirtas et al, 2012], se desarrolló un predictor de la radiación solar. Para
ello se hizo uso de datos meteorológicos como humedad exterior, temperatura exterior,
y presión barométrica para intentar predecir los niveles de radiación solar que pudieran
MODELOS DE PREDICCIÓN METEOROLÓGICA BASADOS EN MÉTODOS DE CLASIFICACIÓN ORIENTADOS A LA
MEJORA DE LA EFICIENCIA ENERGÉTICA EN LOS PROCESOS DE GENERACIÓN.
TESIS DOCTORAL JOSÉ GUSTAVO HERNÁNDEZ TRAVIESO
4
colaborar a la generación de energía fotovoltaica. La utilización de clasificadores
basados en los k vecinos más cercanos, permitió obtener mejores resultados que otros
estudios que hacían uso de otros tipos de clasificadores.
En [Routh et al., 2012], se estudia el uso de ANN para estudiar el impacto que
sobre las células fotovoltaicas posee la temperatura. Con ello buscaban conseguir mejor
eficiencia de las mismas, ya que es precisamente la temperatura uno de los factores que
afectan a su correcto rendimiento. A la vista de los resultados obtenidos, se comprobó
la efectividad de utilizar ANN para tal fin.
En [Vásquez et al., 2012], se desarrolló un sistema de predicción meteorológica
basado en diferentes datos meteorológicos. Para ello utilizaron ANN multicapa,
alcanzando muy buenos resultados, ya que la temperatura resultante de la predicción
variaba en solo 0.28°C respecto a la real. En él se utilizó una base de datos con
parámetros relativos a la época húmeda o no del año, parámetro importante teniendo
en cuenta que se desarrolló en Costa Rica, que es un país tropical donde son ésas las
épocas predominantes. De igual modo, contaba con datos precisos y continuados de
radiación solar.
En [Huang et al., 2013], se utilizan modelos basados en ANN para realizar una
predicción de temperatura en diversas zonas del Aeropuerto de Adelaida (Australia).
Esto es debido a que el comportamiento térmico de un edificio no es lineal, ya que
puede variar de un punto a otro. En este estudio, el error obtenido fue de 1°C.
En [Bao et al., 2014], se propuso una estrategia de modelado basada en
optimización por enjambre de partículas basada en múltiples entradas y salidas, que
tenía la capacidad de determinar el número de sub-modelos en un modo auto-
adaptativo, con predicciones variables. La estrategia se validó con datos reales y
simulados.
En [Li X.F. et al., 2016], se utilizaron ANN para obtener la predicción de
temperatura en el interior de un invernadero en la época estival en China. Los resultados
obtenidos mostraban un error cuadrático medio de 0.01°C.
MODELOS DE PREDICCIÓN METEOROLÓGICA BASADOS EN MÉTODOS DE CLASIFICACIÓN ORIENTADOS A LA
MEJORA DE LA EFICIENCIA ENERGÉTICA EN LOS PROCESOS DE GENERACIÓN.
TESIS DOCTORAL JOSÉ GUSTAVO HERNÁNDEZ TRAVIESO
5
En [McKinney et al., 2015], se realizó una investigación para estudiar eventos
climatológicos extremos, entre otros, temperaturas inusualmente altas y bajas.
Alcanzaron un éxito superior al 90%.
En [Prashanthi et al., 2016], se propone un modelo predictivo capaz de obtener
con entre 24 y 48 horas de antelación, temperaturas extremadamente altas utilizando
para ello parámetros meteorológicos.
En [Aral y Guan, 2016] se comprueba la importancia de la temperatura superficial
del mar en relación con el nivel del mar. Esto es debido a que estos parámetros están
relacionados con el incremento del nivel del mar que se observa en la actualidad. A esta
misma conclusión llegaron [Arora y Dash, 2016], el contraste de la temperatura del mar
y el aire contribuye igualmente a alimentar el efecto destructivo de los sistemas de
ciclones tropicales.
En [Pérez et al., 2016], se realiza una predicción de temperatura utilizando
Máquinas de Soporte Vectorial (Support Vector Machines, SVM) obteniendo un error
cuadrático medio de 0.09 °C.
En [Xingpei et al., 2009] se utilizan ANN para realizar predicciones de velocidad
del viento, como mejor resultado y utilizando el algoritmo back-propagation (BP) con
algoritmo genético (GA) fue de 1.33 metros por segundo (m/s) para una predicción a
una hora.
En [Zhao et al., 2010] se utiliza Regresión de Soporte Vectorial (Support Vector
Regression, SVR) y ANN con algoritmo BP para obtener una predicción de velocidad del
viento. En el caso de ANN, el mejor resultado en términos de error medio absoluto
(Mean Absolute Error, MAE) es de 1.21 m/s.
En [Tarade y Katti, 2011] se obtienen precisas predicciones de velocidad del
viento haciendo uso de un Modelo Aautorregresivo Integrado de Media Móvil
(Autoregressive Integrated Moving Average, ARIMA), ANN y modelo de ajuste de curva
polinómica. Con esto, obtuvieron un MAE de 2.24 m/s.

MODELOS DE PREDICCIÓN METEOROLÓGICA BASADOS EN MÉTODOS DE CLASIFICACIÓN ORIENTADOS A LA
MEJORA DE LA EFICIENCIA ENERGÉTICA EN LOS PROCESOS DE GENERACIÓN.
TESIS DOCTORAL JOSÉ GUSTAVO HERNÁNDEZ TRAVIESO
6
En [Bhaskar y Singh, 2012] se utiliza ANN con wavelet adaptativa y algoritmo
feed-forward para obtener predicciones de energía eólica. En base a sus experimentos
obtuvieron un MAE de 0.86 m/s.
Por su parte, [Shi et al., 2013] aplicaron ANN genética y grey models lograron
mejorar las predicciones de velocidad del viento para su implementación en un parque
eólico. Con ello, lograron un MAE de 0.51 m/s.
En [Chen et al., 2014], se realiza una investigación para obtener predicciones de
velocidad del viento con un día de antelación combinando modelos numéricos y
probabilísticos. En este estudio, el MAE obtenido fue de 1.24 m/s.
En [Hernández et al., 2014a], se hace uso de ANN para obtener una predicción
de la velocidad del viento a corto plazo. El MAE obtenido fue de 0.84 m/s.
En el estudio de [Ruffin et al., 2009], hacen uso de un tipo de ANN con escasa
conectividad de la capa oculta, llamada Echo State Network (ESN), para obtener
predicciones de radiación solar para una ventana temporal que va desde los 30 a los 270
minutos desde el momento en que se realiza la predicción. En dicha investigación
comprobaron que a medida que se alejaban en el tiempo de predicción, la precisión de
la misma disminuía.
En [Naing y Srinivasan, 2010] utilizaron ANN y modelos de predicción
matemáticos para obtener una estimación de la radiación solar utilizando para ello
datos geográficos y meteorológicos. Obtuvieron una alta correlación entre los valores
estimados obtenidos y los reales.
En [Wang et al., 2011] se utilizan ANN para obtener predicciones de radiación
solar. Para el entrenamiento del sistema utilizaron datos de temperatura, índice de
claridad y datos de radiación. Los resultados obtenidos indican que el método es
apropiado para la predicción de radiación solar diaria.
En [Wu y Keong, 2011] se realiza la predicción de radiación solar haciendo uso
de redes neuronales y Modelo Autorregresivo de Media Móvil (Autoregressive Moving
Average, ARMA). La utilización conjunta de ambos métodos ofrece grandes resultados.

MODELOS DE PREDICCIÓN METEOROLÓGICA BASADOS EN MÉTODOS DE CLASIFICACIÓN ORIENTADOS A LA
MEJORA DE LA EFICIENCIA ENERGÉTICA EN LOS PROCESOS DE GENERACIÓN.
TESIS DOCTORAL JOSÉ GUSTAVO HERNÁNDEZ TRAVIESO
7
En [Zheng y Qiao, 2011] se propone un modelo basado en redes neuronales
utilizando funciones de base radial para obtener predicciones de energía solar a corto
plazo.
En [Yang et al., 2013] se propone un método de obtención de radiación solar
utilizando SVM y utilizando técnicas de reconocimiento de patrones con distancia
Euclídea.
En [Salcedo-Sanz et al., 2014] se estima la radiación solar haciendo uso de
procesos de regresión Gaussianos. Los resultados muestran que el modelo es efectivo.
En [Hernández et al., 2014b], se realiza una predicción de radiación solar
utilizando ANN obteniendo un MAE de 0.04 kilovatios hora por metro cuadrado
(kWh/m2).
En [Gairaa et al., 2015] se presenta un método para la obtención de predicciones
de radiación solar mediante redes neuronales para una zona de Argelia obteniendo un
error del 7.55%.
En [Hernández et al., 2015] se presenta una nueva versión del estudio anterior
en el que aplican diversos tipos de normalización para tratar de reducir la dispersión de
las muestras y estudiar su efecto en la obtención de predicciones de radiación solar.
Como resultado, se observó que el MAE se incrementó hasta los 0.06 kWh/m2.
En [Baptista et al., 2016] se realiza una implementación hardware de una ANN
para predecir la producción energética de un panel fotovoltaico. Con ello obtienen un
error del 0.007%.
En [Koyasu et al., 2016] se utilizan imágenes del cielo para obtener predicciones
de energía solar con una antelación de 1 o 2 horas.
En [Ghofrani et al., 2017] se desarrolla un modelo híbrido para realizar
predicciones de radiación solar haciendo uso de minería de datos y redes neuronales.
En [Snegirev et al., 2017] se realiza la descripción matemática de un modelo de
planta solar con predicciones de energía solar cada media hora utilizando modelos
físicos y estadísticos.

MODELOS DE PREDICCIÓN METEOROLÓGICA BASADOS EN MÉTODOS DE CLASIFICACIÓN ORIENTADOS A LA
MEJORA DE LA EFICIENCIA ENERGÉTICA EN LOS PROCESOS DE GENERACIÓN.
TESIS DOCTORAL JOSÉ GUSTAVO HERNÁNDEZ TRAVIESO
8
En [Valverde et al., 2014] se realiza un estudio para la predicción de lluvias
utilizando ANN en la región sudeste de Brasil. El método obtuvo resultados positivos.
Siendo una herramienta interesante para salvar vidas alertando a la población de las
lluvias, minimizando y evitando desastres, mejorando del mismo modo las condiciones
de salud.
En [Houthuys et al., 2017] y haciendo uso de SVM, se realizan predicciones de
temperatura en el campo de los pronósticos meteorológicos. Los resultados muestran
la bondad del modelo empleado.
En [Mengquiao et al., 2017] se utiliza ARIMA y un tipo de red neuronal llamado
Red de Creencia Profunda (Deep Belief Network, DBN) para realizar predicciones de
mareas rojas en China. Uno de los varios parámetros medioambientales evaluados y
utilizados para realizar esta predicción, entre los que se encuentran el pH, la salinidad
del agua y el contenido de clorofila, es la temperatura. Con todos esos parámetros se
realizan predicciones que son utilizadas para la posterior predicción de la marea roja.
En [Szeles et al., 2017] se muestra otra faceta importante en las aplicaciones de
la predicción meteorológica. La implementación de un sistema que se integra en un
robot que brinda asistencia a personas mayores. Con ello, el robot es capaz de ofrecer
consejo a los ancianos sobre la ropa que deben usar al salir a la calle o de invitarles a dar
un paseo si las condiciones climáticas son apropiadas, ayudándoles a realizar actividades
acordes con la situación climatológica.
En [Andrade y Bessa, 2017] se propone un marco predictivo para explorar
información de una red de Predicciones Numéricas del Tiempo (Numerical Weather
Predictions, NWP) en la zona de Galicia y Portugal aplicadas a la generación eólica
(Galicia) y solar (Portugal). Para ello utilizan árboles de decisión obteniendo resultados
que muestran que, aunque la aproximación es buena, es necesario mejorar el tiempo
de investigación en el campo de la minería de datos para obtener mejores resultados.
En [Sagar et al., 2017] se presenta un análisis que evalúa la habilidad de NWP en
la predicción de tormentas de lluvia en India. Comprobaron que las predicciones estaban

MODELOS DE PREDICCIÓN METEOROLÓGICA BASADOS EN MÉTODOS DE CLASIFICACIÓN ORIENTADOS A LA
MEJORA DE LA EFICIENCIA ENERGÉTICA EN LOS PROCESOS DE GENERACIÓN.
TESIS DOCTORAL JOSÉ GUSTAVO HERNÁNDEZ TRAVIESO
9
de acuerdo con las observaciones hasta 2 días vista, incrementándose los errores a partir
de ese punto temporal.
En [Allen et al., 2017] aplicaron un método de escalado de capa límite para
predecir la velocidad del viento y la potencia cerca de la superficie. Con ello obtuvieron
un error en las predicciones de densidad de potencia de un 1%.
En [Murata et al., 2018] se desarrolla un nuevo modelo empírico para modelar
la incertidumbre en las predicciones de irradiación solar con NWP.
En [Cramer et al., 2017] se realiza una evaluación de 7 métodos de machine
learning para realizar predicciones de lluvia utilizando datos de Estados Unidos,
Holanda, Suiza, Alemania, Eslovenia, Luxemburgo, Francia, España y Portugal. Los
resultados muestran los efectos positivos de estas técnicas de machine learning para
realizar dichas predicciones en base a la precisión de los resultados obtenidos y la
mínima correlación existente entre los climas evaluados.
En [Donida et al., 2018] se presenta un Sistema de Soporte a las Decisiones
(Decision Support System, DSS) capaz de hacer predicciones de producción de energía
eléctrica, estimar el índice de variación de la predicción y analizar las características de
producción del parque eólico. Siendo su contribución el obtener dicha predicción
haciendo uso de variables meteorológicas.
En [Refaat et al., 2018] se propone la posibilidad de desarrollar una relación
fiable entre el sistema generador de energía fotovoltaica y la eficiencia con varios
factores meteorológicos como la irradiancia, la temperatura, el polvo y el viento
haciendo uso de ANN. En sus simulaciones obtuvieron una precisión del 99.9%.
Otra muestra más de la importancia de la meteorología a la hora de gestionar los
recursos energéticos se aprecia en [Jian et al., 2018], en donde tienen en cuenta los
factores climáticos a la hora de realizar las previsiones de demanda energética en Tianjin
(China). Incluir estos datos mejora la precisión de la previsión de la demanda.
También en el estudio de [Lin et al., 2018] se tiene en consideración el efecto
acumulado de la temperatura ambiente en la realización de la predicción de carga

MODELOS DE PREDICCIÓN METEOROLÓGICA BASADOS EN MÉTODOS DE CLASIFICACIÓN ORIENTADOS A LA
MEJORA DE LA EFICIENCIA ENERGÉTICA EN LOS PROCESOS DE GENERACIÓN.
TESIS DOCTORAL JOSÉ GUSTAVO HERNÁNDEZ TRAVIESO
10
máxima diaria de la red energética. Como conclusión comprueban la dependencia de los
factores meteorológicos en la carga diaria máxima de la red eléctrica.
En [Eroshenko y Khalyasmaa, 2018] se realiza una metodología de predicción a
corto plazo para obtener energía en plantas solares desarrollado sobre la base del
análisis de regresión. En su estudio comprobaron la existencia de un error en el caso de
días nublados que hacía necesario la creación de un modelo específico para días
nublados.
En [Xiao y Ai, 2018] se estudian las perturbaciones en la calidad de la energía a
través de Modelos Multi-ocultos de Markov, para obtener herramientas de prevención
de dichas perturbaciones. Para ello utilizan también la información meteorológica, ya
que, como comprobaron, su inclusión mejora la precisión de la predicción.
En [Luo et al., 2018] se realiza un estudio para la predicción de la velocidad del
viento haciendo uso de métodos de extreme learning machine y de deep learning. Estos
modelos permiten atacar la ANN con una mayor rapidez. Aunque sus resultados son
buenos, reconocen que para mejorar el rendimiento de este modelo aún queda mucho
trabajo por realizar. Con ANN obtuvieron como mejor resultado en términos de MAE
0.667 m/s.
En [Khodayar et al., 2018] se realiza un estudio para obtener la predicción de la
velocidad del viento en un rango de tiempo entre 1 y 24 horas de adelanto. Para ello
hacen uso de técnicas de deep learning usando Tensorflow. Los resultados obtenidos
para un horizonte temporal inferior a los 10 minutos el sistema puede ser considerado
como offline utilizando el histórico de datos.
En otro estudio de [Khodayar y Wang, 2018] se utiliza nuevamente deep learning
para realizar predicciones de velocidad del viento. En este caso la zona bajo estudio se
localizó en el noreste de los Estados Unidos a lo largo de 145 ubicaciones con una base
de datos de 6 años y 5 minutos de frecuencia de muestreo. Realizaron el entrenamiento
del sistema con el 80% de las muestras y el test con el 20% restante. Para una predicción
a 1 hora de adelanto el mejor MAE que obtuvieron fue de 0.533 m/s.
MODELOS DE PREDICCIÓN METEOROLÓGICA BASADOS EN MÉTODOS DE CLASIFICACIÓN ORIENTADOS A LA
MEJORA DE LA EFICIENCIA ENERGÉTICA EN LOS PROCESOS DE GENERACIÓN.
TESIS DOCTORAL JOSÉ GUSTAVO HERNÁNDEZ TRAVIESO
11
En [Wu Y.K. et al., 2018] se realiza una predicción probabilística de potencia
eólica. Ésta se ha tenido en cuenta en las últimas una o dos décadas como una entrada
más a la hora de la toma de decisiones para obtener una penetración económica y fiable
de las energías renovables.
En [Kaiju et al., 2018] se realiza una predicción de energía fotovoltaica haciendo
uso de técnicas de lógica difusa. Indican que, a la hora de obtener energía solar influyen
no solo factores medioambientales como la temperatura ambiente, la irradiancia y la
velocidad del viento. También influyen factores como la temperatura y localización de
los componentes de la instalación. La potencia de salida de la instalación está
caracterizada por una alta intermitencia y volatilidad entre otros factores. Los resultados
de sus simulaciones obtienen un error que se mantiene dentro del 8%.
En [Wu F. et al., 2018] realizan un modelo para predecir la energía undimotriz
obtenida a través de las olas y de la fuerza del viento. Las olas están impulsadas por el
viento, por ello la relación entre el viento y las olas es muy útil en dicha predicción. Para
ello se analiza, entre otros factores, la correlación entre el viento y la ola. Los resultados
de las predicciones realizadas a un día vista, comparados con los niveles de energía
reales obtenidos, validan la efectividad del método propuesto.
En [Shi et al., 2018] queda de manifiesto que la importancia de los factores
climatológicos también es importante en la producción industrial. Unas condiciones
estables, precisas y confiables de temperatura y humedad mejoran la productividad.
Con ello se consigue una mejor gestión y efectividad de los sistemas de control de aire
acondicionado. Más aún en el caso concreto de este estudio realizado en una fábrica de
tabaco en China.
En [Zhang T. et al., 2018] se presenta un modelo predictivo de control energético
para la regulación de los sistemas de climatización de un edificio, permitiendo a su vez
una reducción del consumo energético de los mismos. Para lograrlo también hacen uso
de los valores de las condiciones meteorológicas de la ubicación del mismo (Singapur).
Factores como la ocupación de diversas zonas o no del edificio hacen necesario controlar
las condiciones ambientales de dichas dependencias para lograr una sensación térmica
MODELOS DE PREDICCIÓN METEOROLÓGICA BASADOS EN MÉTODOS DE CLASIFICACIÓN ORIENTADOS A LA
MEJORA DE LA EFICIENCIA ENERGÉTICA EN LOS PROCESOS DE GENERACIÓN.
TESIS DOCTORAL JOSÉ GUSTAVO HERNÁNDEZ TRAVIESO
12
confortable. Con un edificio inteligente con sensores integrados, además de la inclusión
de las condiciones climáticas existentes en esos instantes, este modelo puede ser
posible.
En [Du et al., 2018], para controlar y reducir los consumos energéticos del edificio
en relación con los sistemas de climatización, se tienen en consideración las
predicciones meteorológicas existentes en el exterior del mismo. Pero al existir errores
en esas predicciones, este estudio realiza un ajuste de dichos errores para reducir así el
consumo energético del edificio localizado en Austin (Texas, Estados Unidos). Haciendo
uso de este método lograron reducir el gasto energético del mismo.
En [Lin y Weng, 2018] se utiliza información vía satélite para realizar la
estimación de la velocidad máxima del viento en los huracanes. Para ello se hace uso
además de la información de anomalías térmicas a cada nivel de presión dentro del
huracán se deriva respecto a su entorno. Esto es, está comprobado que cuando un ciclón
entra en la etapa de convertirse en huracán, en la parte alta de la Troposfera ocurre
una anomalía térmica en la que se produce un incremento de temperatura. De la
información obtenida del GPS de las dropsondas utilizadas en los huracanes Harvey,
Irma y María en 2017, se comprueba una relación lineal entre una mayor temperatura
de la anomalía con una mayor velocidad del viento.
En [Zhang B. et al., 2018] se realizan predicciones meteorológicas para poder
tener datos certeros y fiables a la hora de realizar vuelos con aeronaves no tripuladas.
La relación entre las condiciones meteorológicas y la planificación de misiones y análisis
de riesgo con aeronaves no tripuladas está suficientemente documentado en la
literatura. Es por ello que un análisis más fiable, preciso y flexible de las condiciones
meteorológicas es deseable para tal fin.
En [Yoshida et al., 2016] se describe la predicción de la fluctuación de la velocidad
del viento usando redes neuronales. Con este método obtienen una precisión en la
predicción de las fluctuaciones del 59% y una precisión en la predicción de velocidad del
viento del 43%.

MODELOS DE PREDICCIÓN METEOROLÓGICA BASADOS EN MÉTODOS DE CLASIFICACIÓN ORIENTADOS A LA
MEJORA DE LA EFICIENCIA ENERGÉTICA EN LOS PROCESOS DE GENERACIÓN.
TESIS DOCTORAL JOSÉ GUSTAVO HERNÁNDEZ TRAVIESO
13
En [Mert et al., 2016] se utilizan ANN para estimar la producción energética de
un aerogenerador. El estudio se desarrolló en Turquía haciendo uso de los datos del
servicio meteorológico estatal. Pudieron observar que los modelos de ANN ofrecen
mejor rendimiento para parámetros meteorológicos compuestos por regresión
multilineal paso a paso.
En [Li J. et al., 2016] se utiliza GA con ANN BP para obtener predicciones de
velocidad del viento. El MAE alcanzado con este método es de 0.547 m/s.
En [Filik y Filik, 2017] se obtiene una predicción de velocidad del viento haciendo
uso de ANN a partir de múltiples datos obtenidos en Turquía. Los datos provienen de un
sensor localizado en una vivienda inteligente que se utilizó como laboratorio de pruebas
en una determinada ubicación y un lugar específico. Los resultados obtenidos presentan
un MAE de 0.503 m/s.
En [Ulkat y Günay, 2017] se obtienen predicciones medias de velocidad del
viento y optimización de energía eólica en Turquía utilizando ANN con datos del sistema
de archivo de datos meteorológicos turco. Con ellos, obtienen un MAE de 0.32 m/s.
Seguidamente, se presentan algunas patentes relacionadas con la predicción
meteorológica.
En las siguientes patentes se obtienen las predicciones meteorológicas en base
a imágenes de radares meteorológicos US 7076368 B2 [Wada, 2006], US 8625840 B2
[Ravela et al., 2014].
En la patente US 7728759 B2 [Tillotson et al., 2010] se hace uso de imagen
satélite y de la información temporal suministrada por el mismo para obtener la
información meteorológica.
En la patente US 8818029 B1 [Mecikalski et al., 2014] se utiliza imagen satélite
para obtener la información.
En la patente US 8100004 B2 [Young et al., 2012] se hace uso de sensores
barométricos acoplados a GPS para obtener la predicción.
MODELOS DE PREDICCIÓN METEOROLÓGICA BASADOS EN MÉTODOS DE CLASIFICACIÓN ORIENTADOS A LA
MEJORA DE LA EFICIENCIA ENERGÉTICA EN LOS PROCESOS DE GENERACIÓN.
TESIS DOCTORAL JOSÉ GUSTAVO HERNÁNDEZ TRAVIESO
14
En las patentes US 8095315 B2 [Artis, 2012], US 20070179703 A1
[Soussiel et al., 2007] los datos son obtenidos en vuelo por las aeronaves.
Hipótesis
Tras observar la diversidad de estudios realizados en la materia presentados en
el apartado anterior, y viendo la existencia de un vacío en cuanto a la posibilidad de
mejorar tanto la precisión como reducir el equipamiento tecnológico necesario para
obtener predicciones meteorológicas, surgen una serie de inquietudes que cristalizan
en una hipótesis que se pretende demostrar.
La hipótesis sobre la que se centra esta Tesis Doctoral es la siguiente:
“La obtención de predicciones meteorológicas que permitan caracterizar la
variabilidad climática, reduciendo al mínimo el error existente entre la predicción y la
medida real, proporciona a los procesos de generación energética un potencial que
permite la mejora en la eficiencia de los procesos de generación y previsión energética
mediante velocidad del viento y radiación solar.”
Objetivo
En base a la hipótesis presentada previamente, es necesario marcar un objetivo
que permita su demostración. Estos objetivos permitirán desarrollar un entorno de
trabajo para validar y concluir la hipótesis definida.
El objetivo de esta Tesis Doctoral consiste en la realización de un modelo de
predicción meteorológica que se diferencia de lo actual en que será un modelo a nivel
microscópico y de corto plazo, unas pocas horas de antelación, y que permita mejorar
la eficiencia en los procesos de generación de energía, tanto mediante fuentes
renovables (eólica y solar) como mediante combustibles fósiles.

MODELOS DE PREDICCIÓN METEOROLÓGICA BASADOS EN MÉTODOS DE CLASIFICACIÓN ORIENTADOS A LA
MEJORA DE LA EFICIENCIA ENERGÉTICA EN LOS PROCESOS DE GENERACIÓN.
TESIS DOCTORAL JOSÉ GUSTAVO HERNÁNDEZ TRAVIESO
15
Esto es, frente a las predicciones que dan los valores de magnitudes climáticas
para áreas grandes, este modelo intentará lograr predicciones en las zonas específicas
en las cuales se hayan instalado una serie de estaciones meteorológicas que den aporte
de datos a este modelo predictivo. Con lo que se logra mejorar dos aspectos de los
métodos empleados en la actualidad, se realiza para una zona específica y se reducen
considerablemente los costes económicos a la hora de realizar la predicción. Logrando
como consecuencia, la caracterización de la variabilidad climática de la zona en estudio.
Esta Tesis Doctoral se ajusta dentro de la segunda línea de investigación del
Programa de Doctorado en Empresa, Internet y Tecnologías de las Comunicaciones
(EmITIC), titulada “Sociedad, empresa y Tecnologías de la Información y el
Conocimiento” en los temas siguientes:
Computación adaptativa y neurociencia computacional.
Debido a los sistemas de clasificación empleados se desarrolla una tarea de
neurociencia computacional y computación adaptativa.
Organización, comportamiento humano y sostenibilidad.
Al colaborar a la mejora de la eficiencia energética colabora con la sostenibilidad
del medio ambiente, encontrándose encuadrada en este tema.
Inteligencia artificial.
Debido a los sistemas de clasificación empleados.
Procesado de señal.
Los datos son clasificados y tratados como señales.
Desarrollando un poco más el objetivo de esta Tesis Doctoral, hay que tener en
cuenta una serie de factores que se dan en las predicciones meteorológicas en la
actualidad. Tal como ha quedado comprobado en el estado del arte, para obtener una
predicción meteorológica, los datos se obtienen de muy diversas formas, pero en ellas
se realiza modelado matemático, se utilizan sensores de tipo radar y/o imágenes vía

MODELOS DE PREDICCIÓN METEOROLÓGICA BASADOS EN MÉTODOS DE CLASIFICACIÓN ORIENTADOS A LA
MEJORA DE LA EFICIENCIA ENERGÉTICA EN LOS PROCESOS DE GENERACIÓN.
TESIS DOCTORAL JOSÉ GUSTAVO HERNÁNDEZ TRAVIESO
16
satélite entre otros. Además de costosos en términos de infraestructura y materiales
necesarios, estos modelos son aplicables a grandes áreas con lo que se pierden detalles
en zonas específicas que pueden tener una importancia vital a la hora de por ejemplo,
poder atacar un incendio forestal o poder prever los riesgos ocasionados por unas lluvias
intensas en un intervalo corto de tiempo que ocasionan gran cantidad de daños.
Frente a estos modelos, el modelo propuesto como objetivo de esta Tesis
Doctoral, versará sobre un modelo aplicado a una zona de estudio concreta, con lo que
se obtiene certeramente y con alta fiabilidad la caracterización de la variabilidad
climatológica de la zona bajo estudio para un horizonte temporal cercano, esto es unas
pocas horas de antelación. El modelo es altamente efectivo para horizontes temporales
de 1 hora de antelación (tal como queda demostrado en los artículos publicados que
forman este Compendio de Publicaciones). Además, la reducción de costes en
infraestructuras y materiales con respecto a los modelos actuales es otra clara ventaja
del modelo.
Este modelo pretende colaborar en la generación de energías renovables
colaborando tanto con las grandes plantas solares y/o parques eólicos, como con los
pequeños productores que instalen en sus domicilios y/o empresas los sistemas de
generación de energías limpias. La consecución de esta meta es posible gracias a las
predicciones certeras, fiables y rápidas que este modelo predictivo es capaz de ofrecer,
con lo que puede lograrse una mejora en la eficiencia en el proceso de generación.
La gran ventaja es que el modelo es aplicable a todos y cada uno de los paneles
fotovoltaicos y aerogeneradores del mercado, ya que puede convertirse en un producto
de valor añadido a los mismos.
Del mismo modo, puede servir de valor añadido al sector turístico, permitiendo
al sector ofertar a sus clientes una seguridad del estado del clima a la hora de la
realización de una ruta turística por ejemplo. También a las explotaciones agrícolas y
ganaderas a la hora de planificar riegos o de recoger al ganado ante la proximidad de un
fenómeno meteorológico adverso.

MODELOS DE PREDICCIÓN METEOROLÓGICA BASADOS EN MÉTODOS DE CLASIFICACIÓN ORIENTADOS A LA
MEJORA DE LA EFICIENCIA ENERGÉTICA EN LOS PROCESOS DE GENERACIÓN.
TESIS DOCTORAL JOSÉ GUSTAVO HERNÁNDEZ TRAVIESO
17
El que podría ser el eje central de las aplicaciones de esta Tesis Doctoral es el
relativo a la generación energética, como anteriormente se indicaba en un breve
esbozo. Habida cuenta de que en la actualidad el combustible fósil es la principal fuente
empleada en la generación energética y que estas fuentes llegarán a agotarse en un
momento dado, se hace necesario observar las fuentes de energía limpia como actores
de importancia en la generación eléctrica. Es ahí donde este modelo predictivo pretende
colaborar decididamente, permitiendo obtener una predicción certera que ayude a una
mejor y mayor eficiencia de estos sistemas generadores. Con ello se colaboraría a
reducir emisiones de CO2 y a la utilización y aprovechamiento de energías limpias.
Explicando la historia de esta Investigación, los orígenes se remontan al año
2013, en el que se obtiene la Beca INNOVA Canarias 2020 otorgada por la Fundación
Universitaria de Las Palmas y con el mecenazgo de la Fundación Endesa. En el año 2014
se realiza el Trabajo Fin de Master siguiendo esta línea y se obtiene un sistema capaz de
realizar predicciones de temperatura. Pero es a partir de ese momento en el que se
empiezan a vislumbrar las múltiples posibilidades, variantes, variables y aplicaciones
que un modelo predictivo de estas características puede llegar a tener.
Metodología
Antes de entrar en profundidad en la parte metodológica en que se basa esta
Tesis Doctoral, es necesario presentar brevemente las partes que la forman.
En primer lugar, se presenta la base de datos que se utiliza (origen, datos y
estructura de la misma, etc.). A continuación se introduce el sistema de clasificación
empleado en los artículos que forman este Compendio de Publicaciones y se hace un
breve comentario de los diversos sistemas de clasificación empleados a lo largo de esta
Investigación.
Seguidamente se comenta ya el aspecto metodológico propiamente dicho,
formado por las diversas etapas a seguir para obtener la predicción meteorológica de

MODELOS DE PREDICCIÓN METEOROLÓGICA BASADOS EN MÉTODOS DE CLASIFICACIÓN ORIENTADOS A LA
MEJORA DE LA EFICIENCIA ENERGÉTICA EN LOS PROCESOS DE GENERACIÓN.
TESIS DOCTORAL JOSÉ GUSTAVO HERNÁNDEZ TRAVIESO
18
interés. Estas etapas son preprocesado, adaptación de datos para su introducción en
entorno Matlab y realización del banco de pruebas.
El Departamento de Señales y Comunicaciones de la Escuela de Ingeniería de
Telecomunicación y Electrónica de la Universidad de Las Palmas de Gran Canaria,
dispone de una base de datos meteorológicos de pago proporcionada por la AEMET,
agencia que depende del Ministerio de Transición Ecológica y que anteriormente
dependía del Ministerio de Agricultura, Alimentación y Medio Ambiente del Gobierno
de España.
El motivo de seleccionar la información de esta base de datos es, a parte de la
disponibilidad inmediata de un repositorio de datos meteorológicos de 5 años de
duración, la fiabilidad y confiabilidad de las mediciones ofertadas por la AEMET.
En la misma se presentan datos obtenidos en las estaciones que la AEMET tiene
instaladas en el Aeropuerto de Gran Canaria y en el Aeropuerto de Tenerife Sur,
obtenidos entre los años 2003 a 2007 (5 años), ambos inclusive. En ella se recogen datos
relativos a las siguientes variables meteorológicas:
Humedad.
Meteoros.
Nubosidad.
Precipitación.
Radiación.
Temperatura.
Viento.
Los datos se presentan en formato .xls de Microsoft Excel, perteneciente al
paquete Microsoft Office. En cada uno de los ficheros que forman la base de datos, se
presentan los datos de cada fenómeno de manera conjunta para ambas estaciones. Esto
es, en una hoja Excel se presentan los datos de, por ejemplo, temperatura
correspondientes a las estaciones del Aeropuerto de Gran Canaria (GC) y Aeropuerto de
Tenerife Sur (TF), para el periodo de 5 años indicado anteriormente. Y así con todos y
cada uno de los fenómenos meteorológicos anteriormente citados.

MODELOS DE PREDICCIÓN METEOROLÓGICA BASADOS EN MÉTODOS DE CLASIFICACIÓN ORIENTADOS A LA
MEJORA DE LA EFICIENCIA ENERGÉTICA EN LOS PROCESOS DE GENERACIÓN.
TESIS DOCTORAL JOSÉ GUSTAVO HERNÁNDEZ TRAVIESO
19
Para comprender correctamente los datos contenidos en cada hoja Excel, éstas
vienen acompañadas de un fichero en formato .txt en el que se recogen las indicaciones
del contenido de cada campo del archivo Excel. Se recogen las indicaciones relativas a
indicativo climatológico, nombre y altitud de la estación, provincia, longitud y latitud,
valor de la variable contenida en la hoja Excel para las 24 horas del día, valores máximos
y mínimos acompañados de la hora en que se produjeron. Además de la información de
día, mes y año en que se toma la muestra.
Un ejemplo de este fichero se muestra en la siguiente ilustración.
Ilustración 1: Ejemplo de nota explicativa de los datos de temperatura.
Para poder comprender la cantidad de datos contenidos en la base de datos, se
presentan las dimensiones originales de los archivos Excel contenidos en ella en la
siguiente tabla:
MODELOS DE PREDICCIÓN METEOROLÓGICA BASADOS EN MÉTODOS DE CLASIFICACIÓN ORIENTADOS A LA
MEJORA DE LA EFICIENCIA ENERGÉTICA EN LOS PROCESOS DE GENERACIÓN.
TESIS DOCTORAL JOSÉ GUSTAVO HERNÁNDEZ TRAVIESO
20
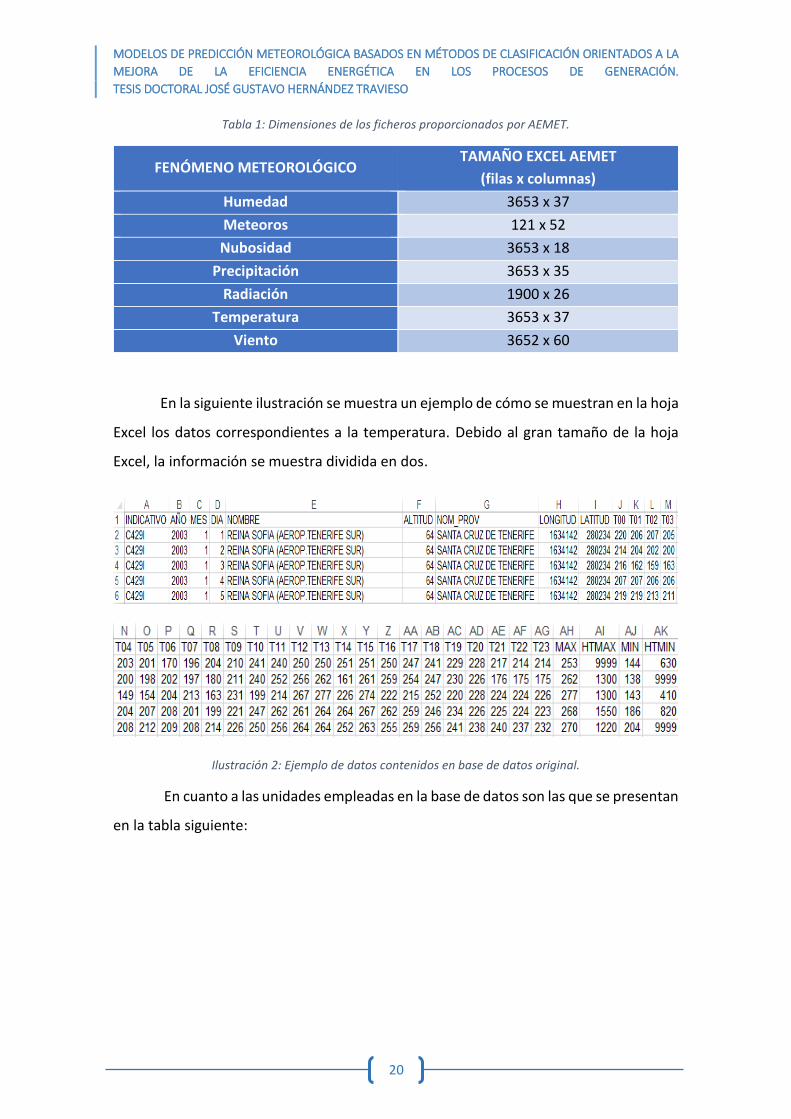
Tabla 1: Dimensiones de los ficheros proporcionados por AEMET.
FENÓMENO METEOROLÓGICO TAMAÑO EXCEL AEMET
(filas x columnas)
Humedad 3653 x 37
Meteoros 121 x 52
Nubosidad 3653 x 18
Precipitación 3653 x 35
Radiación 1900 x 26
Temperatura 3653 x 37
Viento 3652 x 60
En la siguiente ilustración se muestra un ejemplo de cómo se muestran en la hoja
Excel los datos correspondientes a la temperatura. Debido al gran tamaño de la hoja
Excel, la información se muestra dividida en dos.
Ilustración 2: Ejemplo de datos contenidos en base de datos original.
En cuanto a las unidades empleadas en la base de datos son las que se presentan
en la tabla siguiente:
MODELOS DE PREDICCIÓN METEOROLÓGICA BASADOS EN MÉTODOS DE CLASIFICACIÓN ORIENTADOS A LA
MEJORA DE LA EFICIENCIA ENERGÉTICA EN LOS PROCESOS DE GENERACIÓN.
TESIS DOCTORAL JOSÉ GUSTAVO HERNÁNDEZ TRAVIESO
21
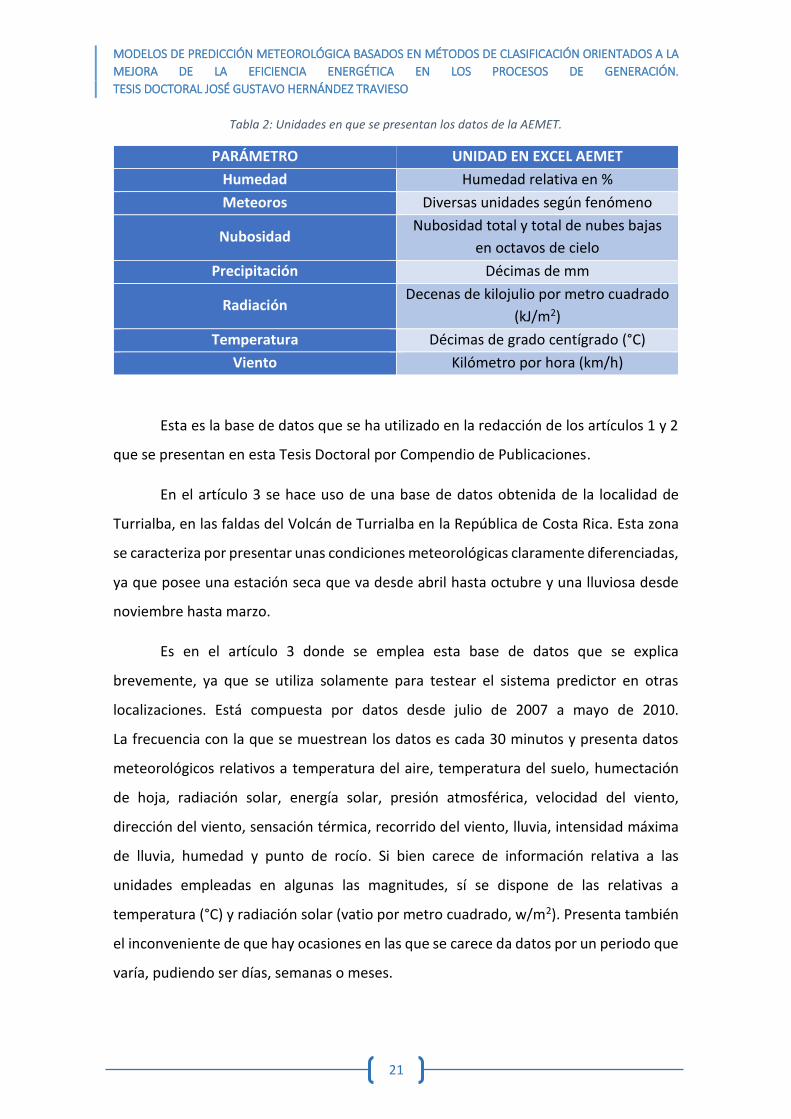
Tabla 2: Unidades en que se presentan los datos de la AEMET.
PARÁMETRO UNIDAD EN EXCEL AEMET
Humedad Humedad relativa en %
Meteoros Diversas unidades según fenómeno
Nubosidad Nubosidad total y total de nubes bajas
en octavos de cielo
Precipitación Décimas de mm
Radiación Decenas de kilojulio por metro cuadrado
(kJ/m2)
Temperatura Décimas de grado centígrado (°C)
Viento Kilómetro por hora (km/h)
Esta es la base de datos que se ha utilizado en la redacción de los artículos 1 y 2
que se presentan en esta Tesis Doctoral por Compendio de Publicaciones.
En el artículo 3 se hace uso de una base de datos obtenida de la localidad de
Turrialba, en las faldas del Volcán de Turrialba en la República de Costa Rica. Esta zona
se caracteriza por presentar unas condiciones meteorológicas claramente diferenciadas,
ya que posee una estación seca que va desde abril hasta octubre y una lluviosa desde
noviembre hasta marzo.
Es en el artículo 3 donde se emplea esta base de datos que se explica
brevemente, ya que se utiliza solamente para testear el sistema predictor en otras
localizaciones. Está compuesta por datos desde julio de 2007 a mayo de 2010.
La frecuencia con la que se muestrean los datos es cada 30 minutos y presenta datos
meteorológicos relativos a temperatura del aire, temperatura del suelo, humectación
de hoja, radiación solar, energía solar, presión atmosférica, velocidad del viento,
dirección del viento, sensación térmica, recorrido del viento, lluvia, intensidad máxima
de lluvia, humedad y punto de rocío. Si bien carece de información relativa a las
unidades empleadas en algunas las magnitudes, sí se dispone de las relativas a
temperatura (°C) y radiación solar (vatio por metro cuadrado, w/m2). Presenta también
el inconveniente de que hay ocasiones en las que se carece da datos por un periodo que
varía, pudiendo ser días, semanas o meses.

MODELOS DE PREDICCIÓN METEOROLÓGICA BASADOS EN MÉTODOS DE CLASIFICACIÓN ORIENTADOS A LA
MEJORA DE LA EFICIENCIA ENERGÉTICA EN LOS PROCESOS DE GENERACIÓN.
TESIS DOCTORAL JOSÉ GUSTAVO HERNÁNDEZ TRAVIESO
22
Por estos motivos esta base de datos se utilizará para realizar test en zonas
lejanas.
El sistema de clasificación empleado en los artículos de que consta esta Tesis
Doctoral es la ANN. Como pequeño apunte de las mismas se destaca que una ANN es un
método de clasificación supervisado [Haykin, 1999]. Está caracterizada por la capacidad
de clasificación mediante aprendizaje que posee, similar a la del cerebro humano. Esto
aporta al sistema una serie de ventajas frente a los sistemas computacionales
convencionales, como pueden ser:
Aprendizaje adaptativo.
Auto-organización.
Robustez y tolerancia a fallos.
Fácil inserción en la tecnología existente.
Capacidad de trabajo en tiempo real.
A lo largo de las diversas fases de esta Tesis Doctoral también se ha investigado
con otros sistemas de clasificación, como son los árboles de decisión, ajuste de modelos
lineales, SVR y SVM.
Una vez se ha caracterizado la base de datos a utilizar, en la mayoría de los
artículos presentados en este compendio de publicaciones, e introducido el sistema de
clasificación, se procede a explicar la metodología seguida en esta Tesis Doctoral.
Partiendo de la base de datos de la AEMET, en la que los fenómenos
meteorológicos se presentan de manera conjunta para ambas estaciones, y para todos
los años de la misma (2003 a 2007), el primer paso a realizar es un preprocesado de los
datos.
Este preprocesado consiste en primer lugar en obtener de manera
independiente los datos para cada estación, separándolos en dos ficheros nuevos e
independientes. Una vez obtenidos se procede a eliminar de ellos aquellos días en que
se produzca alguna falta de datos debida a averías o mantenimientos de la estación
meteorológica. Esta tarea se realizó de manera manual al inicio ya que es necesario

MODELOS DE PREDICCIÓN METEOROLÓGICA BASADOS EN MÉTODOS DE CLASIFICACIÓN ORIENTADOS A LA
MEJORA DE LA EFICIENCIA ENERGÉTICA EN LOS PROCESOS DE GENERACIÓN.
TESIS DOCTORAL JOSÉ GUSTAVO HERNÁNDEZ TRAVIESO
23
controlar la correcta separación de datos. Una vez se ha realizado, el número de
muestras por estación (GC y TF) y por año se muestra en la siguiente tabla.
Tabla 3: Número de muestras por estación y año.
AÑO
GC TF
CON
RADIACIÓN
SIN
RADIACIÓN
CON
RADIACIÓN SIN RADIACIÓN
2003 ----- 8755 1344 8323
2004 4064 8731 2960 7819
2005 1296 8755 3104 8059
2006 1952 8611 5424 8131
2007 3232 8587 5568 8419
El motivo de la existencia de dos valores numéricos diferentes al incluir o no el
fenómeno de radiación, es que éste no presenta datos de manera continua a lo largo de
todo el tiempo de captura de datos por parte de las estaciones.
Hecho esto, se adaptan los datos a la correcta forma en que deben ser
introducidos a cada uno de los diversos sistemas clasificadores encargados de realizar la
predicción, que se han utilizado en esta Tesis Doctoral, trabajando en todos los casos
bajo entorno Matlab.
Una vez ya se dispone de los datos correctamente etiquetados y parametrizados,
se procede a introducirlos en los sistemas clasificadores que serán los que obtengan
mediante la implementación de sus algoritmos, la predicción de la variable
meteorológica de interés. En el caso de los artículos incluidos en esta Tesis Doctoral por
Compendio de Publicaciones, el sistema de clasificación empleado es la ANN.
La ANN será utilizada de dos formas distintas:
1. Modo de entrenamiento: En esta fase se creará el modelo a utilizar en la
fase de test, ya que por las características de la ANN al ser un sistema de
clasificación supervisado, ésta debe ser previamente entrenada. Durante
la creación del modelo se van comprobando las diversas configuraciones
MODELOS DE PREDICCIÓN METEOROLÓGICA BASADOS EN MÉTODOS DE CLASIFICACIÓN ORIENTADOS A LA
MEJORA DE LA EFICIENCIA ENERGÉTICA EN LOS PROCESOS DE GENERACIÓN.
TESIS DOCTORAL JOSÉ GUSTAVO HERNÁNDEZ TRAVIESO
24
posibles en cuanto al número de neuronas de la capa oculta y salida,
logrando así la adaptación de los errores a la salida deseada.
2. Modo de test o clasificación: A partir del modelo creado en la etapa
anterior, la ANN ya es capaz de obtener predicciones de salida deseadas.
La configuración empleada como estándar en los mismos es la formada por
24 neuronas en la capa oculta y 1 neurona en la capa de salida, a esta configuración se
llegó tras realizar multitud de pruebas y ensayos a fin de obtener una predicción con el
menor error posible a la salida. Pero tal como se observa, en el artículo 3 se realizan test
con variedad de configuraciones en cuanto a configuración de la ANN y tamaño de la
ventana deslizante.
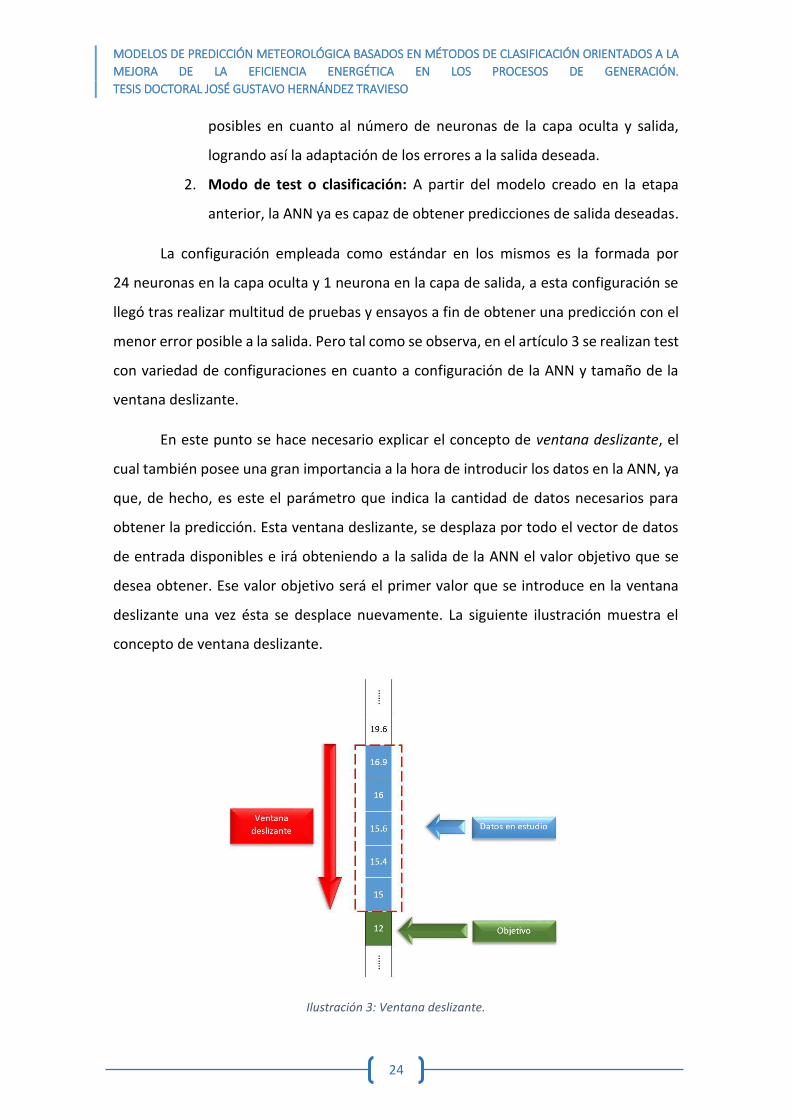
En este punto se hace necesario explicar el concepto de ventana deslizante, el
cual también posee una gran importancia a la hora de introducir los datos en la ANN, ya
que, de hecho, es este el parámetro que indica la cantidad de datos necesarios para
obtener la predicción. Esta ventana deslizante, se desplaza por todo el vector de datos
de entrada disponibles e irá obteniendo a la salida de la ANN el valor objetivo que se
desea obtener. Ese valor objetivo será el primer valor que se introduce en la ventana
deslizante una vez ésta se desplace nuevamente. La siguiente ilustración muestra el
concepto de ventana deslizante.
Ilustración 3: Ventana deslizante.

MODELOS DE PREDICCIÓN METEOROLÓGICA BASADOS EN MÉTODOS DE CLASIFICACIÓN ORIENTADOS A LA
MEJORA DE LA EFICIENCIA ENERGÉTICA EN LOS PROCESOS DE GENERACIÓN.
TESIS DOCTORAL JOSÉ GUSTAVO HERNÁNDEZ TRAVIESO
25
Donde el tamaño de la ventana deslizante (marcado en líneas discontinuas en
color rojo) es de 5 muestras que forman los datos en estudio (marcados en azul) y se
pretende obtener la predicción del valor objetivo (marcado en color verde).
Una vez ya se ha obtenido el modelo de predicción, se comienza el modo de test.
Es éste sin duda una de los puntos fuertes de este modelo predictivo, ya que
mientras la gran mayoría, por no decir todos, de los estudios analizados dedican la
mayor parte de las muestras de que disponen a la fase de entrenamiento, dejando una
parte pequeña de las mismas a la fase de test, este modelo predictivo hace
diametralmente lo opuesto. Dedicando solo el 20% de las muestras a la fase de
entrenamiento y el 80% restante a la fase de test.
Para ello, de los 5 años de muestras de las que dispone la base de datos de la
AEMET, se emplea para entrenar el modelo el año 2006, el motivo es que el número de
muestras de que dispone este año está próximo a la media de muestras de los restantes
años. Testeando el modelo con los años 2003, 2004, 2005 y 2007.
También, y a la vista de las unidades en que se ofrecían los datos de la AEMET,
se opta por cambiarlas a lo que se da en llamar unidades más precisas entendiendo
como tales las mostradas en la tabla siguiente:
Tabla 4: Unidades de los datos utilizados en los experimentos.
FENÓMENO
METEOROLÓGICO
UNIDADES DE LOS DATOS UTILIZADOS
Datos de AEMET Unidades más precisas y
Fusión de fenómenos
Temperatura Décimas de °C °C
Velocidad del viento Kilómetros por hora
(km/h) Metros por segundo (m/s)
Radiación solar Decenas de kilojulios por
metro cuadrado (kJ/m2)
Kilovatios hora por metro
cuadrado (kWh/m2)
En los experimentos realizados cuando se trabaja con varios fenómenos
meteorológicos juntos para obtener la predicción de unos de ellos, se trabaja con
unidades más precisas ya que se obtienen mejores resultados.

MODELOS DE PREDICCIÓN METEOROLÓGICA BASADOS EN MÉTODOS DE CLASIFICACIÓN ORIENTADOS A LA
MEJORA DE LA EFICIENCIA ENERGÉTICA EN LOS PROCESOS DE GENERACIÓN.
TESIS DOCTORAL JOSÉ GUSTAVO HERNÁNDEZ TRAVIESO
26
En los artículos presentados en esta Tesis Doctoral por Compendio de
Publicaciones, se pretenden realizar experimentos que permitan dar respuesta a la
hipótesis planteada en el apartado anterior. La forma en que se validan los resultados
obtenidos en las predicciones realizadas en estos artículos es mediante la comparación
del valor obtenido con el valor real que ofrece la estación meteorológica en la zona bajo
estudio.
Para intentar dar respuesta a la hipótesis planteada se harán experimentos en
diferentes localizaciones geográficas, obteniendo predicciones de diferentes variables
meteorológicas, con diferente número de muestras de entrenamiento y test, sin utilizar
ningún aporte de datos extra a los ofrecidos por la estación meteorológica, con
diferentes frecuencias de muestreo de la estación, tal y como se muestra en las
secciones de materiales y métodos (artículos 1 y 3) o metodología experimental
(artículo 2) y en la sección de resultados de los diferentes artículos publicados. Con ello,
se logrará caracterizar climáticamente la zona y se tendrá una herramienta que permita
mejorar la eficiencia en los procesos de generación energética.
Unidad temática de la Tesis Doctoral por Compendio de Publicaciones
Una vez se ha establecido el marco conceptual en el que se encuadra esta Tesis
Doctoral, el objetivo e hipótesis que se pretenden resolver, se presentan seguidamente
las consideraciones relativas a la unidad temática de la misma.
En todas las publicaciones se realizan predicciones de variables meteorológicas
aplicando en todas y cada una de ellas diferentes variaciones del algoritmo del banco de
pruebas que implementa el modelo predictivo. En todas ellas el sistema de clasificación
empleado es la ANN, en los artículos 1 y 2 se conserva la configuración de 24 neuronas
en la capa oculta y 1 en la capa de salida con un tamaño de ventana deslizante de
5 muestras. En el artículo 3 se varían estas características para comprobar más variantes
de la misma.

MODELOS DE PREDICCIÓN METEOROLÓGICA BASADOS EN MÉTODOS DE CLASIFICACIÓN ORIENTADOS A LA
MEJORA DE LA EFICIENCIA ENERGÉTICA EN LOS PROCESOS DE GENERACIÓN.
TESIS DOCTORAL JOSÉ GUSTAVO HERNÁNDEZ TRAVIESO
27
En el artículo 1 se realiza mediante una normalización por décadas de los valores
de las variables meteorológicas en estudio. Se realiza esta normalización previamente a
la realización de los experimentos y se vuelve a desnormalizar una vez obtenidos los
resultados. En este caso, se realiza la predicción de la velocidad del viento, aplicada a la
generación de energía eólica.
En el artículo 2 se realiza el método del más votado. Este método consiste en la
repetición del experimento en su totalidad (fases de entrenamiento y test) un número
de veces determinado. Como consecuencia de esta repetición el MAE que se obtiene se
va reduciendo hasta llegar un momento en que se mantiene constante. En este caso, se
obtiene una predicción de temperatura.
En el artículo 3 se realiza el método de Score Fusion, consistente en utilizar varias
ANN en paralelo y con los valores de salida obtenidos de cada una de ellas realizar una
media que es el valor final obtenido de la predicción. Obteniendo como resultado final
una predicción de temperatura.
Si bien los artículos 1 y 2 hacen uso de la base de datos AEMET, el artículo 3 hace
uso de la base de datos de Costa Rica a la que se hacía referencia anteriormente. El
motivo no es más que el de comprobar la aplicabilidad del modelo en unas condiciones
climáticas diferentes a las conocidas en Canarias y a miles de kilómetros de distancia.
Todas las variables meteorológicas pueden caracterizarse como impulsos o
señales de entrada a un sistema, por lo que son fácilmente abordables por los sistemas
de clasificación estudiados a lo largo de esta Investigación y que han sido comentados
anteriormente.
Para tratar de explicar mejor el Modelo Predictivo se presenta en la siguiente
ilustración el diagrama de bloques general que lo forma.

MODELOS DE PREDICCIÓN METEOROLÓGICA BASADOS EN MÉTODOS DE CLASIFICACIÓN ORIENTADOS A LA
MEJORA DE LA EFICIENCIA ENERGÉTICA EN LOS PROCESOS DE GENERACIÓN.
TESIS DOCTORAL JOSÉ GUSTAVO HERNÁNDEZ TRAVIESO
28
Ilustración 4: Diagrama de bloques del Modelo Predictivo.
Partiendo de la Base de Datos formada por los valores numéricos de las diversas
variables meteorológicas captadas por las estaciones de que dispone la AEMET por el
territorio español, se realiza un preprocesado de las mismas. Hecho esto, se introducen
en el algoritmo predictivo diseñado e implementado, sometiendo los datos a un banco
de pruebas. Como resultado, se obtiene una predicción precisa de aquella variable
meteorológica que se desea estudiar.
Se demostrará la efectividad del Modelo Predictivo para obtener valores muy
próximos a los reales en cada variable meteorológica a estudiar (temperatura, radiación
solar y velocidad del viento). Para ello hay que buscar la combinación de variables
meteorológicas que ofrecen un mejor resultado según la variable en estudio.
Presentación de los trabajos publicados
Al ser esta una Tesis Doctoral por Compendio de Publicaciones, en este apartado
se presentan (de la más reciente a la más antigua) las referencias de los tres artículos
científicos que la componen. Se indica además el IF, posición en el ranking y cuartil según
el JCR 2017 al que pertenece cada uno de ellos. También se indica la página en la que se
encuentra cada uno de ellos dentro de esta Tesis Doctoral.
1. Hernández-Travieso, J.G., Travieso-González, C.M., Alonso-Hernández,
J.B., Ravelo-García, A.G., Canino-Rodríguez, J.M. “Modeling a robust
wind-speed forecasting to apply to wind-energy production.” Neural

MODELOS DE PREDICCIÓN METEOROLÓGICA BASADOS EN MÉTODOS DE CLASIFICACIÓN ORIENTADOS A LA
MEJORA DE LA EFICIENCIA ENERGÉTICA EN LOS PROCESOS DE GENERACIÓN.
TESIS DOCTORAL JOSÉ GUSTAVO HERNÁNDEZ TRAVIESO
29
Computing & Applications 2018, pp. 1-15.
https://doi.org/10.1007/s00521-018-3619-6
JCR 2017: IF: 4.213, 15/132, Q1 (Computer Science, Artificial Intelligence)
Página: 57
La ilustración siguiente representa el diagrama de bloques para el
artículo 1.
Ilustración 5: Diagrama de bloques del Modelo Predictivo para el artículo Modeling a robust wind-speed
forecasting to apply to wind-energy production
2. Hernández-Travieso, J.G., Ravelo-García, A.G., Alonso-Hernández, J.B.,
Travieso-González, C.M. “Neural networks fusion for temperature
forecasting.” Neural Computing & Applications 2018, S.I.: Advances in
Bio-Inspired Intelligent Systems, pp. 1-12.
https://doi.org/10.1007/s00521-018-3450-0
JCR 2017: IF: 4.213, 15/132, Q1 (Computer Science, Artificial Intelligence)
Página: 75
La ilustración siguiente representa el diagrama de bloques para el
artículo 2.
Ilustración 6: Diagrama de bloques del Modelo Predictivo para el artículo Neural networks fusion for
temperature forecasting

MODELOS DE PREDICCIÓN METEOROLÓGICA BASADOS EN MÉTODOS DE CLASIFICACIÓN ORIENTADOS A LA
MEJORA DE LA EFICIENCIA ENERGÉTICA EN LOS PROCESOS DE GENERACIÓN.
TESIS DOCTORAL JOSÉ GUSTAVO HERNÁNDEZ TRAVIESO
30
3. Hernández-Travieso, J.G., Herrera-Jiménez, A.L., Travieso-González,
C.M., Morgado-Dias, F., Alonso-Hernández, J. B., Ravelo-García, A.G.
“Temperature Control by Its Forecasting Applying Score Fusion for
Sustainable Development.” Sustainability 2017, 9, 193
http://www.mdpi.com/2071-1050/9/2/193
JCR 2017: IF: 2.075, 21/33, Q3 (Green & Sustainable Science &
Technology), 120/241, Q3 (Environmental Science)
Página: 89
La ilustración siguiente representa el diagrama de bloques para el
artículo 3.
Ilustración 7: Diagrama de bloques del Modelo Predictivo para el artículo Temperature Control by Its
Forecasting Applying Score Fusion for Sustainable Development.
El doctorando es el primer autor de todas y cada una de ellas.
Tal como se observa en el título de las mismas, en todas ellas se realizan
predicciones de magnitudes meteorológicas, aplicando el mismo método de
clasificación, conservando la unidad temática de la Tesis Doctoral.
MODELOS DE PREDICCIÓN METEOROLÓGICA BASADOS EN MÉTODOS DE CLASIFICACIÓN ORIENTADOS A LA
MEJORA DE LA EFICIENCIA ENERGÉTICA EN LOS PROCESOS DE GENERACIÓN.
TESIS DOCTORAL JOSÉ GUSTAVO HERNÁNDEZ TRAVIESO
31
Trabajos publicados
A continuación se presentan los tres trabajos publicados para la obtención del
Compendio de Publicaciones. La presentación se hará del trabajo más reciente al más
antiguo. En primer lugar se muestra un resumen de cada publicación en español al estar
todos los artículos publicados en inglés. Y a continuación la copia de cada publicación,
indicando título, revista, JCR 2017 (IF, ranking, cuartil y categoría) y fecha de publicación
online de cada uno de ellos acompañado de la URL correspondiente.

MODELOS DE PREDICCIÓN METEOROLÓGICA BASADOS EN MÉTODOS DE CLASIFICACIÓN ORIENTADOS A LA
MEJORA DE LA EFICIENCIA ENERGÉTICA EN LOS PROCESOS DE GENERACIÓN.
TESIS DOCTORAL JOSÉ GUSTAVO HERNÁNDEZ TRAVIESO
32

MODELOS DE PREDICCIÓN METEOROLÓGICA BASADOS EN MÉTODOS DE CLASIFICACIÓN ORIENTADOS A LA
MEJORA DE LA EFICIENCIA ENERGÉTICA EN LOS PROCESOS DE GENERACIÓN.
TESIS DOCTORAL JOSÉ GUSTAVO HERNÁNDEZ TRAVIESO
33
Resumen Artículo “Modeling a robust wind-speed forecasting to apply to
wind-energy production”
Resumen
Para obtener energías renovables, es importante conocer con antelación una
estimación de las condiciones meteorológicas. En el caso de la energía eólica, otro factor
importante e la determinación del momento adecuado para detener la turbina en caso
de vientos fuertes para prevenir daños. Esta investigación presenta una herramienta, no
solo para incrementar la generación de energías limpias utilizando el viento, reduciendo
las emisiones de CO2, sino también para prevenir las averías en las turbinas, lo cual es
especialmente interesante para los fabricantes.
Utilizando ANN y datos de las estaciones meteorológicas ubicadas en los
aeropuertos de Gran Canaria y Tenerife Sur (ambos en las Islas Canarias, España), se
presenta una sistema predictor robusto capaz de determinar la velocidad del viento con
un MAE de 0.29 m/s.
Introducción
En un mundo en el que las fuentes de energía predominantes provienen de
combustibles fósiles y los países tratan de liderar estrategias que reduzcan las emisiones
de CO2, la Unión Europea desarrolló el 7º Programa de Acción Medioambiental con el
fin de reducir emisiones e incrementar la generación de energías limpias en 2020.
En diciembre de 2015 se celebró en París la 21ª edición de Conferencia de las Partes de
la Convención Marco de Naciones Unidas sobre el Cambio Climático (COP21), en ella sus
participantes acordaron reducir el incremento global de temperatura en menos de 2 °C
y el objetivo de alcanzar el 100% de energías renovables en la lucha contra el cambio
climático.
Estos son tan solo dos ejemplos de la importancia de utilizar energías renovables,
no solo por beneficios económicos, sino también medioambientales.

MODELOS DE PREDICCIÓN METEOROLÓGICA BASADOS EN MÉTODOS DE CLASIFICACIÓN ORIENTADOS A LA
MEJORA DE LA EFICIENCIA ENERGÉTICA EN LOS PROCESOS DE GENERACIÓN.
TESIS DOCTORAL JOSÉ GUSTAVO HERNÁNDEZ TRAVIESO
34
La isla canaria de El Hierro utiliza desde el 27 de junio de 2014 una central
hidroeólica que es capaz de generar el 100% de la energía utilizada en la isla, tan solo
con fuentes renovables. Gracias a sus especiales condiciones meteorológicas y
orográficas es posible conseguir este objetivo. Gracias a esta central, se ha logrado
ahorrar 1.8 millones de euros al año y se ha evitado emisión de 18700 toneladas de
dióxido de azufre y 400 toneladas de óxido de nitrógeno al año.
La contribución de esta investigación radica en dos ejes principales. Primero,
mejorando la generación de energía eólica, lo cual es especialmente interesante en las
Islas Canarias, con unas condiciones inmejorables que hacen que fabricantes como
Siemens-Gamesa estén probando en Arinaga el mayor aerogenerador off-shore de
España y uno de los mayores del mundo. Segundo, ayudando a la reducción de costes
en los procesos de generación energética, reduciendo las emisiones de CO2 gracias a
precisas predicciones climatológicas, y, por lo tanto, logrando edificios más eficientes
desde el punto de vista del consumo energético. Además, puede usarse como producto
de valor añadido para compañías turísticas a la hora de organizar actividades en el
momento adecuado.
Por medio del diseño e implementación del modelo para la velocidad del viento,
esta contribución puede ser posible.
Las estaciones meteorológicas utilizadas en este estudio están localizadas en el
Aeropuerto de Gran Canaria y el Aeropuerto de Tenerife Sur y están controladas por la
AEMET. Estas estaciones están situadas cerca de lugares donde el viento tiene gran
importancia como son Pozo Izquierdo en Gran Canaria (a menos de 12 km de la estación)
y El Médano en Tenerife (a menos de 5km de la estación), en ambos lugares se desarrolla
el Campeonato del Mundo de Windsurf de la PWA (Professional Windsurfers Association
World Tour). Además, la región sureste de ambas islas tiene gran importancia en la
generación de energía eólica y poseen las mismas condiciones climáticas, en relación a
las condiciones del terreno, como la ubicación de ambas estaciones en los aeropuertos.
El diagrama de bloques que forma el modelo consta de dos modos claramente
diferenciados, como clasificador supervisado que es. Un modo de entrenamiento en el

MODELOS DE PREDICCIÓN METEOROLÓGICA BASADOS EN MÉTODOS DE CLASIFICACIÓN ORIENTADOS A LA
MEJORA DE LA EFICIENCIA ENERGÉTICA EN LOS PROCESOS DE GENERACIÓN.
TESIS DOCTORAL JOSÉ GUSTAVO HERNÁNDEZ TRAVIESO
35
que se utilizan los datos de entrenamiento del sistema, y un modo de test en el que se
utilizan los datos de test. La parte inicial del modelo debe ser la misma para ambos
modos. El modelo se genera en el modo de entrenamiento y posteriormente es utilizado
en el modo de test con muestras ciegas para obtener el modelado de la velocidad del
viento.
La predicción puede utilizarse en una turbina para, dependiendo de sus
características técnicas, poder indicar la energía que puede producir.
Materiales y métodos
La base de datos utilizada proviene de la AEMET y se obtiene en hojas en formato
.xls. Una hoja por fenómeno meteorológico conteniendo los datos da ambas estaciones
por un periodo de 5 años, de 2003 a 2007 ambos inclusive. La frecuencia de muestreo
es de 60 minutos.
Para introducir correctamente los datos en la ANN bajo entorno Matlab, se hacen
necesarios seguir los pasos siguientes:
a) Separar los datos de las diferentes estaciones: debido a que éstos vienen en una
sola hoja Excel.
b) Revisar los datos: ya que en ocasiones hay ausencia de datos por diversos
motivos, averías de los sensores, labores de mantenimiento o cambios en la
frecuencia de recogida de muestras para algún parámetro. Cuando esta ausencia
de datos es detectada, el día completo se elimina para no introducir datos falsos
en la ANN.
c) Unión de datos para introducirlos en Matlab: éste es un paso significativo en la
metodología, ya que en primer lugar es necesario detectar los fenómenos que
ofrecen más información de acuerdo a la ausencia de datos, la existencia de
datos a lo largo de todo el periodo de tiempo de estudio. Por estos motivos, se
desechan los datos relativos a:
a. Humedad: solo presenta datos de manera continua en los dos últimos
años de estudio.

MODELOS DE PREDICCIÓN METEOROLÓGICA BASADOS EN MÉTODOS DE CLASIFICACIÓN ORIENTADOS A LA
MEJORA DE LA EFICIENCIA ENERGÉTICA EN LOS PROCESOS DE GENERACIÓN.
TESIS DOCTORAL JOSÉ GUSTAVO HERNÁNDEZ TRAVIESO
36
b. Meteoros: para este estudio, no son una fuente significativa de
información.
c. Nubosidad: no presenta datos de manera continua durante el día.
d. Radiación solar: no presenta datos de manera continua durante el día.
En segundo lugar, los datos ofrecidos por la AEMET son adaptados a unidades
más precisas y se añaden al fichero resultante que contiene los datos de precipitación
(en décimas de mm) de AEMET, temperatura (en décimas de °C) de AEMET, velocidad
del viento (en km/h) de AEMET, temperatura en °C, precipitación en mm, y velocidad
del viento en m/s.
Hecho esto se introduce los datos en la ANN bajo entorno Matlab. Habiendo
logrado un total de 84190 muestras que permiten realizar el estudio en dos
localizaciones geográficas diferentes GC y TF.
En esta investigación se utiliza ANN con perceptrón multicapa feed forward y
algoritmo BP como sistema de predicción, con 24 neuronas en la capa oculta y 1 neurona
en la capa de salida. La inicialización de pesos de los valores de la ANN es aleatoria. En
base a métodos heurísticos, se escogió esta configuración de la ANN para obtener
resultados con gran precisión.
La ventana deslizante que se utiliza en esta investigación está formada por un
número de muestras que llevan a un valor de predicción futura, el valor de velocidad del
viento para la hora siguiente y que debe ser muy próximo al valor real que se obtendrá
en la estación. El tamaño de ventana deslizante utilizado es de 5 muestras de estudio
(correspondiente a cinco horas anteriores) en cada serie de datos. Obteniendo el valor
de velocidad del viento de la hora siguiente. Hecho esto, la ventana se desplaza una
muestra, y ese valor objetivo (el real) se introduce formando una nueva ventana y así
sucesivamente.
Para obtener la predicción se siguen dos caminos. En el primero de ellos se
utilizan los datos ofrecidos por las estaciones meteorológicas, con las consideraciones
explicadas anteriormente. En el segundo, se realiza una normalización por décadas
(dividiendo por 10, 20 o 100), logrando reducir la dispersión de los valores de entrada lo

MODELOS DE PREDICCIÓN METEOROLÓGICA BASADOS EN MÉTODOS DE CLASIFICACIÓN ORIENTADOS A LA
MEJORA DE LA EFICIENCIA ENERGÉTICA EN LOS PROCESOS DE GENERACIÓN.
TESIS DOCTORAL JOSÉ GUSTAVO HERNÁNDEZ TRAVIESO
37
que conlleva a reducir el error a la salida de la ANN ya que ésta puede modificar mejor
los valores de los pesos de los datos de entrada.
Los experimentos a realizar serán los siguientes:
a) Usando datos normalizados y sin normalizar de AEMET.
b) Usando datos normalizados y sin normalizar de AEMET con unidades más
precisas.
c) Usando diferentes fenómenos unidos (fusión de datos normalizados y sin
normalizar). En este caso los datos a utilizar serán los correspondientes a
aquéllos con unidades más precisas según los resultados obtenidos en a)
y b).
En todos los casos, los valores utilizados para obtener la predicción son valores
pasados de los fenómenos en estudio.
Durante la investigación se han realizado pruebas con varias combinaciones de
fenómenos para obtener la mejor predicción en función del fenómeno bajo estudio.
Para entrenar la ANN se utiliza el año 2006 debido a que el número de muestras que
presenta este año es próximo a la media de muestras de los años en estudio, testeando
la ANN con los años restantes. De acuerdo a los resultados, y siempre basado en
métodos heurísticos, se verifica la mejor opción para obtener la mayor precisión en la
predicción de la velocidad del viento.
Resultados
Los resultados muestran los valores obtenidos a lo largo de todo el año bajo
estudio, no el mejor valor puntual obtenido a lo largo del mismo. Se presentan los
parámetros estadísticos de mínimo, máximo, MAE, desviación estándar y error
cuadrático medio para las estaciones de GC y TF entre el valor real medido por la
estación y el valor de la predicción obtenido por la ANN. El estadístico que marcará la
bondad del sistema será el MAE para poder compararlo con los estudios existentes.
También se presenta el tiempo de entrenamiento y el de test por muestra en

MODELOS DE PREDICCIÓN METEOROLÓGICA BASADOS EN MÉTODOS DE CLASIFICACIÓN ORIENTADOS A LA
MEJORA DE LA EFICIENCIA ENERGÉTICA EN LOS PROCESOS DE GENERACIÓN.
TESIS DOCTORAL JOSÉ GUSTAVO HERNÁNDEZ TRAVIESO
38
milisegundos. Independientemente de los datos, las unidades utilizadas para presentar
los resultados son siempre las unidades más precisas.
En el caso de los experimentos del tipo a) y utilizando datos sin normalizar el
mejor resultado se obtiene en la estación de GC el año 2003 con un MAE de 0.89 m/s.
Cuando los datos son normalizados por 100 en la estación de GC en el año 2003 se
obtiene un MAE de 1.15 m/s.
En el caso de los experimentos del tipo b) y utilizando datos sin normalizar el
mejor resultado se obtiene en la estación de GC el año 2003 con un MAE de 0.85 m/s.
Cuando los datos son normalizados por 100 en la estación de GC en el año 2003 se
obtiene un MAE de 0.29 m/s.
En el caso de los experimentos del tipo c) y utilizando datos sin normalizar de
velocidad del viento y temperatura, el mejor resultado se obtiene en la estación de GC
el año 2003 con un MAE de 0.84 m/s. Cuando los datos de velocidad del viento y
temperatura son normalizados por 100 en la estación de GC en el año 2003 se obtiene
un MAE de 0.44 m/s.
Discusión
En términos de generación de energía es posible establecer una relación entre
velocidad del viento y producción de energía utilizando la curva de carga del
aerogenerador.
Para el caso particular del Gamesa G52-850 Kw, la pendiente de la curva de carga
indica que una variación de 1 m/s corresponde con 100 kW de energía generada. De
acuerdo a esto, esta investigación alcanza un error de 0.29 m/s correspondiente a
29 kW o un 3.43% de desviación.
Comparativamente con los estudios previos, este sistema supone una mejora y
abre la vía de más investigaciones.

MODELOS DE PREDICCIÓN METEOROLÓGICA BASADOS EN MÉTODOS DE CLASIFICACIÓN ORIENTADOS A LA
MEJORA DE LA EFICIENCIA ENERGÉTICA EN LOS PROCESOS DE GENERACIÓN.
TESIS DOCTORAL JOSÉ GUSTAVO HERNÁNDEZ TRAVIESO
39
Conclusión
Una vez el estudio se ha llevado a cabo, se ha comprobado que el fenómeno que
ofrece mayor información para obtener una predicción de velocidad del viento es la
velocidad del viento. Por otro lado, la precipitación no provee información relevante
para una correcta predicción de velocidad del viento.
El resultado se presenta como el valor medio de todo el año bajo estudio, no es
el mejor resultado puntual obtenido en el mismo, para una localización específica.
El uso de unidades más precisas ofrece mejores resultados que los datos
ofrecidos directamente por la AEMET 0.29 frente a 0.86 m/s respectivamente. Los
tiempos de predicción son muy cortos.
La gran fortaleza del modelo es que no necesita poseer diversos tipos de datos
para ofrecer una predicción precisa, esto quiere decir que, aunque la humedad,
nubosidad y radiación solar puedan ser variables importantes, el sistema es capaz de
conseguir predicciones muy precisas sin utilizarlas.
Otra de las fortalezas del sistema es la versatilidad, alcanzando gran precisión en
la predicción de diversas variables meteorológicas en diferentes localizaciones
geográficas, ayudando a generar energías renovables y reduciendo las emisiones de CO2.
La predicción puede ser utilizada en un aerogenerador para, en función de sus
características técnicas, poder saber la cantidad de energía a generar.
Finalmente, otra ventaja es el periodo de muestreo ya que independientemente
de que se compare con otros trabajos con periodos inferiores, los resultados obtenidos
son mejores. Además, el sistema puede ser una herramienta interesante para pequeños
productores de energía como casas aisladas o empresas que quieren hacer utilizar
energías renovables en lugar de o además de aquellas obtenidas con combustibles
fósiles.

MODELOS DE PREDICCIÓN METEOROLÓGICA BASADOS EN MÉTODOS DE CLASIFICACIÓN ORIENTADOS A LA
MEJORA DE LA EFICIENCIA ENERGÉTICA EN LOS PROCESOS DE GENERACIÓN.
TESIS DOCTORAL JOSÉ GUSTAVO HERNÁNDEZ TRAVIESO
40
MODELOS DE PREDICCIÓN METEOROLÓGICA BASADOS EN MÉTODOS DE CLASIFICACIÓN ORIENTADOS A LA
MEJORA DE LA EFICIENCIA ENERGÉTICA EN LOS PROCESOS DE GENERACIÓN.
TESIS DOCTORAL JOSÉ GUSTAVO HERNÁNDEZ TRAVIESO
41
Resumen Artículo “Neural networks fusion for temperature forecasting”
Resumen
Las condiciones meteorológicas tienen una relación directa con el consumo
energético, las actividades turísticas y las tareas agrícolas. Mediante la fusión de ANN,
este trabajo presenta un sistema con un método general que permite obtener precisas
predicciones de temperatura. El objetivo del mismo es la temperatura, pero el método
es fácilmente escalable para su aplicación a cualquier otra variable meteorológica de
interés, lo cual es una de las fortalezas del modelo. Esta investigación realiza un
modelado de predicciones de temperatura, contribuyendo a la obtención de mejores
resultados, con aplicaciones que van desde la generación energética al turismo o
agricultura. La base de datos contiene información proporcionada durante 5 años por
las estaciones situadas en el Aeropuerto de Gran Canaria y en el Aeropuerto de Tenerife
Sur. Los datos se recogen cada hora, lo que significa un total de más de 100000 muestras,
lo que da robustez al estudio. Con este método, el mejor resultado en términos de MAE
es de 0.41 °C.
Introducción
Este trabajo presenta un nuevo modelo de fusión de ANN para obtener
predicciones de temperatura. Utilizando el método del más votado, esta propuesta
puede aplicarse en la mejora de la eficiencia de los procesos de generación de energía y
para incrementar el uso de energías renovables.
En la actualidad las fuentes derivadas del petróleo o el carbón son las más
utilizadas en los procesos de generación energética, contribuyendo al incremento de
temperatura y el efecto invernadero.
Además, en España y Portugal, la eficiencia en los procesos de generación con
combustibles fósiles en 2013 era solo del 39.20%, frente al 80% de la energía hidráulica,
lo cual representa claramente el interés de utilizar energías renovables para obtener
mejores eficiencias en los procesos de generación.

MODELOS DE PREDICCIÓN METEOROLÓGICA BASADOS EN MÉTODOS DE CLASIFICACIÓN ORIENTADOS A LA
MEJORA DE LA EFICIENCIA ENERGÉTICA EN LOS PROCESOS DE GENERACIÓN.
TESIS DOCTORAL JOSÉ GUSTAVO HERNÁNDEZ TRAVIESO
42
Es nuestra tarea enfrentarnos a esa realidad y reconvertirla por medio de la
utilización de energías renovables.
En las Islas Canarias, puede observarse un ejemplo de ello en la Isla de El Hierro.
En ella se utiliza la caída de agua entre dos depósitos situados a diferentes altitudes para
generar energía de manera limpia. Unos aerogeneradores se encargan de generar la
energía necesaria para desplazar nuevamente el agua del depósito inferior al superior.
Esto brinda la posibilidad de que la isla utilice fuentes limpias para generar la electricidad
necesaria para su abastecimiento. Además del beneficio económico que supone el
ahorro de 6000 toneladas de diésel, creando un ahorro de 1.8 millones de euros al año,
se evita emitir 18700 toneladas de CO2, 100 toneladas de dióxido de azufre y 400
toneladas de óxido de nitrógeno, con lo que ello representa de beneficio
medioambiental.
En un intento de contribuir en esta área, este trabajo ayuda, por un lado, a
incrementar la eficiencia energética en los procesos de generación debido a que una
precisa predicción de temperatura ayuda a reducir costes cuando se emplean fuentes
de combustible fósiles, reduciendo las emisiones de CO2 y haciendo más eficientes los
edificios. Por otro lado, puede ser un impulso a la generación con fuentes renovables
mediante el uso y/o combinación de energía solar y eólica. Permite además que las
empresas turísticas puedan realizar sus actividades en el momento adecuado,
convirtiéndose en un producto de valor añadido.
Esta contribución puede ser posible gracias al diseño e implementación de fusión
de ANN. Los datos meteorológicos empleados se obtienen de las estaciones
meteorológicas de que dispone la AEMET tanto en el Aeropuerto de Gran Canaria, como
en el Aeropuerto de Tenerife Sur.
Preprocesado
Es una etapa que requiere tres pasos para la correcta introducción de los datos
meteorológicos en el sistema de clasificación utilizado, la ANN.
MODELOS DE PREDICCIÓN METEOROLÓGICA BASADOS EN MÉTODOS DE CLASIFICACIÓN ORIENTADOS A LA
MEJORA DE LA EFICIENCIA ENERGÉTICA EN LOS PROCESOS DE GENERACIÓN.
TESIS DOCTORAL JOSÉ GUSTAVO HERNÁNDEZ TRAVIESO
43
a) Separación de datos de diferentes estaciones: debido a que los datos se obtienen
en un fichero con formato .xls conteniendo la información de ambas estaciones
para cada fenómeno meteorológico. La separación en dos ficheros diferentes,
uno para cada estación, permite le realización de dos estudios separadamente,
uno para cada estación.
b) Revisión de datos: eventos como averías, cambios en la rutina de recogida de
datos o cualquier acontecimiento que lleve a la ausencia de datos por un periodo
de tiempo que puede variar de una o dos horas a incluso un día. En aquellos días
en que esta incidencia ocurre, se eliminan los datos por completo, evitando
introducir datos erróneos o falsos en el sistema.
c) Unión de los datos en Matlab: es la última etapa. Una vez los datos se han unido
correctamente son introducidos en Matlab. En primer lugar se investiga qué
fenómeno meteorológico ofrece mayor información (existencia de mayor
cantidad de datos adquiridos durante los 5 años de estudio), en base a ello, se
eliminan de la base de datos los siguientes fenómenos:
a. Humedad: solo hay datos de los años 2006 y 2007.
b. Meteoros: es una variable no significativa en este estudio.
c. Nubosidad: los datos no se presentan de manera continua a lo largo del
día.
Finalmente, es necesario transformar el fichero .xls en un fichero .txt utilizando
Matlab. Este último será el que se introduce en Matlab para lograr la predicción de
temperatura en este estudio. También se adaptan los datos ofrecidos por la AEMET a
unidades más precisas y se añaden al fichero resultante que contiene los datos de
precipitación (en décimas de mm) de AEMET, temperatura (en décimas de °C) de
AEMET, velocidad del viento (en km/h) de AEMET, temperatura en °C, precipitación en
mm, velocidad del viento en m/s, radiación solar de AEMET (en decenas de kJ/m2) y
radiación solar (en kWh/ m2).

MODELOS DE PREDICCIÓN METEOROLÓGICA BASADOS EN MÉTODOS DE CLASIFICACIÓN ORIENTADOS A LA
MEJORA DE LA EFICIENCIA ENERGÉTICA EN LOS PROCESOS DE GENERACIÓN.
TESIS DOCTORAL JOSÉ GUSTAVO HERNÁNDEZ TRAVIESO
44
Sistema de predicción
Este trabajo utiliza la ANN como sistema de predicción. Una ANN es una máquina
que está diseñada para modelar la forma en la que se comporta el cerebro cuando
realiza una tarea o función de interés. Ésta puede implementarse mediante
componentes electrónicos o en un ordenador utilizando software.
La ANN utilizada en este estudio utilizada perceptrón multicapa feed forward con
algoritmo BP, 24 neuronas en la capa oculta y 1 en la capa de salida. El algoritmo BP se
utiliza para reducir el error resultante en pos de obtener una mejor predicción de
temperatura. Se utiliza la aproximación BP, que está basada en el algoritmo
Lavenberg-Marquardt. El algoritmo Lavenberg-Marquardt está diseñado para aproximar
el entrenamiento de segundo orden sin necesidad de calcular la matriz hessiana que
presenta las segundas derivadas parciales.
La ventana deslizante utilizada en este trabajo consta de cinco muestras de
estudio permitiendo la obtención del valor a predecir y que debe ser muy próximo al
valor real. A continuación, la ventana se desliza una muestra y el proceso se repite.
Metodología experimental
a) Base de datos:
Se utilizan datos recolectados por estaciones dependientes de la AEMET relativos a
velocidad del viento, precipitación, humedad, temperatura, radiación solar, nubosidad
y meteoros.
El motivo de su utilización es la fiabilidad de la institución, dependiente del Gobierno
de España y la localización de las estaciones utilizadas, próximas a zonas donde la
generación de energías renovables es posible.
Cada fenómeno meteorológico está contenido en un único fichero .xls con datos de
las dos estaciones (GC y TF) juntas para un periodo de 5 años (2003 a 2007 ambos
inclusive).
MODELOS DE PREDICCIÓN METEOROLÓGICA BASADOS EN MÉTODOS DE CLASIFICACIÓN ORIENTADOS A LA
MEJORA DE LA EFICIENCIA ENERGÉTICA EN LOS PROCESOS DE GENERACIÓN.
TESIS DOCTORAL JOSÉ GUSTAVO HERNÁNDEZ TRAVIESO
45
Los datos de temperatura, precipitación, radiación solar y velocidad del viento se
recogen cada hora por el sensor específico localizado en la estación. Tal como se explicó
anteriormente, una serie de datos no se han incluido en este estudio.
b) Experimentos:
Una vez se ha concluido la etapa de preprocesado, los datos se introducen en
entorno Matlab para ser procesados por la ANN. Se harán experimentos con dos
combinaciones de datos, una con radiación (incluye temperatura, radiación solar,
precipitación y velocidad del viento) y otra sin radiación (incluye temperatura,
precipitación y velocidad del viento).
La razón de esta diferenciación en cuanto a los datos a utilizar es debida a la no
existencia de datos de radiación durante todo el tiempo de estudio.
Se seguirán dos líneas para conseguir una precisa predicción de temperatura. Por un
lado, se obtendrá la predicción de temperatura realizando el experimento una sola vez.
Por otro lado, se utiliza el método del más votado, consistente en la repetición de
todo el procesado de datos (entrenamiento y test) para todos los datos involucrados un
número específico de veces (100 veces en este caso). Durante este proceso, el MAE se
va reduciendo paulatinamente hasta permanecer constante. El resultado final es el fruto
de la media aritmética de los resultados obtenidos en cada repetición, a esto es a lo que
se llama fusión en este trabajo. Con esto se logra una mejora frente a la realización de
los experimentos una sola vez.
Aplicando métodos heurísticos, se introduce la información proveniente de las
estaciones, bien en la forma que la proporciona la AEMET, bien utilizando unidades más
precisas.
De acuerdo a esto, se realizan los siguientes experimentos:
1) Utilizando datos de la AEMET:
a. Una vez.
b. Método del más votado.

MODELOS DE PREDICCIÓN METEOROLÓGICA BASADOS EN MÉTODOS DE CLASIFICACIÓN ORIENTADOS A LA
MEJORA DE LA EFICIENCIA ENERGÉTICA EN LOS PROCESOS DE GENERACIÓN.
TESIS DOCTORAL JOSÉ GUSTAVO HERNÁNDEZ TRAVIESO
46
2) Utilizando unidades más precisas:
a. Una vez.
b. Método del más votado.
3) Utilizando diferentes fenómenos unidos: fusión de datos.
a. Una vez.
b. Método del más votado.
En todo el estudio, se utilizan los datos pasados de cada fenómeno involucrado
en la predicción.
Para obtener la configuración correcta de la ANN en términos de número de
repeticiones de entrenamiento y número correcto de neuronas en capa oculta, se
aplicaron métodos heurísticos.
El sistema fue entrenado aplicando Neural Networks Toolbox de Matlab. De
acuerdo al número de muestras contenido, próximo a la media de las de todos los años
incluidos en el estudio, el año 2006 se utilizó para entrenar la ANN, testeando la ANN
con los demás años restantes.
Este es uno de los puntos fuertes del sistema, ya que solo se emplea el 20% de
las muestras en entrenamiento y se testea con el 80% de las muestras que forman el
estudio.
De acuerdo a los resultados obtenidos, se elige la mejor combinación de
fenómenos meteorológicos para obtener la predicción.
Resultados
Los resultados muestran los parámetros estadísticos de mínimo, máximo, MAE,
desviación estándar y error cuadrático medio para las estaciones de GC y TF entre el
valor real medido por la estación y el valor de la predicción obtenido por la ANN. El
estadístico que marcará la bondad del sistema será el MAE. También se presenta el
tiempo de entrenamiento (tiempo empleado en entrenar el sistema) y el de test por
muestra (tiempo en el que se procesa una muestra) en segundos. Independientemente
MODELOS DE PREDICCIÓN METEOROLÓGICA BASADOS EN MÉTODOS DE CLASIFICACIÓN ORIENTADOS A LA
MEJORA DE LA EFICIENCIA ENERGÉTICA EN LOS PROCESOS DE GENERACIÓN.
TESIS DOCTORAL JOSÉ GUSTAVO HERNÁNDEZ TRAVIESO
47
de los datos, las unidades utilizadas para presentar los resultados son siempre las
unidades más precisas.
En el caso de los experimentos 1.a) el mejor resultado se obtuvo en GC utilizando
datos de temperatura en el año 2003 con una MAE de 0.44 °C. En el caso 1.b) el mejor
resultado se obtuvo en GC también en el año 2003 utilizando datos de temperatura con
0.42 °C, en este caso, el MAE permanece constante desde la repetición número 42.
En el caso de los experimentos 2.a) el mejor resultado se obtuvo en GC utilizando
datos de temperatura en el año 2003 con una MAE de 0.42 °C. En el caso 2.b) el mejor
resultado se obtuvo en GC también en el año 2003 utilizando datos de temperatura con
0.41 °C, en este caso, el MAE permanece constante desde la repetición número 56.
En el caso de los experimentos 3.a) el mejor resultado se obtuvo en GC utilizando
datos de temperatura, precipitación y velocidad del viento en el año 2003 con una MAE
de 0.44 °C. En el caso 3.b) el mejor resultado se obtuvo en GC también en el año 2003
utilizando datos de temperatura, precipitación y velocidad del viento con 0.42 °C, en
este caso, el MAE permanece constante desde la repetición número 87.
Conclusiones
Este trabajo demuestra que la técnica nueva del uso de fusión de ANN mediante
el método del más votado obtiene mejores resultados que cuando se utiliza una sola
ANN, 0.41 °C frente a 0.42 °C.
Respecto a la predicción de temperatura, la precipitación proporciona menor
cantidad de información. Por el contrario, si la precipitación se une a la temperatura y a
la velocidad del viento para lograr una predicción de temperatura, se obtienen mejores
resultados, comprobando de nuevo que la utilización de unidades más precisas ofrece
mejores resultados que aquella en la que se utilizan los datos directamente de la AEMET,
0.41 °C frente a 0.42 °C.
En comparación con anteriores estudios, el modelo aquí presentado supera a
casi todos en cuanto a precisión del resultado.

MODELOS DE PREDICCIÓN METEOROLÓGICA BASADOS EN MÉTODOS DE CLASIFICACIÓN ORIENTADOS A LA
MEJORA DE LA EFICIENCIA ENERGÉTICA EN LOS PROCESOS DE GENERACIÓN.
TESIS DOCTORAL JOSÉ GUSTAVO HERNÁNDEZ TRAVIESO
48
Tal como queda comprobado, el sistema es capaz de ofrecer una precisa
predicción de temperatura en términos de milisegundos.
La versatilidad es otra de las fortalezas del sistema, ya que es capaz de obtener
precisas predicciones de diversos fenómenos meteorológicos en diferentes ubicaciones
geográficas, ayudando a la generación de energías renovables y reduciendo las
emisiones de CO2. Además puede ser una herramienta para pequeños productores de
energía como hogares aislados o empresas que deseen utilizar energías renovables en
lugar de o además de aquellas de origen fósil.
MODELOS DE PREDICCIÓN METEOROLÓGICA BASADOS EN MÉTODOS DE CLASIFICACIÓN ORIENTADOS A LA
MEJORA DE LA EFICIENCIA ENERGÉTICA EN LOS PROCESOS DE GENERACIÓN.
TESIS DOCTORAL JOSÉ GUSTAVO HERNÁNDEZ TRAVIESO
49
Resumen Artículo “Temperature Control by Its Forecasting Applying Score Fusion
for Sustainable Development”
Resumen
El control de la temperatura y su predicción se ha convertido en un desafío de
investigación para el conocimiento del planeta y sus efectos en diferentes actividades
humanas y esto puede asegurar, en conjunción con la eficiencia energética, un
desarrollo sostenible reduciendo las emisiones de CO2 y el consumo de combustibles.
Este trabajo trata de ofrecer una solución práctica a la predicción y control de
temperatura, que tradicionalmente ha venido siendo realizada por instituciones
especializadas. Para la realización de la estimación de temperatura, se ha utilizado un
bloque de Score Fusion basado en ANN. La base de datos está compuesta por datos de
una estación meteorológica con 20000 valores de temperatura y 10000 valores de
diversos fenómenos meteorológicos. Por tanto, se resuelve la complejidad de los
modelos tradicionales de pronóstico. Obteniéndose como resultado un sistema práctico
que alcanza un error cuadrático medio de 0.136 °C para predicciones a corto plazo y de
5 °C para predicciones a largo plazo.
Introducción
Las sociedades modernas están condicionadas por múltiples factores naturales,
como por ejemplo, la climatología. Los cambios climáticos afectan diferentes aspectos
de nuestras vidas, no solo a aquellos relacionados directamente con ellos como pueda
ser el sector agropecuario, sino también sobre otros más complejos y aparentemente
disociados de la climatología como pueda ser la eficiencia energética. Ésta se convierte
en un factor importante a la hora de realizar un planeamiento sostenible en el desarrollo
urbano.
De hecho, el clima es un factor que afecta a la economía. Es especialmente
importante no solo en aquellas áreas basadas en la producción agrícola (como en los
países en desarrollo) sino también en otras áreas tecnológicamente desarrolladas y
MODELOS DE PREDICCIÓN METEOROLÓGICA BASADOS EN MÉTODOS DE CLASIFICACIÓN ORIENTADOS A LA
MEJORA DE LA EFICIENCIA ENERGÉTICA EN LOS PROCESOS DE GENERACIÓN.
TESIS DOCTORAL JOSÉ GUSTAVO HERNÁNDEZ TRAVIESO
50
cuyas economías se basan en otros sectores como puedan ser el turismo o incluso en
aquellas que tratan de aproximarse a un desarrollo sostenible a través del uso de
energías renovables. La predicción meteorológica es, por tanto, una herramienta a
modelar y desarrollar que puede ser comparada con los diferentes procedimientos para
cada área específica. En la actualidad hay tres vertientes que abordan este tema:
Climatología, actuando como tradición empírica; Física de la Atmósfera como tradición
teórica y NWP como tradición moderna. Estos recientes modelos matemáticos luchan
en la actualidad por conseguir menores tiempos de respuesta como principal objetivo.
Sin embargo, mientras más preciso es el método, mayor cantidad de datos necesita y,
por tanto, mayor cantidad de tiempo requiere para obtener la predicción.
Los servicios meteorológicos se basan en el desarrollo de algoritmos
tradicionales, pero, de hecho, existen alternativas emergentes enfocadas en el futuro
de las predicciones meteorológicas, como ANN con entrenamiento supervisado. La
predicción de temperatura a través de series temporales es una técnica importante, en
ella se observan valores pasados de diversos fenómenos meteorológicos recogidos y
analizados para desarrollar un modelo basado en la relación subyacente entre ellos. Es
importante tener en cuenta que la predicción de temperatura es un sistema caótico en
el que pequeños errores en las condiciones iniciales de la predicción crecen rápidamente
afectando las previsiones.
En esta investigación se presentan 4 contribuciones o innovaciones frente al
estado-del-arte. Primero, la utilización de la topología feedback para estudiar diferentes
configuraciones para determinar cómo es el comportamiento de esta arquitectura en la
predicción de temperatura. Segundo, la combinación de diversos fenómenos
meteorológicos como estímulo de entrada que afectan directamente los ciclos de
temperatura. Tercero, para realizar una evaluación heurística, se introduce una
optimización basada en Score Fusion para comprobar la mejora en la predicción de esta
propuesta. Finalmente, se realiza una normalización de valores de entrada, la cual puede
tener un impacto positivo durante la fase de entrenamiento del sistema.
MODELOS DE PREDICCIÓN METEOROLÓGICA BASADOS EN MÉTODOS DE CLASIFICACIÓN ORIENTADOS A LA
MEJORA DE LA EFICIENCIA ENERGÉTICA EN LOS PROCESOS DE GENERACIÓN.
TESIS DOCTORAL JOSÉ GUSTAVO HERNÁNDEZ TRAVIESO
51
Materiales y métodos
Tras estudiar estudios relacionados con predicciones con series temporales, la
topología BP es la elegida para implementar este estudio, obteniendo una mejora al
implementar Score Fusion frente a los casos en que solo se utiliza ANN. Debido a la
adaptabilidad del sistema, la topología BP es la más adecuada para obtener predicciones
realizando entrenamiento con series temporales frente a otras topologías o incluso
frente a métodos lineales.
La ANN es un paradigma de procesado de información que se basa en el sistema
nervioso biológico humano. El elemento central del mismo es la neurona, la cual gracias
a multitud de interconexiones de procesamiento permite a la ANN modelar y
representar complejas relaciones de entrada y salida.
Para realizar el método propuesto, se utiliza una base de datos recolectados en
la localidad de Turrialba (República de Costa Rica), la cual está caracterizada por un clima
de contrastes al estar rodeada por un río y en las proximidades del Volcán de Turrialba,
que afecta directamente el clima de la zona.
La base de datos se presenta en formato Excel, conteniendo varias variables
meteorológicas como temperatura, humedad, presión atmosférica, velocidad del
viento, humectación de hoja, radiación solar, etc. El periodo de toma de datos va desde
julio de 2007 a septiembre de 2008 con una frecuencia de muestreo de 30 minutos.
En la etapa de preprocesado, se escogen los elementos involucrados en la
entrada de fenómenos combinados, estudiando los elementos más influyentes en los
ciclos diarios de temperatura. Dependiendo de la limitación de la base de datos se
escogen los parámetros de hora de adquisición de datos, humectación de hoja y
radiación solar.
Posteriormente se realiza una normalización de los datos de entrada entre
(-1, 1) para resolver dos problemas. Primero, la dispersión de datos presente al trabajar
con valores con diferentes escalas de medida se ve reducido claramente. Segundo, el
rango de valores usados como peso de las neuronas de entrada es cerrado, alcanzando
una convergencia mejor y más rápida en la etapa de entrenamiento.
MODELOS DE PREDICCIÓN METEOROLÓGICA BASADOS EN MÉTODOS DE CLASIFICACIÓN ORIENTADOS A LA
MEJORA DE LA EFICIENCIA ENERGÉTICA EN LOS PROCESOS DE GENERACIÓN.
TESIS DOCTORAL JOSÉ GUSTAVO HERNÁNDEZ TRAVIESO
52
Respecto a la configuración del sistema propuesto, se basa en tres parámetros.
En primer lugar, el tamaño de la ventana deslizante que captura información de la base
de datos, representando el número de valores pasados necesarios para obtener una
predicción de temperatura. En segundo lugar, el número de neuronas en la capa oculta,
que define el número de neuronas fijas en la etapa intermedia. En tercer lugar, para
estudiar la respuesta del modelo se establecen las diversas configuraciones de los
bancos de pruebas.
Esto ofrece dos modos de trabajo claramente diferenciados. En el primero de
ellos, está caracterizado por una topología non-feedback para alcanzar valores de
predicción inmediatos, donde cada ventana deslizante formada por valores reales
estima un valor de temperatura. El segundo está caracterizado por una topología
feedback para obtener predicciones a corto plazo, en la que, a partir de una ventana
deslizante, se obtienen de manera continua valores de predicción de temperatura,
usando los valores estimados para obtener una nueva predicción.
El último paso del proceso es el de Score Fusion, específicamente la técnica de
Adding-Score se ha introducido para evaluar si es efectiva o no a la hora de mejorar el
modelo propuesto. En este caso la arquitectura BP, que otorga valores aleatorios a los
valores de los pesos de entrada a la ANN, es la utilizada. Este hecho causa que, dos ANN
idénticas en configuración, muestras de entrenamiento y test, den a su salida resultados
diferentes debido a la inicialización aleatoria de los pesos. Las respuestas, aun siendo
muy similares, no son idénticas. De este modo, el método de optimización es concebido
como una estructural neuronal con varias ANN idénticas trabajando en paralelo y a las
cuales se les realiza la media aritmética de las salidas.
Creado el modelo, se le estimula de dos formas para obtener una predicción de
temperatura, una con datos exclusivamente de temperatura (estímulo simple) y otra
combinando varios fenómenos meteorológicos (estímulo combinado).
Se definen cuatro modos de trabajo:
1) Modo 1: topología non-feedback (predicción inmediata) y estímulo simple.
2) Modo 2: topología non-feedback (predicción inmediata) y estímulo combinado.
MODELOS DE PREDICCIÓN METEOROLÓGICA BASADOS EN MÉTODOS DE CLASIFICACIÓN ORIENTADOS A LA
MEJORA DE LA EFICIENCIA ENERGÉTICA EN LOS PROCESOS DE GENERACIÓN.
TESIS DOCTORAL JOSÉ GUSTAVO HERNÁNDEZ TRAVIESO
53
3) Modo 3: topología feedback (predicción a corto plazo) y estímulo simple.
4) Modo 4 y Modo 4v2: topología feedback (predicción a corto plazo) y estímulo
combinado.
Para los modos 1 y 3 que solo utilizan valores de temperatura, se utilizan 20000
muestras mientras que para los modos 2 y 4 que utilizan varios fenómenos
meteorológicos, se emplean 10000 muestras. La diferencia en el número de muestras
es debida a la obtención de mejores resultados con ellas. La diferencia entre el Modo 4
y el Modo 4v2 es que en el Modo 4v2 se utiliza también el parámetro de la hora de
adquisición de la muestra.
Para evaluar los errores se utilizan dos criterios para ambas topologías. Para la
non-feedback se utiliza el MAE mientras que para la feedback se utiliza el error
acumulado, el cual determina la evolución del error absoluto para cada nuevo valor de
temperatura. Y que se define como el error absoluto del uso de las muestras estimadas
(las obtenidas en la predicción) para estimar las predicciones futuras.
Resultados
En esta sección se describen los mejores resultados obtenidos en los cuatro
modos explicados anteriormente. Para lograrlos se han aplicado diversos bancos de
pruebas con diversas configuraciones de la ANN, ventana deslizante, neuronas de capa
oculta y muestras de entrenamiento. Además la optimización basada en Adding-Score
ha sido aplicada a cada resultado óptimo con el fin de reducir el error obtenido.
1) Modo 1: en este caso el MAE es de 0.2639 °C y el error cuadrático medio de
0.1659 °C con ventana deslizante de tamaño 4, 12 neuronas en la capa oculta y
3000 muestras de entrenamiento.
2) Modo 2: en este caso el MAE es de 0.2294 °C y el error cuadrático medio de
0.1359 °C con ventana deslizante de tamaño 4, 8 neuronas en la capa oculta y
4000 muestras de entrenamiento.
3) Modo 3: en este caso, los parámetros de bondad del sistema no son
concluyentes y se muestran solo como indicadores de bondad. Para obtener la
MODELOS DE PREDICCIÓN METEOROLÓGICA BASADOS EN MÉTODOS DE CLASIFICACIÓN ORIENTADOS A LA
MEJORA DE LA EFICIENCIA ENERGÉTICA EN LOS PROCESOS DE GENERACIÓN.
TESIS DOCTORAL JOSÉ GUSTAVO HERNÁNDEZ TRAVIESO
54
mejor configuración de cada modo se han realizado estudios heurísticos. Esto es
debido a que el error acumulado no es instantáneo ya que es el resultado del
error actual más los anteriores errores obtenidos. Para predicciones a más largo
plazo, se hace necesario una ventana deslizante de mayor tamaño. Sin embargo,
si este valor es muy alto, la respuesta del sistema puede ser caótica debido a la
generación de una convergencia inestable en la fase de entrenamiento. En este
modo es importante saber el horizonte temporal en el que se quiere realizar la
predicción ya que para periodos de tiempos mayores, la precisión de las primeras
muestras obtenidas será inferior que para aquellas con horizontes temporales
más cortos. Con estas consideraciones, el MAE es menor a 1.50 °C y el error
cuadrático medio está entre los 5.00 y los 5.40 °C con ventana deslizante de
tamaño 24, 12 neuronas en la capa oculta y 4000 muestras de entrenamiento.
4) Modo 4: en este caso el error introducido por cada fenómeno individualmente y
el introducido por la predicción total ofrece resultados caóticos que
desaconsejan el uso de este modo para obtener predicciones de temperatura.
Para tratar de solucionar esto, surge el Modo 4v2 en el que se introduce el valor
de la hora. Sin embargo, no se muestra efectivo para cortos periodos de tiempo,
en los que el Modo 3 ofrece menor error, aunque el Modo 4v2 parece volverse
un poco más estable que el Modo 3 para horizontes temporales más lejanos. Sin
embargo, este modo no se recomienda para obtener una predicción precisa,
recomendándose más el Modo 3.
5) Prueba de los rangos con signo de Wilcoxon: para comprobar la significancia
estadística de los resultados se realiza dicha prueba. En los experimentos, el
valor p está obtenido con las primeras 48 muestras en todos los casos. Tras la
realización de la prueba, se observa el buen rendimiento de los modos 1 y 2.
Discusión
Realizado el estudio se observa que un incremento en el número de neuronas
ocultas no ofrece mejores resultados. Esto es debido a que si un alto número de
neuronas ocultas se define para una configuración de entrada dada, el sistema se vuelve
MODELOS DE PREDICCIÓN METEOROLÓGICA BASADOS EN MÉTODOS DE CLASIFICACIÓN ORIENTADOS A LA
MEJORA DE LA EFICIENCIA ENERGÉTICA EN LOS PROCESOS DE GENERACIÓN.
TESIS DOCTORAL JOSÉ GUSTAVO HERNÁNDEZ TRAVIESO
55
inestable, no alcanzando el nivel de convergencia requerido durante la fase de
entrenamiento.
El incremento aleatorio de muestras de entrenamiento no ofrece salidas más
precisas. Esto es debido a que, tras alcanzar el nivel de estabilidad interna de los valores
de los pesos de la ANN, el sistema se vuelve, una vez más, inestable si se le siguen
ofreciendo estímulos de entrada. El balance solo puede conocerse a través de métodos
heurísticos.
El estudio del tiempo de entrenamiento es una cuestión importante, ya que la
latencia entre predicciones, especialmente en las de corto plazo, es clave para lograr un
sistema más preciso.
Un punto clave es también el número de neuronas ocultas, ya que se presenta
como el aspecto más influyente en los costes computacionales ya que el incremento en
este valor genera incrementos lineales en la fase de entrenamiento. Sin embargo esto
no afecta al tiempo de test por muestra que sigue siendo casi instantáneo.
La optimización Adding-Score no ofrece mejoras significativas para los modos
con topología non-feedback. Sin embargo, para la topología feedback contribuye a
minimizar los errores introducidos en el sistema con el uso de los valores estimados
utilizados como valores de entrada al sistema.
El objetivo del estudio se ha logrado debido a los resultados obtenidos con un
error inferior a 0.30 °C (valor p= 0.15) para todos los casos de topología non-feedback
frente a errores de casi 1 °C del estado-del-arte. Para la topología feedback, los errores
son inferiores a 1.5 °C para predicciones a 24 horas. Del mismo modo, la inclusión de
estímulos combinados mejora la precisión de la predicción y se ha presentado un
método rectificador frente a entradas que presentan comportamientos irregulares.
Además se ha llevado a cabo un estudio riguroso del comportamiento de la arquitectura
feedback en el campo de las predicciones. Alcanzando resultados favorables en el caso
del uso de estimaciones continuas de tiempo. Igualmente, el uso del método
Score Fusion a estas arquitecturas, ofrece mejor rendimiento que el obtenido de manera

MODELOS DE PREDICCIÓN METEOROLÓGICA BASADOS EN MÉTODOS DE CLASIFICACIÓN ORIENTADOS A LA
MEJORA DE LA EFICIENCIA ENERGÉTICA EN LOS PROCESOS DE GENERACIÓN.
TESIS DOCTORAL JOSÉ GUSTAVO HERNÁNDEZ TRAVIESO
56
inicial. La normalización de datos de entrada es recomendable como procedimiento
para lograr sistemas más rápidos y estables en cuanto a convergencia.
Conclusiones
Este artículo presenta dos líneas de actuación diferentes, la primera basada en
modos non-feedback, que son capaces de obtener predicciones precisas de temperatura
a lo largo del día.
La segunda basada en modos feedback que son útiles para predicciones a corto
plazo. Estos modos pueden emplearse en áreas sociales, siendo interesante en áreas
urbanas y agrícolas, el sector turístico o incluso para servir de herramienta a los servicios
de emergencia a la hora de declarar alertas por fenómenos meteorológicos adversos.
Este estudio presenta una mejora frente al estudio anterior que utiliza la misma
base de datos y también ANN pero no Score Fusion.

MODELOS DE PREDICCIÓN METEOROLÓGICA BASADOS EN MÉTODOS DE CLASIFICACIÓN ORIENTADOS A LA
MEJORA DE LA EFICIENCIA ENERGÉTICA EN LOS PROCESOS DE GENERACIÓN.
TESIS DOCTORAL JOSÉ GUSTAVO HERNÁNDEZ TRAVIESO
57
Modeling a robust wind-speed forecasting to apply to wind-energy production
Revista: Neural Computing and Applications.
JCR 2017: IF: 4.213, 15/132, Q1 (Computer Science, Artificial Intelligence).
Publicación online: 14 de julio de 2018.
URL: https://link.springer.com/article/10.1007%2Fs00521-018-3619-6

MODELOS DE PREDICCIÓN METEOROLÓGICA BASADOS EN MÉTODOS DE CLASIFICACIÓN ORIENTADOS A LA
MEJORA DE LA EFICIENCIA ENERGÉTICA EN LOS PROCESOS DE GENERACIÓN.
TESIS DOCTORAL JOSÉ GUSTAVO HERNÁNDEZ TRAVIESO
58
ORIGINAL ARTICLE
Modeling a robust wind-speed forecasting to apply to wind-energyproduction
Jose Gustavo Hernandez-Travieso1 • Carlos M. Travieso-Gonzalez1 • Jesus B. Alonso-Hernandez1 •
Jose Miguel Canino-Rodrıguez2 • Antonio G. Ravelo-Garcıa1
Received: 19 May 2017 / Accepted: 10 July 2018� The Natural Computing Applications Forum 2018
AbstractTo obtain green energy, it is important to know, in advance, an estimation of the weather conditions. In case of wind
energy, another important factor is to determine the right moment to stop the turbine in case of strong winds to avoid its
damage. This research introduces a tool, not only to increase green energy generation from wind, reducing CO2 emissions,
but also to prevent failures in turbines that is especially interesting for manufacturers. Using Artificial Neural Networks and
data from meteorological stations located in Gran Canaria airport and Tenerife Sur airport (both in Canary Islands, Spain),
a robust prediction system able to determine wind speed with a mean absolute error of 0.29 m per second is presented.
Keywords Modeling � Wind-speed prediction � Green energy � Artificial neural networks
1 Introduction
In a world where fossil fuels have the primacy on energy
generation [1], and countries treated to lead a strategy to
reduce CO2 emissions, European Union developed the
Seventh Environment Action Programme to reduce
emissions and to increase green energy generation in 2020
[2, 3]. On December 12, 2015, Paris Agreement of the
Climate Summit (COP21), their participants committed to
reduce global temperature increases in less than 2 C and
the goal of getting 100% renewable energy in the fight
against climate change [4, 5].
These are only two examples about the importance of
using green energy, not only for economic benefits, but
also for environmental conditions.
In Canary Islands (Spain), we can find an example of
how green energy can reduce the dependency on fossil
fuels in the smallest island, El Hierro. Since June 27, 2014,
the island uses a wind-hydro-pumped station [6] to gen-
erate 100% of the energetic needs of the island from
renewable sources. This could be possible thanks to the
specific climate conditions and orography with altitudes of
1500 m with steep mountainsides beaten by the wind
permanently. The use of clean energy produces savings of
over 1.8 million euros a year and avoids the emissions of
18,700 tonnes of CO2, 100 tonnes of sulphur dioxide, and
400 tonnes of nitrogen oxides per year.
Several works have been published in this topic, only
those related to the use of Artificial Neural Networks
(ANN) are emphasized in this state of the art.
Using backpropagation neural networks, Xingpei et al.
[7] made short-term predictions of wind speed with data
& Jose Gustavo Hernandez-Travieso
Carlos M. Travieso-Gonzalez
Jesus B. Alonso-Hernandez
Jose Miguel Canino-Rodrıguez
Antonio G. Ravelo-Garcıa
1 Signal and Communications Department, Institute for
Technological Development and Innovation in
Communications (IDeTIC), University of Las Palmas de
Gran Canaria, Campus Universitario de Tafira, sn, Ed. de
Telecomunicacion, Pabellon B, Despacho 111,
E35017 Las Palmas de Gran Canaria, Spain
2 Signal and Communications Department, University of Las
Palmas de Gran Canaria, Campus Universitario de Tafira, sn,
Ed. de Telecomunicacion, Pabellon B,
E35017 Las Palmas de Gran Canaria, Spain
123
Neural Computing and Applicationshttps://doi.org/10.1007/s00521-018-3619-6(0123456789().,-volV)(0123456789().,-volV)
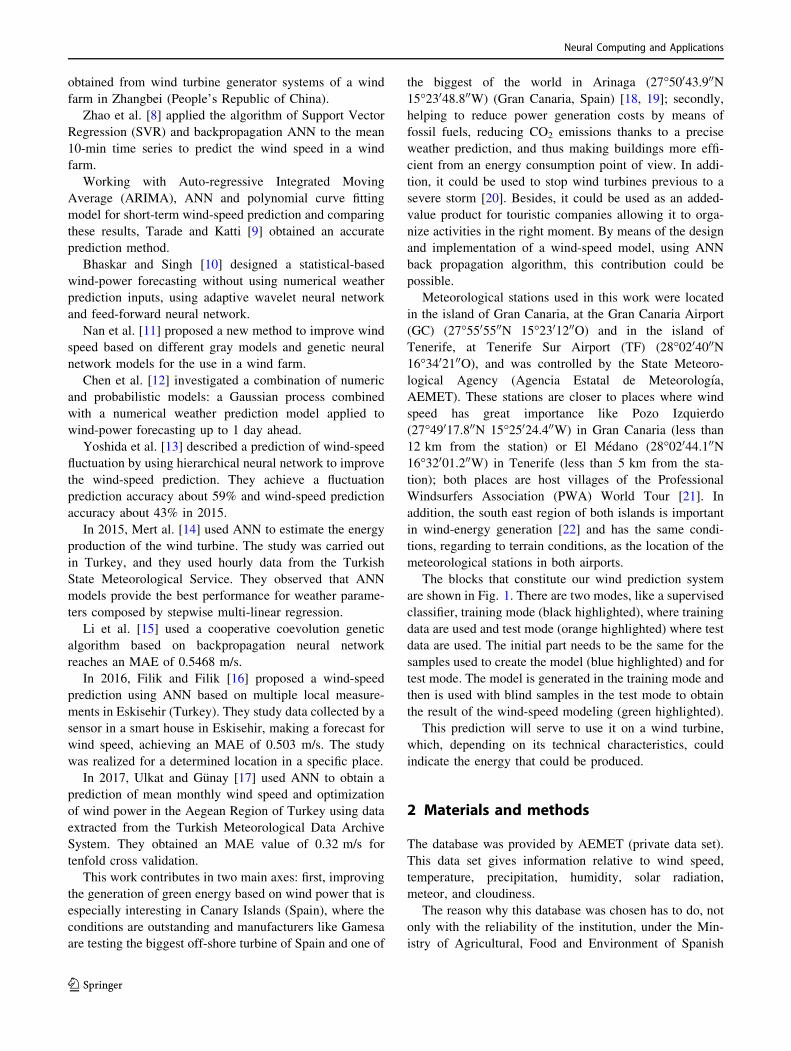
obtained from wind turbine generator systems of a wind
farm in Zhangbei (People’s Republic of China).
Zhao et al. [8] applied the algorithm of Support Vector
Regression (SVR) and backpropagation ANN to the mean
10-min time series to predict the wind speed in a wind
farm.
Working with Auto-regressive Integrated Moving
Average (ARIMA), ANN and polynomial curve fitting
model for short-term wind-speed prediction and comparing
these results, Tarade and Katti [9] obtained an accurate
prediction method.
Bhaskar and Singh [10] designed a statistical-based
wind-power forecasting without using numerical weather
prediction inputs, using adaptive wavelet neural network
and feed-forward neural network.
Nan et al. [11] proposed a new method to improve wind
speed based on different gray models and genetic neural
network models for the use in a wind farm.
Chen et al. [12] investigated a combination of numeric
and probabilistic models: a Gaussian process combined
with a numerical weather prediction model applied to
wind-power forecasting up to 1 day ahead.
Yoshida et al. [13] described a prediction of wind-speed
fluctuation by using hierarchical neural network to improve
the wind-speed prediction. They achieve a fluctuation
prediction accuracy about 59% and wind-speed prediction
accuracy about 43% in 2015.
In 2015, Mert al. [14] used ANN to estimate the energy
production of the wind turbine. The study was carried out
in Turkey, and they used hourly data from the Turkish
State Meteorological Service. They observed that ANN
models provide the best performance for weather parame-
ters composed by stepwise multi-linear regression.
Li et al. [15] used a cooperative coevolution genetic
algorithm based on backpropagation neural network
reaches an MAE of 0.5468 m/s.
In 2016, Filik and Filik [16] proposed a wind-speed
prediction using ANN based on multiple local measure-
ments in Eskisehir (Turkey). They study data collected by a
sensor in a smart house in Eskisehir, making a forecast for
wind speed, achieving an MAE of 0.503 m/s. The study
was realized for a determined location in a specific place.
In 2017, Ulkat and Gunay [17] used ANN to obtain a
prediction of mean monthly wind speed and optimization
of wind power in the Aegean Region of Turkey using data
extracted from the Turkish Meteorological Data Archive
System. They obtained an MAE value of 0.32 m/s for
tenfold cross validation.
This work contributes in two main axes: first, improving
the generation of green energy based on wind power that is
especially interesting in Canary Islands (Spain), where the
conditions are outstanding and manufacturers like Gamesa
are testing the biggest off-shore turbine of Spain and one of
the biggest of the world in Arinaga (27�50043.900N15�23048.800W) (Gran Canaria, Spain) [18, 19]; secondly,
helping to reduce power generation costs by means of
fossil fuels, reducing CO2 emissions thanks to a precise
weather prediction, and thus making buildings more effi-
cient from an energy consumption point of view. In addi-
tion, it could be used to stop wind turbines previous to a
severe storm [20]. Besides, it could be used as an added-
value product for touristic companies allowing it to orga-
nize activities in the right moment. By means of the design
and implementation of a wind-speed model, using ANN
back propagation algorithm, this contribution could be
possible.
Meteorological stations used in this work were located
in the island of Gran Canaria, at the Gran Canaria Airport
(GC) (27�5505500N 15�2301200O) and in the island of
Tenerife, at Tenerife Sur Airport (TF) (28�0204000N16�3402100O), and was controlled by the State Meteoro-
logical Agency (Agencia Estatal de Meteorologıa,
AEMET). These stations are closer to places where wind
speed has great importance like Pozo Izquierdo
(27�49017.800N 15�25024.400W) in Gran Canaria (less than
12 km from the station) or El Medano (28�02044.100N16�32001.200W) in Tenerife (less than 5 km from the sta-
tion); both places are host villages of the Professional
Windsurfers Association (PWA) World Tour [21]. In
addition, the south east region of both islands is important
in wind-energy generation [22] and has the same condi-
tions, regarding to terrain conditions, as the location of the
meteorological stations in both airports.
The blocks that constitute our wind prediction system
are shown in Fig. 1. There are two modes, like a supervised
classifier, training mode (black highlighted), where training
data are used and test mode (orange highlighted) where test
data are used. The initial part needs to be the same for the
samples used to create the model (blue highlighted) and for
test mode. The model is generated in the training mode and
then is used with blind samples in the test mode to obtain
the result of the wind-speed modeling (green highlighted).
This prediction will serve to use it on a wind turbine,
which, depending on its technical characteristics, could
indicate the energy that could be produced.
2 Materials and methods
The database was provided by AEMET (private data set).
This data set gives information relative to wind speed,
temperature, precipitation, humidity, solar radiation,
meteor, and cloudiness.
The reason why this database was chosen has to do, not
only with the reliability of the institution, under the Min-
istry of Agricultural, Food and Environment of Spanish
Neural Computing and Applications
123
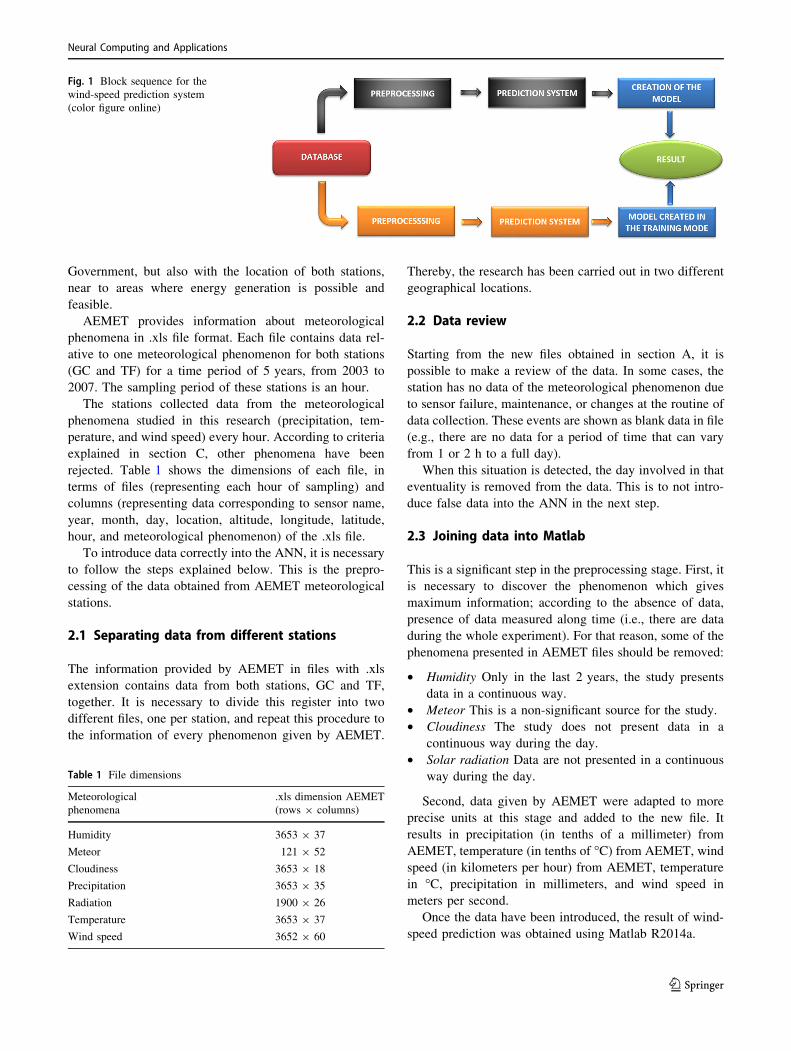
Government, but also with the location of both stations,
near to areas where energy generation is possible and
feasible.
AEMET provides information about meteorological
phenomena in .xls file format. Each file contains data rel-
ative to one meteorological phenomenon for both stations
(GC and TF) for a time period of 5 years, from 2003 to
2007. The sampling period of these stations is an hour.
The stations collected data from the meteorological
phenomena studied in this research (precipitation, tem-
perature, and wind speed) every hour. According to criteria
explained in section C, other phenomena have been
rejected. Table 1 shows the dimensions of each file, in
terms of files (representing each hour of sampling) and
columns (representing data corresponding to sensor name,
year, month, day, location, altitude, longitude, latitude,
hour, and meteorological phenomenon) of the .xls file.
To introduce data correctly into the ANN, it is necessary
to follow the steps explained below. This is the prepro-
cessing of the data obtained from AEMET meteorological
stations.
2.1 Separating data from different stations
The information provided by AEMET in files with .xls
extension contains data from both stations, GC and TF,
together. It is necessary to divide this register into two
different files, one per station, and repeat this procedure to
the information of every phenomenon given by AEMET.
Thereby, the research has been carried out in two different
geographical locations.
2.2 Data review
Starting from the new files obtained in section A, it is
possible to make a review of the data. In some cases, the
station has no data of the meteorological phenomenon due
to sensor failure, maintenance, or changes at the routine of
data collection. These events are shown as blank data in file
(e.g., there are no data for a period of time that can vary
from 1 or 2 h to a full day).
When this situation is detected, the day involved in that
eventuality is removed from the data. This is to not intro-
duce false data into the ANN in the next step.
2.3 Joining data into Matlab
This is a significant step in the preprocessing stage. First, it
is necessary to discover the phenomenon which gives
maximum information; according to the absence of data,
presence of data measured along time (i.e., there are data
during the whole experiment). For that reason, some of the
phenomena presented in AEMET files should be removed:
• Humidity Only in the last 2 years, the study presents
data in a continuous way.
• Meteor This is a non-significant source for the study.
• Cloudiness The study does not present data in a
continuous way during the day.
• Solar radiation Data are not presented in a continuous
way during the day.
Second, data given by AEMET were adapted to more
precise units at this stage and added to the new file. It
results in precipitation (in tenths of a millimeter) from
AEMET, temperature (in tenths of �C) from AEMET, wind
speed (in kilometers per hour) from AEMET, temperature
in �C, precipitation in millimeters, and wind speed in
meters per second.
Once the data have been introduced, the result of wind-
speed prediction was obtained using Matlab R2014a.
Fig. 1 Block sequence for the
wind-speed prediction system
(color figure online)
Table 1 File dimensions
Meteorological
phenomena
.xls dimension AEMET
(rows 9 columns)
Humidity 3653 9 37
Meteor 121 9 52
Cloudiness 3653 9 18
Precipitation 3653 9 35
Radiation 1900 9 26
Temperature 3653 9 37
Wind speed 3652 9 60
Neural Computing and Applications
123
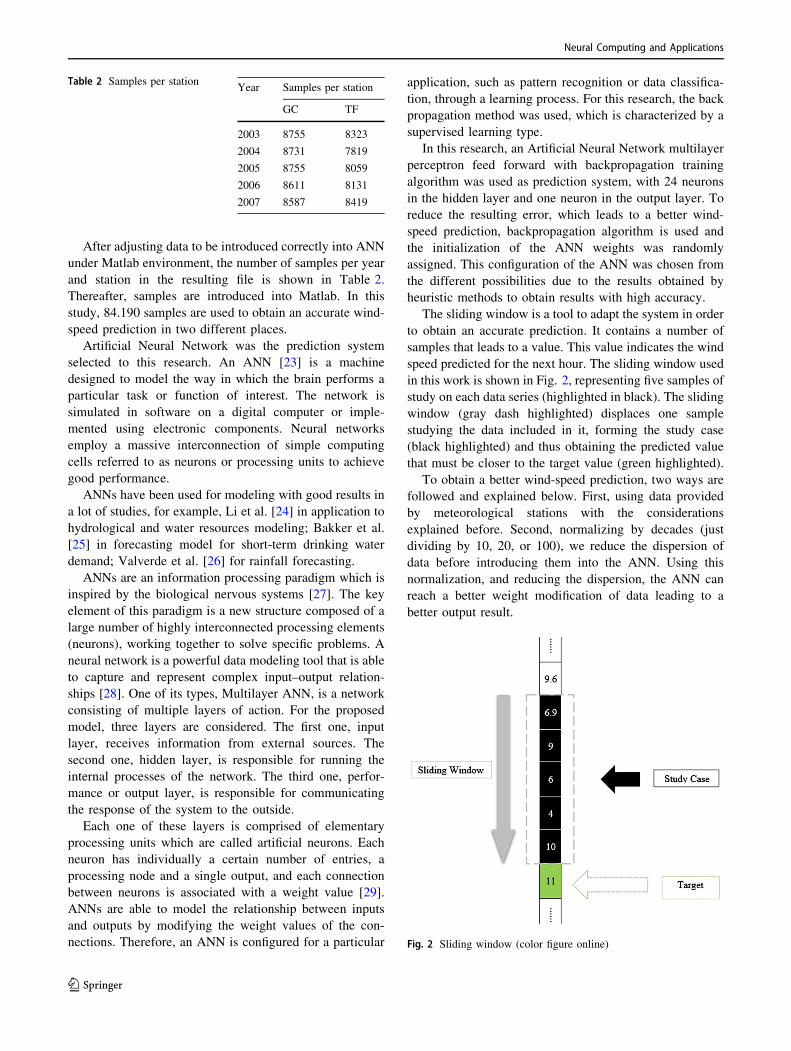
After adjusting data to be introduced correctly into ANN
under Matlab environment, the number of samples per year
and station in the resulting file is shown in Table 2.
Thereafter, samples are introduced into Matlab. In this
study, 84.190 samples are used to obtain an accurate wind-
speed prediction in two different places.
Artificial Neural Network was the prediction system
selected to this research. An ANN [23] is a machine
designed to model the way in which the brain performs a
particular task or function of interest. The network is
simulated in software on a digital computer or imple-
mented using electronic components. Neural networks
employ a massive interconnection of simple computing
cells referred to as neurons or processing units to achieve
good performance.
ANNs have been used for modeling with good results in
a lot of studies, for example, Li et al. [24] in application to
hydrological and water resources modeling; Bakker et al.
[25] in forecasting model for short-term drinking water
demand; Valverde et al. [26] for rainfall forecasting.
ANNs are an information processing paradigm which is
inspired by the biological nervous systems [27]. The key
element of this paradigm is a new structure composed of a
large number of highly interconnected processing elements
(neurons), working together to solve specific problems. A
neural network is a powerful data modeling tool that is able
to capture and represent complex input–output relation-
ships [28]. One of its types, Multilayer ANN, is a network
consisting of multiple layers of action. For the proposed
model, three layers are considered. The first one, input
layer, receives information from external sources. The
second one, hidden layer, is responsible for running the
internal processes of the network. The third one, perfor-
mance or output layer, is responsible for communicating
the response of the system to the outside.
Each one of these layers is comprised of elementary
processing units which are called artificial neurons. Each
neuron has individually a certain number of entries, a
processing node and a single output, and each connection
between neurons is associated with a weight value [29].
ANNs are able to model the relationship between inputs
and outputs by modifying the weight values of the con-
nections. Therefore, an ANN is configured for a particular
application, such as pattern recognition or data classifica-
tion, through a learning process. For this research, the back
propagation method was used, which is characterized by a
supervised learning type.
In this research, an Artificial Neural Network multilayer
perceptron feed forward with backpropagation training
algorithm was used as prediction system, with 24 neurons
in the hidden layer and one neuron in the output layer. To
reduce the resulting error, which leads to a better wind-
speed prediction, backpropagation algorithm is used and
the initialization of the ANN weights was randomly
assigned. This configuration of the ANN was chosen from
the different possibilities due to the results obtained by
heuristic methods to obtain results with high accuracy.
The sliding window is a tool to adapt the system in order
to obtain an accurate prediction. It contains a number of
samples that leads to a value. This value indicates the wind
speed predicted for the next hour. The sliding window used
in this work is shown in Fig. 2, representing five samples of
study on each data series (highlighted in black). The sliding
window (gray dash highlighted) displaces one sample
studying the data included in it, forming the study case
(black highlighted) and thus obtaining the predicted value
that must be closer to the target value (green highlighted).
To obtain a better wind-speed prediction, two ways are
followed and explained below. First, using data provided
by meteorological stations with the considerations
explained before. Second, normalizing by decades (just
dividing by 10, 20, or 100), we reduce the dispersion of
data before introducing them into the ANN. Using this
normalization, and reducing the dispersion, the ANN can
reach a better weight modification of data leading to a
better output result.
Table 2 Samples per stationYear Samples per station
GC TF
2003 8755 8323
2004 8731 7819
2005 8755 8059
2006 8611 8131
2007 8587 8419
Fig. 2 Sliding window (color figure online)
Neural Computing and Applications
123
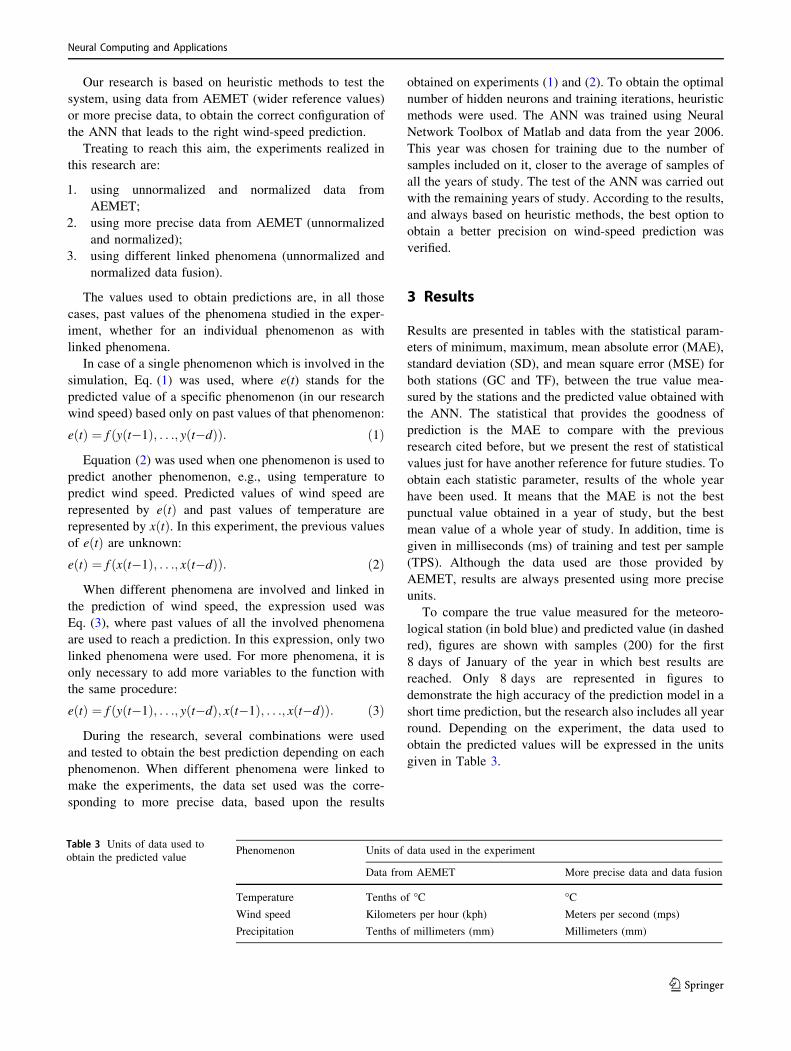
Our research is based on heuristic methods to test the
system, using data from AEMET (wider reference values)
or more precise data, to obtain the correct configuration of
the ANN that leads to the right wind-speed prediction.
Treating to reach this aim, the experiments realized in
this research are:
1. using unnormalized and normalized data from
AEMET;
2. using more precise data from AEMET (unnormalized
and normalized);
3. using different linked phenomena (unnormalized and
normalized data fusion).
The values used to obtain predictions are, in all those
cases, past values of the phenomena studied in the exper-
iment, whether for an individual phenomenon as with
linked phenomena.
In case of a single phenomenon which is involved in the
simulation, Eq. (1) was used, where e(t) stands for the
predicted value of a specific phenomenon (in our research
wind speed) based only on past values of that phenomenon:
eðtÞ ¼ f yðt�1Þ; . . .; yðt�dÞð Þ: ð1Þ
Equation (2) was used when one phenomenon is used to
predict another phenomenon, e.g., using temperature to
predict wind speed. Predicted values of wind speed are
represented by eðtÞ and past values of temperature are
represented by xðtÞ. In this experiment, the previous values
of eðtÞ are unknown:
eðtÞ ¼ f xðt�1Þ; . . .; xðt�dÞð Þ: ð2Þ
When different phenomena are involved and linked in
the prediction of wind speed, the expression used was
Eq. (3), where past values of all the involved phenomena
are used to reach a prediction. In this expression, only two
linked phenomena were used. For more phenomena, it is
only necessary to add more variables to the function with
the same procedure:
eðtÞ ¼ f yðt�1Þ; . . .; yðt�dÞ; xðt�1Þ; . . .; xðt�dÞð Þ: ð3Þ
During the research, several combinations were used
and tested to obtain the best prediction depending on each
phenomenon. When different phenomena were linked to
make the experiments, the data set used was the corre-
sponding to more precise data, based upon the results
obtained on experiments (1) and (2). To obtain the optimal
number of hidden neurons and training iterations, heuristic
methods were used. The ANN was trained using Neural
Network Toolbox of Matlab and data from the year 2006.
This year was chosen for training due to the number of
samples included on it, closer to the average of samples of
all the years of study. The test of the ANN was carried out
with the remaining years of study. According to the results,
and always based on heuristic methods, the best option to
obtain a better precision on wind-speed prediction was
verified.
3 Results
Results are presented in tables with the statistical param-
eters of minimum, maximum, mean absolute error (MAE),
standard deviation (SD), and mean square error (MSE) for
both stations (GC and TF), between the true value mea-
sured by the stations and the predicted value obtained with
the ANN. The statistical that provides the goodness of
prediction is the MAE to compare with the previous
research cited before, but we present the rest of statistical
values just for have another reference for future studies. To
obtain each statistic parameter, results of the whole year
have been used. It means that the MAE is not the best
punctual value obtained in a year of study, but the best
mean value of a whole year of study. In addition, time is
given in milliseconds (ms) of training and test per sample
(TPS). Although the data used are those provided by
AEMET, results are always presented using more precise
units.
To compare the true value measured for the meteoro-
logical station (in bold blue) and predicted value (in dashed
red), figures are shown with samples (200) for the first
8 days of January of the year in which best results are
reached. Only 8 days are represented in figures to
demonstrate the high accuracy of the prediction model in a
short time prediction, but the research also includes all year
round. Depending on the experiment, the data used to
obtain the predicted values will be expressed in the units
given in Table 3.
Table 3 Units of data used to
obtain the predicted valuePhenomenon Units of data used in the experiment
Data from AEMET More precise data and data fusion
Temperature Tenths of �C �CWind speed Kilometers per hour (kph) Meters per second (mps)
Precipitation Tenths of millimeters (mm) Millimeters (mm)
Neural Computing and Applications
123
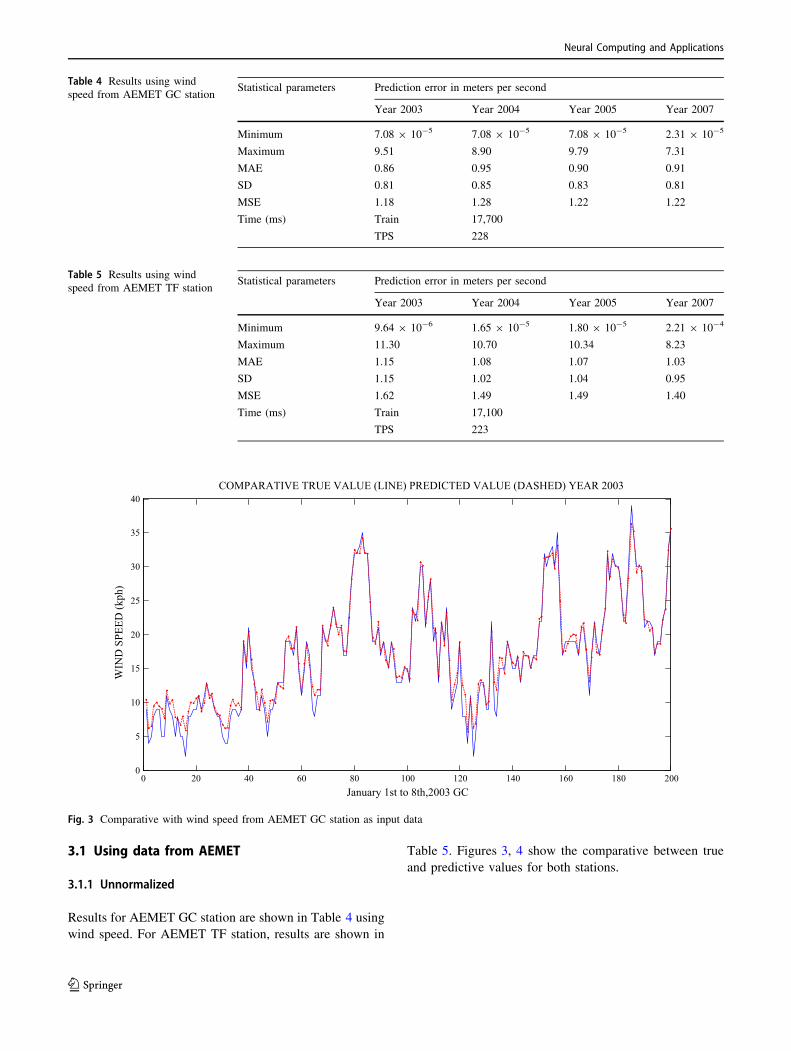
3.1 Using data from AEMET
3.1.1 Unnormalized
Results for AEMET GC station are shown in Table 4 using
wind speed. For AEMET TF station, results are shown in
Table 5. Figures 3, 4 show the comparative between true
and predictive values for both stations.
Table 4 Results using wind
speed from AEMET GC stationStatistical parameters Prediction error in meters per second
Year 2003 Year 2004 Year 2005 Year 2007
Minimum 7.08 9 10-5 7.08 9 10-5 7.08 9 10-5 2.31 9 10-5
Maximum 9.51 8.90 9.79 7.31
MAE 0.86 0.95 0.90 0.91
SD 0.81 0.85 0.83 0.81
MSE 1.18 1.28 1.22 1.22
Time (ms) Train 17,700
TPS 228
Table 5 Results using wind
speed from AEMET TF stationStatistical parameters Prediction error in meters per second
Year 2003 Year 2004 Year 2005 Year 2007
Minimum 9.64 9 10-6 1.65 9 10-5 1.80 9 10-5 2.21 9 10-4
Maximum 11.30 10.70 10.34 8.23
MAE 1.15 1.08 1.07 1.03
SD 1.15 1.02 1.04 0.95
MSE 1.62 1.49 1.49 1.40
Time (ms) Train 17,100
TPS 223
0 20 40 60 80 100 120 140 160 180 2000
5
10
15
20
25
30
35
40COMPARATIVE TRUE VALUE (LINE) PREDICTED VALUE (DASHED) YEAR 2003
WIN
D S
PEED
(kph
)
January 1st to 8th,2003 GC
Fig. 3 Comparative with wind speed from AEMET GC station as input data
Neural Computing and Applications
123
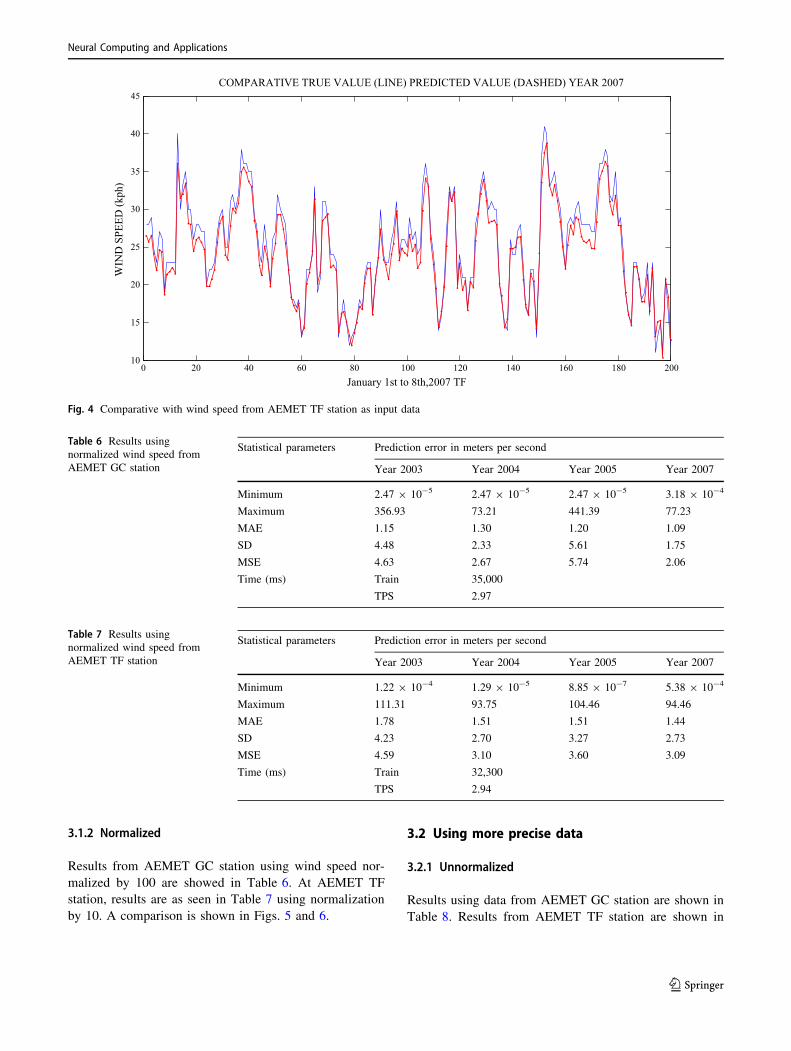
3.1.2 Normalized
Results from AEMET GC station using wind speed nor-
malized by 100 are showed in Table 6. At AEMET TF
station, results are as seen in Table 7 using normalization
by 10. A comparison is shown in Figs. 5 and 6.
3.2 Using more precise data
3.2.1 Unnormalized
Results using data from AEMET GC station are shown in
Table 8. Results from AEMET TF station are shown in
0 20 40 60 80 100 120 140 160 180 20010
15
20
25
30
35
40
45COMPARATIVE TRUE VALUE (LINE) PREDICTED VALUE (DASHED) YEAR 2007
WIN
D S
PEED
(kph
)
January 1st to 8th,2007 TF
Fig. 4 Comparative with wind speed from AEMET TF station as input data
Table 6 Results using
normalized wind speed from
AEMET GC station
Statistical parameters Prediction error in meters per second
Year 2003 Year 2004 Year 2005 Year 2007
Minimum 2.47 9 10-5 2.47 9 10-5 2.47 9 10-5 3.18 9 10-4
Maximum 356.93 73.21 441.39 77.23
MAE 1.15 1.30 1.20 1.09
SD 4.48 2.33 5.61 1.75
MSE 4.63 2.67 5.74 2.06
Time (ms) Train 35,000
TPS 2.97
Table 7 Results using
normalized wind speed from
AEMET TF station
Statistical parameters Prediction error in meters per second
Year 2003 Year 2004 Year 2005 Year 2007
Minimum 1.22 9 10-4 1.29 9 10-5 8.85 9 10-7 5.38 9 10-4
Maximum 111.31 93.75 104.46 94.46
MAE 1.78 1.51 1.51 1.44
SD 4.23 2.70 3.27 2.73
MSE 4.59 3.10 3.60 3.09
Time (ms) Train 32,300
TPS 2.94
Neural Computing and Applications
123
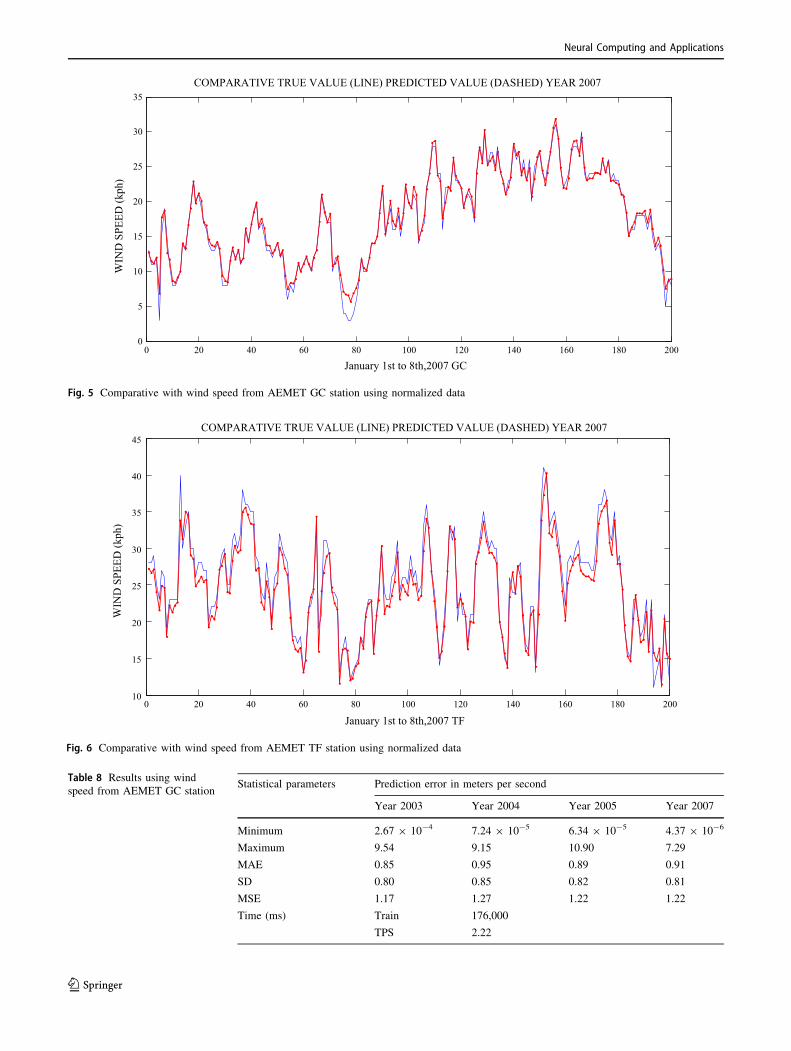
Time (ms)
0 20 40 60 80 100 120 140 160 180 2000
5
10
15
20
25
30
35COMPARATIVE TRUE VALUE (LINE) PREDICTED VALUE (DASHED) YEAR 2007
WIN
D S
PEED
(kph
)
January 1st to 8th,2007 GC
Fig. 5 Comparative with wind speed from AEMET GC station using normalized data
0 20 40 60 80 100 120 140 160 180 20010
15
20
25
30
35
40
45COMPARATIVE TRUE VALUE (LINE) PREDICTED VALUE (DASHED) YEAR 2007
WIN
D S
PEED
(kph
)
January 1st to 8th,2007 TF
Fig. 6 Comparative with wind speed from AEMET TF station using normalized data
Table 8 Results using wind
speed from AEMET GC stationStatistical parameters Prediction error in meters per second
Year 2003 Year 2004 Year 2005 Year 2007
Minimum 2.67 9 10-4 7.24 9 10-5 6.34 9 10-5 4.37 9 10-6
Maximum 9.54 9.15 10.90 7.29
MAE 0.85 0.95 0.89 0.91
SD 0.80 0.85 0.82 0.81
MSE 1.17 1.27 1.22 1.22
Time (ms) Train 176,000
TPS 2.22
Neural Computing and Applications
123
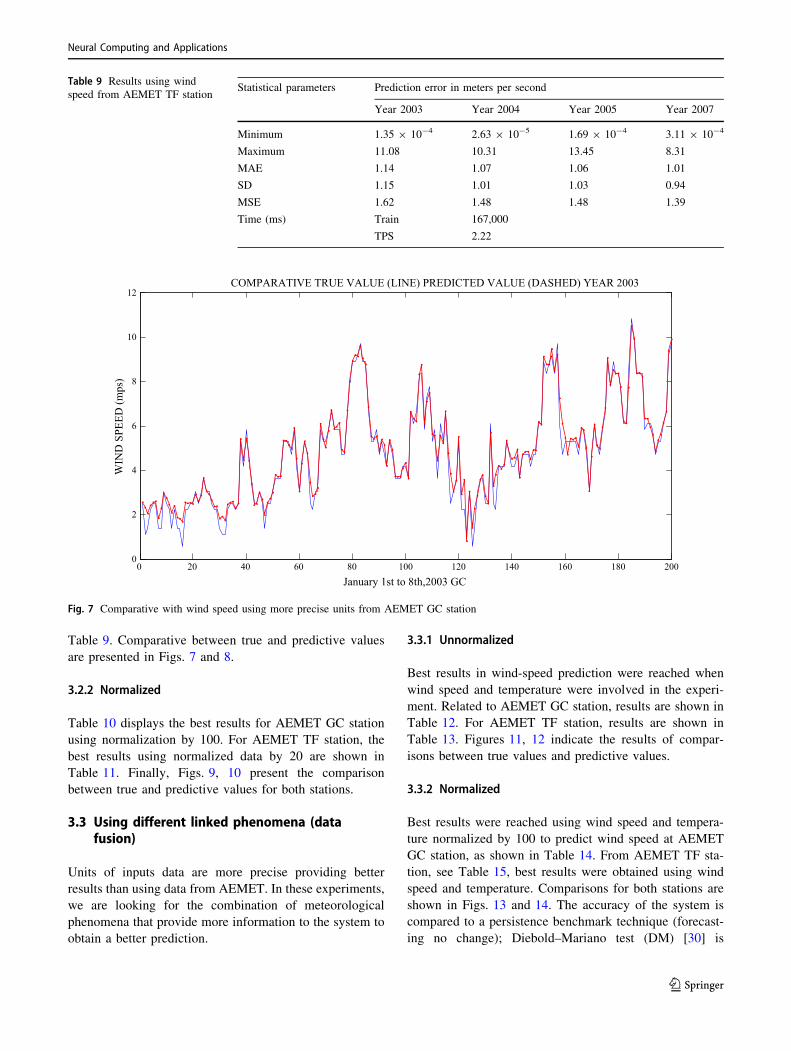
Table 9. Comparative between true and predictive values
are presented in Figs. 7 and 8.
3.2.2 Normalized
Table 10 displays the best results for AEMET GC station
using normalization by 100. For AEMET TF station, the
best results using normalized data by 20 are shown in
Table 11. Finally, Figs. 9, 10 present the comparison
between true and predictive values for both stations.
3.3 Using different linked phenomena (datafusion)
Units of inputs data are more precise providing better
results than using data from AEMET. In these experiments,
we are looking for the combination of meteorological
phenomena that provide more information to the system to
obtain a better prediction.
3.3.1 Unnormalized
Best results in wind-speed prediction were reached when
wind speed and temperature were involved in the experi-
ment. Related to AEMET GC station, results are shown in
Table 12. For AEMET TF station, results are shown in
Table 13. Figures 11, 12 indicate the results of compar-
isons between true values and predictive values.
3.3.2 Normalized
Best results were reached using wind speed and tempera-
ture normalized by 100 to predict wind speed at AEMET
GC station, as shown in Table 14. From AEMET TF sta-
tion, see Table 15, best results were obtained using wind
speed and temperature. Comparisons for both stations are
shown in Figs. 13 and 14. The accuracy of the system is
compared to a persistence benchmark technique (forecast-
ing no change); Diebold–Mariano test (DM) [30] is
Table 9 Results using wind
speed from AEMET TF stationStatistical parameters Prediction error in meters per second
Year 2003 Year 2004 Year 2005 Year 2007
Minimum 1.35 9 10-4 2.63 9 10-5 1.69 9 10-4 3.11 9 10-4
Maximum 11.08 10.31 13.45 8.31
MAE 1.14 1.07 1.06 1.01
SD 1.15 1.01 1.03 0.94
MSE 1.62 1.48 1.48 1.39
Time (ms) Train 167,000
TPS 2.22
0 20 40 60 80 100 120 140 160 180 2000
2
4
6
8
10
12COMPARATIVE TRUE VALUE (LINE) PREDICTED VALUE (DASHED) YEAR 2003
WIN
D S
PEED
(mps
)
January 1st to 8th,2003 GC
Fig. 7 Comparative with wind speed using more precise units from AEMET GC station
Neural Computing and Applications
123
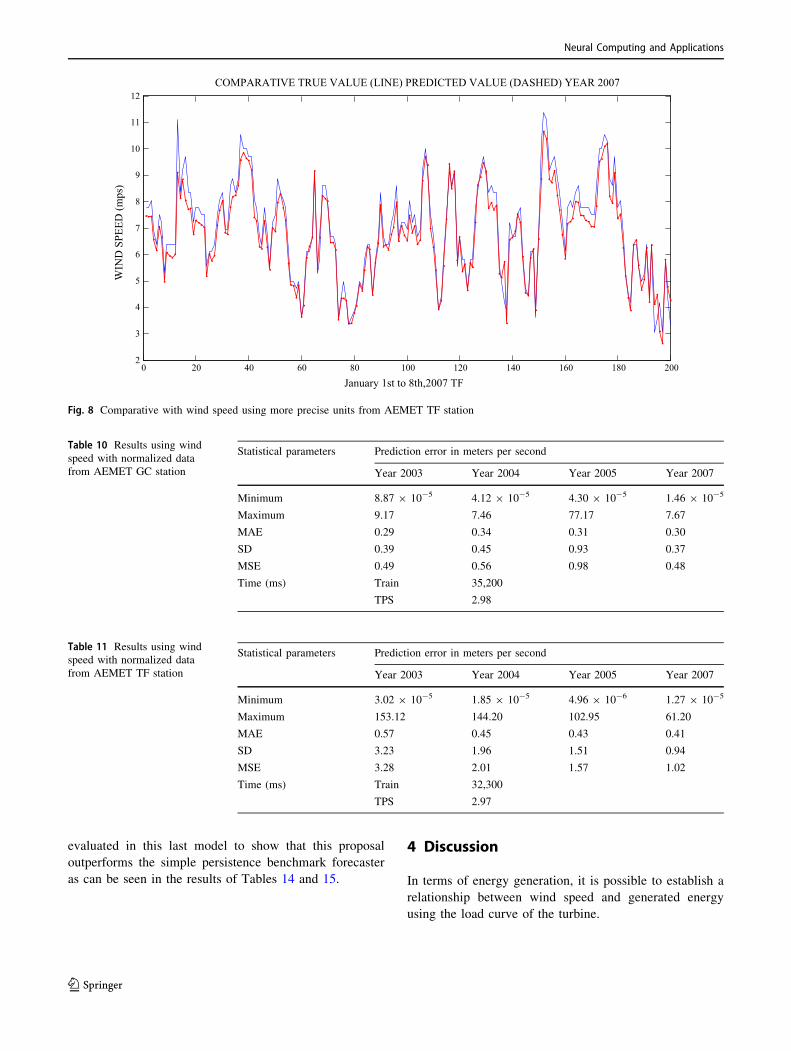
evaluated in this last model to show that this proposal
outperforms the simple persistence benchmark forecaster
as can be seen in the results of Tables 14 and 15.
4 Discussion
In terms of energy generation, it is possible to establish a
relationship between wind speed and generated energy
using the load curve of the turbine.
0 20 40 60 80 100 120 140 160 180 2002
3
4
5
6
7
8
9
10
11
12COMPARATIVE TRUE VALUE (LINE) PREDICTED VALUE (DASHED) YEAR 2007
WIN
D S
PEED
(mps
)
January 1st to 8th,2007 TF
Fig. 8 Comparative with wind speed using more precise units from AEMET TF station
Table 10 Results using wind
speed with normalized data
from AEMET GC station
Statistical parameters Prediction error in meters per second
Year 2003 Year 2004 Year 2005 Year 2007
Minimum 8.87 9 10-5 4.12 9 10-5 4.30 9 10-5 1.46 9 10-5
Maximum 9.17 7.46 77.17 7.67
MAE 0.29 0.34 0.31 0.30
SD 0.39 0.45 0.93 0.37
MSE 0.49 0.56 0.98 0.48
Time (ms) Train 35,200
TPS 2.98
Table 11 Results using wind
speed with normalized data
from AEMET TF station
Statistical parameters Prediction error in meters per second
Year 2003 Year 2004 Year 2005 Year 2007
Minimum 3.02 9 10-5 1.85 9 10-5 4.96 9 10-6 1.27 9 10-5
Maximum 153.12 144.20 102.95 61.20
MAE 0.57 0.45 0.43 0.41
SD 3.23 1.96 1.51 0.94
MSE 3.28 2.01 1.57 1.02
Time (ms) Train 32,300
TPS 2.97
Neural Computing and Applications
123
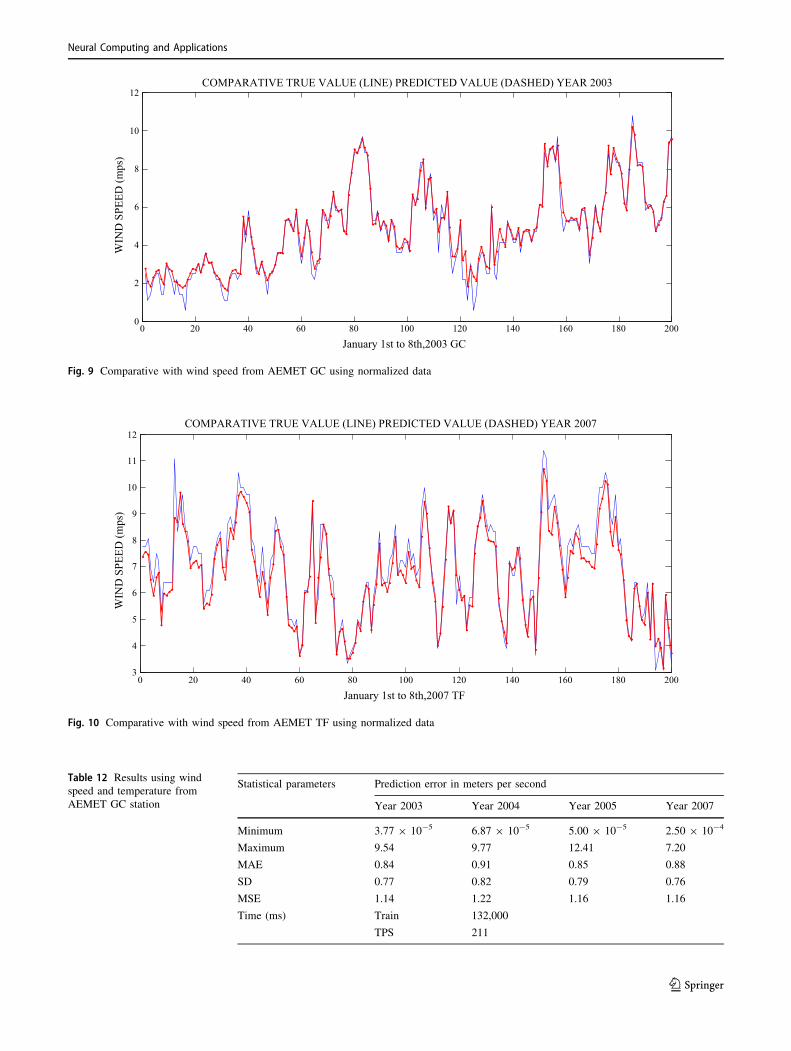
0 20 40 60 80 100 120 140 160 180 2000
2
4
6
8
10
12COMPARATIVE TRUE VALUE (LINE) PREDICTED VALUE (DASHED) YEAR 2003
WIN
D S
PEED
(mps
)
January 1st to 8th,2003 GC
Fig. 9 Comparative with wind speed from AEMET GC using normalized data
0 20 40 60 80 100 120 140 160 180 2003
4
5
6
7
8
9
10
11
12COMPARATIVE TRUE VALUE (LINE) PREDICTED VALUE (DASHED) YEAR 2007
WIN
D S
PEED
(mps
)
January 1st to 8th,2007 TF
Fig. 10 Comparative with wind speed from AEMET TF using normalized data
Table 12 Results using wind
speed and temperature from
AEMET GC station
Statistical parameters Prediction error in meters per second
Year 2003 Year 2004 Year 2005 Year 2007
Minimum 3.77 9 10-5 6.87 9 10-5 5.00 9 10-5 2.50 9 10-4
Maximum 9.54 9.77 12.41 7.20
MAE 0.84 0.91 0.85 0.88
SD 0.77 0.82 0.79 0.76
MSE 1.14 1.22 1.16 1.16
Time (ms) Train 132,000
TPS 211
Neural Computing and Applications
123
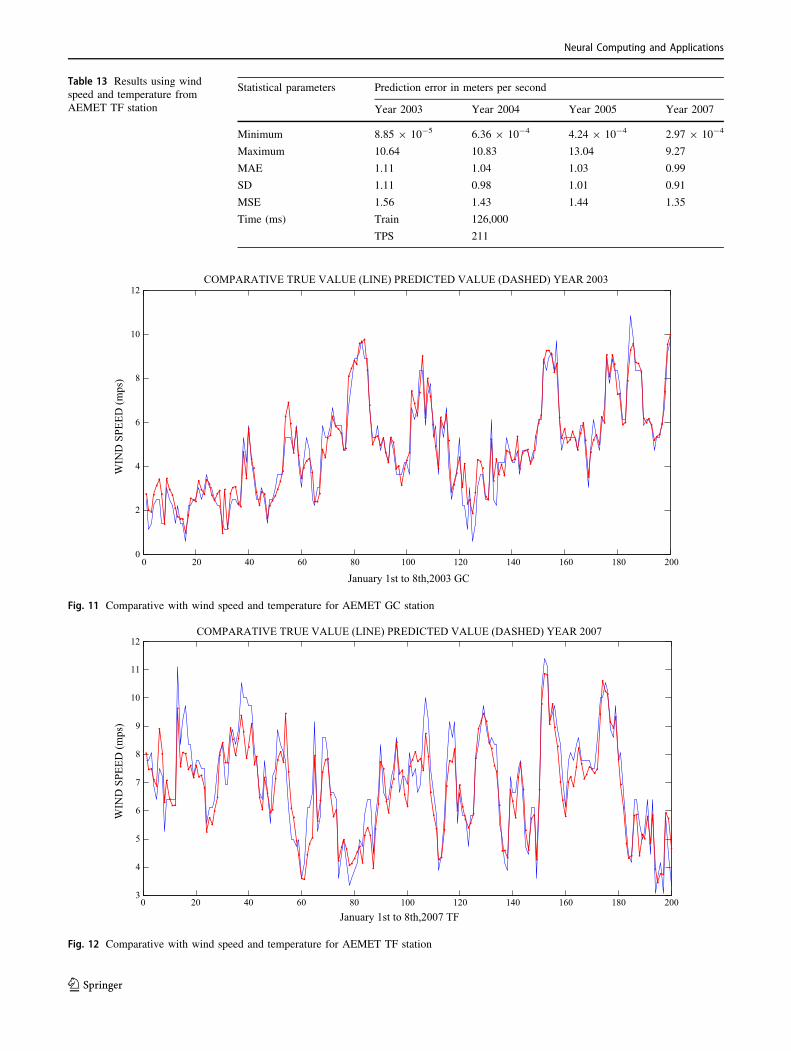
Table 13 Results using wind
speed and temperature from
AEMET TF station
Statistical parameters Prediction error in meters per second
Year 2003 Year 2004 Year 2005 Year 2007
Minimum 8.85 9 10-5 6.36 9 10-4 4.24 9 10-4 2.97 9 10-4
Maximum 10.64 10.83 13.04 9.27
MAE 1.11 1.04 1.03 0.99
SD 1.11 0.98 1.01 0.91
MSE 1.56 1.43 1.44 1.35
Time (ms) Train 126,000
TPS 211
0 20 40 60 80 100 120 140 160 180 2000
2
4
6
8
10
12COMPARATIVE TRUE VALUE (LINE) PREDICTED VALUE (DASHED) YEAR 2003
WIN
D S
PEED
(mps
)
January 1st to 8th,2003 GC
Fig. 11 Comparative with wind speed and temperature for AEMET GC station
0 20 40 60 80 100 120 140 160 180 2003
4
5
6
7
8
9
10
11
12COMPARATIVE TRUE VALUE (LINE) PREDICTED VALUE (DASHED) YEAR 2007
WIN
D S
PEED
(mps
)
January 1st to 8th,2007 TF
Fig. 12 Comparative with wind speed and temperature for AEMET TF station
Neural Computing and Applications
123
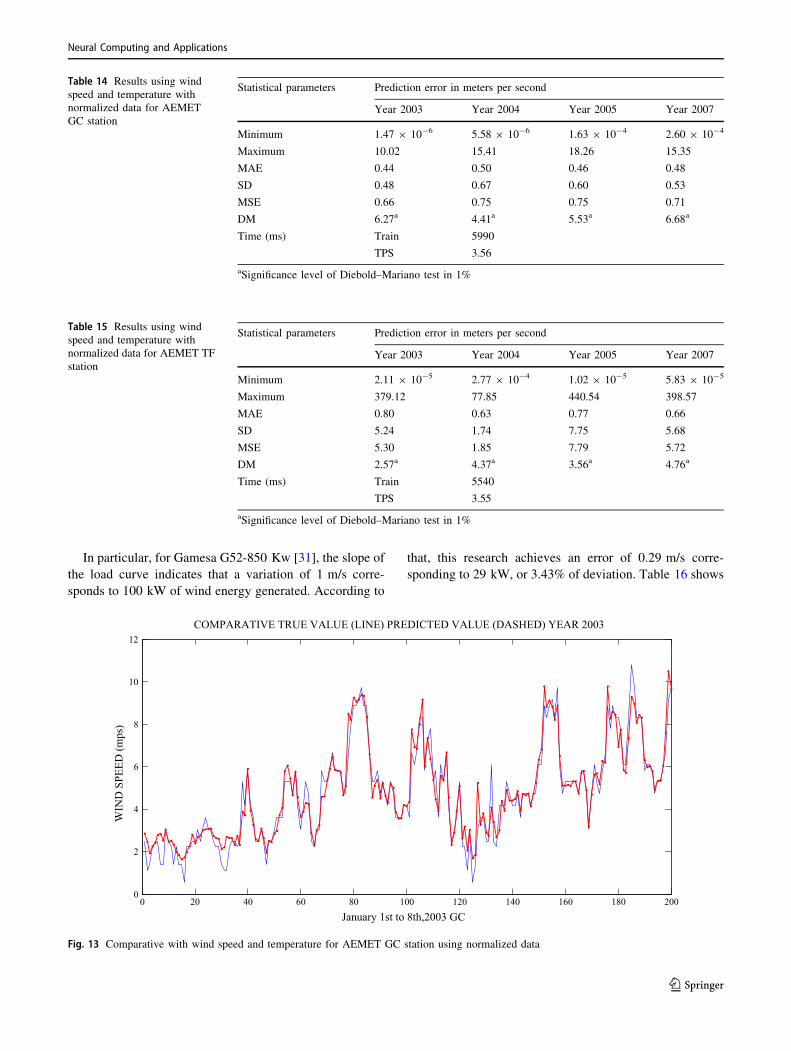
In particular, for Gamesa G52-850 Kw [31], the slope of
the load curve indicates that a variation of 1 m/s corre-
sponds to 100 kW of wind energy generated. According to
that, this research achieves an error of 0.29 m/s corre-
sponding to 29 kW, or 3.43% of deviation. Table 16 shows
Table 14 Results using wind
speed and temperature with
normalized data for AEMET
GC station
Statistical parameters Prediction error in meters per second
Year 2003 Year 2004 Year 2005 Year 2007
Minimum 1.47 9 10-6 5.58 9 10-6 1.63 9 10-4 2.60 9 10-4
Maximum 10.02 15.41 18.26 15.35
MAE 0.44 0.50 0.46 0.48
SD 0.48 0.67 0.60 0.53
MSE 0.66 0.75 0.75 0.71
DM 6.27a 4.41a 5.53a 6.68a
Time (ms) Train 5990
TPS 3.56
aSignificance level of Diebold–Mariano test in 1%
Table 15 Results using wind
speed and temperature with
normalized data for AEMET TF
station
Statistical parameters Prediction error in meters per second
Year 2003 Year 2004 Year 2005 Year 2007
Minimum 2.11 9 10-5 2.77 9 10-4 1.02 9 10-5 5.83 9 10-5
Maximum 379.12 77.85 440.54 398.57
MAE 0.80 0.63 0.77 0.66
SD 5.24 1.74 7.75 5.68
MSE 5.30 1.85 7.79 5.72
DM 2.57a 4.37a 3.56a 4.76a
Time (ms) Train 5540
TPS 3.55
aSignificance level of Diebold–Mariano test in 1%
0 20 40 60 80 100 120 140 160 180 2000
2
4
6
8
10
12COMPARATIVE TRUE VALUE (LINE) PREDICTED VALUE (DASHED) YEAR 2003
WIN
D S
PEED
(mps
)
January 1st to 8th,2003 GC
Fig. 13 Comparative with wind speed and temperature for AEMET GC station using normalized data
Neural Computing and Applications
123
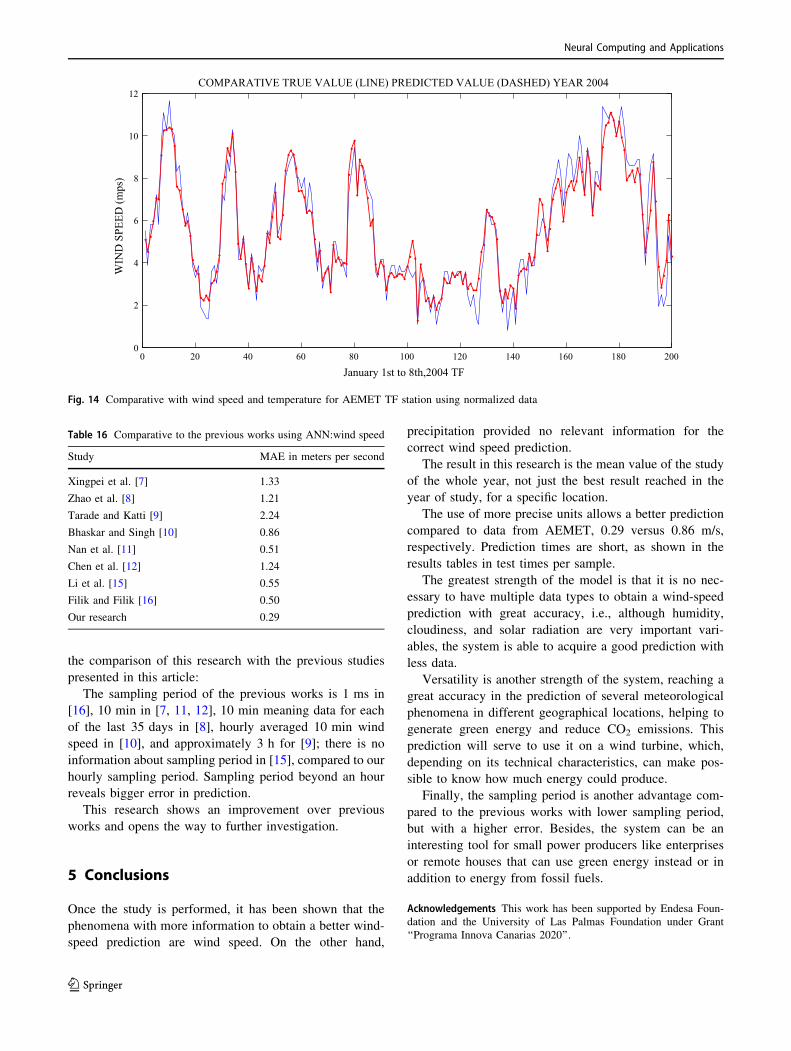
the comparison of this research with the previous studies
presented in this article:
The sampling period of the previous works is 1 ms in
[16], 10 min in [7, 11, 12], 10 min meaning data for each
of the last 35 days in [8], hourly averaged 10 min wind
speed in [10], and approximately 3 h for [9]; there is no
information about sampling period in [15], compared to our
hourly sampling period. Sampling period beyond an hour
reveals bigger error in prediction.
This research shows an improvement over previous
works and opens the way to further investigation.
5 Conclusions
Once the study is performed, it has been shown that the
phenomena with more information to obtain a better wind-
speed prediction are wind speed. On the other hand,
precipitation provided no relevant information for the
correct wind speed prediction.
The result in this research is the mean value of the study
of the whole year, not just the best result reached in the
year of study, for a specific location.
The use of more precise units allows a better prediction
compared to data from AEMET, 0.29 versus 0.86 m/s,
respectively. Prediction times are short, as shown in the
results tables in test times per sample.
The greatest strength of the model is that it is no nec-
essary to have multiple data types to obtain a wind-speed
prediction with great accuracy, i.e., although humidity,
cloudiness, and solar radiation are very important vari-
ables, the system is able to acquire a good prediction with
less data.
Versatility is another strength of the system, reaching a
great accuracy in the prediction of several meteorological
phenomena in different geographical locations, helping to
generate green energy and reduce CO2 emissions. This
prediction will serve to use it on a wind turbine, which,
depending on its technical characteristics, can make pos-
sible to know how much energy could produce.
Finally, the sampling period is another advantage com-
pared to the previous works with lower sampling period,
but with a higher error. Besides, the system can be an
interesting tool for small power producers like enterprises
or remote houses that can use green energy instead or in
addition to energy from fossil fuels.
Acknowledgements This work has been supported by Endesa Foun-
dation and the University of Las Palmas Foundation under Grant
‘‘Programa Innova Canarias 2020’’.
0 20 40 60 80 100 120 140 160 180 2000
2
4
6
8
10
12COMPARATIVE TRUE VALUE (LINE) PREDICTED VALUE (DASHED) YEAR 2004
WIN
D S
PEED
(mps
)
January 1st to 8th,2004 TF
Fig. 14 Comparative with wind speed and temperature for AEMET TF station using normalized data
Table 16 Comparative to the previous works using ANN:wind speed
Study MAE in meters per second
Xingpei et al. [7] 1.33
Zhao et al. [8] 1.21
Tarade and Katti [9] 2.24
Bhaskar and Singh [10] 0.86
Nan et al. [11] 0.51
Chen et al. [12] 1.24
Li et al. [15] 0.55
Filik and Filik [16] 0.50
Our research 0.29
Neural Computing and Applications
123
Compliance with ethical standards
Conflict of interest The authors declare that they have no conflict of
interest. The founding sponsors had no role in the design of the study;
in the collection, analyses, or interpretation of data; in the writing of
the manuscript, and in the decision to publish the results.
References
1. World Bank (2018) Percentage of fossil fuel energy consumed by
countries. http://datos.bancomundial.org/indicador/EG.USE.
COMM.FO.ZS Accessed 24 Mar 2018
2. Cinco D (2018) Spanish economic journal founded in 1978. In:
News on the European pact of energy. http://cincodias.com/cin
codias/2014/10/16/empresas/1413464789_240406.html. Acces-
sed 24 Mar 2018
3. European Commission (2018) Environment action programme to
2020. http://ec.europa.eu/environment/newprg/index.htm. Acces-
sed 24 Mar 2018
4. United Nations (2017) Climate summit 2015. http://www.cop21.
gouv.fr/en/. Accessed 19 Apr 2017
5. United Nations. Climate Summit 2015. http://www.un.org/sustai
nabledevelopment/cop21/ Accessed 24 March 2018
6. Gorona del Viento (2018) Wind-hydro-pumped station of El
Hierro. http://www.goronadelviento.es/index.php. Accessed 24
Mar 2018
7. Xingpei L, Yibing L, Weidong X (2009) Wind speed prediction
based on genetic neural network. In: 4th IEEE conference on
industrial electronics and applications (ICIEA 2009), interna-
tional conference center, Xian, P. R. China, 25–27 May 2009,
pp 2448–2451. https://doi.org/10.1109/iciea.2009.5138642
8. Zhao P, Xia J, Dai Y, He J (2010) Wind speed prediction using
support vector regression. In: 5th IEEE conference on industrial
electronics and applications (ICIEA 2010), Taichung, Taiwan,
15–17 June 2010, pp 882–886. https://doi.org/10.1109/pes.2010.
5589418
9. Tarade RS, Katti PK (2011) A comparative analysis for wind
speed prediction. In: International conference on energy,
automation, and signal (ICEAS). Siksha ‘O’ Anusandhan
University Bhubaneswar, India, 28–30 December 2011, pp 1–6.
https://doi.org/10.1109/iceas.2011.6147167
10. Bhaskar K, Singh SN (2012) AWNN-assisted wind power fore-
casting using feed-forward neural network. IEEE Trans Sustain
Energy 3(2):306–315. https://doi.org/10.1109/TSTE.2011.
2182215
11. Nan S, Su-quan Z, Xian-hui Z, Xun-wen S, Xiao-yan Z (2013)
Wind speed forecasting based on grey predictor and genetic
neural network models. In: International conference on mea-
surement, information and control (ICMIC), vol 02. Harbin
University of Science and Technology Building One No. 52
Xuefu Road Nangang District, Harbin, China, 16–18 August
2013, pp 1479–1482. https://doi.org/10.1109/mic.2013.6758238
12. Chen N, Qian Z, Nabney IT, Meng X (2014) Wind power fore-
casts using gaussian processes and numerical weather prediction.
IEEE Trans Power Syst 29(2):656–665. https://doi.org/10.1109/
TPWRS.2013.2282366
13. Yoshida S, Suzuki H, Kitajima T, Kassim AM, Yasuno T (2016)
Correction method of wind speed prediction system using pre-
dicted wind speed fluctuation. In: 55th annual conference of the
society of instrument and control engineers of Japan (SICE),
Tsukuba International Congress Center, Tsukuba, Japan, 20–23
September 2016, pp 1054–1059. https://doi.org/10.1109/sice.
2016.7749245
14. Mert I, Karakus C, Unes F (2016) Estimating the energy production
of the wind turbine using artificial neural network. Neural Comput
Appl 27:1231. https://doi.org/10.1007/s00521-015-1921-0
15. Li J, Wang R, Zhang T (2016) Wind speed prediction using a
cooperative coevolution genetic algorithm based on back propa-
gation neural network. In: IEEE world congress on evolutionary
computation (CEC), Vancouver, BC, 24–29 July 2016,
pp 4578–4583. https://doi.org/10.1109/cec.2016.7744373
16. Filik UB, Filik T (2017) Wind speed prediction using artificial
neural networks based on multiple local measurements in
Eskisehir. Energy Proc 107:264–269. https://doi.org/10.1016/j.
egypro.2016.12.147
17. Ulkat D, Gunay ME (2017) Prediction of mean monthly wind
speed and optimization of wind power by artificial neural net-
works using geographical and atmospheric variables: case of
Aegean Region of Turkey. Neural Comput Appl. https://doi.org/
10.1007/s00521-017-2895-x
18. Gamesa (2018) Case of study: Arinaga. In: A project come true.
http://pdf.archiexpo.com/pdf/gamesa-electric/case-study-arinaga/
88576-242524.html. Accessed 24 Mar 2018
19. Gamesa (2018) off-shore turbine in Arinaga beats generation
record. http://www.gamesacorp.com/es/cargarAplicacionNoticia.
do?idCategoria=59&identificador=1042&urlAmigable=the-
g128-50-mw-offshore-beats-power-generation-record-for-a-
wind-turbine-in-spain.html. Accessed 24 Mar 2018
20. Office of Energy Efficiency and Renewable Energy (2018) U.S.
Department of Energy. How do wind turbines survive severe
storms? https://www.energy.gov/eere/articles/how-do-wind-tur
bines-survive-severe-storms. Accessed 24 Mar 2018
21. Professional Windsurfers Association (PWA) (2017) Events of
the PWA world tour calendar 2017 http://www.pwaworldtour.
com/index.php?id=2151. Accessed 18 Feb 2017
22. Asociacion Empresarial Eolica (2017) The Spanish Wind Energy
Association. http://www.aeeolica.org/es/map/canarias/. Accessed
18 Feb 2017
23. Haykin S (1999) Neural networks. In: A comprehensive foun-
dation, 2nd edn. Prentice Hall Inc., United States of America
24. Li X, Zecchin AC, Maier HR (2014) Selection of smoothing
parameter estimators for general regression neural networks:
applications to hydrological and water resources modelling.
Environ Model Softw 59:162–186. https://doi.org/10.1016/j.
envsoft.2014.05.010
25. Bakker M, Vreeburg JHG, van Schagen KM, Rietveld LC (2013)
A fully adaptive forecasting model for short-term drinking water
demand. Environ Model Softw 48:141–151. https://doi.org/10.
1016/j.envsoft.2013.06.012
26. Valverde MC, Araujo E, Campos Velho H (2014) Neural network
and fuzzy logic statistical downscaling of atmospheric circula-
tion-type specific weather pattern for rainfall forecasting. Appl
Soft Comput 22:681–694. https://doi.org/10.1016/j.asoc.2014.02.
025
27. Hernandez-Travieso JG, Herrera-Jimenez AL, Travieso-Gonzalez
CM, Morgado-Dias F, Alonso-Hernandez JB, Ravelo-Garcıa AG
(2017) Temperature control by its forecasting applying score
fusion for sustainable development. Sustainability 9:193
28. Devi CJ, Reddy PBS, Kumar KV, Reddy BM, Nayak RN (2012)
ANN approach for weather prediction using Backpropagation. Int
J Eng Trends Technol 3:19–23
29. Serrano A, Soria E, Martın J (2009) Redes Neuronales Artifi-
ciales. Universidad de Valencia (Escuela Tecnica Superior
Ingenierıa, Departamento de Ingenierıa Electronica), Valencia
30. Diebold FX, Mariano RS (1995) Comparing predictive accuracy.
J Bus Econ Stat 13:253–263
31. Gamesa (2018) G52-850 KW Technical Information. http://www.
wind-power-program.com/Library/Turbine%20leaflets/Gamesa/
Gamesa%20G52%20850kw.pdf. Accessed 24 Mar 2018
Neural Computing and Applications
123

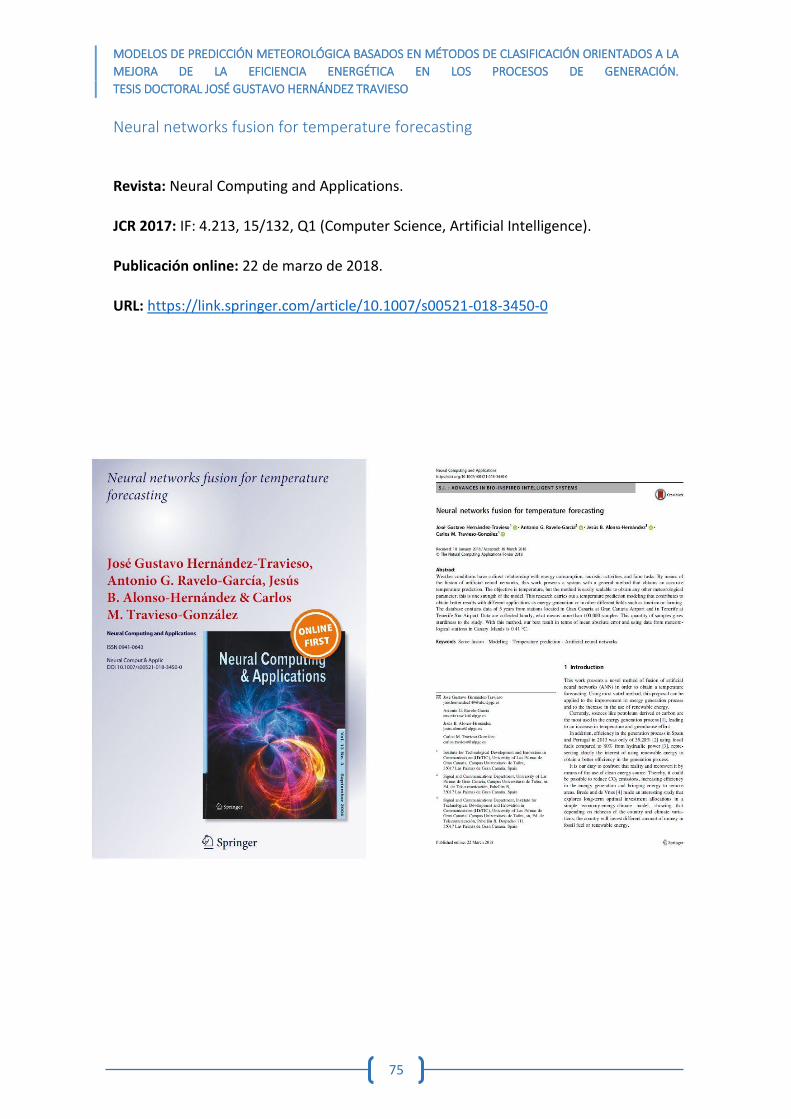
MODELOS DE PREDICCIÓN METEOROLÓGICA BASADOS EN MÉTODOS DE CLASIFICACIÓN ORIENTADOS A LA
MEJORA DE LA EFICIENCIA ENERGÉTICA EN LOS PROCESOS DE GENERACIÓN.
TESIS DOCTORAL JOSÉ GUSTAVO HERNÁNDEZ TRAVIESO
75
Neural networks fusion for temperature forecasting
Revista: Neural Computing and Applications.
JCR 2017: IF: 4.213, 15/132, Q1 (Computer Science, Artificial Intelligence).
Publicación online: 22 de marzo de 2018.
URL: https://link.springer.com/article/10.1007/s00521-018-3450-0

MODELOS DE PREDICCIÓN METEOROLÓGICA BASADOS EN MÉTODOS DE CLASIFICACIÓN ORIENTADOS A LA
MEJORA DE LA EFICIENCIA ENERGÉTICA EN LOS PROCESOS DE GENERACIÓN.
TESIS DOCTORAL JOSÉ GUSTAVO HERNÁNDEZ TRAVIESO
76
S. I . : ADVANCES IN BIO- INSPIRED INTELLIGENT SYSTEMS
Neural networks fusion for temperature forecasting
Jose Gustavo Hernandez-Travieso1 • Antonio G. Ravelo-Garcıa2 • Jesus B. Alonso-Hernandez3 •
Carlos M. Travieso-Gonzalez3
Received: 18 January 2018 / Accepted: 16 March 2018� The Natural Computing Applications Forum 2018
AbstractWeather conditions have a direct relationship with energy consumption, touristic activities, and farm tasks. By means of
the fusion of artificial neural networks, this work presents a system with a general method that obtains an accurate
temperature prediction. The objective is temperature, but the method is easily scalable to obtain any other meteorological
parameter; this is one strength of the model. This research carries out a temperature prediction modeling that contributes to
obtain better results with different applications as energy generation or in other different fields such as tourism or farming.
The database contains data of 5 years from stations located in Gran Canaria at Gran Canaria Airport and in Tenerife at
Tenerife Sur Airport. Data are collected hourly, what means more than 100,000 samples. This quantity of samples gives
sturdiness to the study. With this method, our best result in terms of mean absolute error and using data from meteoro-
logical stations in Canary Islands is 0.41 �C.
Keywords Score fusion � Modeling � Temperature prediction � Artificial neural networks
1 Introduction
This work presents a novel method of fusion of artificial
neural networks (ANN) in order to obtain a temperature
forecasting. Using most voted method, this proposal can be
applied to the improvement in energy generation process
and to the increase in the use of renewable energy.
Currently, sources like petroleum derived or carbon are
the most used in the energy generation process [1], leading
to an increase in temperature and greenhouse effect.
In addition, efficiency in the generation process in Spain
and Portugal in 2013 was only of 39.20% [2] using fossil
fuels compared to 80% from hydraulic power [3], repre-
senting clearly the interest of using renewable energy to
obtain a better efficiency in the generation process.
It is our duty to confront that reality and reconvert it by
means of the use of clean energy source. Thereby, it could
be possible to reduce CO2 emissions, increasing efficiency
in the energy generation and bringing energy to remote
areas. Brede and de Vries [4] made an interesting study that
explores long-term optimal investment allocations in a
simple economy-energy-climate model, showing that
depending on richness of the country and climate varia-
tions, the country will invest different amount of money in
fossil fuel or renewable energy.
& Jose Gustavo Hernandez-Travieso
Antonio G. Ravelo-Garcıa
Jesus B. Alonso-Hernandez
Carlos M. Travieso-Gonzalez
1 Institute for Technological Development and Innovation in
Communications (IDeTIC), University of Las Palmas de
Gran Canaria, Campus Universitario de Tafira,
35017 Las Palmas de Gran Canaria, Spain
2 Signal and Communications Department, University of Las
Palmas de Gran Canaria, Campus Universitario de Tafira, sn,
Ed. de Telecomunicacion, Pabellon B,
35017 Las Palmas de Gran Canaria, Spain
3 Signal and Communications Department, Institute for
Technological Development and Innovation in
Communications (IDeTIC), University of Las Palmas de
Gran Canaria, Campus Universitario de Tafira, sn, Ed. de
Telecomunicacion, Pabellon B, Despacho 111,
35017 Las Palmas de Gran Canaria, Spain
123
Neural Computing and Applicationshttps://doi.org/10.1007/s00521-018-3450-0(0123456789().,-volV)(0123456789().,-volV)
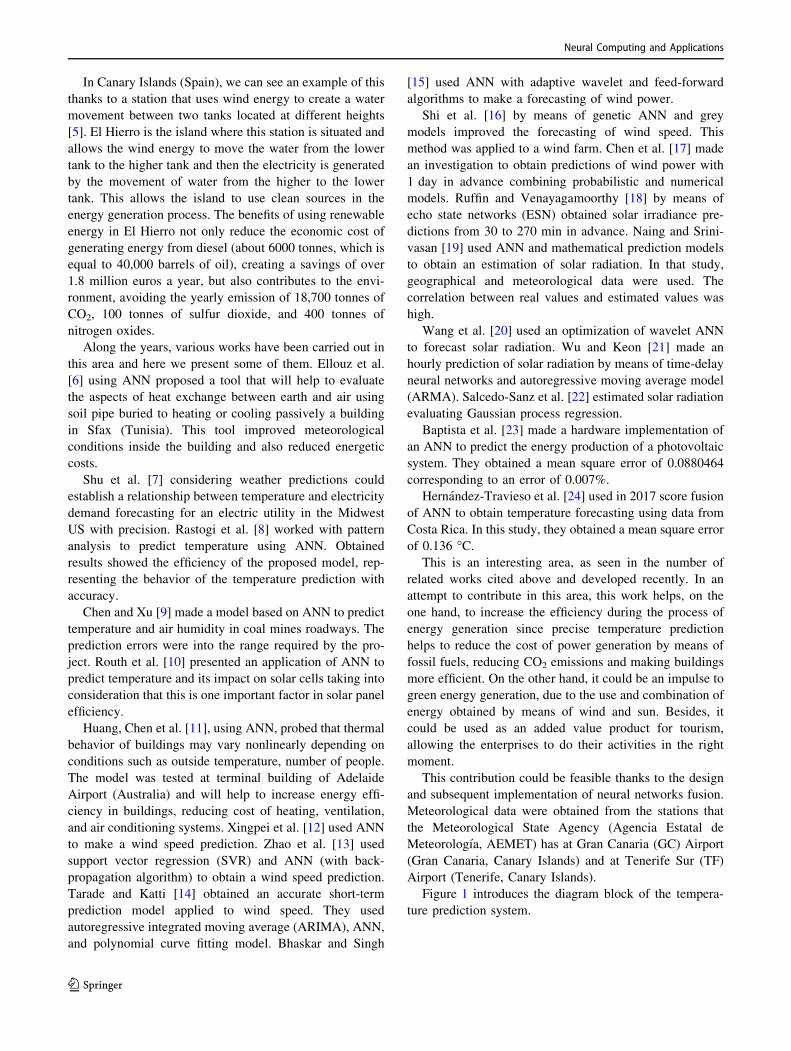
In Canary Islands (Spain), we can see an example of this
thanks to a station that uses wind energy to create a water
movement between two tanks located at different heights
[5]. El Hierro is the island where this station is situated and
allows the wind energy to move the water from the lower
tank to the higher tank and then the electricity is generated
by the movement of water from the higher to the lower
tank. This allows the island to use clean sources in the
energy generation process. The benefits of using renewable
energy in El Hierro not only reduce the economic cost of
generating energy from diesel (about 6000 tonnes, which is
equal to 40,000 barrels of oil), creating a savings of over
1.8 million euros a year, but also contributes to the envi-
ronment, avoiding the yearly emission of 18,700 tonnes of
CO2, 100 tonnes of sulfur dioxide, and 400 tonnes of
nitrogen oxides.
Along the years, various works have been carried out in
this area and here we present some of them. Ellouz et al.
[6] using ANN proposed a tool that will help to evaluate
the aspects of heat exchange between earth and air using
soil pipe buried to heating or cooling passively a building
in Sfax (Tunisia). This tool improved meteorological
conditions inside the building and also reduced energetic
costs.
Shu et al. [7] considering weather predictions could
establish a relationship between temperature and electricity
demand forecasting for an electric utility in the Midwest
US with precision. Rastogi et al. [8] worked with pattern
analysis to predict temperature using ANN. Obtained
results showed the efficiency of the proposed model, rep-
resenting the behavior of the temperature prediction with
accuracy.
Chen and Xu [9] made a model based on ANN to predict
temperature and air humidity in coal mines roadways. The
prediction errors were into the range required by the pro-
ject. Routh et al. [10] presented an application of ANN to
predict temperature and its impact on solar cells taking into
consideration that this is one important factor in solar panel
efficiency.
Huang, Chen et al. [11], using ANN, probed that thermal
behavior of buildings may vary nonlinearly depending on
conditions such as outside temperature, number of people.
The model was tested at terminal building of Adelaide
Airport (Australia) and will help to increase energy effi-
ciency in buildings, reducing cost of heating, ventilation,
and air conditioning systems. Xingpei et al. [12] used ANN
to make a wind speed prediction. Zhao et al. [13] used
support vector regression (SVR) and ANN (with back-
propagation algorithm) to obtain a wind speed prediction.
Tarade and Katti [14] obtained an accurate short-term
prediction model applied to wind speed. They used
autoregressive integrated moving average (ARIMA), ANN,
and polynomial curve fitting model. Bhaskar and Singh
[15] used ANN with adaptive wavelet and feed-forward
algorithms to make a forecasting of wind power.
Shi et al. [16] by means of genetic ANN and grey
models improved the forecasting of wind speed. This
method was applied to a wind farm. Chen et al. [17] made
an investigation to obtain predictions of wind power with
1 day in advance combining probabilistic and numerical
models. Ruffin and Venayagamoorthy [18] by means of
echo state networks (ESN) obtained solar irradiance pre-
dictions from 30 to 270 min in advance. Naing and Srini-
vasan [19] used ANN and mathematical prediction models
to obtain an estimation of solar radiation. In that study,
geographical and meteorological data were used. The
correlation between real values and estimated values was
high.
Wang et al. [20] used an optimization of wavelet ANN
to forecast solar radiation. Wu and Keon [21] made an
hourly prediction of solar radiation by means of time-delay
neural networks and autoregressive moving average model
(ARMA). Salcedo-Sanz et al. [22] estimated solar radiation
evaluating Gaussian process regression.
Baptista et al. [23] made a hardware implementation of
an ANN to predict the energy production of a photovoltaic
system. They obtained a mean square error of 0.0880464
corresponding to an error of 0.007%.
Hernandez-Travieso et al. [24] used in 2017 score fusion
of ANN to obtain temperature forecasting using data from
Costa Rica. In this study, they obtained a mean square error
of 0.136 �C.This is an interesting area, as seen in the number of
related works cited above and developed recently. In an
attempt to contribute in this area, this work helps, on the
one hand, to increase the efficiency during the process of
energy generation since precise temperature prediction
helps to reduce the cost of power generation by means of
fossil fuels, reducing CO2 emissions and making buildings
more efficient. On the other hand, it could be an impulse to
green energy generation, due to the use and combination of
energy obtained by means of wind and sun. Besides, it
could be used as an added value product for tourism,
allowing the enterprises to do their activities in the right
moment.
This contribution could be feasible thanks to the design
and subsequent implementation of neural networks fusion.
Meteorological data were obtained from the stations that
the Meteorological State Agency (Agencia Estatal de
Meteorologıa, AEMET) has at Gran Canaria (GC) Airport
(Gran Canaria, Canary Islands) and at Tenerife Sur (TF)
Airport (Tenerife, Canary Islands).
Figure 1 introduces the diagram block of the tempera-
ture prediction system.
Neural Computing and Applications
123
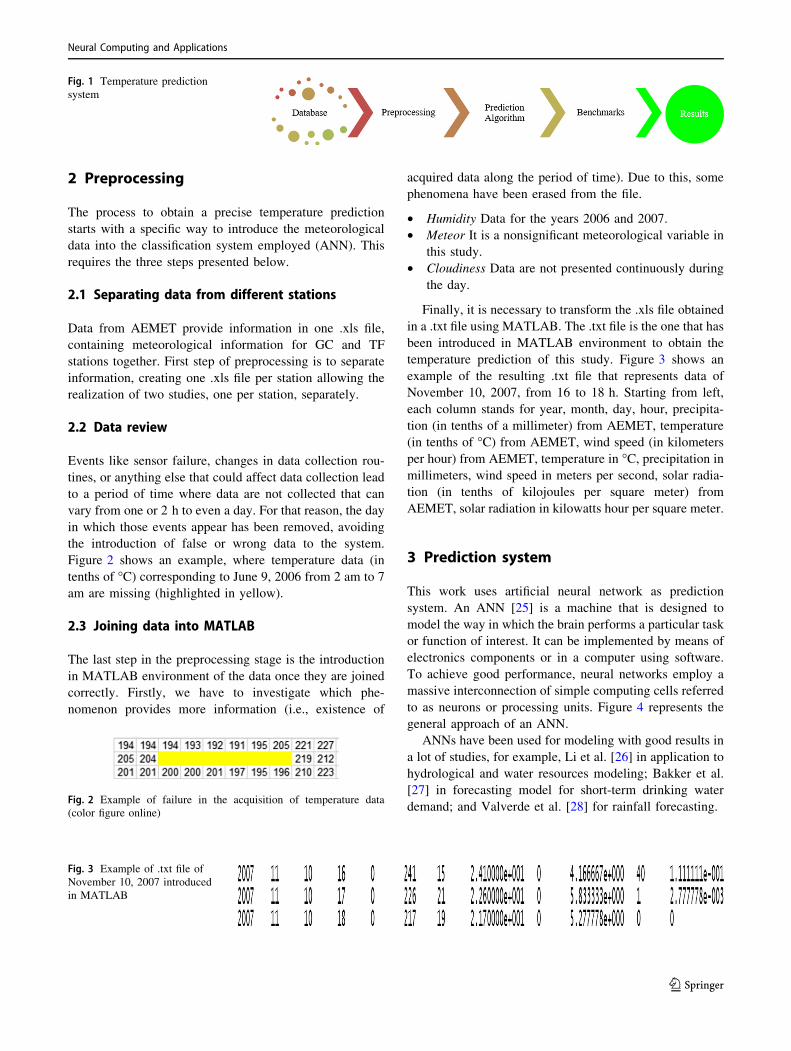
2 Preprocessing
The process to obtain a precise temperature prediction
starts with a specific way to introduce the meteorological
data into the classification system employed (ANN). This
requires the three steps presented below.
2.1 Separating data from different stations
Data from AEMET provide information in one .xls file,
containing meteorological information for GC and TF
stations together. First step of preprocessing is to separate
information, creating one .xls file per station allowing the
realization of two studies, one per station, separately.
2.2 Data review
Events like sensor failure, changes in data collection rou-
tines, or anything else that could affect data collection lead
to a period of time where data are not collected that can
vary from one or 2 h to even a day. For that reason, the day
in which those events appear has been removed, avoiding
the introduction of false or wrong data to the system.
Figure 2 shows an example, where temperature data (in
tenths of �C) corresponding to June 9, 2006 from 2 am to 7
am are missing (highlighted in yellow).
2.3 Joining data into MATLAB
The last step in the preprocessing stage is the introduction
in MATLAB environment of the data once they are joined
correctly. Firstly, we have to investigate which phe-
nomenon provides more information (i.e., existence of
acquired data along the period of time). Due to this, some
phenomena have been erased from the file.
• Humidity Data for the years 2006 and 2007.
• Meteor It is a nonsignificant meteorological variable in
this study.
• Cloudiness Data are not presented continuously during
the day.
Finally, it is necessary to transform the .xls file obtained
in a .txt file using MATLAB. The .txt file is the one that has
been introduced in MATLAB environment to obtain the
temperature prediction of this study. Figure 3 shows an
example of the resulting .txt file that represents data of
November 10, 2007, from 16 to 18 h. Starting from left,
each column stands for year, month, day, hour, precipita-
tion (in tenths of a millimeter) from AEMET, temperature
(in tenths of �C) from AEMET, wind speed (in kilometers
per hour) from AEMET, temperature in �C, precipitation in
millimeters, wind speed in meters per second, solar radia-
tion (in tenths of kilojoules per square meter) from
AEMET, solar radiation in kilowatts hour per square meter.
3 Prediction system
This work uses artificial neural network as prediction
system. An ANN [25] is a machine that is designed to
model the way in which the brain performs a particular task
or function of interest. It can be implemented by means of
electronics components or in a computer using software.
To achieve good performance, neural networks employ a
massive interconnection of simple computing cells referred
to as neurons or processing units. Figure 4 represents the
general approach of an ANN.
ANNs have been used for modeling with good results in
a lot of studies, for example, Li et al. [26] in application to
hydrological and water resources modeling; Bakker et al.
[27] in forecasting model for short-term drinking water
demand; and Valverde et al. [28] for rainfall forecasting.
Fig. 1 Temperature prediction
system
Fig. 2 Example of failure in the acquisition of temperature data
(color figure online)
Fig. 3 Example of .txt file of
November 10, 2007 introduced
in MATLAB
Neural Computing and Applications
123
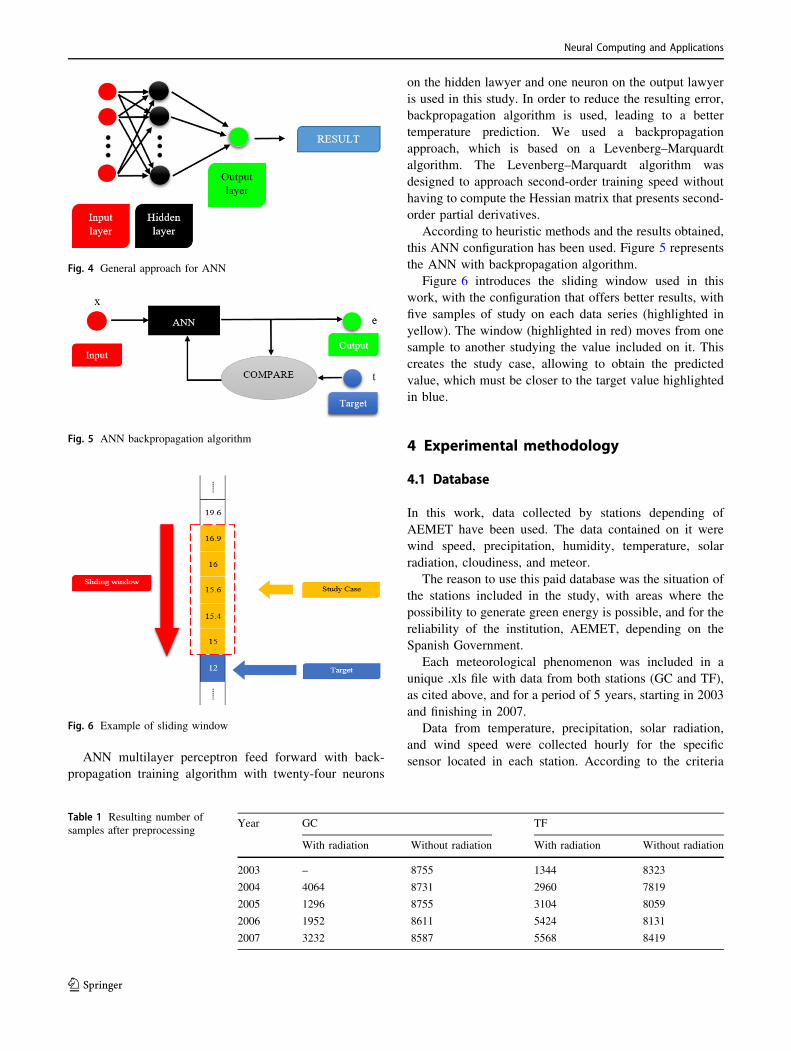
ANN multilayer perceptron feed forward with back-
propagation training algorithm with twenty-four neurons
on the hidden lawyer and one neuron on the output lawyer
is used in this study. In order to reduce the resulting error,
backpropagation algorithm is used, leading to a better
temperature prediction. We used a backpropagation
approach, which is based on a Levenberg–Marquardt
algorithm. The Levenberg–Marquardt algorithm was
designed to approach second-order training speed without
having to compute the Hessian matrix that presents second-
order partial derivatives.
According to heuristic methods and the results obtained,
this ANN configuration has been used. Figure 5 represents
the ANN with backpropagation algorithm.
Figure 6 introduces the sliding window used in this
work, with the configuration that offers better results, with
five samples of study on each data series (highlighted in
yellow). The window (highlighted in red) moves from one
sample to another studying the value included on it. This
creates the study case, allowing to obtain the predicted
value, which must be closer to the target value highlighted
in blue.
4 Experimental methodology
4.1 Database
In this work, data collected by stations depending of
AEMET have been used. The data contained on it were
wind speed, precipitation, humidity, temperature, solar
radiation, cloudiness, and meteor.
The reason to use this paid database was the situation of
the stations included in the study, with areas where the
possibility to generate green energy is possible, and for the
reliability of the institution, AEMET, depending on the
Spanish Government.
Each meteorological phenomenon was included in a
unique .xls file with data from both stations (GC and TF),
as cited above, and for a period of 5 years, starting in 2003
and finishing in 2007.
Data from temperature, precipitation, solar radiation,
and wind speed were collected hourly for the specific
sensor located in each station. According to the criteria
Fig. 4 General approach for ANN
Fig. 5 ANN backpropagation algorithm
Fig. 6 Example of sliding window
Table 1 Resulting number of
samples after preprocessingYear GC TF
With radiation Without radiation With radiation Without radiation
2003 – 8755 1344 8323
2004 4064 8731 2960 7819
2005 1296 8755 3104 8059
2006 1952 8611 5424 8131
2007 3232 8587 5568 8419
Neural Computing and Applications
123
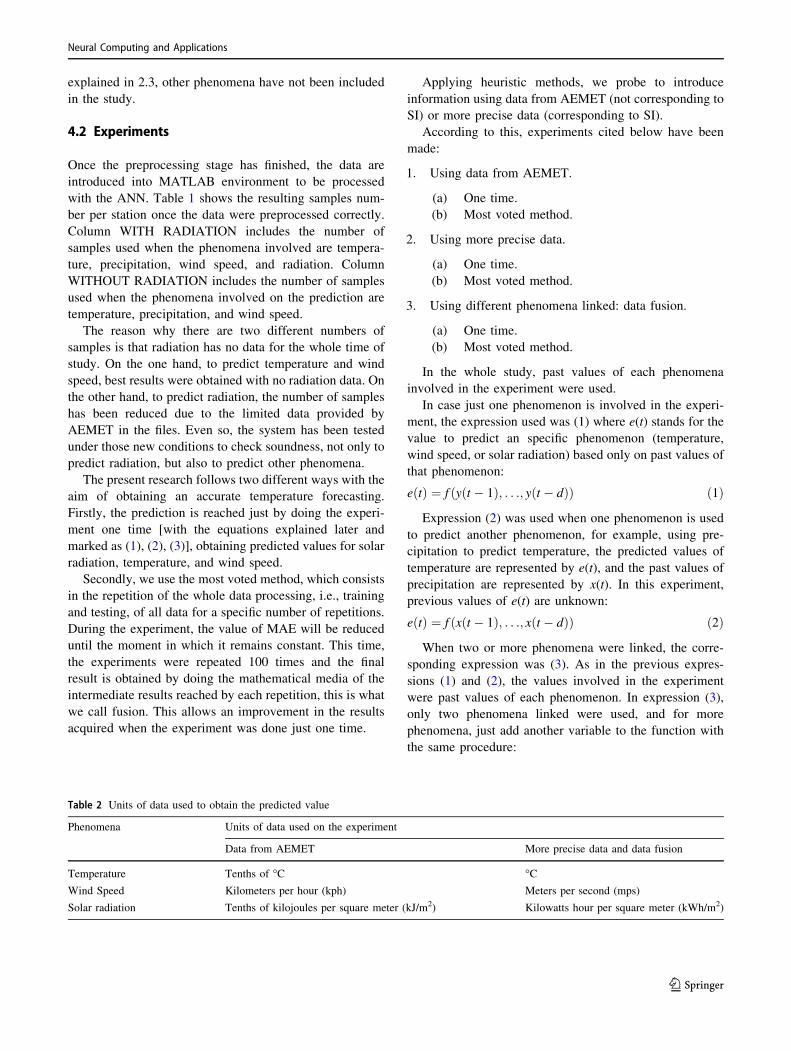
explained in 2.3, other phenomena have not been included
in the study.
4.2 Experiments
Once the preprocessing stage has finished, the data are
introduced into MATLAB environment to be processed
with the ANN. Table 1 shows the resulting samples num-
ber per station once the data were preprocessed correctly.
Column WITH RADIATION includes the number of
samples used when the phenomena involved are tempera-
ture, precipitation, wind speed, and radiation. Column
WITHOUT RADIATION includes the number of samples
used when the phenomena involved on the prediction are
temperature, precipitation, and wind speed.
The reason why there are two different numbers of
samples is that radiation has no data for the whole time of
study. On the one hand, to predict temperature and wind
speed, best results were obtained with no radiation data. On
the other hand, to predict radiation, the number of samples
has been reduced due to the limited data provided by
AEMET in the files. Even so, the system has been tested
under those new conditions to check soundness, not only to
predict radiation, but also to predict other phenomena.
The present research follows two different ways with the
aim of obtaining an accurate temperature forecasting.
Firstly, the prediction is reached just by doing the experi-
ment one time [with the equations explained later and
marked as (1), (2), (3)], obtaining predicted values for solar
radiation, temperature, and wind speed.
Secondly, we use the most voted method, which consists
in the repetition of the whole data processing, i.e., training
and testing, of all data for a specific number of repetitions.
During the experiment, the value of MAE will be reduced
until the moment in which it remains constant. This time,
the experiments were repeated 100 times and the final
result is obtained by doing the mathematical media of the
intermediate results reached by each repetition, this is what
we call fusion. This allows an improvement in the results
acquired when the experiment was done just one time.
Applying heuristic methods, we probe to introduce
information using data from AEMET (not corresponding to
SI) or more precise data (corresponding to SI).
According to this, experiments cited below have been
made:
1. Using data from AEMET.
(a) One time.
(b) Most voted method.
2. Using more precise data.
(a) One time.
(b) Most voted method.
3. Using different phenomena linked: data fusion.
(a) One time.
(b) Most voted method.
In the whole study, past values of each phenomena
involved in the experiment were used.
In case just one phenomenon is involved in the experi-
ment, the expression used was (1) where e(t) stands for the
value to predict an specific phenomenon (temperature,
wind speed, or solar radiation) based only on past values of
that phenomenon:
e tð Þ ¼ f y t � 1ð Þ; . . .; y t � dð Þð Þ ð1Þ
Expression (2) was used when one phenomenon is used
to predict another phenomenon, for example, using pre-
cipitation to predict temperature, the predicted values of
temperature are represented by e(t), and the past values of
precipitation are represented by x(t). In this experiment,
previous values of e(t) are unknown:
e tð Þ ¼ f x t � 1ð Þ; . . .; x t � dð Þð Þ ð2Þ
When two or more phenomena were linked, the corre-
sponding expression was (3). As in the previous expres-
sions (1) and (2), the values involved in the experiment
were past values of each phenomenon. In expression (3),
only two phenomena linked were used, and for more
phenomena, just add another variable to the function with
the same procedure:
Table 2 Units of data used to obtain the predicted value
Phenomena Units of data used on the experiment
Data from AEMET More precise data and data fusion
Temperature Tenths of �C �CWind Speed Kilometers per hour (kph) Meters per second (mps)
Solar radiation Tenths of kilojoules per square meter (kJ/m2) Kilowatts hour per square meter (kWh/m2)
Neural Computing and Applications
123
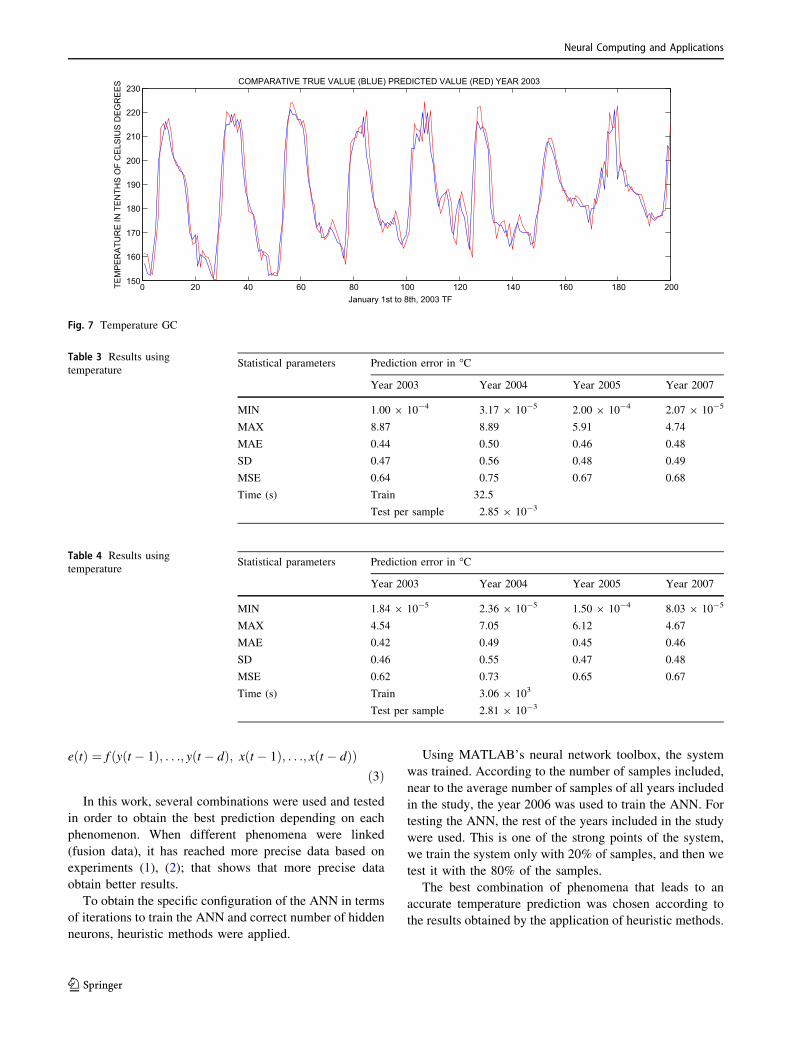
e tð Þ ¼ f y t � 1ð Þ; . . .; y t � dð Þ; x t � 1ð Þ; . . .; x t � dð Þð Þð3Þ
In this work, several combinations were used and tested
in order to obtain the best prediction depending on each
phenomenon. When different phenomena were linked
(fusion data), it has reached more precise data based on
experiments (1), (2); that shows that more precise data
obtain better results.
To obtain the specific configuration of the ANN in terms
of iterations to train the ANN and correct number of hidden
neurons, heuristic methods were applied.
Using MATLAB’s neural network toolbox, the system
was trained. According to the number of samples included,
near to the average number of samples of all years included
in the study, the year 2006 was used to train the ANN. For
testing the ANN, the rest of the years included in the study
were used. This is one of the strong points of the system,
we train the system only with 20% of samples, and then we
test it with the 80% of the samples.
The best combination of phenomena that leads to an
accurate temperature prediction was chosen according to
the results obtained by the application of heuristic methods.
0 20 40 60 80 100 120 140 160 180 200150
160
170
180
190
200
210
220
230COMPARATIVE TRUE VALUE (BLUE) PREDICTED VALUE (RED) YEAR 2003
TEM
PE
RA
TUR
E IN
TE
NTH
S O
F C
ELS
IUS
DE
GR
EE
S
January 1st to 8th, 2003 TF
Fig. 7 Temperature GC
Table 3 Results using
temperatureStatistical parameters Prediction error in �C
Year 2003 Year 2004 Year 2005 Year 2007
MIN 1.00 9 10-4 3.17 9 10-5 2.00 9 10-4 2.07 9 10-5
MAX 8.87 8.89 5.91 4.74
MAE 0.44 0.50 0.46 0.48
SD 0.47 0.56 0.48 0.49
MSE 0.64 0.75 0.67 0.68
Time (s) Train 32.5
Test per sample 2.85 9 10-3
Table 4 Results using
temperatureStatistical parameters Prediction error in �C
Year 2003 Year 2004 Year 2005 Year 2007
MIN 1.84 9 10-5 2.36 9 10-5 1.50 9 10-4 8.03 9 10-5
MAX 4.54 7.05 6.12 4.67
MAE 0.42 0.49 0.45 0.46
SD 0.46 0.55 0.47 0.48
MSE 0.62 0.73 0.65 0.67
Time (s) Train 3.06 9 103
Test per sample 2.81 9 10-3
Neural Computing and Applications
123
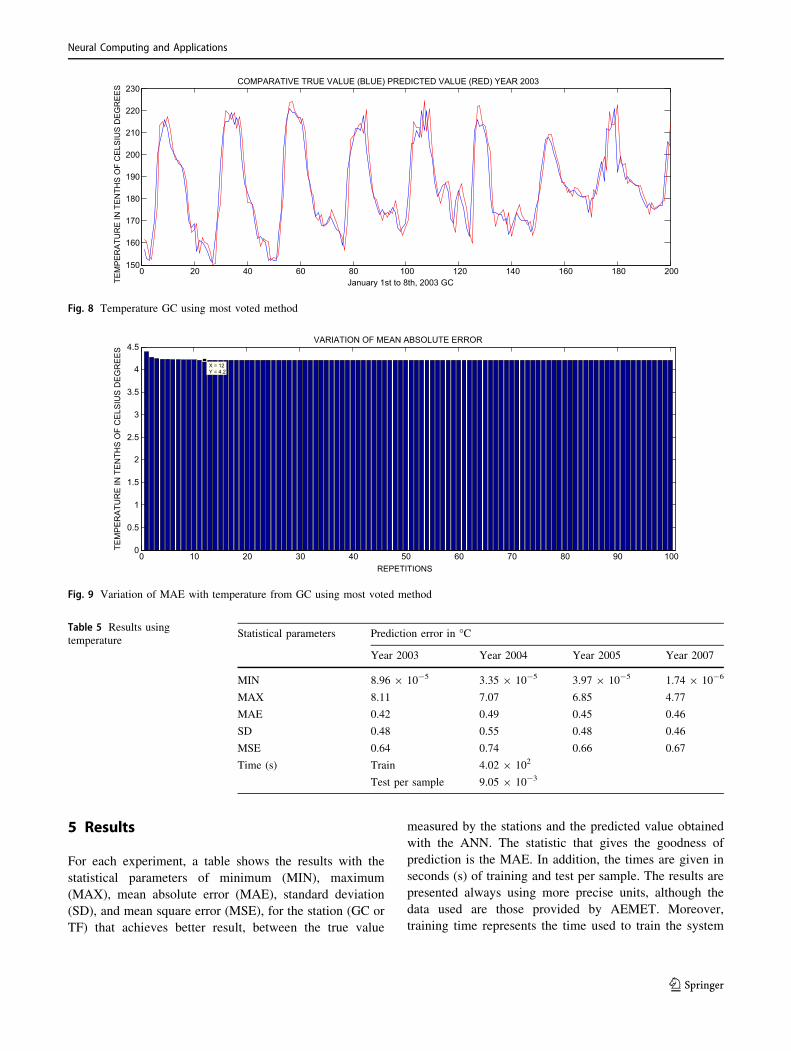
5 Results
For each experiment, a table shows the results with the
statistical parameters of minimum (MIN), maximum
(MAX), mean absolute error (MAE), standard deviation
(SD), and mean square error (MSE), for the station (GC or
TF) that achieves better result, between the true value
measured by the stations and the predicted value obtained
with the ANN. The statistic that gives the goodness of
prediction is the MAE. In addition, the times are given in
seconds (s) of training and test per sample. The results are
presented always using more precise units, although the
data used are those provided by AEMET. Moreover,
training time represents the time used to train the system
0 20 40 60 80 100 120 140 160 180 200150
160
170
180
190
200
210
220
230COMPARATIVE TRUE VALUE (BLUE) PREDICTED VALUE (RED) YEAR 2003
TEM
PE
RA
TUR
E IN
TE
NTH
S O
F C
ELS
IUS
DE
GR
EE
S
January 1st to 8th, 2003 GC
Fig. 8 Temperature GC using most voted method
0 10 20 30 40 50 60 70 80 90 1000
0.5
1
1.5
2
2.5
3
3.5
4
4.5
X = 12Y = 4.2
VARIATION OF MEAN ABSOLUTE ERROR
TEM
PE
RA
TUR
E IN
TE
NTH
S O
F C
ELS
IUS
DE
GR
EE
S
REPETITIONS
Fig. 9 Variation of MAE with temperature from GC using most voted method
Table 5 Results using
temperatureStatistical parameters Prediction error in �C
Year 2003 Year 2004 Year 2005 Year 2007
MIN 8.96 9 10-5 3.35 9 10-5 3.97 9 10-5 1.74 9 10-6
MAX 8.11 7.07 6.85 4.77
MAE 0.42 0.49 0.45 0.46
SD 0.48 0.55 0.48 0.46
MSE 0.64 0.74 0.66 0.67
Time (s) Train 4.02 9 102
Test per sample 9.05 9 10-3
Neural Computing and Applications
123
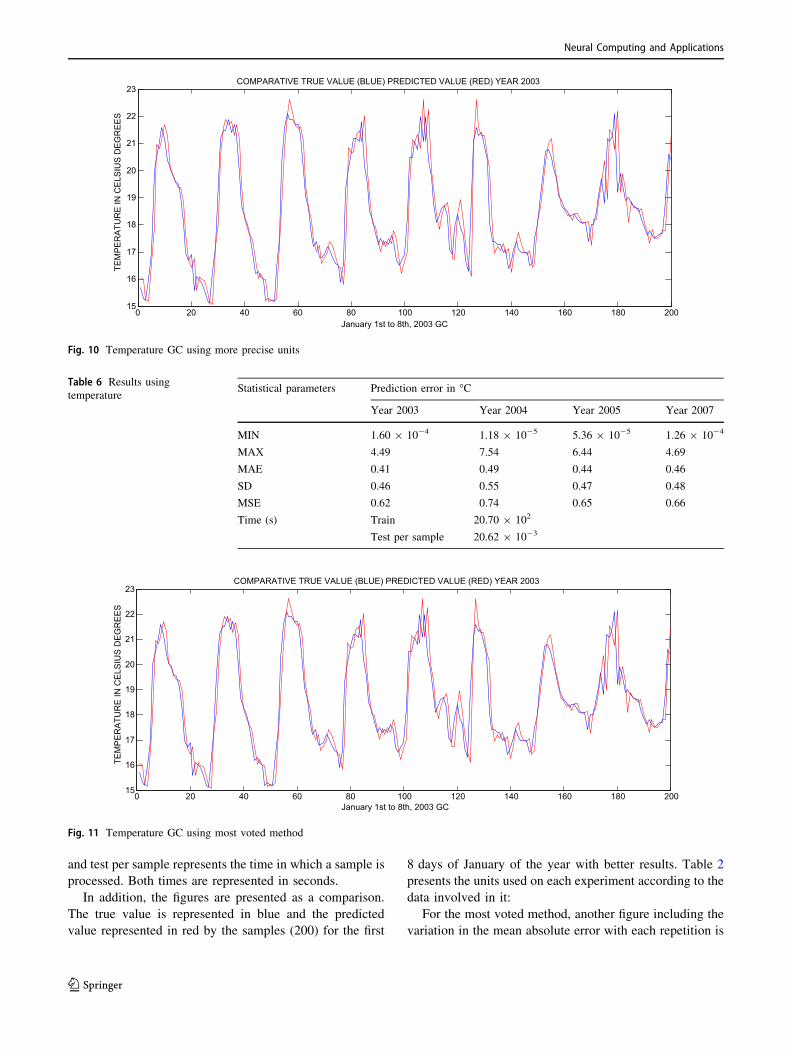
and test per sample represents the time in which a sample is
processed. Both times are represented in seconds.
In addition, the figures are presented as a comparison.
The true value is represented in blue and the predicted
value represented in red by the samples (200) for the first
8 days of January of the year with better results. Table 2
presents the units used on each experiment according to the
data involved in it:
For the most voted method, another figure including the
variation in the mean absolute error with each repetition is
0 20 40 60 80 100 120 140 160 180 20015
16
17
18
19
20
21
22
23COMPARATIVE TRUE VALUE (BLUE) PREDICTED VALUE (RED) YEAR 2003
TEM
PE
RA
TUR
E IN
CE
LSIU
S D
EG
RE
ES
January 1st to 8th, 2003 GC
Fig. 10 Temperature GC using more precise units
Table 6 Results using
temperatureStatistical parameters Prediction error in �C
Year 2003 Year 2004 Year 2005 Year 2007
MIN 1.60 9 10-4 1.18 9 10-5 5.36 9 10-5 1.26 9 10-4
MAX 4.49 7.54 6.44 4.69
MAE 0.41 0.49 0.44 0.46
SD 0.46 0.55 0.47 0.48
MSE 0.62 0.74 0.65 0.66
Time (s) Train 20.70 9 102
Test per sample 20.62 9 10-3
0 20 40 60 80 100 120 140 160 180 20015
16
17
18
19
20
21
22
23COMPARATIVE TRUE VALUE (BLUE) PREDICTED VALUE (RED) YEAR 2003
TEM
PE
RA
TUR
E IN
CE
LSIU
S D
EG
RE
ES
January 1st to 8th, 2003 GC
Fig. 11 Temperature GC using most voted method
Neural Computing and Applications
123
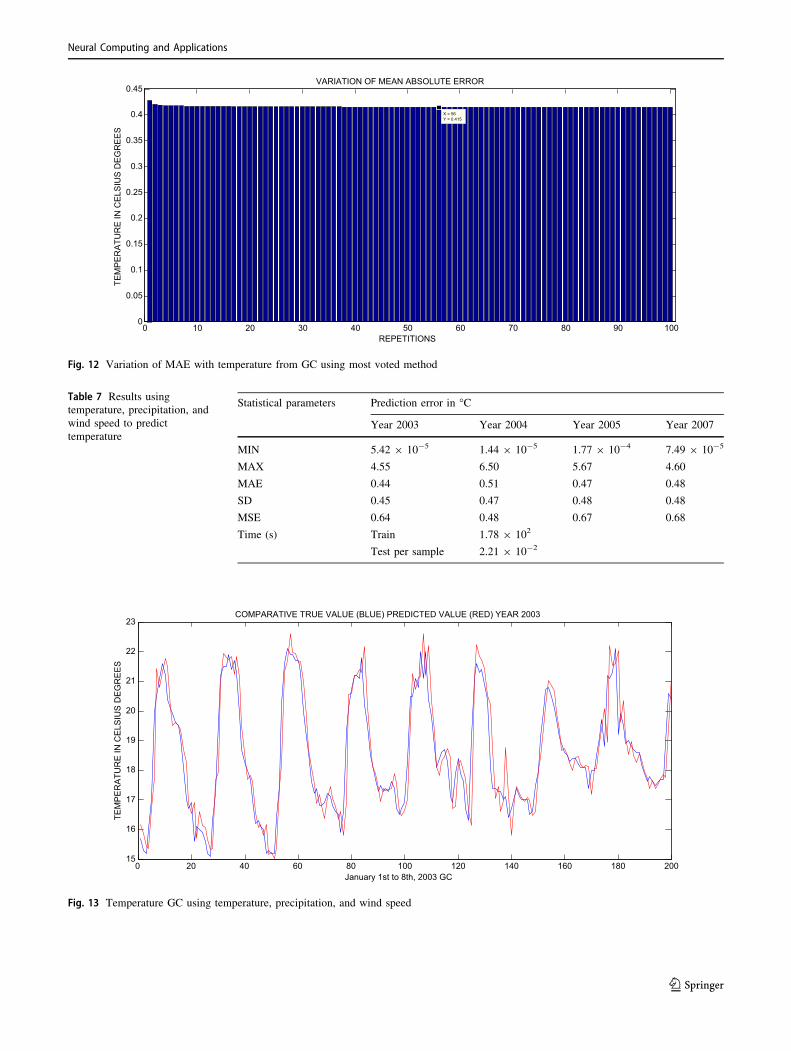
0 10 20 30 40 50 60 70 80 90 1000
0.05
0.1
0.15
0.2
0.25
0.3
0.35
0.4
0.45
X = 56Y = 0.415
VARIATION OF MEAN ABSOLUTE ERROR
TEM
PE
RA
TUR
E IN
CE
LSIU
S D
EG
RE
ES
REPETITIONS
Fig. 12 Variation of MAE with temperature from GC using most voted method
Table 7 Results using
temperature, precipitation, and
wind speed to predict
temperature
Statistical parameters Prediction error in �C
Year 2003 Year 2004 Year 2005 Year 2007
MIN 5.42 9 10-5 1.44 9 10-5 1.77 9 10-4 7.49 9 10-5
MAX 4.55 6.50 5.67 4.60
MAE 0.44 0.51 0.47 0.48
SD 0.45 0.47 0.48 0.48
MSE 0.64 0.48 0.67 0.68
Time (s) Train 1.78 9 102
Test per sample 2.21 9 10-2
0 20 40 60 80 100 120 140 160 180 20015
16
17
18
19
20
21
22
23COMPARATIVE TRUE VALUE (BLUE) PREDICTED VALUE (RED) YEAR 2003
TEM
PE
RA
TUR
E IN
CE
LSIU
S D
EG
RE
ES
January 1st to 8th, 2003 GC
Fig. 13 Temperature GC using temperature, precipitation, and wind speed
Neural Computing and Applications
123
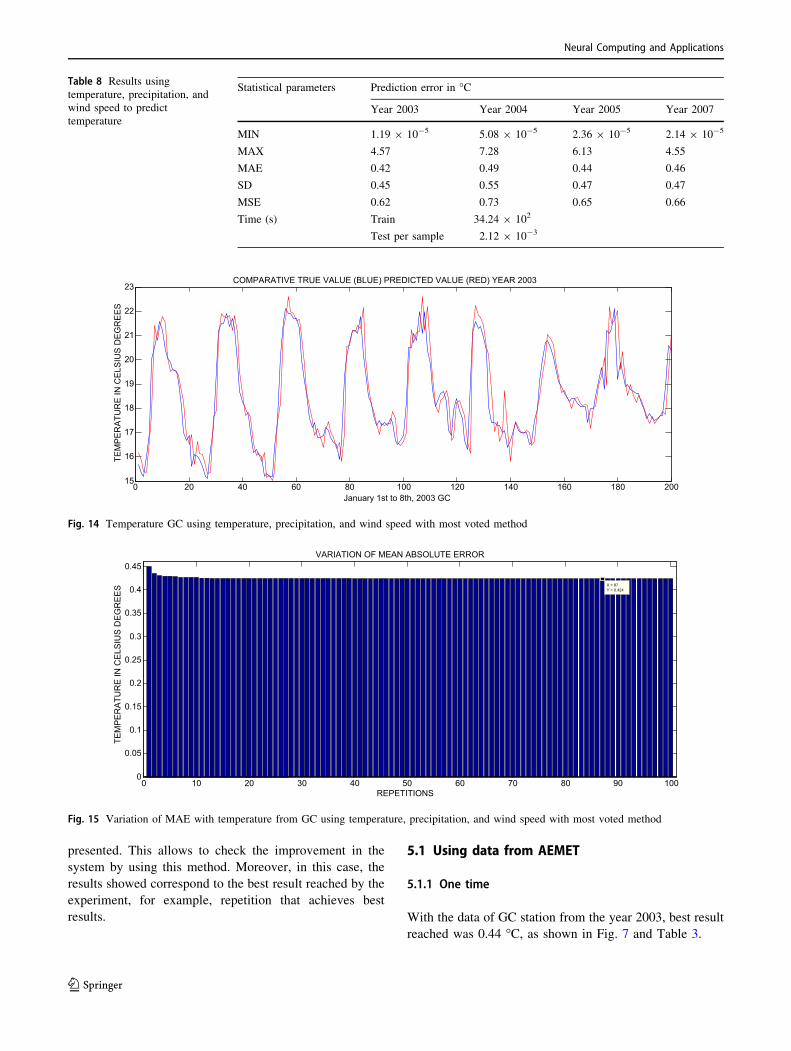
presented. This allows to check the improvement in the
system by using this method. Moreover, in this case, the
results showed correspond to the best result reached by the
experiment, for example, repetition that achieves best
results.
5.1 Using data from AEMET
5.1.1 One time
With the data of GC station from the year 2003, best result
reached was 0.44 �C, as shown in Fig. 7 and Table 3.
Table 8 Results using
temperature, precipitation, and
wind speed to predict
temperature
Statistical parameters Prediction error in �C
Year 2003 Year 2004 Year 2005 Year 2007
MIN 1.19 9 10-5 5.08 9 10-5 2.36 9 10-5 2.14 9 10-5
MAX 4.57 7.28 6.13 4.55
MAE 0.42 0.49 0.44 0.46
SD 0.45 0.55 0.47 0.47
MSE 0.62 0.73 0.65 0.66
Time (s) Train 34.24 9 102
Test per sample 2.12 9 10-3
0 20 40 60 80 100 120 140 160 180 20015
16
17
18
19
20
21
22
23COMPARATIVE TRUE VALUE (BLUE) PREDICTED VALUE (RED) YEAR 2003
TEM
PE
RA
TUR
E IN
CE
LSIU
S D
EG
RE
ES
January 1st to 8th, 2003 GC
Fig. 14 Temperature GC using temperature, precipitation, and wind speed with most voted method
0 10 20 30 40 50 60 70 80 90 1000
0.05
0.1
0.15
0.2
0.25
0.3
0.35
0.4
0.45
X = 87Y = 0.424
VARIATION OF MEAN ABSOLUTE ERROR
TEM
PE
RA
TUR
E IN
CE
LSIU
S D
EG
RE
ES
REPETITIONS
Fig. 15 Variation of MAE with temperature from GC using temperature, precipitation, and wind speed with most voted method
Neural Computing and Applications
123
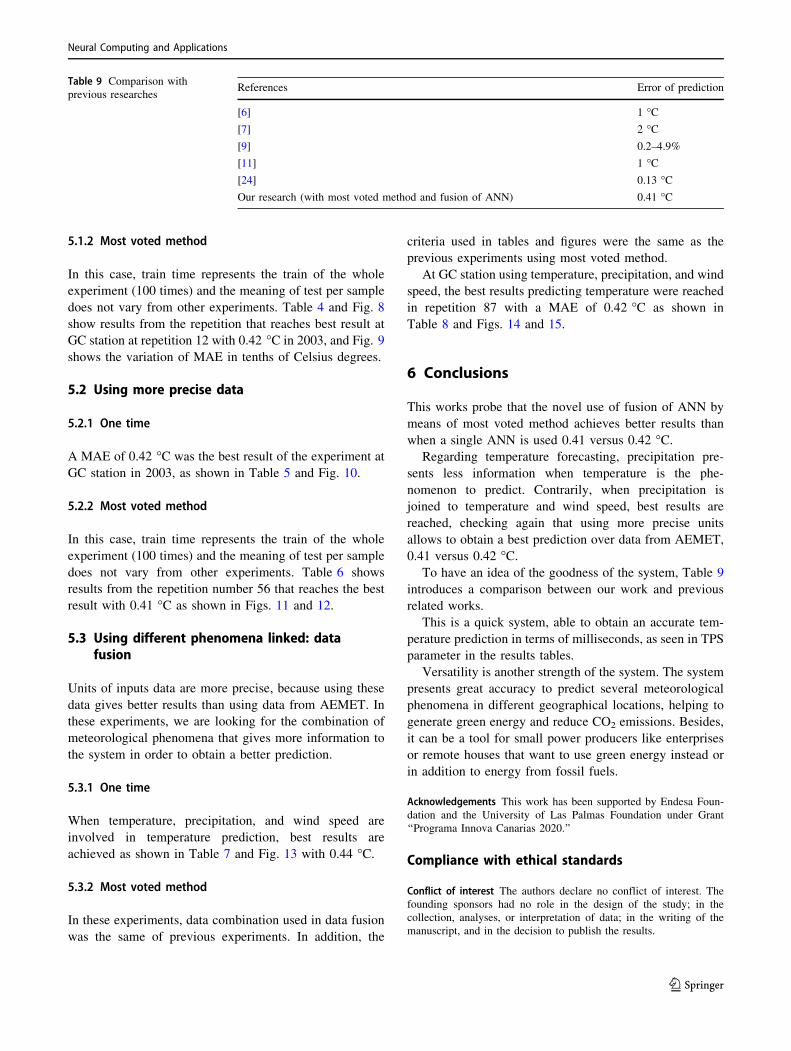
5.1.2 Most voted method
In this case, train time represents the train of the whole
experiment (100 times) and the meaning of test per sample
does not vary from other experiments. Table 4 and Fig. 8
show results from the repetition that reaches best result at
GC station at repetition 12 with 0.42 �C in 2003, and Fig. 9
shows the variation of MAE in tenths of Celsius degrees.
5.2 Using more precise data
5.2.1 One time
A MAE of 0.42 �C was the best result of the experiment at
GC station in 2003, as shown in Table 5 and Fig. 10.
5.2.2 Most voted method
In this case, train time represents the train of the whole
experiment (100 times) and the meaning of test per sample
does not vary from other experiments. Table 6 shows
results from the repetition number 56 that reaches the best
result with 0.41 �C as shown in Figs. 11 and 12.
5.3 Using different phenomena linked: datafusion
Units of inputs data are more precise, because using these
data gives better results than using data from AEMET. In
these experiments, we are looking for the combination of
meteorological phenomena that gives more information to
the system in order to obtain a better prediction.
5.3.1 One time
When temperature, precipitation, and wind speed are
involved in temperature prediction, best results are
achieved as shown in Table 7 and Fig. 13 with 0.44 �C.
5.3.2 Most voted method
In these experiments, data combination used in data fusion
was the same of previous experiments. In addition, the
criteria used in tables and figures were the same as the
previous experiments using most voted method.
At GC station using temperature, precipitation, and wind
speed, the best results predicting temperature were reached
in repetition 87 with a MAE of 0.42 �C as shown in
Table 8 and Figs. 14 and 15.
6 Conclusions
This works probe that the novel use of fusion of ANN by
means of most voted method achieves better results than
when a single ANN is used 0.41 versus 0.42 �C.Regarding temperature forecasting, precipitation pre-
sents less information when temperature is the phe-
nomenon to predict. Contrarily, when precipitation is
joined to temperature and wind speed, best results are
reached, checking again that using more precise units
allows to obtain a best prediction over data from AEMET,
0.41 versus 0.42 �C.To have an idea of the goodness of the system, Table 9
introduces a comparison between our work and previous
related works.
This is a quick system, able to obtain an accurate tem-
perature prediction in terms of milliseconds, as seen in TPS
parameter in the results tables.
Versatility is another strength of the system. The system
presents great accuracy to predict several meteorological
phenomena in different geographical locations, helping to
generate green energy and reduce CO2 emissions. Besides,
it can be a tool for small power producers like enterprises
or remote houses that want to use green energy instead or
in addition to energy from fossil fuels.
Acknowledgements This work has been supported by Endesa Foun-
dation and the University of Las Palmas Foundation under Grant
‘‘Programa Innova Canarias 2020.’’
Compliance with ethical standards
Conflict of interest The authors declare no conflict of interest. The
founding sponsors had no role in the design of the study; in the
collection, analyses, or interpretation of data; in the writing of the
manuscript, and in the decision to publish the results.
Table 9 Comparison with
previous researchesReferences Error of prediction
[6] 1 �C[7] 2 �C[9] 0.2–4.9%
[11] 1 �C[24] 0.13 �COur research (with most voted method and fusion of ANN) 0.41 �C
Neural Computing and Applications
123
References
1. World Bank (2017) Percentage of fossil fuel energy consumed by
countries. http://datos.bancomundial.org/indicador/EG.USE.
COMM.FO.ZS. Last visit: 22th November, 2017
2. Endesa (2017) Anual report, sustainability. https://www.endesa.
com/content/dam/enel-es/home/inversores/infoeconomicafi
nanciera/informesanuales/documentos/2013/Sostenibilidad%
202013.pdf. Last visit: 22th November, 2017
3. Twenergy (2017) An Endesa initiative for efficiency and sus-
tainability. https://twenergy.com/a/el-largo-viaje-de-la-elec
tricidad-211. Last visit: 22th November, 2017
4. Brede M, de Vries BJM (2013) The energy transition in a cli-
mate-constrained world: regional versus global optimization.
Environ Modell Softw 44:44–61. ISSN 1364-8152. https://doi.
org/10.1016/j.envsoft.2012.07.011, http://www.sciencedirect.
com/science/article/pii/S1364815212002095
5. del Viento G (2017) Wind-hydro-pumped station of El Hierro.
http://www.goronadelviento.es/index.php. Last visit: 22th
November, 2017
6. Ellouz IK, Ben Jmaa Derbel H, Kanoun O (2009) Temperature
prediction of soil-pipe-air heat exchanger using neural networks.
In: 6th International multi-conference on systems, signals and
devices. SSD ‘09, pp 1–6. https://doi.org/10.1109/ssd.2009.
4956716, http://ieeexplore.ieee.org/stamp/stamp.jsp?tp=&arnum
ber=4956716&isnumber=4956638
7. Fan S, Methaprayoon K, Lee WJ (2010) Multi-region load
forecasting considering alternative meteorological predictions.
In: Power and energy society general meeting, 2010 IEEE,
pp 1–7. https://doi.org/10.1109/pes.2010.5589869, http://ieeex
plore.ieee.org/stamp/stamp.jsp?tp=&arnumber=5589869&isnum
ber=5588047
8. Rastogi A, Srivastava A, Srivastava VK, Pandey AK (2011)
Pattern analysis approach for prediction using wavelet neural
networks. In: 2011 Seventh international conference on natural
computation (ICNC), pp 695–699. https://doi.org/10.1109/icnc.
2011.6022288, http://ieeexplore.ieee.org/stamp/stamp.jsp?tp=
&arnumber=6022288&isnumber=6022138
9. Chen X, Xu A (2011) Temperature and humidity of air in mine
roadways prediction based on BP neural network. In: 2011
International conference on multimedia technology (ICMT),
pp 1273–1276 https://doi.org/10.1109/icmt.2011.6002598, http://
ieeexplore.ieee.org/stamp/stamp.jsp?tp=&arnumber=
6002598&isnumber=6001647
10. Routh TK, Bin Yousuf AH, Hossain MN, Asasduzzaman MM,
Hossain MI, Husnaeen U, Mubarak M (2012) Artificial neural
network based temperature prediction and its impact on solar cell.
In: 2012 International conference on informatics, electronics &
vision (ICIEV), pp 897–902. https://doi.org/10.1109/iciev.2012.
6317369, http://ieeexplore.ieee.org/stamp/stamp.jsp?tp=&arnum
ber=6317369&isnumber=6317321
11. Huang H, Chen L, Mohammadzaheri M, Hu E, Chen M (2013)
Multi-zone temperature prediction in a commercial building
using artificial neural network model. In: 2013 10th IEEE inter-
national conference on control and automation (ICCA),
pp 1896–1901. https://doi.org/10.1109/icca.2013.6565010, http://
ieeexplore.ieee.org/stamp/stamp.jsp?tp=&arnumber=
6565010&isnumber=6564841
12. Li X, Liu Y, Xin W (2009) Wind speed prediction based on
genetic neural network. In: 4th IEEE conference on industrial
electronics and applications. ICIEA 2009, pp 2448–2451
13. Zhao P, Xia J, Dai Y, He J (2010) Wind speed prediction using
support vector regression. In: The 5th IEEE conference on
industrial electronics and applications (ICIEA), pp 882–886
14. Tarade RS, Katti PK (2011) A comparative analysis for wind
speed prediction. In: 2011 International conference on energy,
automation, and signal (ICEAS), pp 1–6
15. Bhaskar K, Singh SN (2012) AWNN-assisted wind power fore-
casting using feed-forward neural network. IEEE Trans Sustain
Energy 3(2):306–315
16. Nan S, Su-quan Z, Xian-hui Z, Xun-wen S, Xiao-yan Z (2013)
Wind speed forecasting based on grey predictor and genetic
neural network models. In: International conference on mea-
surement, information and control (ICMIC), vol 02,
pp 1479–1482
17. Chen N, Qian Z, Nabney IT, Meng X (2014) Wind power fore-
casts using gaussian processes and numerical weather prediction.
IEEE Trans Power Syst 29(2):656–665
18. Ruffing SM, Venayagamoorthy GK (2009) Short to medium
range time series prediction of solar irradiance using an echo state
network. In: 15th International conference on intelligent system
applications to power systems. ISAP ‘09, pp 1–6
19. Naing LP, Srinivasan D (2010) Estimation of solar power gen-
erating capacity. In: IEEE 11th international conference on
probabilistic methods applied to power systems (PMAPS),
pp 95–100
20. Wang J, Xie Y, Zhu C, Xu X (2011) Daily solar radiation pre-
diction based on genetic algorithm optimization of wavelet neural
network. In: International conference on electrical and control
engineering (ICECE), pp 602–605
21. Ji W, Chee KC (2011) Prediction of hourly solar radiation using a
novel hybrid model of ARMA and TDNN. In: Solar energy vol
85(5), pp 808–817. https://www.sciencedirect.com/science/arti
cle/pii/S0038092X11000259. July 14, 2014
22. Salcedo-Sanz S, Casanova-Mateo C, Munoz-Mari J, Camps-Valls
G (2014) Prediction of daily global solar irradiation using tem-
poral gaussian processes. IEEE Geosci Remote Sens Lett
11(11):1936–1940
23. Baptista D, Abreu S, Travieso-Gonzalez C, Morgado-Dias F
(2016) Hardware implementation of an artificial neural network
model to predict the energy production of a photovoltaic system.
Microprocess Microsyst 49:77–86. https://doi.org/10.1016/j.mic
pro.2016.11.003
24. Hernandez-Travieso JG, Herrera-Jimenez AL, Travieso-Gonzalez
CM, Morgado-Dıas F, Alonso-Hernandez JB, Ravelo-Garcıa AG
(2017) Sustainability. vol 9, p 193. http://www.mdpi.com/2071-
1050/9/2/193
25. Haykin S (1999) Neural networks. A comprehensive foundation,
2nd edn. Prentice Hall International, Inc., Upper Saddle River
26. Li X, Zecchin AC, Maier HR (2014) Selection of smoothing
parameter estimators for general regression neural networks—
applications to hydrological and water resources modelling.
Environ Modell Softw 59:162–186. ISSN 1364-8152. https://doi.
org/10.1016/j.envsoft.2014.05.010, http://www.sciencedirect.
com/science/article/pii/S1364815214001418
27. Bakker M, Vreeburg JHG, van Schagen KM, Rietveld LC (2013)
A fully adaptive forecasting model for short-term drinking water
demand. Environ Modell Softw 48:141–151. ISSN 1364-8152.
https://doi.org/10.1016/j.envsoft.2013.06.012, http://www.scien
cedirect.com/science/article/pii/S1364815213001576
28. Valverde MC, Araujo E, Velho HC (2014) Neural network and
fuzzy logic statistical downscaling of atmospheric circulation-
type specific weather pattern for rainfall forecasting. Appl Soft
Comput 22:681–694, ISSN 1568-4946. https://doi.org/10.1016/j.
asoc.2014.02.025, http://www.sciencedirect.com/science/article/
pii/S1568494614000957
Neural Computing and Applications
123

MODELOS DE PREDICCIÓN METEOROLÓGICA BASADOS EN MÉTODOS DE CLASIFICACIÓN ORIENTADOS A LA
MEJORA DE LA EFICIENCIA ENERGÉTICA EN LOS PROCESOS DE GENERACIÓN.
TESIS DOCTORAL JOSÉ GUSTAVO HERNÁNDEZ TRAVIESO
89
Temperature Control by Its Forecasting Applying Score Fusion for Sustainable
Development
Revista: Sustainability.
JCR 2017: IF: 2.075, 21/33, Q3 (Green & Sustainable Science & Technology),
120/241, Q3 (Environmental Science).
Publicación online: 28 de enero de 2017.
URL: http://www.mdpi.com/2071-1050/9/2/193

MODELOS DE PREDICCIÓN METEOROLÓGICA BASADOS EN MÉTODOS DE CLASIFICACIÓN ORIENTADOS A LA
MEJORA DE LA EFICIENCIA ENERGÉTICA EN LOS PROCESOS DE GENERACIÓN.
TESIS DOCTORAL JOSÉ GUSTAVO HERNÁNDEZ TRAVIESO
90
sustainability
Article
Temperature Control by Its Forecasting ApplyingScore Fusion for Sustainable Development
José Gustavo Hernández-Travieso 1,*, Antonio L. Herrera-Jiménez 1,Carlos M. Travieso-González 1, Fernando Morgado-Dias 2, Jesús B. Alonso-Hernández 1
and Antonio G. Ravelo-García 1
1 Signal and Communications Department, Institute for Technological Development and Innovation inCommunications (IDeTIC), University of Las Palmas de Gran Canaria, Campus Universitario de Tafira,35017 Las Palmas de Gran Canaria, Spain; [email protected] (A.L.H.-J.);[email protected] (C.M.T.-G.); [email protected] (J.B.A.-H.); [email protected] (A.G.R.-G.)
2 Madeira Interactive Technologies Institute, University of Madeira, 9020-105 Funchal, Portugal;[email protected]
* Correspondence: [email protected]; Tel.: +34-928-459-965
Academic Editor: Vincenzo TorrettaReceived: 26 December 2016; Accepted: 25 January 2017; Published: 28 January 2017
Abstract: Temperature control and its prediction has turned into a research challenge for theknowledge of the planet and its effects on different human activities and this will assure, inconjunction with energy efficiency, a sustainable development reducing CO2 emissions and fuelconsumption. This work tries to offer a practical solution to temperature forecast and control, whichhas been traditionally carried out by specialized institutes. For the accomplishment of temperatureestimation, a score fusion block based on Artificial Neural Networks was used. The dataset iscomposed by data from a meteorological station, using 20,000 temperature values and 10,000 samplesof several meteorological parameters. Thus, the complexity of the traditional forecasting models isresolved. As a result, a practical system has been obtained, reaching a mean squared error of 0.136 ◦Cfor short period of time prediction and 5 ◦C for large period of time prediction.
Keywords: temperature forecasting; sustainable development; artificial neural network; score fusion;prediction system
1. Introduction
Modern societies are conditioned by many natural factors, such as, for example, the weather.The meteorological changes affect to different aspects of our lives. These changes not only haveinfluence over the fields which are more directly connected with climatology, as the agriculturalsector, but also over others which are more complex and apparently dissociated from atmosphericreality, as energy efficiency, and this becomes in an important factor in planning for sustainableurban development.
In fact, the climate is an important factor that affects the economy. It is especially important,not only in areas based on systems of agricultural production (such as developing countries) butalso in other areas technologically developed and whose economies are based on other sectors suchas tourism, or even in those that try to approach a sustainable economy through renewable energysources [1]. Prediction is, therefore, a tool to be modelled and developed that can be compared todifferent procedures from each specific area. There are currently three important trends which tacklethis theme: Climatology, acting as empirical tradition; Physics of the Atmosphere, as theoreticaltradition; or Numerical Weather Prediction (NWP), as modern tradition [2]. These recent mathematicalmodels struggle at present to achieve a shorter response time as main target. However, the moreaccurate the method is, the more data is required and therefore a longer response time is obtained.
Sustainability 2017, 9, 193; doi:10.3390/su9020193 www.mdpi.com/journal/sustainability
Sustainability 2017, 9, 193 2 of 17
Meteorological services hold that the solution to that problem lies in the development of traditionalcomputing algorithms but in fact, there are emerging alternatives focused on the future of weatherforecast, such as Artificial Neural Networks (ANN) with supervised learning. Temperature predictionthrough time series is an important technique, in which past observations of certain weather variablesare collected and analyzed to develop a model based on the underlying relationship between them.It is important to have in mind that any temperature modeling is a chaotic system in which smallerrors in the initial prediction conditions grow very quickly and affect the predictability [3].
Mathematical models based on linear methods have been used for prediction of time series but theappearance of Artificial Neural Networks have offered a possibility to set new methodologies. TheseANN models are at present acquiring a great relevance for the recognition of patterns and even for thebiometrics. In the last decades some related works on meteorology have been developed, for example,in an approach to the coexistence of these models, G. Peter Zhang [4] proposed in 2001 a hybrid systemusing the linear method ARIMA (Auto Regressive Integrated Moving Average) and ANNs at the sametime. In this study, it was concluded that the nonlinear model of ANN offers results which are slightlymore favorable against the complexity of the linear system, because the most important advantage ofANN is their flexible nonlinear modeling potential.
In the field of meteorology, ANNs are also being used for prediction of atmospheric phenomenaand its application to power generation systems. In 2007, Sorjamaa, Hao, Reyhani, Ji and Lendasse [5]proposed a global methodology for the long-term prediction of time series, combining direct predictionstrategy and sophisticated input selection criteria. This methodology was successfully applied to thePoland Electricity Load dataset.
In 2009, Ellouz, Ben-Jmaa-Derbel and Kanoun [6] used ANNs to propose a tool to be able toevaluate aspects of the heat interchange between land and air through underground pipes in orderto achieve improvements in weather conditions of the building, with a prediction error between thepredicted and the experimental outlet temperature of 1.1 ◦C from 8 pm to 8 am and an error lowerthan 4 ◦C from 10 am to 5 pm. A year later, Fan, Methaprayoon and Lee [7] made overload forecastingconsidering meteorological predictions. The results were very positive and it helped to improve theenergy efficiency of the power station at precise times of higher electricity demand, obtaining anerror of 2 ◦C. In 2011, Rastogi, Srivastava, Srivastava and Pandey [8] used patterns analysis withANNs for temperature forecasting. With those results, the efficiency of the proposed model wasdemonstrated with a high accuracy between actual values and predicted values. In the same year,Chen and Xu [9] implemented a model based on ANNs for the prediction of temperature and humidityroadways of coal mines. The results had an error range, which was within the limits fixed (0.2%to 4.9%). Afterwards, in Bangladesh (2012), Routh, Bin Yousuf, Hossain, Asasduzzaman, Hossain,Husnaeen and Mubarak [10] also performed temperature predictions using models based on ANNsto improve energy efficiency in solar power stations. In this last case the results were also favorable.A little later (2013), Huang, Chen, Mohammadzaheri, Hu and Chen [11] also used these models tomake a multi-zone temperature prediction in the terminal building of the airport of Australia, wherethe results achieved a prediction error of just 1 ◦C.
Taking into account the diversity and progress in prediction strategies for multi-step aheadprediction, Ben Taieb, Bontempi, Atiya and Sorjamaa [12] made in 2012 a review of the different existingstrategies for multi-step ahead forecasting and made a comparison between them, in theoretical andpractical terms. As a conclusion they observed that the complexity of making a forecast of time seriesmany steps into the future is high due to the uncertainty, which increases with a larger time horizon.
Using data from the same meteorological stations of this research, Vásquez, Travieso, Pérez,Alonso y Briceño [13] presented a system that reaches an error of 0.28 ◦C making temperaturepredictions using multilayer ANN.
In 2013, Xiong, Bao and Hu [14] proposed a revised hybrid model built upon empirical modedecomposition based on the feed-forward neural network modeling framework incorporating theslope based method. The model was applied to obtain a prediction of crude oil prices, obtaining great
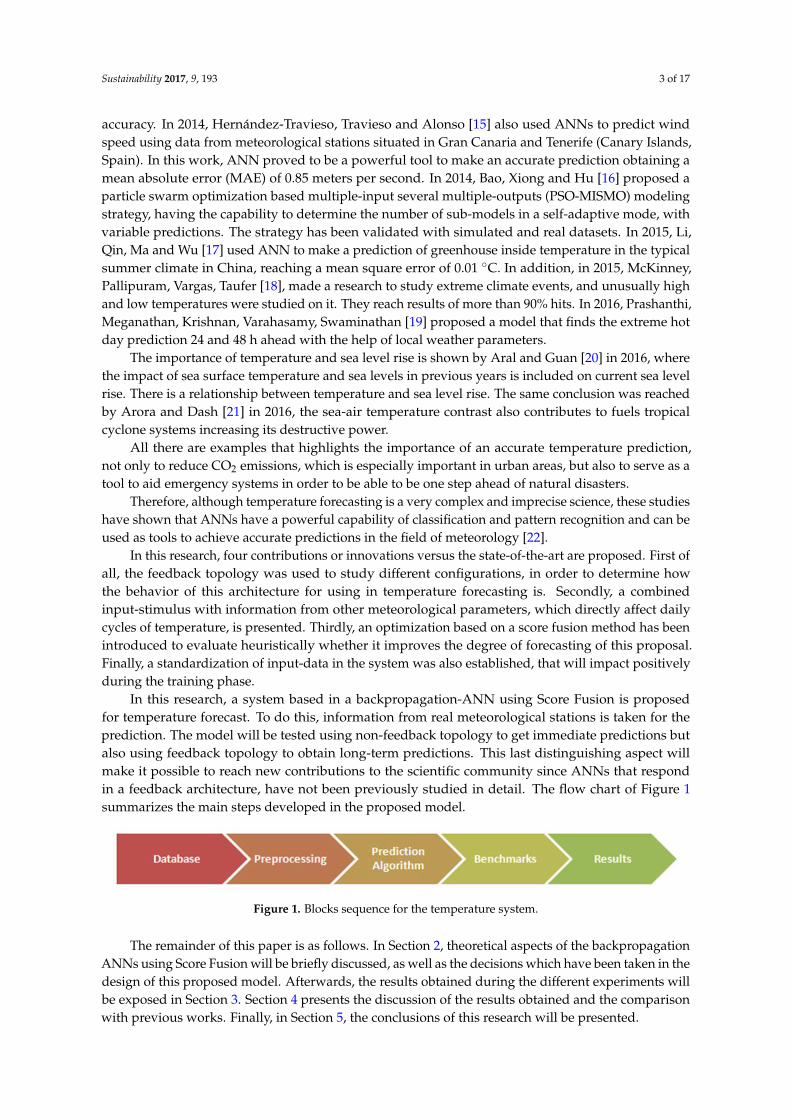
Sustainability 2017, 9, 193 3 of 17
accuracy. In 2014, Hernández-Travieso, Travieso and Alonso [15] also used ANNs to predict windspeed using data from meteorological stations situated in Gran Canaria and Tenerife (Canary Islands,Spain). In this work, ANN proved to be a powerful tool to make an accurate prediction obtaining amean absolute error (MAE) of 0.85 meters per second. In 2014, Bao, Xiong and Hu [16] proposed aparticle swarm optimization based multiple-input several multiple-outputs (PSO-MISMO) modelingstrategy, having the capability to determine the number of sub-models in a self-adaptive mode, withvariable predictions. The strategy has been validated with simulated and real datasets. In 2015, Li,Qin, Ma and Wu [17] used ANN to make a prediction of greenhouse inside temperature in the typicalsummer climate in China, reaching a mean square error of 0.01 ◦C. In addition, in 2015, McKinney,Pallipuram, Vargas, Taufer [18], made a research to study extreme climate events, and unusually highand low temperatures were studied on it. They reach results of more than 90% hits. In 2016, Prashanthi,Meganathan, Krishnan, Varahasamy, Swaminathan [19] proposed a model that finds the extreme hotday prediction 24 and 48 h ahead with the help of local weather parameters.
The importance of temperature and sea level rise is shown by Aral and Guan [20] in 2016, wherethe impact of sea surface temperature and sea levels in previous years is included on current sea levelrise. There is a relationship between temperature and sea level rise. The same conclusion was reachedby Arora and Dash [21] in 2016, the sea-air temperature contrast also contributes to fuels tropicalcyclone systems increasing its destructive power.
All there are examples that highlights the importance of an accurate temperature prediction,not only to reduce CO2 emissions, which is especially important in urban areas, but also to serve as atool to aid emergency systems in order to be able to be one step ahead of natural disasters.
Therefore, although temperature forecasting is a very complex and imprecise science, these studieshave shown that ANNs have a powerful capability of classification and pattern recognition and can beused as tools to achieve accurate predictions in the field of meteorology [22].
In this research, four contributions or innovations versus the state-of-the-art are proposed. First ofall, the feedback topology was used to study different configurations, in order to determine howthe behavior of this architecture for using in temperature forecasting is. Secondly, a combinedinput-stimulus with information from other meteorological parameters, which directly affect dailycycles of temperature, is presented. Thirdly, an optimization based on a score fusion method has beenintroduced to evaluate heuristically whether it improves the degree of forecasting of this proposal.Finally, a standardization of input-data in the system was also established, that will impact positivelyduring the training phase.
In this research, a system based in a backpropagation-ANN using Score Fusion is proposedfor temperature forecast. To do this, information from real meteorological stations is taken for theprediction. The model will be tested using non-feedback topology to get immediate predictions butalso using feedback topology to obtain long-term predictions. This last distinguishing aspect willmake it possible to reach new contributions to the scientific community since ANNs that respondin a feedback architecture, have not been previously studied in detail. The flow chart of Figure 1summarizes the main steps developed in the proposed model.
Sustainability 2017, 9, 193 3 of 16
Spain). In this work, ANN proved to be a powerful tool to make an accurate prediction obtaining a
mean absolute error (MAE) of 0.85 meters per second. In 2014, Bao, Xiong and Hu [16] proposed a
particle swarm optimization based multiple-input several multiple-outputs (PSO-MISMO) modeling
strategy, having the capability to determine the number of sub-models in a self-adaptive mode, with
variable predictions. The strategy has been validated with simulated and real datasets. In 2015, Li,
Qin, Ma and Wu [17] used ANN to make a prediction of greenhouse inside temperature in the typical
summer climate in China, reaching a mean square error of 0.01 °C. In addition, in 2015, McKinney,
Pallipuram, Vargas, Taufer [18], made a research to study extreme climate events, and unusually high
and low temperatures were studied on it. They reach results of more than 90% hits. In 2016,
Prashanthi, Meganathan, Krishnan, Varahasamy, Swaminathan [19] proposed a model that finds the
extreme hot day prediction 24 and 48 h ahead with the help of local weather parameters.
The importance of temperature and sea level rise is shown by Aral and Guan [20] in 2016, where
the impact of sea surface temperature and sea levels in previous years is included on current sea level
rise. There is a relationship between temperature and sea level rise. The same conclusion was reached
by Arora and Dash [21] in 2016, the sea-air temperature contrast also contributes to fuels tropical
cyclone systems increasing its destructive power.
All there are examples that highlights the importance of an accurate temperature prediction, not
only to reduce CO2 emissions, which is especially important in urban areas, but also to serve as a tool
to aid emergency systems in order to be able to be one step ahead of natural disasters.
Therefore, although temperature forecasting is a very complex and imprecise science, these
studies have shown that ANNs have a powerful capability of classification and pattern recognition
and can be used as tools to achieve accurate predictions in the field of meteorology [22].
In this research, four contributions or innovations versus the state-of-the-art are proposed. First
of all, the feedback topology was used to study different configurations, in order to determine how
the behavior of this architecture for using in temperature forecasting is. Secondly, a combined input-
stimulus with information from other meteorological parameters, which directly affect daily cycles
of temperature, is presented. Thirdly, an optimization based on a score fusion method has been
introduced to evaluate heuristically whether it improves the degree of forecasting of this proposal.
Finally, a standardization of input-data in the system was also established, that will impact positively
during the training phase.
In this research, a system based in a backpropagation-ANN using Score Fusion is proposed for
temperature forecast. To do this, information from real meteorological stations is taken for the
prediction. The model will be tested using non-feedback topology to get immediate predictions but
also using feedback topology to obtain long-term predictions. This last distinguishing aspect will
make it possible to reach new contributions to the scientific community since ANNs that respond in
a feedback architecture, have not been previously studied in detail. The flow chart of Figure 1
summarizes the main steps developed in the proposed model.
Figure 1. Blocks sequence for the temperature system.
The remainder of this paper is as follows. In Section 2, theoretical aspects of the backpropagation
ANNs using Score Fusion will be briefly discussed, as well as the decisions which have been taken in the
design of this proposed model. Afterwards, the results obtained during the different experiments will be
exposed in Section 3. Section 4 presents the discussion of the results obtained and the comparison with
previous works. Finally, in Section 5, the conclusions of this research will be presented.
Figure 1. Blocks sequence for the temperature system.
The remainder of this paper is as follows. In Section 2, theoretical aspects of the backpropagationANNs using Score Fusion will be briefly discussed, as well as the decisions which have been taken in thedesign of this proposed model. Afterwards, the results obtained during the different experiments willbe exposed in Section 3. Section 4 presents the discussion of the results obtained and the comparisonwith previous works. Finally, in Section 5, the conclusions of this research will be presented.
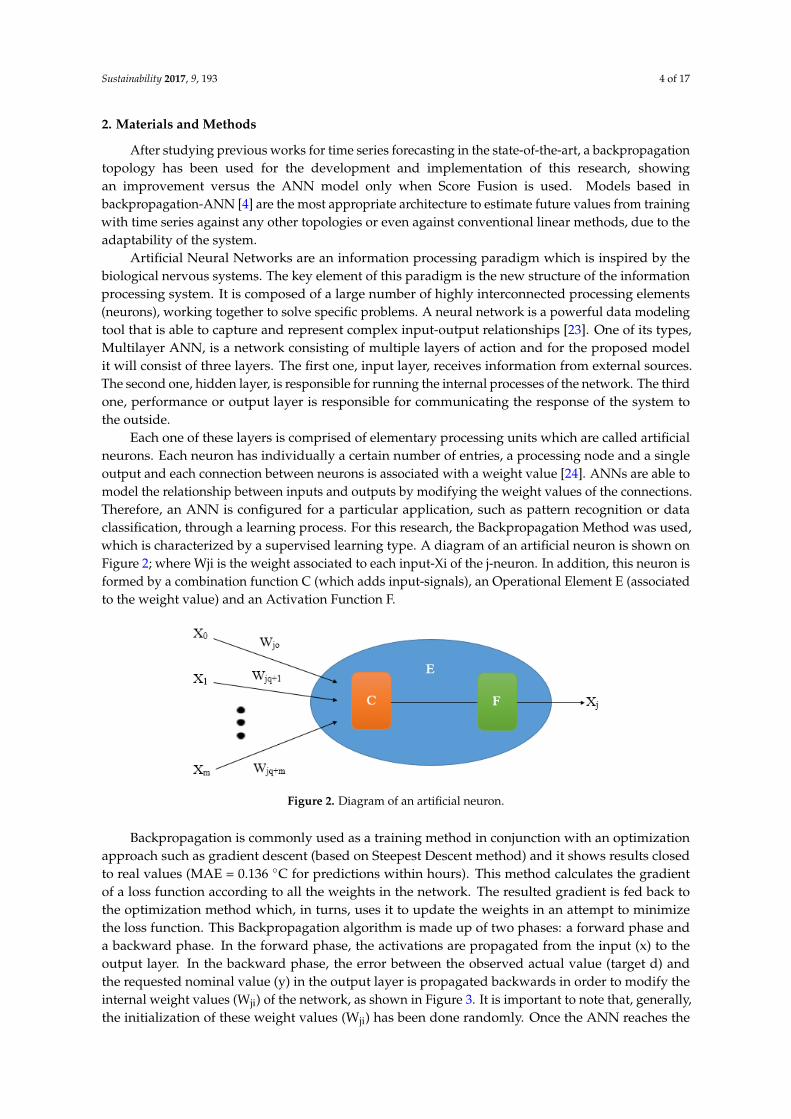
Sustainability 2017, 9, 193 4 of 17
2. Materials and Methods
After studying previous works for time series forecasting in the state-of-the-art, a backpropagationtopology has been used for the development and implementation of this research, showingan improvement versus the ANN model only when Score Fusion is used. Models based inbackpropagation-ANN [4] are the most appropriate architecture to estimate future values from trainingwith time series against any other topologies or even against conventional linear methods, due to theadaptability of the system.
Artificial Neural Networks are an information processing paradigm which is inspired by thebiological nervous systems. The key element of this paradigm is the new structure of the informationprocessing system. It is composed of a large number of highly interconnected processing elements(neurons), working together to solve specific problems. A neural network is a powerful data modelingtool that is able to capture and represent complex input-output relationships [23]. One of its types,Multilayer ANN, is a network consisting of multiple layers of action and for the proposed modelit will consist of three layers. The first one, input layer, receives information from external sources.The second one, hidden layer, is responsible for running the internal processes of the network. The thirdone, performance or output layer is responsible for communicating the response of the system tothe outside.
Each one of these layers is comprised of elementary processing units which are called artificialneurons. Each neuron has individually a certain number of entries, a processing node and a singleoutput and each connection between neurons is associated with a weight value [24]. ANNs are able tomodel the relationship between inputs and outputs by modifying the weight values of the connections.Therefore, an ANN is configured for a particular application, such as pattern recognition or dataclassification, through a learning process. For this research, the Backpropagation Method was used,which is characterized by a supervised learning type. A diagram of an artificial neuron is shown onFigure 2; where Wji is the weight associated to each input-Xi of the j-neuron. In addition, this neuron isformed by a combination function C (which adds input-signals), an Operational Element E (associatedto the weight value) and an Activation Function F.
Sustainability 2017, 9, 193 4 of 16
2. Materials and Methods
After studying previous works for time series forecasting in the state-of-the-art, a
backpropagation topology has been used for the development and implementation of this research,
showing an improvement versus the ANN model only when Score Fusion is used. Models based in
backpropagation-ANN [4] are the most appropriate architecture to estimate future values from
training with time series against any other topologies or even against conventional linear methods,
due to the adaptability of the system.
Artificial Neural Networks are an information processing paradigm which is inspired by the
biological nervous systems. The key element of this paradigm is the new structure of the information
processing system. It is composed of a large number of highly interconnected processing elements
(neurons), working together to solve specific problems. A neural network is a powerful data
modeling tool that is able to capture and represent complex input-output relationships [23]. One of
its types, Multilayer ANN, is a network consisting of multiple layers of action and for the proposed
model it will consist of three layers. The first one, input layer, receives information from external
sources. The second one, hidden layer, is responsible for running the internal processes of the
network. The third one, performance or output layer is responsible for communicating the response
of the system to the outside.
Each one of these layers is comprised of elementary processing units which are called artificial
neurons. Each neuron has individually a certain number of entries, a processing node and a single
output and each connection between neurons is associated with a weight value [24]. ANNs are able
to model the relationship between inputs and outputs by modifying the weight values of the
connections. Therefore, an ANN is configured for a particular application, such as pattern recognition
or data classification, through a learning process. For this research, the Backpropagation Method was
used, which is characterized by a supervised learning type. A diagram of an artificial neuron is shown
on Figure 2; where Wji is the weight associated to each input-Xi of the j-neuron. In addition, this
neuron is formed by a combination function C (which adds input-signals), an Operational Element E
(associated to the weight value) and an Activation Function F.
Figure 2. Diagram of an artificial neuron.
Backpropagation is commonly used as a training method in conjunction with an optimization
approach such as gradient descent (based on Steepest Descent method) and it shows results closed
to real values (MAE = 0.136 °C for predictions within hours). This method calculates the gradient of
a loss function according to all the weights in the network. The resulted gradient is fed back to the
optimization method which, in turns, uses it to update the weights in an attempt to minimize the loss
function. This Backpropagation algorithm is made up of two phases: a forward phase and a backward
phase. In the forward phase, the activations are propagated from the input (x) to the output layer. In
the backward phase, the error between the observed actual value (target d) and the requested
nominal value (y) in the output layer is propagated backwards in order to modify the internal weight
values (Wji) of the network, as shown in Figure 3. It is important to note that, generally, the
initialization of these weight values (Wji) has been done randomly. Once the ANN reaches the
Figure 2. Diagram of an artificial neuron.
Backpropagation is commonly used as a training method in conjunction with an optimizationapproach such as gradient descent (based on Steepest Descent method) and it shows results closedto real values (MAE = 0.136 ◦C for predictions within hours). This method calculates the gradientof a loss function according to all the weights in the network. The resulted gradient is fed back tothe optimization method which, in turns, uses it to update the weights in an attempt to minimizethe loss function. This Backpropagation algorithm is made up of two phases: a forward phase anda backward phase. In the forward phase, the activations are propagated from the input (x) to theoutput layer. In the backward phase, the error between the observed actual value (target d) andthe requested nominal value (y) in the output layer is propagated backwards in order to modify theinternal weight values (Wji) of the network, as shown in Figure 3. It is important to note that, generally,the initialization of these weight values (Wji) has been done randomly. Once the ANN reaches the
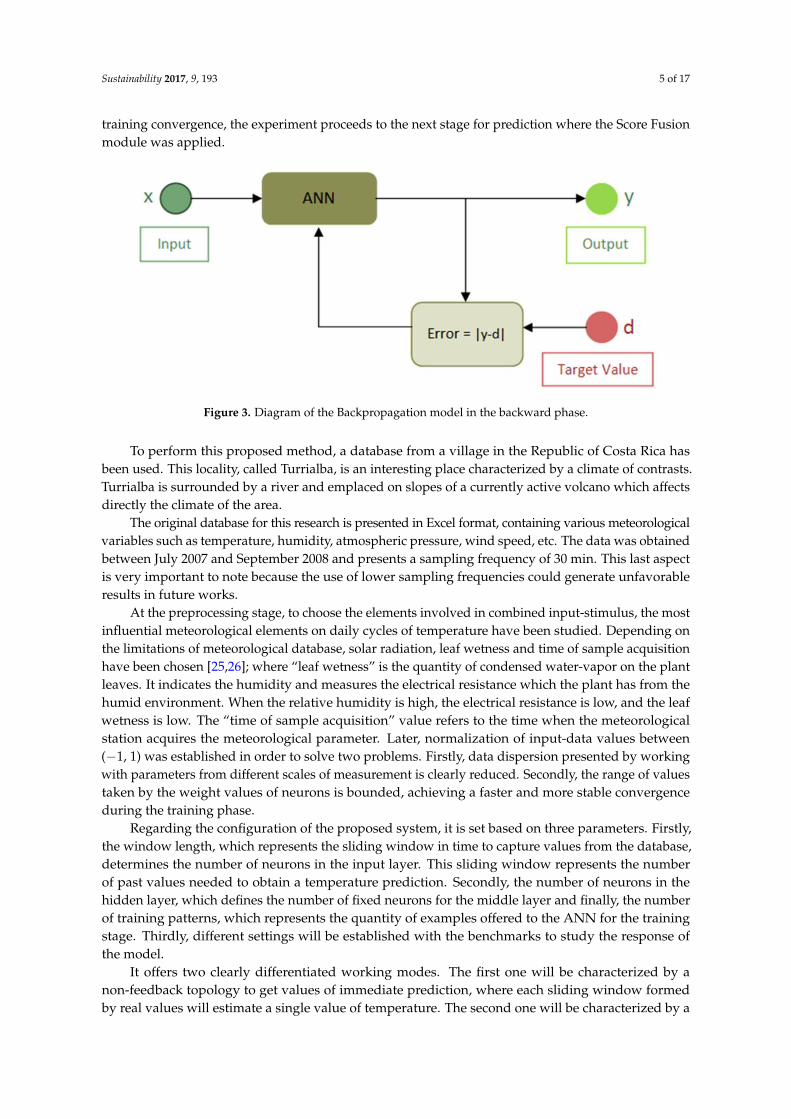
Sustainability 2017, 9, 193 5 of 17
training convergence, the experiment proceeds to the next stage for prediction where the Score Fusionmodule was applied.
Sustainability 2017, 9, 193 5 of 16
training convergence, the experiment proceeds to the next stage for prediction where the Score Fusion
module was applied.
Figure 3. Diagram of the Backpropagation model in the backward phase.
To perform this proposed method, a database from a village in the Republic of Costa Rica has
been used. This locality, called Turrialba, is an interesting place characterized by a climate of
contrasts. Turrialba is surrounded by a river and emplaced on slopes of a currently active volcano
which affects directly the climate of the area.
The original database for this research is presented in Excel format, containing various
meteorological variables such as temperature, humidity, atmospheric pressure, wind speed, etc. The
data was obtained between July 2007 and September 2008 and presents a sampling frequency of 30
minutes. This last aspect is very important to note because the use of lower sampling frequencies
could generate unfavorable results in future works.
At the preprocessing stage, to choose the elements involved in combined input-stimulus, the
most influential meteorological elements on daily cycles of temperature have been studied.
Depending on the limitations of meteorological database, solar radiation, leaf wetness and time of
sample acquisition have been chosen [25,26]; where “leaf wetness” is the quantity of condensed
water-vapor on the plant leaves. It indicates the humidity and measures the electrical resistance
which the plant has from the humid environment. When the relative humidity is high, the electrical
resistance is low, and the leaf wetness is low. The “time of sample acquisition” value refers to the
time when the meteorological station acquires the meteorological parameter. Later, normalization of
input-data values between (−1, 1) was established in order to solve two problems. Firstly, data
dispersion presented by working with parameters from different scales of measurement is clearly
reduced. Secondly, the range of values taken by the weight values of neurons is bounded, achieving
a faster and more stable convergence during the training phase.
Regarding the configuration of the proposed system, it is set based on three parameters. Firstly,
the window length, which represents the sliding window in time to capture values from the database,
determines the number of neurons in the input layer. This sliding window represents the number of
past values needed to obtain a temperature prediction. Secondly, the number of neurons in the hidden
layer, which defines the number of fixed neurons for the middle layer and finally, the number of training
patterns, which represents the quantity of examples offered to the ANN for the training stage. Thirdly,
different settings will be established with the benchmarks to study the response of the model.
It offers two clearly differentiated working modes. The first one will be characterized by a non-
feedback topology to get values of immediate prediction, where each sliding window formed by real
values will estimate a single value of temperature. The second one will be characterized by a feedback
topology to get short-term predictions, where, from a single window, a continuous prediction in time
will run using estimated values to generate new temperature values.
Figure 3. Diagram of the Backpropagation model in the backward phase.
To perform this proposed method, a database from a village in the Republic of Costa Rica hasbeen used. This locality, called Turrialba, is an interesting place characterized by a climate of contrasts.Turrialba is surrounded by a river and emplaced on slopes of a currently active volcano which affectsdirectly the climate of the area.
The original database for this research is presented in Excel format, containing various meteorologicalvariables such as temperature, humidity, atmospheric pressure, wind speed, etc. The data was obtainedbetween July 2007 and September 2008 and presents a sampling frequency of 30 min. This last aspectis very important to note because the use of lower sampling frequencies could generate unfavorableresults in future works.
At the preprocessing stage, to choose the elements involved in combined input-stimulus, the mostinfluential meteorological elements on daily cycles of temperature have been studied. Depending onthe limitations of meteorological database, solar radiation, leaf wetness and time of sample acquisitionhave been chosen [25,26]; where “leaf wetness” is the quantity of condensed water-vapor on the plantleaves. It indicates the humidity and measures the electrical resistance which the plant has from thehumid environment. When the relative humidity is high, the electrical resistance is low, and the leafwetness is low. The “time of sample acquisition” value refers to the time when the meteorologicalstation acquires the meteorological parameter. Later, normalization of input-data values between(−1, 1) was established in order to solve two problems. Firstly, data dispersion presented by workingwith parameters from different scales of measurement is clearly reduced. Secondly, the range of valuestaken by the weight values of neurons is bounded, achieving a faster and more stable convergenceduring the training phase.
Regarding the configuration of the proposed system, it is set based on three parameters. Firstly,the window length, which represents the sliding window in time to capture values from the database,determines the number of neurons in the input layer. This sliding window represents the numberof past values needed to obtain a temperature prediction. Secondly, the number of neurons in thehidden layer, which defines the number of fixed neurons for the middle layer and finally, the numberof training patterns, which represents the quantity of examples offered to the ANN for the trainingstage. Thirdly, different settings will be established with the benchmarks to study the response ofthe model.
It offers two clearly differentiated working modes. The first one will be characterized by anon-feedback topology to get values of immediate prediction, where each sliding window formedby real values will estimate a single value of temperature. The second one will be characterized by a
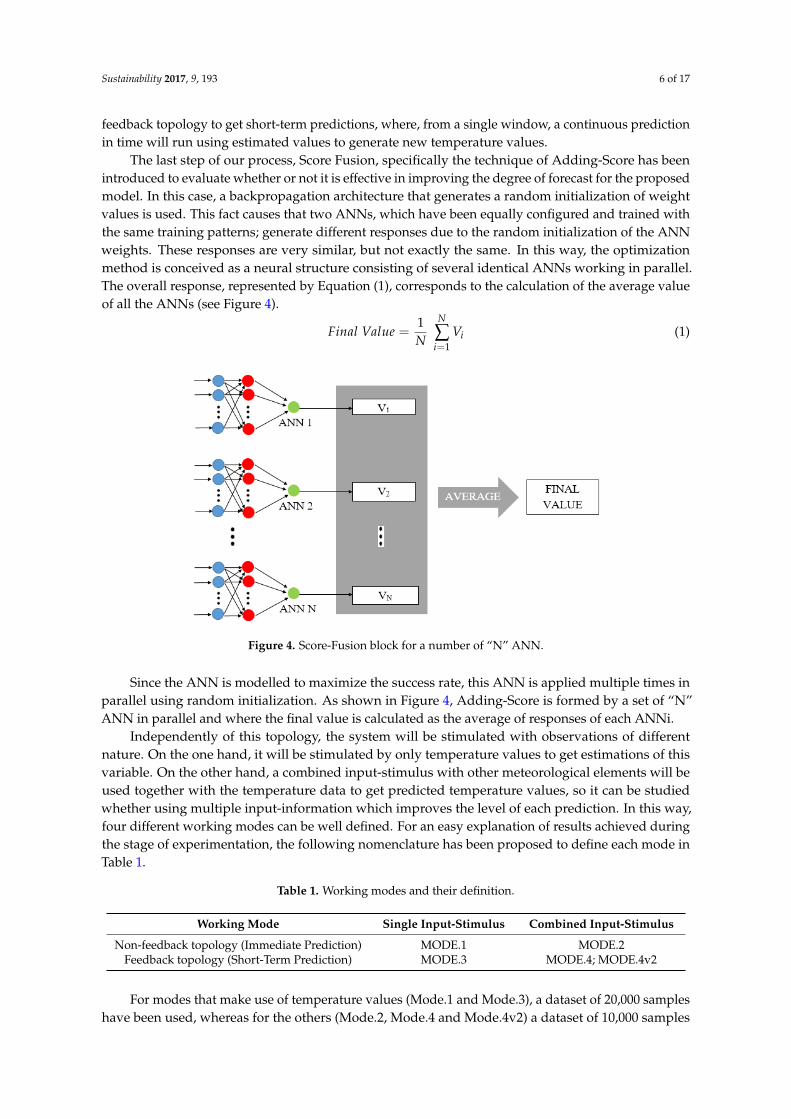
Sustainability 2017, 9, 193 6 of 17
feedback topology to get short-term predictions, where, from a single window, a continuous predictionin time will run using estimated values to generate new temperature values.
The last step of our process, Score Fusion, specifically the technique of Adding-Score has beenintroduced to evaluate whether or not it is effective in improving the degree of forecast for the proposedmodel. In this case, a backpropagation architecture that generates a random initialization of weightvalues is used. This fact causes that two ANNs, which have been equally configured and trained withthe same training patterns; generate different responses due to the random initialization of the ANNweights. These responses are very similar, but not exactly the same. In this way, the optimizationmethod is conceived as a neural structure consisting of several identical ANNs working in parallel.The overall response, represented by Equation (1), corresponds to the calculation of the average valueof all the ANNs (see Figure 4).
Final Value =1N
N
∑i=1
Vi (1)
Sustainability 2017, 9, 193 6 of 16
The last step of our process, Score Fusion, specifically the technique of Adding-Score has been
introduced to evaluate whether or not it is effective in improving the degree of forecast for the
proposed model. In this case, a backpropagation architecture that generates a random initialization
of weight values is used. This fact causes that two ANNs, which have been equally configured and
trained with the same training patterns; generate different responses due to the random initialization
of the ANN weights. These responses are very similar, but not exactly the same. In this way, the
optimization method is conceived as a neural structure consisting of several identical ANNs working
in parallel. The overall response, represented by Equation (1), corresponds to the calculation of the
average value of all the ANNs (see Figure 4).
𝐹𝑖𝑛𝑎𝑙 𝑉𝑎𝑙𝑢𝑒 = 1
𝑁 ∑ 𝑉𝑖
𝑁
𝑖=1
(1)
Figure 4. Score-Fusion block for a number of “N” ANN.
Since the ANN is modelled to maximize the success rate, this ANN is applied multiple times in
parallel using random initialization. As shown in Figure 4, Adding-Score is formed by a set of “N”
ANN in parallel and where the final value is calculated as the average of responses of each ANNi.
Independently of this topology, the system will be stimulated with observations of different
nature. On the one hand, it will be stimulated by only temperature values to get estimations of this
variable. On the other hand, a combined input-stimulus with other meteorological elements will be
used together with the temperature data to get predicted temperature values, so it can be studied
whether using multiple input-information which improves the level of each prediction. In this way,
four different working modes can be well defined. For an easy explanation of results achieved during the
stage of experimentation, the following nomenclature has been proposed to define each mode in Table 1.
Table 1. Working modes and their definition.
Working Mode Single Input-Stimulus Combined Input-Stimulus
Non-feedback topology (Immediate Prediction) MODE.1 MODE.2
Feedback topology (Short-Term Prediction) MODE.3 MODE.4; MODE.4v2
For modes that make use of temperature values (Mode.1 and Mode.3), a dataset of 20,000
samples have been used, whereas for the others (Mode.2, Mode.4 and Mode.4v2) a dataset of 10,000
samples was selected. The difference in the number of samples is due to the fact that the best results
are obtained with these parameters. The difference between Mode.4 and Mode.4v2 is that in
Mode.4v2 the sampling time parameter is also used in the prediction.
Regarding the evaluation of error parameters, two goodness criteria have been established
according to both topologies. Thus, for the non-feedback topology, mean absolute error (MAE)
Figure 4. Score-Fusion block for a number of “N” ANN.
Since the ANN is modelled to maximize the success rate, this ANN is applied multiple times inparallel using random initialization. As shown in Figure 4, Adding-Score is formed by a set of “N”ANN in parallel and where the final value is calculated as the average of responses of each ANNi.
Independently of this topology, the system will be stimulated with observations of differentnature. On the one hand, it will be stimulated by only temperature values to get estimations of thisvariable. On the other hand, a combined input-stimulus with other meteorological elements will beused together with the temperature data to get predicted temperature values, so it can be studiedwhether using multiple input-information which improves the level of each prediction. In this way,four different working modes can be well defined. For an easy explanation of results achieved duringthe stage of experimentation, the following nomenclature has been proposed to define each mode inTable 1.
Table 1. Working modes and their definition.
Working Mode Single Input-Stimulus Combined Input-Stimulus
Non-feedback topology (Immediate Prediction) MODE.1 MODE.2Feedback topology (Short-Term Prediction) MODE.3 MODE.4; MODE.4v2
For modes that make use of temperature values (Mode.1 and Mode.3), a dataset of 20,000 sampleshave been used, whereas for the others (Mode.2, Mode.4 and Mode.4v2) a dataset of 10,000 samples
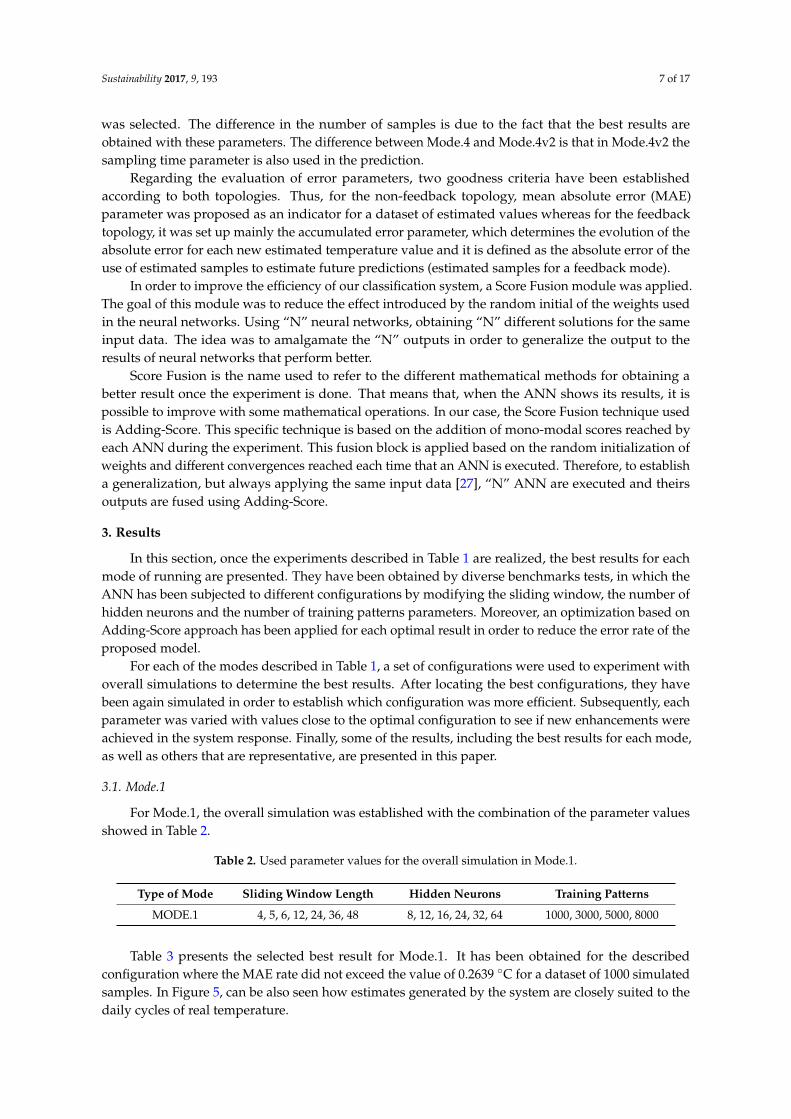
Sustainability 2017, 9, 193 7 of 17
was selected. The difference in the number of samples is due to the fact that the best results areobtained with these parameters. The difference between Mode.4 and Mode.4v2 is that in Mode.4v2 thesampling time parameter is also used in the prediction.
Regarding the evaluation of error parameters, two goodness criteria have been establishedaccording to both topologies. Thus, for the non-feedback topology, mean absolute error (MAE)parameter was proposed as an indicator for a dataset of estimated values whereas for the feedbacktopology, it was set up mainly the accumulated error parameter, which determines the evolution of theabsolute error for each new estimated temperature value and it is defined as the absolute error of theuse of estimated samples to estimate future predictions (estimated samples for a feedback mode).
In order to improve the efficiency of our classification system, a Score Fusion module was applied.The goal of this module was to reduce the effect introduced by the random initial of the weights usedin the neural networks. Using “N” neural networks, obtaining “N” different solutions for the sameinput data. The idea was to amalgamate the “N” outputs in order to generalize the output to theresults of neural networks that perform better.
Score Fusion is the name used to refer to the different mathematical methods for obtaining abetter result once the experiment is done. That means that, when the ANN shows its results, it ispossible to improve with some mathematical operations. In our case, the Score Fusion technique usedis Adding-Score. This specific technique is based on the addition of mono-modal scores reached byeach ANN during the experiment. This fusion block is applied based on the random initialization ofweights and different convergences reached each time that an ANN is executed. Therefore, to establisha generalization, but always applying the same input data [27], “N” ANN are executed and theirsoutputs are fused using Adding-Score.
3. Results
In this section, once the experiments described in Table 1 are realized, the best results for eachmode of running are presented. They have been obtained by diverse benchmarks tests, in which theANN has been subjected to different configurations by modifying the sliding window, the number ofhidden neurons and the number of training patterns parameters. Moreover, an optimization based onAdding-Score approach has been applied for each optimal result in order to reduce the error rate of theproposed model.
For each of the modes described in Table 1, a set of configurations were used to experiment withoverall simulations to determine the best results. After locating the best configurations, they havebeen again simulated in order to establish which configuration was more efficient. Subsequently, eachparameter was varied with values close to the optimal configuration to see if new enhancements wereachieved in the system response. Finally, some of the results, including the best results for each mode,as well as others that are representative, are presented in this paper.
3.1. Mode.1
For Mode.1, the overall simulation was established with the combination of the parameter valuesshowed in Table 2.
Table 2. Used parameter values for the overall simulation in Mode.1.
Type of Mode Sliding Window Length Hidden Neurons Training Patterns
MODE.1 4, 5, 6, 12, 24, 36, 48 8, 12, 16, 24, 32, 64 1000, 3000, 5000, 8000
Table 3 presents the selected best result for Mode.1. It has been obtained for the describedconfiguration where the MAE rate did not exceed the value of 0.2639 ◦C for a dataset of 1000 simulatedsamples. In Figure 5, can be also seen how estimates generated by the system are closely suited to thedaily cycles of real temperature.
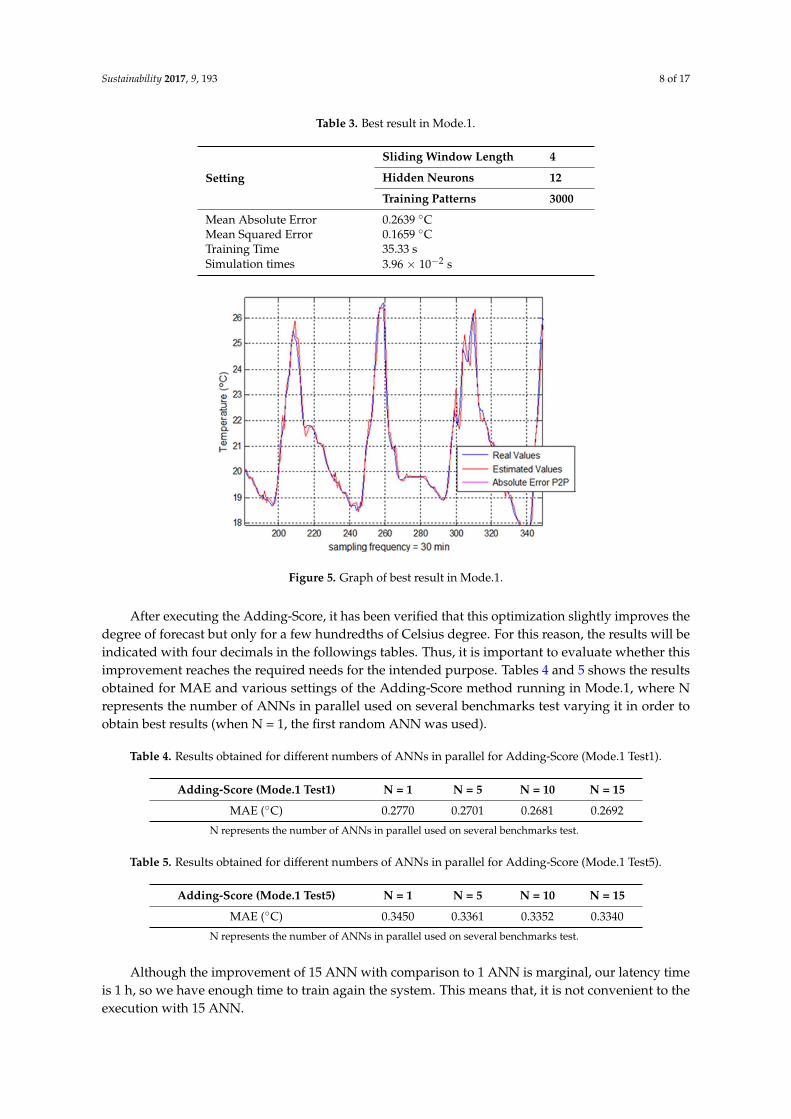
Sustainability 2017, 9, 193 8 of 17
Table 3. Best result in Mode.1.
Setting
Sliding Window Length 4
Hidden Neurons 12
Training Patterns 3000
Mean Absolute Error 0.2639 ◦CMean Squared Error 0.1659 ◦CTraining Time 35.33 sSimulation times 3.96 × 10⁻² s
Sustainability 2017, 9, 193 8 of 16
Table 3. Best result in Mode.1.
Setting
Sliding Window Length 4
Hidden Neurons 12
Training Patterns 3000
Mean Absolute Error 0.2639 °C
Mean Squared Error 0.1659 °C
Training Time 35.33 s
Simulation times 3.96 x 10⁻² s
Figure 5. Graph of best result in Mode.1.
Table 4. Results obtained for different numbers of ANNs in parallel for Adding-Score (Mode.1 Test1).
Adding-Score (Mode.1 Test1) N = 1 N = 5 N = 10 N = 15
MAE (°C) 0.2770 0.2701 0.2681 0.2692
N represents the number of ANNs in parallel used on several benchmarks test.
Table 5. Results obtained for different numbers of ANNs in parallel for Adding-Score (Mode.1 Test5).
Adding-Score (Mode.1 Test5) N = 1 N = 5 N = 10 N = 15
MAE (°C) 0.3450 0.3361 0.3352 0.3340
N represents the number of ANNs in parallel used on several benchmarks test.
Although the improvement of 15 ANN with comparison to 1 ANN is marginal, our latency time
is 1hour, so we have enough time to train again the system. This means that, it is not convenient to
the execution with 15 ANN.
3.2. Mode.2
For Mode.2, the overall simulation was established with the combination of the parameters
shown in Table 6.
Table 6. Used parameter values for the overall simulation in Mode.2.
Type of Mode Sliding Window Length Hidden Neurons Training Patterns
MODE.2 4, 6, 12, 24, 36, 48 8, 12, 16, 24, 32 1000, 3000, 4000, 5000
The best results for Mode.2 are shown in Table 7, where the MAE rate did not exceed the value
of 0.2294 °C for a dataset of 1000 simulated samples. Therefore, it is confirmed that the use of
combined input-stimulus improves the forecast reducing MAE by 15%, approximately, compared to
Mode.1. Paying attention to Figure 6, it can be equally noticed how generated estimates are also
Figure 5. Graph of best result in Mode.1.
After executing the Adding-Score, it has been verified that this optimization slightly improves thedegree of forecast but only for a few hundredths of Celsius degree. For this reason, the results will beindicated with four decimals in the followings tables. Thus, it is important to evaluate whether thisimprovement reaches the required needs for the intended purpose. Tables 4 and 5 shows the resultsobtained for MAE and various settings of the Adding-Score method running in Mode.1, where Nrepresents the number of ANNs in parallel used on several benchmarks test varying it in order toobtain best results (when N = 1, the first random ANN was used).
Table 4. Results obtained for different numbers of ANNs in parallel for Adding-Score (Mode.1 Test1).
Adding-Score (Mode.1 Test1) N = 1 N = 5 N = 10 N = 15
MAE (◦C) 0.2770 0.2701 0.2681 0.2692
N represents the number of ANNs in parallel used on several benchmarks test.
Table 5. Results obtained for different numbers of ANNs in parallel for Adding-Score (Mode.1 Test5).
Adding-Score (Mode.1 Test5) N = 1 N = 5 N = 10 N = 15
MAE (◦C) 0.3450 0.3361 0.3352 0.3340
N represents the number of ANNs in parallel used on several benchmarks test.
Although the improvement of 15 ANN with comparison to 1 ANN is marginal, our latency timeis 1 h, so we have enough time to train again the system. This means that, it is not convenient to theexecution with 15 ANN.
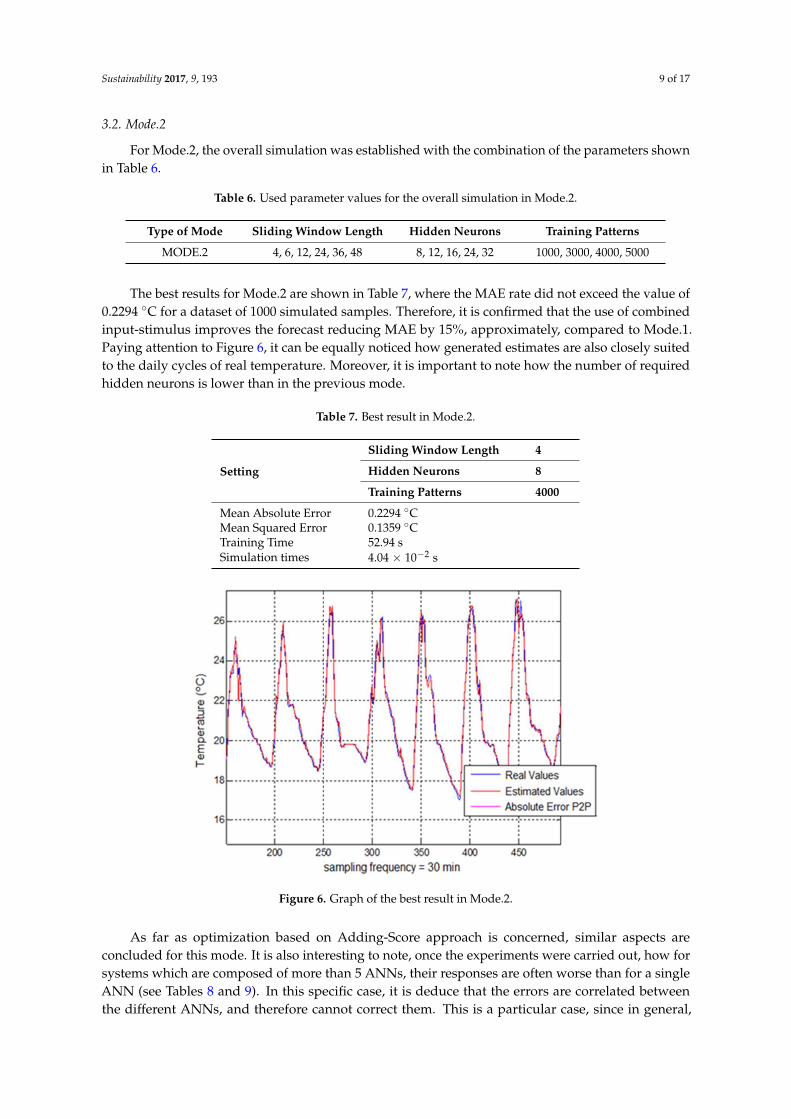
Sustainability 2017, 9, 193 9 of 17
3.2. Mode.2
For Mode.2, the overall simulation was established with the combination of the parameters shownin Table 6.
Table 6. Used parameter values for the overall simulation in Mode.2.
Type of Mode Sliding Window Length Hidden Neurons Training Patterns
MODE.2 4, 6, 12, 24, 36, 48 8, 12, 16, 24, 32 1000, 3000, 4000, 5000
The best results for Mode.2 are shown in Table 7, where the MAE rate did not exceed the value of0.2294 ◦C for a dataset of 1000 simulated samples. Therefore, it is confirmed that the use of combinedinput-stimulus improves the forecast reducing MAE by 15%, approximately, compared to Mode.1.Paying attention to Figure 6, it can be equally noticed how generated estimates are also closely suitedto the daily cycles of real temperature. Moreover, it is important to note how the number of requiredhidden neurons is lower than in the previous mode.
Table 7. Best result in Mode.2.
Setting
Sliding Window Length 4
Hidden Neurons 8
Training Patterns 4000
Mean Absolute Error 0.2294 ◦CMean Squared Error 0.1359 ◦CTraining Time 52.94 sSimulation times 4.04 × 10⁻² s
Sustainability 2017, 9, 193 9 of 16
closely suited to the daily cycles of real temperature. Moreover, it is important to note how the
number of required hidden neurons is lower than in the previous mode.
Table 7. Best result in Mode.2.
Setting
Sliding Window Length 4
Hidden Neurons 8
Training Patterns 4000
Mean Absolute Error 0.2294 °C
Mean Squared Error 0.1359 °C
Training Time 52.94 s
Simulation times 4.04 x 10⁻² s
Figure 6. Graph of the best result in Mode.2.
As far as optimization based on Adding-Score approach is concerned, similar aspects are
concluded for this mode. It is also interesting to note, once the experiments were carried out, how for
systems which are composed of more than 5 ANNs, their responses are often worse than for a single
ANN (see Tables 8 and 9). In this specific case, it is deduce that the errors are correlated between the
different ANNs, and therefore cannot correct them. This is a particular case, since in general, the
Score-Fusion tends to improve the result. In this case, although the initialization of the neural network
is random, it arrives at the same solution and therefore does not improve. Therefore, in case of
implementing this method it is advisable to use only architectures composed of a number of ANNs
between 3 and 5 to achieve favorable results, as seen in Tables 8 and 9.
Table 8. Results obtained for different numbers of ANNs in parallel for Adding-Score (Mode.2 Test1).
Adding-Score (Mode.2 Test1) N = 1 N = 5 N = 10 N = 15
MAE (°C) 0.2804 0.2754 0.2857 0.2832
N represents the number of ANNs in parallel used on several benchmarks test.
Table 9. Results obtained for different numbers of ANNs in parallel for Adding-Score (Mode.2 Test3).
Adding-Score (Mode.2 Test3) N = 1 N = 5 N = 10 N = 15
MAE (°C) 0.2956 0.2868 0.2878 0.2979
N represents the number of ANNs in parallel used on several benchmarks test.
Figure 6. Graph of the best result in Mode.2.
As far as optimization based on Adding-Score approach is concerned, similar aspects areconcluded for this mode. It is also interesting to note, once the experiments were carried out, how forsystems which are composed of more than 5 ANNs, their responses are often worse than for a singleANN (see Tables 8 and 9). In this specific case, it is deduce that the errors are correlated betweenthe different ANNs, and therefore cannot correct them. This is a particular case, since in general,
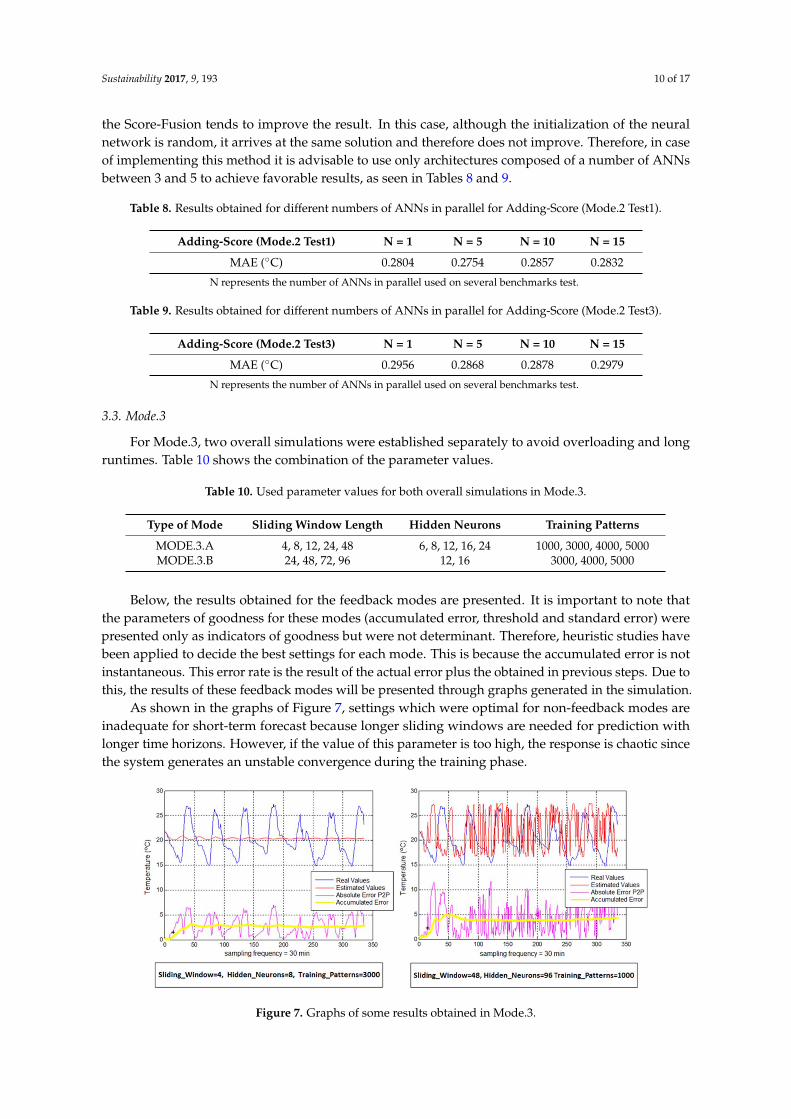
Sustainability 2017, 9, 193 10 of 17
the Score-Fusion tends to improve the result. In this case, although the initialization of the neuralnetwork is random, it arrives at the same solution and therefore does not improve. Therefore, in caseof implementing this method it is advisable to use only architectures composed of a number of ANNsbetween 3 and 5 to achieve favorable results, as seen in Tables 8 and 9.
Table 8. Results obtained for different numbers of ANNs in parallel for Adding-Score (Mode.2 Test1).
Adding-Score (Mode.2 Test1) N = 1 N = 5 N = 10 N = 15
MAE (◦C) 0.2804 0.2754 0.2857 0.2832
N represents the number of ANNs in parallel used on several benchmarks test.
Table 9. Results obtained for different numbers of ANNs in parallel for Adding-Score (Mode.2 Test3).
Adding-Score (Mode.2 Test3) N = 1 N = 5 N = 10 N = 15
MAE (◦C) 0.2956 0.2868 0.2878 0.2979
N represents the number of ANNs in parallel used on several benchmarks test.
3.3. Mode.3
For Mode.3, two overall simulations were established separately to avoid overloading and longruntimes. Table 10 shows the combination of the parameter values.
Table 10. Used parameter values for both overall simulations in Mode.3.
Type of Mode Sliding Window Length Hidden Neurons Training Patterns
MODE.3.A 4, 8, 12, 24, 48 6, 8, 12, 16, 24 1000, 3000, 4000, 5000MODE.3.B 24, 48, 72, 96 12, 16 3000, 4000, 5000
Below, the results obtained for the feedback modes are presented. It is important to note thatthe parameters of goodness for these modes (accumulated error, threshold and standard error) werepresented only as indicators of goodness but were not determinant. Therefore, heuristic studies havebeen applied to decide the best settings for each mode. This is because the accumulated error is notinstantaneous. This error rate is the result of the actual error plus the obtained in previous steps. Due tothis, the results of these feedback modes will be presented through graphs generated in the simulation.
As shown in the graphs of Figure 7, settings which were optimal for non-feedback modes areinadequate for short-term forecast because longer sliding windows are needed for prediction withlonger time horizons. However, if the value of this parameter is too high, the response is chaotic sincethe system generates an unstable convergence during the training phase.
Sustainability 2017, 9, 193 10 of 16
3.3. Mode.3
For Mode.3, two overall simulations were established separately to avoid overloading and long
runtimes. Table 10 shows the combination of the parameter values.
Table 10. Used parameter values for both overall simulations in Mode.3.
Type of Mode Sliding Window Length Hidden Neurons Training Patterns
MODE.3.A 4, 8, 12, 24, 48 6, 8, 12, 16, 24 1000, 3000, 4000, 5000
MODE.3.B 24, 48, 72, 96 12, 16 3000, 4000, 5000
Below, the results obtained for the feedback modes are presented. It is important to note that the
parameters of goodness for these modes (accumulated error, threshold and standard error) were
presented only as indicators of goodness but were not determinant. Therefore, heuristic studies have been
applied to decide the best settings for each mode. This is because the accumulated error is not
instantaneous. This error rate is the result of the actual error plus the obtained in previous steps. Due to
this, the results of these feedback modes will be presented through graphs generated in the simulation.
As shown in the graphs of Figure 7, settings which were optimal for non-feedback modes are
inadequate for short-term forecast because longer sliding windows are needed for prediction with
longer time horizons. However, if the value of this parameter is too high, the response is chaotic since
the system generates an unstable convergence during the training phase.
Figure 7. Graphs of some results obtained in Mode.3.
For Mode.3 it is important to know the prediction time in which the forecast is being established
due to the fact that, for a longer timeframe, the precision of the first samples will be lower than those
obtained for shorter ones. Finally, the best settings for this mode for a 24-hours-forecast are presented
in Table 11 and Figure 8.
Table 11. Best result in Mode.3.
Setting
Sliding Window Length 24
Hidden Neurons 12
Training Patterns 4000
Mean Absolute Error <1.50 °C
Mean Squared Error 5.00 < e < 5.40 °C
Training Time 397.92 s
Simulation times 33.74 s
Figure 7. Graphs of some results obtained in Mode.3.
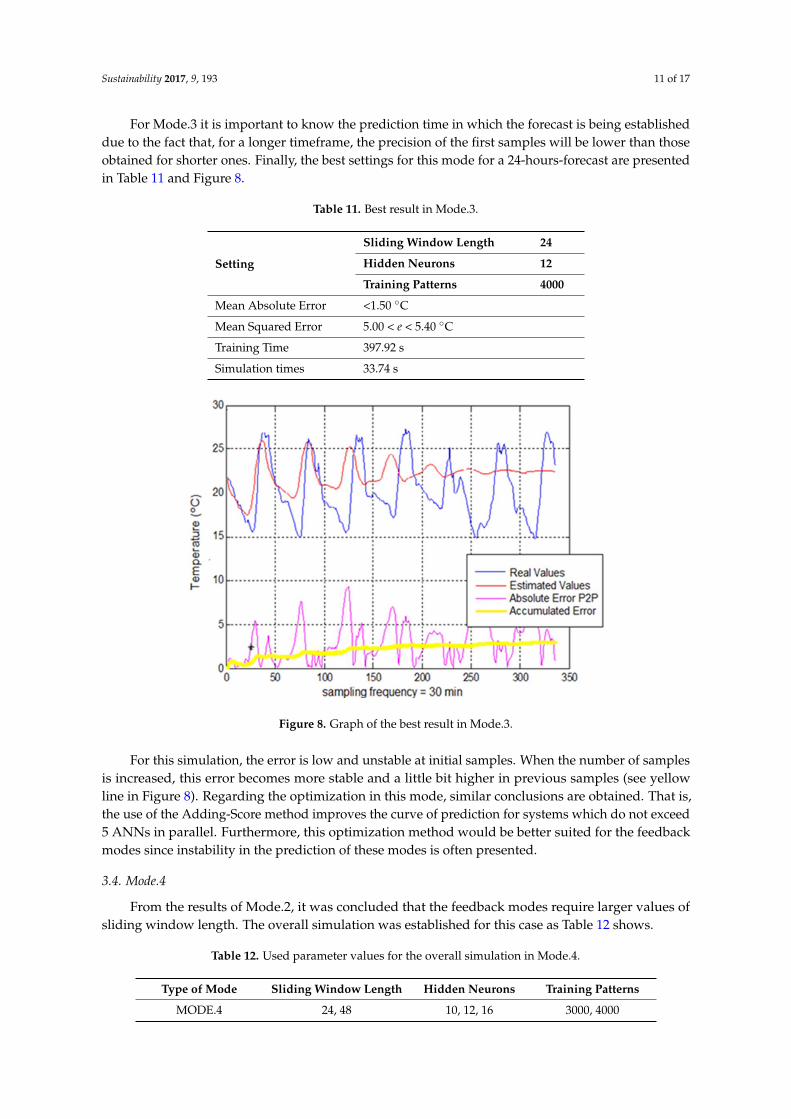
Sustainability 2017, 9, 193 11 of 17
For Mode.3 it is important to know the prediction time in which the forecast is being establisheddue to the fact that, for a longer timeframe, the precision of the first samples will be lower than thoseobtained for shorter ones. Finally, the best settings for this mode for a 24-hours-forecast are presentedin Table 11 and Figure 8.
Table 11. Best result in Mode.3.
Setting
Sliding Window Length 24
Hidden Neurons 12
Training Patterns 4000
Mean Absolute Error <1.50 ◦C
Mean Squared Error 5.00 < e < 5.40 ◦C
Training Time 397.92 s
Simulation times 33.74 sSustainability 2017, 9, 193 11 of 16
Figure 8. Graph of the best result in Mode.3.
For this simulation, the error is low and unstable at initial samples. When the number of samples
is increased, this error becomes more stable and a little bit higher in previous samples (see yellow line
in Figure 8). Regarding the optimization in this mode, similar conclusions are obtained. That is, the use of
the Adding-Score method improves the curve of prediction for systems which do not exceed 5 ANNs in
parallel. Furthermore, this optimization method would be better suited for the feedback modes since
instability in the prediction of these modes is often presented.
3.4. Mode.4
From the results of Mode.2, it was concluded that the feedback modes require larger values of
sliding window length. The overall simulation was established for this case as Table 12 shows.
Table 12. Used parameter values for the overall simulation in Mode.4.
Type of Mode Sliding Window Length Hidden Neurons Training Patterns
MODE.4 24, 48 10, 12, 16 3000, 4000
In non-feedback modes it was clearly demonstrated that the use of combined input-stimulus
improved the prediction. However, conversely, in order to stimulate with this criterion (Mode.4) a
prediction of each of the input individual elements is required. Thus, due to the error introduced by
each element separately and the error introduced by the whole prediction, the system offers chaotic
responses which produce a non-viable model. Figure 9 is an obvious example of this.
To resolve that problem, it is necessary to use in Mode.4 any element combined with
temperature which is not subjected to an inaccurate estimation. The solution can be finally found in
the sampling time parameter, whose evolution can be known precisely, thus obtaining Mode.4v2. In
addition, the use of this parameter facilitates the temperature estimates with further horizons time
with respect to Mode.3. Figure 10 is a clear example of this improvement, where in Mode.4v2 the
prediction reaches a longer-term, achieving a proper synchronization between real temperature
cycles and estimated temperature cycles. However, for short periods of estimation (approximately
the first 72 samples) Mode.3 gets a lower error rate. Thick lines of the lower part of Figure 10 represent
the accumulated error from each mode. Due to this fact, the previous Mode.3 is recommended, in
general terms, for predictions with a timeframe which is equal or less than twice the sliding window.
Figure 8. Graph of the best result in Mode.3.
For this simulation, the error is low and unstable at initial samples. When the number of samplesis increased, this error becomes more stable and a little bit higher in previous samples (see yellowline in Figure 8). Regarding the optimization in this mode, similar conclusions are obtained. That is,the use of the Adding-Score method improves the curve of prediction for systems which do not exceed5 ANNs in parallel. Furthermore, this optimization method would be better suited for the feedbackmodes since instability in the prediction of these modes is often presented.
3.4. Mode.4
From the results of Mode.2, it was concluded that the feedback modes require larger values ofsliding window length. The overall simulation was established for this case as Table 12 shows.
Table 12. Used parameter values for the overall simulation in Mode.4.
Type of Mode Sliding Window Length Hidden Neurons Training Patterns
MODE.4 24, 48 10, 12, 16 3000, 4000
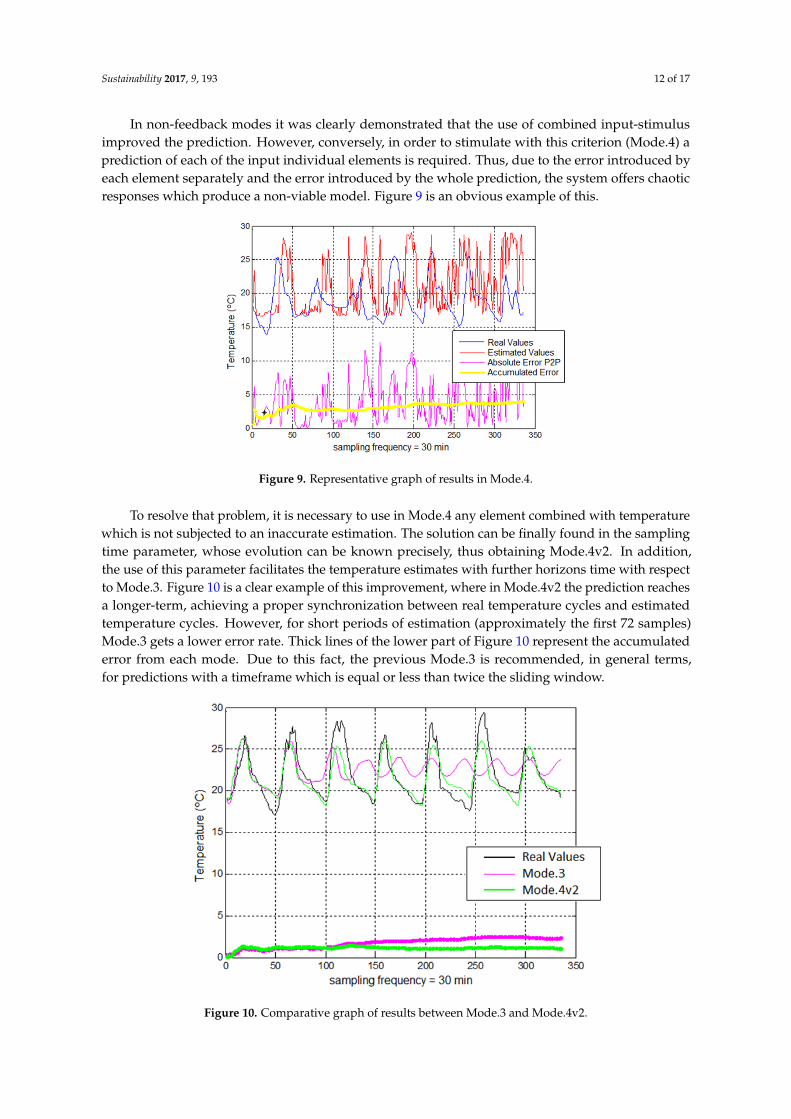
Sustainability 2017, 9, 193 12 of 17
In non-feedback modes it was clearly demonstrated that the use of combined input-stimulusimproved the prediction. However, conversely, in order to stimulate with this criterion (Mode.4) aprediction of each of the input individual elements is required. Thus, due to the error introduced byeach element separately and the error introduced by the whole prediction, the system offers chaoticresponses which produce a non-viable model. Figure 9 is an obvious example of this.Sustainability 2017, 9, 193 12 of 16
Figure 9. Representative graph of results in Mode.4.
Figure 10. Comparative graph of results between Mode.3 and Mode.4v2.
3.5. Wilcoxon Signed Rank Test
In order to observe the statistical significance of the results comparison a Wilcoxon signed rank
test [28,29] for the modes used in the present work has been applied and presented in Table 13. In the
experiments, p-value is obtained with first 48 samples in all cases. After Inspection of Table 13 we
can observe the good performance in Modes 1 and 2.
Table 13. Wilcoxon signed rank test for the modes used in the present work.
Type of
Mode
Sliding
Window
Hidden
Neurons
Training
Patterns
Sample Size for
Wilcoxon Signed Rank
Test
p-Value
MODE.1 4 12 3000 48 0.15
MODE.2 4 8 4000 48 0.16
MODE.3 4 8 3000 48 2.86 × 10⁻⁷
MODE.3 48 96 1000 48 2.53 × 10⁻⁵
MODE.3 24 12 4000 48 0.07
MODE.4 48 16 3000 48 0.0027
Figure 9. Representative graph of results in Mode.4.
To resolve that problem, it is necessary to use in Mode.4 any element combined with temperaturewhich is not subjected to an inaccurate estimation. The solution can be finally found in the samplingtime parameter, whose evolution can be known precisely, thus obtaining Mode.4v2. In addition,the use of this parameter facilitates the temperature estimates with further horizons time with respectto Mode.3. Figure 10 is a clear example of this improvement, where in Mode.4v2 the prediction reachesa longer-term, achieving a proper synchronization between real temperature cycles and estimatedtemperature cycles. However, for short periods of estimation (approximately the first 72 samples)Mode.3 gets a lower error rate. Thick lines of the lower part of Figure 10 represent the accumulatederror from each mode. Due to this fact, the previous Mode.3 is recommended, in general terms,for predictions with a timeframe which is equal or less than twice the sliding window.
Sustainability 2017, 9, 193 12 of 16
Figure 9. Representative graph of results in Mode.4.
Figure 10. Comparative graph of results between Mode.3 and Mode.4v2.
3.5. Wilcoxon Signed Rank Test
In order to observe the statistical significance of the results comparison a Wilcoxon signed rank
test [28,29] for the modes used in the present work has been applied and presented in Table 13. In the
experiments, p-value is obtained with first 48 samples in all cases. After Inspection of Table 13 we
can observe the good performance in Modes 1 and 2.
Table 13. Wilcoxon signed rank test for the modes used in the present work.
Type of
Mode
Sliding
Window
Hidden
Neurons
Training
Patterns
Sample Size for
Wilcoxon Signed Rank
Test
p-Value
MODE.1 4 12 3000 48 0.15
MODE.2 4 8 4000 48 0.16
MODE.3 4 8 3000 48 2.86 × 10⁻⁷
MODE.3 48 96 1000 48 2.53 × 10⁻⁵
MODE.3 24 12 4000 48 0.07
MODE.4 48 16 3000 48 0.0027
Figure 10. Comparative graph of results between Mode.3 and Mode.4v2.
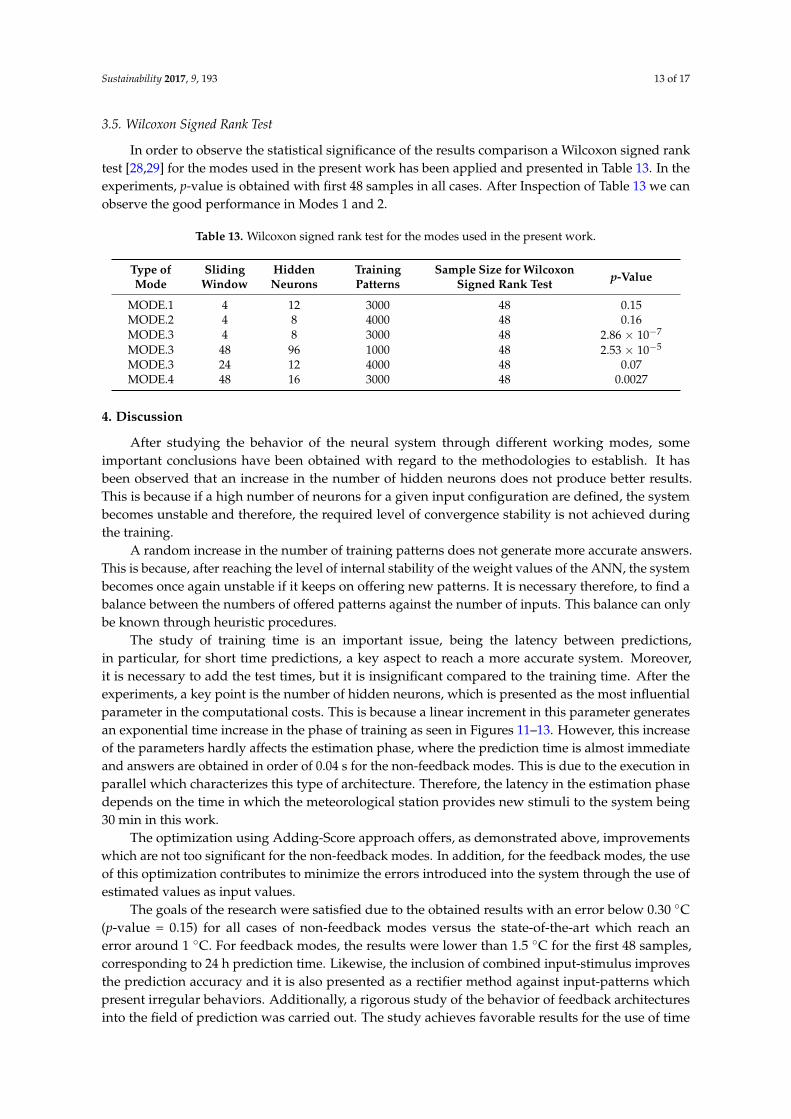
Sustainability 2017, 9, 193 13 of 17
3.5. Wilcoxon Signed Rank Test
In order to observe the statistical significance of the results comparison a Wilcoxon signed ranktest [28,29] for the modes used in the present work has been applied and presented in Table 13. In theexperiments, p-value is obtained with first 48 samples in all cases. After Inspection of Table 13 we canobserve the good performance in Modes 1 and 2.
Table 13. Wilcoxon signed rank test for the modes used in the present work.
Type ofMode
SlidingWindow
HiddenNeurons
TrainingPatterns
Sample Size for WilcoxonSigned Rank Test p-Value
MODE.1 4 12 3000 48 0.15MODE.2 4 8 4000 48 0.16MODE.3 4 8 3000 48 2.86 × 10⁻⁷
MODE.3 48 96 1000 48 2.53 × 10⁻⁵
MODE.3 24 12 4000 48 0.07MODE.4 48 16 3000 48 0.0027
4. Discussion
After studying the behavior of the neural system through different working modes, someimportant conclusions have been obtained with regard to the methodologies to establish. It hasbeen observed that an increase in the number of hidden neurons does not produce better results.This is because if a high number of neurons for a given input configuration are defined, the systembecomes unstable and therefore, the required level of convergence stability is not achieved duringthe training.
A random increase in the number of training patterns does not generate more accurate answers.This is because, after reaching the level of internal stability of the weight values of the ANN, the systembecomes once again unstable if it keeps on offering new patterns. It is necessary therefore, to find abalance between the numbers of offered patterns against the number of inputs. This balance can onlybe known through heuristic procedures.
The study of training time is an important issue, being the latency between predictions,in particular, for short time predictions, a key aspect to reach a more accurate system. Moreover,it is necessary to add the test times, but it is insignificant compared to the training time. After theexperiments, a key point is the number of hidden neurons, which is presented as the most influentialparameter in the computational costs. This is because a linear increment in this parameter generatesan exponential time increase in the phase of training as seen in Figures 11–13. However, this increaseof the parameters hardly affects the estimation phase, where the prediction time is almost immediateand answers are obtained in order of 0.04 s for the non-feedback modes. This is due to the execution inparallel which characterizes this type of architecture. Therefore, the latency in the estimation phasedepends on the time in which the meteorological station provides new stimuli to the system being30 min in this work.
The optimization using Adding-Score approach offers, as demonstrated above, improvementswhich are not too significant for the non-feedback modes. In addition, for the feedback modes, the useof this optimization contributes to minimize the errors introduced into the system through the use ofestimated values as input values.
The goals of the research were satisfied due to the obtained results with an error below 0.30 ◦C(p-value = 0.15) for all cases of non-feedback modes versus the state-of-the-art which reach anerror around 1 ◦C. For feedback modes, the results were lower than 1.5 ◦C for the first 48 samples,corresponding to 24 h prediction time. Likewise, the inclusion of combined input-stimulus improvesthe prediction accuracy and it is also presented as a rectifier method against input-patterns whichpresent irregular behaviors. Additionally, a rigorous study of the behavior of feedback architecturesinto the field of prediction was carried out. The study achieves favorable results for the use of time
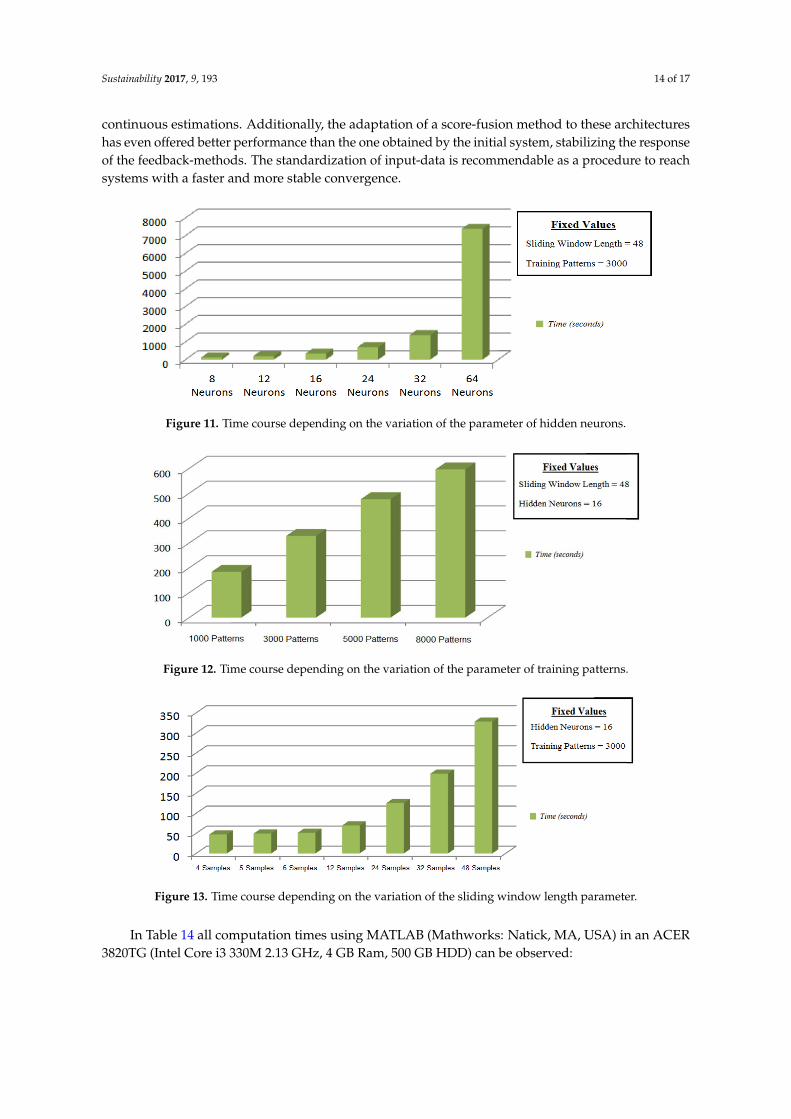
Sustainability 2017, 9, 193 14 of 17
continuous estimations. Additionally, the adaptation of a score-fusion method to these architectureshas even offered better performance than the one obtained by the initial system, stabilizing the responseof the feedback-methods. The standardization of input-data is recommendable as a procedure to reachsystems with a faster and more stable convergence.
Sustainability 2017, 9, 193 13 of 16
4. Discussion
After studying the behavior of the neural system through different working modes, some
important conclusions have been obtained with regard to the methodologies to establish. It has been
observed that an increase in the number of hidden neurons does not produce better results. This is
because if a high number of neurons for a given input configuration are defined, the system becomes
unstable and therefore, the required level of convergence stability is not achieved during the training.
A random increase in the number of training patterns does not generate more accurate answers.
This is because, after reaching the level of internal stability of the weight values of the ANN, the
system becomes once again unstable if it keeps on offering new patterns. It is necessary therefore, to
find a balance between the numbers of offered patterns against the number of inputs. This balance
can only be known through heuristic procedures.
The study of training time is an important issue, being the latency between predictions, in
particular, for short time predictions, a key aspect to reach a more accurate system. Moreover, it is
necessary to add the test times, but it is insignificant compared to the training time. After the
experiments, a key point is the number of hidden neurons, which is presented as the most influential
parameter in the computational costs. This is because a linear increment in this parameter generates
an exponential time increase in the phase of training as seen in Figures 11–13. However, this increase
of the parameters hardly affects the estimation phase, where the prediction time is almost immediate
and answers are obtained in order of 0.04 s for the non-feedback modes. This is due to the execution
in parallel which characterizes this type of architecture. Therefore, the latency in the estimation phase
depends on the time in which the meteorological station provides new stimuli to the system being 30
minutes in this work.
Figure 11. Time course depending on the variation of the parameter of hidden neurons.
Figure 12. Time course depending on the variation of the parameter of training patterns.
Figure 11. Time course depending on the variation of the parameter of hidden neurons.
Sustainability 2017, 9, 193 13 of 16
4. Discussion
After studying the behavior of the neural system through different working modes, some
important conclusions have been obtained with regard to the methodologies to establish. It has been
observed that an increase in the number of hidden neurons does not produce better results. This is
because if a high number of neurons for a given input configuration are defined, the system becomes
unstable and therefore, the required level of convergence stability is not achieved during the training.
A random increase in the number of training patterns does not generate more accurate answers.
This is because, after reaching the level of internal stability of the weight values of the ANN, the
system becomes once again unstable if it keeps on offering new patterns. It is necessary therefore, to
find a balance between the numbers of offered patterns against the number of inputs. This balance
can only be known through heuristic procedures.
The study of training time is an important issue, being the latency between predictions, in
particular, for short time predictions, a key aspect to reach a more accurate system. Moreover, it is
necessary to add the test times, but it is insignificant compared to the training time. After the
experiments, a key point is the number of hidden neurons, which is presented as the most influential
parameter in the computational costs. This is because a linear increment in this parameter generates
an exponential time increase in the phase of training as seen in Figures 11–13. However, this increase
of the parameters hardly affects the estimation phase, where the prediction time is almost immediate
and answers are obtained in order of 0.04 s for the non-feedback modes. This is due to the execution
in parallel which characterizes this type of architecture. Therefore, the latency in the estimation phase
depends on the time in which the meteorological station provides new stimuli to the system being 30
minutes in this work.
Figure 11. Time course depending on the variation of the parameter of hidden neurons.
Figure 12. Time course depending on the variation of the parameter of training patterns. Figure 12. Time course depending on the variation of the parameter of training patterns.Sustainability 2017, 9, 193 14 of 16
Figure 13. Time course depending on the variation of the sliding window length parameter.
The optimization using Adding-Score approach offers, as demonstrated above, improvements
which are not too significant for the non-feedback modes. In addition, for the feedback modes, the
use of this optimization contributes to minimize the errors introduced into the system through the
use of estimated values as input values.
The goals of the research were satisfied due to the obtained results with an error below 0.30 °C
(p-value = 0.15) for all cases of non-feedback modes versus the state-of-the-art which reach an error
around 1 °C. For feedback modes, the results were lower than 1.5 °C for the first 48 samples,
corresponding to 24 h prediction time. Likewise, the inclusion of combined input-stimulus improves
the prediction accuracy and it is also presented as a rectifier method against input-patterns which
present irregular behaviors. Additionally, a rigorous study of the behavior of feedback architectures
into the field of prediction was carried out. The study achieves favorable results for the use of time
continuous estimations. Additionally, the adaptation of a score-fusion method to these architectures
has even offered better performance than the one obtained by the initial system, stabilizing the
response of the feedback-methods. The standardization of input-data is recommendable as a
procedure to reach systems with a faster and more stable convergence.
In Table 14 all computation times using MATLAB (Mathworks: Natick, MA, USA) in an ACER
3820TG (Intel Core i3 330M 2.13 GHz, 4 GB Ram, 500 GB HDD) can be observed:
Table 14. Computational times for each mode.
Type of Mode Training Time Testing Time Per Sample (for 1000 Samples)
MODE.1 35.33 s 3.96 x 10⁻² s
MODE.2 52.94 s 4.04 x 10⁻² s
MODE.3 397.92 s 33.74 s
MODE.4 363.19 s 21.76 s
It is observed as Modes without feedback are faster than Modes with feedback with the
independence of the prediction for a short or large time. The difference is up to 10 times faster for
training phase and 100 times for testing phase. From an absolute value point of view, the training
times are shorter and the testing time can be considered as in real time. The accuracy for predicting
on short time has a difference of 0.1 °C between Mode.1 and Mode.2, therefore, the feedback of
Mode.2 gives a better accuracy, but a little high computational time than Mode.1 and the use of the
optimal accuracy can be justified for this proposal.
As shown in Table 15, our research, using Score Fusion on ANN, improves the results obtained
by previous researches using ANN except for one. In addition, compared to dataset obtained from
the same meteorological stations, Score Fusion reduce error obtained by 50%, demonstrating the
goodness of the method. Respect to other researches, Score Fusion on ANN reduces the error to
magnitudes of tenths.
Figure 13. Time course depending on the variation of the sliding window length parameter.
In Table 14 all computation times using MATLAB (Mathworks: Natick, MA, USA) in an ACER3820TG (Intel Core i3 330M 2.13 GHz, 4 GB Ram, 500 GB HDD) can be observed:
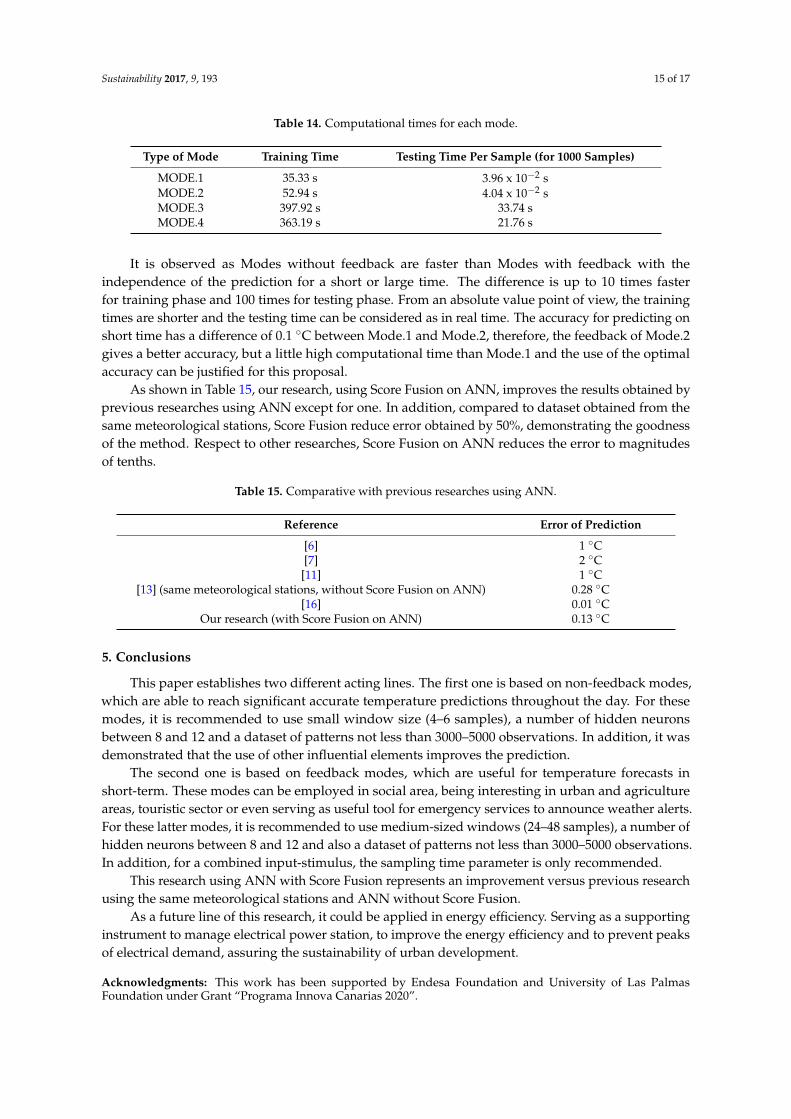
Sustainability 2017, 9, 193 15 of 17
Table 14. Computational times for each mode.
Type of Mode Training Time Testing Time Per Sample (for 1000 Samples)
MODE.1 35.33 s 3.96 x 10⁻² sMODE.2 52.94 s 4.04 x 10⁻² sMODE.3 397.92 s 33.74 sMODE.4 363.19 s 21.76 s
It is observed as Modes without feedback are faster than Modes with feedback with theindependence of the prediction for a short or large time. The difference is up to 10 times fasterfor training phase and 100 times for testing phase. From an absolute value point of view, the trainingtimes are shorter and the testing time can be considered as in real time. The accuracy for predicting onshort time has a difference of 0.1 ◦C between Mode.1 and Mode.2, therefore, the feedback of Mode.2gives a better accuracy, but a little high computational time than Mode.1 and the use of the optimalaccuracy can be justified for this proposal.
As shown in Table 15, our research, using Score Fusion on ANN, improves the results obtained byprevious researches using ANN except for one. In addition, compared to dataset obtained from thesame meteorological stations, Score Fusion reduce error obtained by 50%, demonstrating the goodnessof the method. Respect to other researches, Score Fusion on ANN reduces the error to magnitudesof tenths.
Table 15. Comparative with previous researches using ANN.
Reference Error of Prediction
[6] 1 ◦C[7] 2 ◦C[11] 1 ◦C
[13] (same meteorological stations, without Score Fusion on ANN) 0.28 ◦C[16] 0.01 ◦C
Our research (with Score Fusion on ANN) 0.13 ◦C
5. Conclusions
This paper establishes two different acting lines. The first one is based on non-feedback modes,which are able to reach significant accurate temperature predictions throughout the day. For thesemodes, it is recommended to use small window size (4–6 samples), a number of hidden neuronsbetween 8 and 12 and a dataset of patterns not less than 3000–5000 observations. In addition, it wasdemonstrated that the use of other influential elements improves the prediction.
The second one is based on feedback modes, which are useful for temperature forecasts inshort-term. These modes can be employed in social area, being interesting in urban and agricultureareas, touristic sector or even serving as useful tool for emergency services to announce weather alerts.For these latter modes, it is recommended to use medium-sized windows (24–48 samples), a number ofhidden neurons between 8 and 12 and also a dataset of patterns not less than 3000–5000 observations.In addition, for a combined input-stimulus, the sampling time parameter is only recommended.
This research using ANN with Score Fusion represents an improvement versus previous researchusing the same meteorological stations and ANN without Score Fusion.
As a future line of this research, it could be applied in energy efficiency. Serving as a supportinginstrument to manage electrical power station, to improve the energy efficiency and to prevent peaksof electrical demand, assuring the sustainability of urban development.
Acknowledgments: This work has been supported by Endesa Foundation and University of Las PalmasFoundation under Grant “Programa Innova Canarias 2020”.

Sustainability 2017, 9, 193 16 of 17
Author Contributions: José Gustavo Hernández-Travieso and Carlos M. Travieso-González conceived and designedthe experiments; José Gustavo Hernández-Travieso, Antonio L. Herrera-Jiménez and Antonio G. Ravelo-Garcíaperformed the experiments; José Gustavo Hernández-Travieso, Antonio L. Herrera-Jiménez, Carlos M.Travieso-González, Fernando Morgado-Dias and Jesús B. Alonso Hernández analyzed the data; José GustavoHernández-Travieso wrote the paper.
Conflicts of Interest: The authors declare no conflict of interest. The founding sponsors had no role in the designof the study; in the collection, analyses, or interpretation of data; in the writing of the manuscript, and in thedecision to publish the results.
References
1. Ramyaa, R. Frost Prediction Using Artificial Neural Networks. Master’s Thesis, University of Georgia,Athens, Georgia, 2004.
2. Lezaun, M. Predicciones del Tiempo y Matemáticas. Available online: https://dialnet.unirioja.es/servlet/articulo?codigo=2440344 (accessed on 26 November 2016).
3. Taylor, J.W.; Buizza, R. Neural network load forecasting with weather ensemble predictions. IEEE Trans.Power Syst. 2002, 17, 626–632. [CrossRef]
4. Zhang, G.P. Time series forecasting using a hybrid ARIMA and neuronal network model. Neurocomputing2003, 50, 159–175. [CrossRef]
5. Sorjamaa, A.; Hao, J.; Reyhani, N.; Ji, Y.; Lendasse, A. Methodology for long-term prediction of time series.Neurocomputing 2007, 70, 2861–2869. [CrossRef]
6. Ellouz, I.K.; Ben-Jmaa-Derbel, H.; Kanoun, O. Temperature Prediction of Soil-Pipe-Air Heat Exchanger UsingNeural Networks. In Proceedings of the 6th International Multi-Conference on Systems, Signals and Devices,Djerba, Tunisia, 23–26 March 2009.
7. Fan, S.; Methaprayoon, K.; Lee, W.J. Multi-region Load Forecasting Considering Alternative MeteorologicalPredictions. In Proceedings of the IEEE Power and Energy Society General Meeting, Minneapolis, MN, USA,25–29 July 2010.
8. Rastogi, A.; Srivastava, A.; Srivastava, V.K.; Pandey, A.K. Pattern Analysis Approach for Prediction UsingWavelet Neural Networks. In Proceedings of the IEEE 7th International Conference on Natural Computation(ICNC), Donghua University, Shanghai, China, 26–28 July 2011.
9. Chen, X.; Xu, A. Temperature and Humidity of Air in Mine Roadways Prediction Based on BP NeuralNetwork. In Proceedings of the International Conference on Multimedia Technology (ICMT), Hangzhou,China, 26–28 July 2011.
10. Routh, T.K.; Bin Yousuf, A.H.; Hossain, M.N.; Asasduzzaman, M.M.; Hossain, M.I.; Husnaeen, U.;Mubarak, M. Artificial Neural Network Based Temperature Prediction and Its Impact on Solar Cell.In Proceedings of the 2012 International Conference on Informatics, Electronics & Vision (ICIEV), TBD Dhaka,Bangladesh, 18–19 May 2012.
11. Huang, H.; Chen, L.; Mohammadzaheri, M.; Hu, E.; Chen, M. Multi-Zone Temperature Prediction in aCommercial Building Using Artificial Neural Network Model. In Proceedings of the 10th IEEE InternationalConference on Control and Automation (ICCA), Hangzhou, China, 12–14 June 2013.
12. Taieb, S.B.; Bontempi, G.; Atiya, A.F.; Sorjamaa, A. A review and comparison of strategies for multi-stepahead time series forecasting based on the NN5 forecasting competition. Expert Syst. Appl. 2012, 39,7067–7083.
13. Vasquez, J.L.; Travieso, C.M.; Perez, T.S.; Alonso, J.B.; Briceno, J.C. Temperature Prediction Based on DifferentMeteorological Series. In Proceedings of the 2012 Third Global Congress on Intelligent Systems (GCIS),Wuhan, China, 6–8 November 2012.
14. Xiong, T.; Bao, Y.; Hu, Z. Beyond one-step-ahead forecasting: Evaluation of alternative multi-step-aheadforecasting models for crude oil prices. Energy Econ. 2013, 40, 405–415. [CrossRef]
15. Hernández-Travieso, J.G.; Travieso, C.M.; Alonso, J.B. Wind Speed Modelling for the Estimation of theWind Energy Generation. In Proceedings of the IEEE-2014 International Work Conference on Bio-inspiredIntelligence (IWOBI), Liberia, Costa Rica, 16–18 July 2014.
16. Bao, Y.; Xiong, T.; Hu, Z. PSO-MISMO Modeling Strategy for MultiStep-Ahead Time Series Prediction.Trans. IEEE Cybern. 2014, 44, 655–668.

Sustainability 2017, 9, 193 17 of 17
17. Li, X.F.; Qin, L.L.; Ma, G.Q.; Wu, G. Modeling Greenhouse Temperature by Means of PLSR and BPNN.In Proceedings of the 35th Chinese Control Conference (CCC), Chengdu, China, 27–29 July 2016.
18. McKinney, R.; Pallipuram, V.K.; Vargas, R.; Taufer, M. From HPC Performance to Climate Modeling:Transforming Methods for HPC Predictions into Models of Extreme Climate Conditions. In Proceedings ofthe 2015 IEEE 11th International Conference on e-Science, Munich, Germany, 31 August–4 September 2015.
19. Prashanthi, B.; Meganathan, S.; Krishnan, R.B.; Varahasamy, R.; Swaminathan, S. Data Mining as a Toolfor Hot Day Prediction during Summer Monsoon. In Proceedings of the 2016 International Conference onCircuit, Power and Computing Technologies (ICCPCT), Nagercoil, India, 18–19 March 2016.
20. Aral, M.M.; Guan, J. Global Sea Surface Temperature and Sea Level Rise Estimation with Optimal HistoricalTime Lag Data. Water 2016, 8, 519. [CrossRef]
21. Arora, K.; Dash, P. Towards dependence of tropical cyclone intensity on sea surface temperature and itsresponse in a warming world. Climate 2016, 4, 30. [CrossRef]
22. Prudenzi, A.; Caciotta, M.; Orsolini, C.V. The Influence of Meteorological Parameters on Italian ElectricHourly Load: The Selection of Variables of the ANN Training Set for Short Term Load Forecasting.In Proceedings of the 8th Mediterranean Electrotechnical Conference on Industrial Applications in PowerSystems, Computer Science and Telecommunications, Bari, Italy, 13–16 May 1996.
23. Devi, C.J.; Reddy, P.B.S.; Kumar, K.V.; Reddy, B.M.; Nayak, R.N. ANN Aproach for weather prediccion usingBackpropagation. Int. J. Eng. Trends Technol. 2012, 3, 19–23.
24. Serrano, A.; Soria, E.; Martín, J. Redes Neuronales Artificiales; Universidad de Valencia (Escuela TécnicaSuperior Ingeniería, Departamento de Ingeniería Electrónica): Valencia, España, 2009.
25. Gil, O.A.; Olcina, C.J. Climatología General; Editorial Ariel: Barcelona, Spain, 1997; pp. 110–111, 114, 116.26. Vide, M. Fundamentos de la Climatología Analítica; Editorial Síntesis SA: Madrid, Spain, 1991; pp. 62, 83, 87–88.27. Ross, A.; Nandakumar, K. Fusion, Score-Level. In Encyclopedia of Biometrics; Springer: New York, NY, USA,
2009; pp. 611–616.28. Hamill, T.M. Hypothesis tests for evaluating numerical precipitation forecasts. Weather Forecast. 1999, 14,
155–167. [CrossRef]29. Wilcoxon, F. Individual comparisons by ranking methods. Biom. Bull. 1945, 1, 80–83. [CrossRef]
© 2017 by the authors; licensee MDPI, Basel, Switzerland. This article is an open accessarticle distributed under the terms and conditions of the Creative Commons Attribution(CC BY) license (http://creativecommons.org/licenses/by/4.0/).

MODELOS DE PREDICCIÓN METEOROLÓGICA BASADOS EN MÉTODOS DE CLASIFICACIÓN ORIENTADOS A LA
MEJORA DE LA EFICIENCIA ENERGÉTICA EN LOS PROCESOS DE GENERACIÓN.
TESIS DOCTORAL JOSÉ GUSTAVO HERNÁNDEZ TRAVIESO
108

MODELOS DE PREDICCIÓN METEOROLÓGICA BASADOS EN MÉTODOS DE CLASIFICACIÓN ORIENTADOS A LA
MEJORA DE LA EFICIENCIA ENERGÉTICA EN LOS PROCESOS DE GENERACIÓN.
TESIS DOCTORAL JOSÉ GUSTAVO HERNÁNDEZ TRAVIESO
109
Discusión
Una vez presentados los trabajos publicados es posible decir que a la vista de los
resultados obtenidos la hipótesis planteada inicialmente ha quedado validada y
demostrada. Para recordar su contenido se reproduce seguidamente dando cumplida
respuesta a su validación:
“La obtención de predicciones meteorológicas que permitan caracterizar la
variabilidad climática, reduciendo al mínimo el error existente entre la predicción y la
medida real, proporciona a los procesos de generación energética un potencial que
permite la mejora en la eficiencia de los procesos de generación y previsión energética
mediante velocidad del viento y radiación solar.”
En los 3 artículos presentados en esta Tesis Doctoral por Compendio de
Publicaciones, se han obtenido predicciones meteorológicas con errores muy bajos que
permiten caracterizar la variabilidad climática de las zonas en estudio.
Dichas zonas de estudio han sido diferentes y en todas y cada una de ellas el
modelo predictivo ha sido igualmente eficaz obteniendo unos errores muy bajos.
Se ha demostrado la posibilidad de incorporar los datos de predicción obtenidos
a los datos técnicos de un modelo de aerogenerador para poder obtener la cantidad de
energía eólica a obtener con los resultados de la predicción de velocidad del viento
realizada.
En base a los experimentos realizados en los artículos, se comprueba que para
caracterizar climáticamente una zona en cuanto a la predicción de un fenómeno
meteorológico concreto, algunos fenómenos no tienen un aporte de información
significativo.
Como muestra de la mejora que presenta el modelo predictivo desarrollado en
esta Tesis Doctoral, se muestran las siguientes tablas comparativas donde se muestran
los resultados obtenidos en las predicciones publicadas presentadas en este Compendio
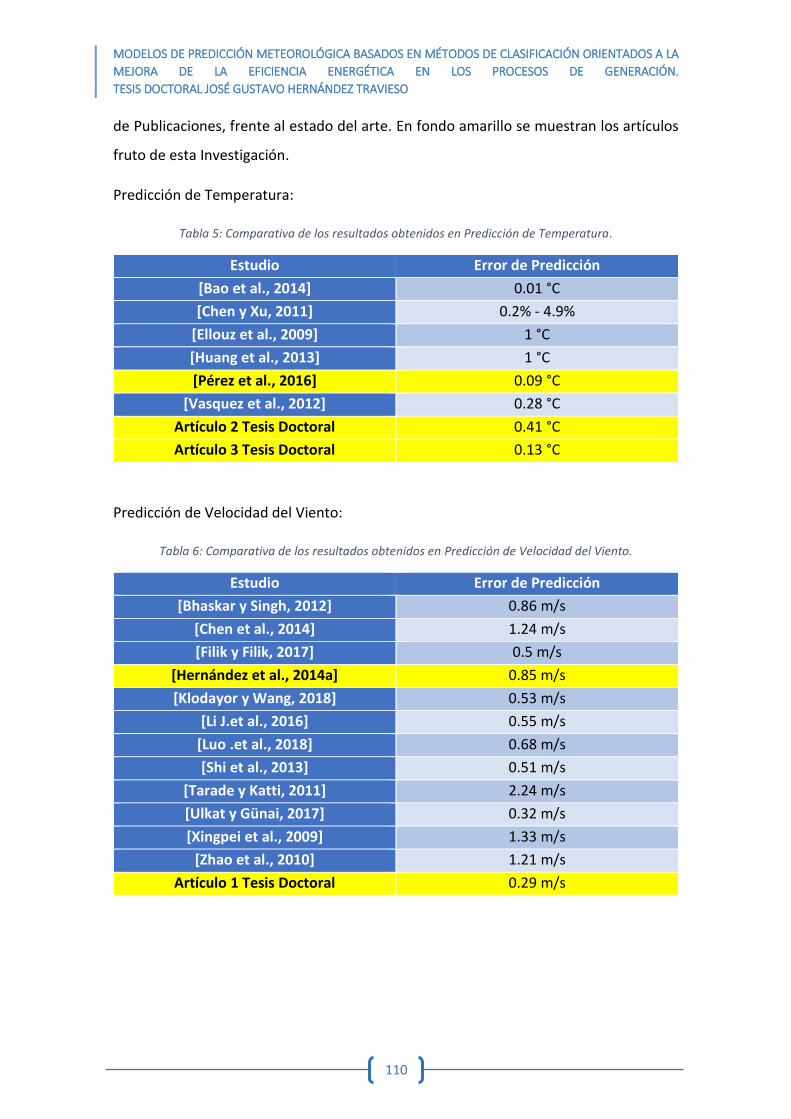
MODELOS DE PREDICCIÓN METEOROLÓGICA BASADOS EN MÉTODOS DE CLASIFICACIÓN ORIENTADOS A LA
MEJORA DE LA EFICIENCIA ENERGÉTICA EN LOS PROCESOS DE GENERACIÓN.
TESIS DOCTORAL JOSÉ GUSTAVO HERNÁNDEZ TRAVIESO
110
de Publicaciones, frente al estado del arte. En fondo amarillo se muestran los artículos
fruto de esta Investigación.
Predicción de Temperatura:
Tabla 5: Comparativa de los resultados obtenidos en Predicción de Temperatura.
Estudio Error de Predicción
[Bao et al., 2014] 0.01 °C
[Chen y Xu, 2011] 0.2% - 4.9%
[Ellouz et al., 2009] 1 °C
[Huang et al., 2013] 1 °C
[Pérez et al., 2016] 0.09 °C
[Vasquez et al., 2012] 0.28 °C
Artículo 2 Tesis Doctoral 0.41 °C
Artículo 3 Tesis Doctoral 0.13 °C
Predicción de Velocidad del Viento:
Tabla 6: Comparativa de los resultados obtenidos en Predicción de Velocidad del Viento.
Estudio Error de Predicción
[Bhaskar y Singh, 2012] 0.86 m/s
[Chen et al., 2014] 1.24 m/s
[Filik y Filik, 2017] 0.5 m/s
[Hernández et al., 2014a] 0.85 m/s
[Klodayor y Wang, 2018] 0.53 m/s
[Li J.et al., 2016] 0.55 m/s
[Luo .et al., 2018] 0.68 m/s
[Shi et al., 2013] 0.51 m/s
[Tarade y Katti, 2011] 2.24 m/s
[Ulkat y Günai, 2017] 0.32 m/s
[Xingpei et al., 2009] 1.33 m/s
[Zhao et al., 2010] 1.21 m/s
Artículo 1 Tesis Doctoral 0.29 m/s

MODELOS DE PREDICCIÓN METEOROLÓGICA BASADOS EN MÉTODOS DE CLASIFICACIÓN ORIENTADOS A LA
MEJORA DE LA EFICIENCIA ENERGÉTICA EN LOS PROCESOS DE GENERACIÓN.
TESIS DOCTORAL JOSÉ GUSTAVO HERNÁNDEZ TRAVIESO
111
Predicción de Radiación Solar:
Tabla 7: Comparativa de los resultados obtenidos en Predicción de Radiación Solar
Estudio Error de Predicción
[Zhang y Qiao, 2011] 0.051 kWh/m2
[Demirtas et al., 2012] 1.69 kWh/m2
[Kaiju et al., 2013] 8 %
[Yang et al., 2013] 0.308 kWh/m2
[Hernández et al., 2014b] 0.04 kWh/m2
[Gairaa et al., 2015] 23.89%
[Hernández et al., 2015] 0.06 kWh/m2
[Koyasu et al., 2016] 5.04 kWh/m2
[Baptista et al., 2016] 0.007 %
En base a lo anteriormente expuesto, puede decirse que:
1. Se ha logrado realizar un modelo predictivo a nivel microscópico,
diferente al macroscópico actual, que ha demostrado fiabilidad y
robustez en las publicaciones anteriormente presentadas.
Tal y como queda comprobado en base a los resultados presentados en
los mismos.
2. Se demostrado la aplicabilidad del método independientemente del lugar
geográfico en el que se desee realizar el estudio. El modelo, una vez
entrenado es fácilmente y rápidamente escalable a otra ubicación
geográfica independiente de la anterior. Fruto de lo cual es posible
obtener diferentes predicciones en diferentes lugares.
Al realizar dos estudios diferentes en dos localizaciones diferentes
(GC y TF), además del estudio realizado en Costa Rica, se comprueba la
correcta adaptación del modelo a cualquier ubicación geográfica.
3. Se han introducido novedades a la hora de realizar predicciones
meteorológicas. Pudiendo obtenerse éstas sin necesidad de utilizar

MODELOS DE PREDICCIÓN METEOROLÓGICA BASADOS EN MÉTODOS DE CLASIFICACIÓN ORIENTADOS A LA
MEJORA DE LA EFICIENCIA ENERGÉTICA EN LOS PROCESOS DE GENERACIÓN.
TESIS DOCTORAL JOSÉ GUSTAVO HERNÁNDEZ TRAVIESO
112
imagen satélite ni radar, logrando gran precisión en las mismas. Con lo
que se logra un modelo económicamente viable y de fácil instalación.
En base a los resultados obtenidos queda demostrada la robustez y
fiabilidad del modelo implementado.
4. El modelo predictivo necesita pocas muestras para ser entrenado,
permitiendo dedicar mayor número a la fase de test, esto redunda en una
mejor adaptación del modelo logrando la convergencia en un tiempo
menor.
Son necesarias un 20 % de las muestras para entrenar el sistema dejando
el 80 % restante para testearlo (en el caso de GC y TF), en el caso de Costa
Rica, aun habiendo menor cantidad de muestras, el entrenamiento se
realiza con menos del 50 % de las mismas.
5. La información contenida en los fenómenos meteorológicos no es de la
misma importancia. Ésta viene caracterizada por el fenómeno
meteorológico a predecir. Según esto, un fenómeno puede eliminarse del
proceso predictivo para obtener una determinada predicción e
incorporarse para obtener otra de un fenómeno diferente.
Se observa como por ejemplo en función del fenómeno a predecir se
eliminan de la base de datos una serie de fenómenos u otros, así como la
utilización de diferentes fenómenos para obtener una predicción precisa.
6. El modelo predictivo es independiente de la frecuencia de muestreo,
entendiendo como tal, que es posible aplicarlo independientemente de
la estación utilizada para la captura de datos. La posible importancia de
dicha frecuencia solo radica en la frecuencia con que se obtiene la
predicción. Esto es, el modelo ofrece predicciones cada x tiempo, siendo
esa x la frecuencia de muestreo de la estación.
7. El modelo puede considerarse de tiempo real debido al poco tiempo
empleado en testear una muestra, de magnitudes de milisegundos.

MODELOS DE PREDICCIÓN METEOROLÓGICA BASADOS EN MÉTODOS DE CLASIFICACIÓN ORIENTADOS A LA
MEJORA DE LA EFICIENCIA ENERGÉTICA EN LOS PROCESOS DE GENERACIÓN.
TESIS DOCTORAL JOSÉ GUSTAVO HERNÁNDEZ TRAVIESO
113
El modelo es muy rápido a la hora de ofrecer un resultado de predicción
una vez está correctamente calibrado y entrenado.
8. El modelo es una mejora frente a los modelos actuales de predicción
meteorológica.
Tal como se observa en las comparativas de los artículos, el modelo
predictivo mejora los ejemplos presentados en el estado-del-arte.
9. Aun frente a fenómenos que ofrecen una gran variabilidad a lo largo del
tiempo, como pueda ser la velocidad del viento, este modelo es capaz de
converger logrando predicciones precisas.
Una vez el modelo alcanza la convergencia, se comporta de manera
fiable, precisa y robusta frente a las variaciones del fenómeno en estudio.

MODELOS DE PREDICCIÓN METEOROLÓGICA BASADOS EN MÉTODOS DE CLASIFICACIÓN ORIENTADOS A LA
MEJORA DE LA EFICIENCIA ENERGÉTICA EN LOS PROCESOS DE GENERACIÓN.
TESIS DOCTORAL JOSÉ GUSTAVO HERNÁNDEZ TRAVIESO
114
MODELOS DE PREDICCIÓN METEOROLÓGICA BASADOS EN MÉTODOS DE CLASIFICACIÓN ORIENTADOS A LA
MEJORA DE LA EFICIENCIA ENERGÉTICA EN LOS PROCESOS DE GENERACIÓN.
TESIS DOCTORAL JOSÉ GUSTAVO HERNÁNDEZ TRAVIESO
115
Conclusiones
Como conclusión principal de esta Tesis Doctoral se han logrado la hipótesis y el
objetivo inicialmente marcado y se ha realizado un modelo de predicción meteorológica
que se diferencia de lo actual en que es un modelo a nivel microscópico y de corto plazo,
unas pocas horas de antelación. Esto ha sido posible gracias a factores como los
siguientes.
En primer lugar, el número de muestras utilizado en el entrenamiento del
modelo predictivo. Si bien es cierto que se utilizan las muestras correspondientes a un
año, esto supone un 20% del total de muestras disponibles en la base de datos. El tener
tal cantidad de muestras hace posible que el modelo sea capaz de ajustarse de una
manera óptima para lograr una gran precisión en los resultados obtenidos al realizar el
testeo. Con una cantidad de muestras inferior, el aprendizaje del modelo no sería tan
bueno con lo que la precisión finalmente obtenida no sería tan alta. Este detalle hace
que el presente modelo predictivo sea mejor.
En segundo lugar, la misma arquitectura del clasificador ha sido testeada con
diferentes combinaciones de fenómenos meteorológicos, con una mayor o menor
cantidad de fenómenos implicados en cada experimento, lo que da muestra, en

MODELOS DE PREDICCIÓN METEOROLÓGICA BASADOS EN MÉTODOS DE CLASIFICACIÓN ORIENTADOS A LA
MEJORA DE LA EFICIENCIA ENERGÉTICA EN LOS PROCESOS DE GENERACIÓN.
TESIS DOCTORAL JOSÉ GUSTAVO HERNÁNDEZ TRAVIESO
116
sistema clasificador. Si a esto se le suma que, mediante la técnica de fusión sobre esta
arquitectura se obtienen menores errores en las predicciones meteorológicas y una
menor varianza (lo que indudablemente redunda en una mayor estabilidad), todo hace
posible obtener los excelentes resultados mostrados en el apartado de Discusión
(Tablas 5, 6 y 7).
Pero, sin duda, una de las mayores ventajas de este modelo predictivo radica en
el poco tiempo necesario para poder entrenarlo a la hora de obtener una predicción
fiable y precisa, haciendo que este modelo se posicione como una herramienta
adecuada para la obtención de predicciones a corto plazo. La técnica de fusión permite
que con solo 20 minutos de entrenamiento como máximo, se empiecen a obtener
resultados precisos. Esto hace que sea posible ofrecer un tiempo de mejora al modelo
predictivo, así como mantener un margen de maniobra a las compañías energéticas para
adaptar sus sistemas de generación a la situación actual de cada momento. Con ello se
logra, en el caso de la generación con combustibles fósiles, una mejora en las
condiciones medioambientales al reducir las emisiones de CO2, así como un beneficio
económico ya que se emplea la cantidad de combustible justa para cada instante. En el
caso de la generación con energías renovables se puede ajustar el sistema a las
condiciones reinantes en cada momento.
Sin duda este tiempo de entrenamiento del modelo es bajo influenciado
directamente por el tamaño de la ventana deslizante, al haberse conseguido encontrar
un tamaño (5 muestras) que ofrece excelentes resultados, como queda demostrado en
los artículos contenidos en esta Tesis Doctoral por Compendio de Publicaciones. Con un
tamaño de solo 5 muestras, implica que la ANN posea solo 5 neuronas de entrada. Junto
con las 24 de la capa oculta y la única neurona de la capa de salida, forman una
configuración que aporta una gran rapidez al modelo a la hora de realizar el
entrenamiento y posteriormente, en el testeo, ofrecer un tiempo de test por muestra
del orden de milésimas de segundo. Haciendo que el modelo se comporte casi como un
sistema en tiempo real.
Este objetivo cumplido permite que este modelo sea aplicable para lograr una
mejora en la eficiencia energética en los procesos de generación, tanto con energías

MODELOS DE PREDICCIÓN METEOROLÓGICA BASADOS EN MÉTODOS DE CLASIFICACIÓN ORIENTADOS A LA
MEJORA DE LA EFICIENCIA ENERGÉTICA EN LOS PROCESOS DE GENERACIÓN.
TESIS DOCTORAL JOSÉ GUSTAVO HERNÁNDEZ TRAVIESO
117
renovables, como mediante combustibles fósiles. Todo ello, logrando caracterizar la
variabilidad climática de la zona en estudio.
Del mismo modo, se ha logrado validar la hipótesis inicialmente trazada al
comienzo de esta investigación, tal como ha quedado demostrado en los trabajos
publicados a lo largo de esta Investigación.
Además de la conclusión principal se han obtenido una serie de conclusiones
secundarias de manera holística.
Se ha podido obtener un modelo de predicción meteorológica basado
exclusivamente en los datos suministrados por estaciones meteorológicas, sin ser
necesaria la utilización de imagen por satélite, ni utilizar radares meteorológicos para
obtener predicciones precisas y fiables.
Se ha logrado un modelo de predicción meteorológica que es independiente de
la localización geográfica con la que sea entrenado. Esto posibilita enormemente su
instalación en un lugar remoto de aquél en el que ha sido originalmente entrenado y
permite obtener resultados precisos en un intervalo de tiempo reducido.
Se ha implementado un modelo predictivo que necesita un número de muestras
para ser entrenado mucho menor que el utilizado para su testeo. Esto posibilita la
puesta en marcha del modelo de una manera veloz una vez se ha logrado entrenar al
mismo.
Se he comprobado la cantidad cualitativa de información que poseen los
diferentes fenómenos meteorológicos a la hora de ser utilizados para obtener una
predicción. En función del fenómeno meteorológico a predecir, será necesaria una
combinación de diversos fenómenos meteorológicos para poder obtener una predicción
precisa del mismo. Según esto, un fenómeno puede eliminarse del proceso predictivo
para obtener una determinada predicción e incorporarse para obtener otra de un
fenómeno diferente.
MODELOS DE PREDICCIÓN METEOROLÓGICA BASADOS EN MÉTODOS DE CLASIFICACIÓN ORIENTADOS A LA
MEJORA DE LA EFICIENCIA ENERGÉTICA EN LOS PROCESOS DE GENERACIÓN.
TESIS DOCTORAL JOSÉ GUSTAVO HERNÁNDEZ TRAVIESO
118
Se ha conseguido realizar un modelo capaz de obtener predicciones precisas
trabajando casi en tiempo real. Debido al poco tiempo necesario a la hora de procesar
una muestra en su testeo, de magnitudes de milisegundos.
Por su parte, el tiempo de entrenamiento necesario para obtener predicciones
precisas varía en función del sistema de clasificación empleado y de la configuración
interna que se le da al mismo, hasta obtener de manera heurística su correcta
configuración.
Se ha logrado un modelo predictivo que es independiente de la frecuencia con la
que la estación recoge las muestras de información meteorológica, siendo éste tan solo
un factor a tener en cuenta para saber para qué horizonte temporal se obtendrá la
predicción. Esto significa que si la estación recopila datos cada hora, el resultado de la
predicción será para la hora siguiente. Si por el contrario la información se recoge cada
30 minutos, la predicción se obtendrá para 30 minutos.
Se ha comprobado que para horizontes temporales más lejanos en el tiempo, el
modelo predictivo deja de ser tan preciso como sí lo es para las predicciones a corto
plazo.
Se ha conseguido un modelo predictivo que puede acoplarse a un aerogenerador
y ofrecer datos de energía generada por el mismo en función de la recta de carga que
posea.
La generación de estos modelos predictivos abre una gran cantidad de nuevas
aplicaciones de las predicciones obtenidas pudiendo emplearse en todos y cada uno de
los sectores que se vean afectados por las condiciones meteorológicas a la hora de
realizar sus actividades o de ofrecer información y/o ayuda en función de estos mismos
parámetros.
Se ha conseguido un modelo predictivo que supone una mejora frente a los
modelos actuales de predicción meteorológica.
Aun frente a fenómenos que ofrecen una gran variabilidad a lo largo del tiempo,
como pueda ser la velocidad del viento, este modelo es capaz de converger logrando

MODELOS DE PREDICCIÓN METEOROLÓGICA BASADOS EN MÉTODOS DE CLASIFICACIÓN ORIENTADOS A LA
MEJORA DE LA EFICIENCIA ENERGÉTICA EN LOS PROCESOS DE GENERACIÓN.
TESIS DOCTORAL JOSÉ GUSTAVO HERNÁNDEZ TRAVIESO
119
predicciones precisas. Una vez el modelo alcanza la convergencia, se comporta de
manera fiable, precisa y robusta frente a las variaciones del fenómeno en estudio.
En lo relativo a las líneas futuras de esta Investigación dentro de las líneas de
investigación del Programa de Doctorado en Empresa, Internet y Tecnologías de las
Comunicaciones (EmITIC) algunas de ellas podrían ser:
Obtención de los valores interpolados de predicciones en aquellas zonas
donde no se disponga de estaciones meteorológicas, para poder obtener
energía renovable.
Realización y caracterización del modelo en tiempo real. Culminación de la
etapa actual marcada en un 80% de desarrollo actualmente.
Realización de la caracterización y mapeado climatológico de la isla de
Gran Canaria para conseguir la mejora en la eficiencia energética.
Mejora de la interpolación para lograr incluir en el modelo los datos de los
momentos en que la estación meteorológica está en labores de
mantenimiento o sufre avería.
Ampliar la ventana temporal de predicciones en las que el modelo ofrece
resultados precisos. Intentar llegar a días o semanas de antelación con mayor
precisión y fiabilidad que los modelos meteorológicos actuales.
Obtener predicciones meteorológicas en las que la frecuencia de muestreo de
la estación sea diferente de la frecuencia con que se obtienen las
predicciones.
Estas líneas futuras se ajustan a la segunda línea de investigación del Programa
de Doctorado en Empresa, Internet y Tecnologías de las Comunicaciones (EmITIC),
titulada “Sociedad, empresa y Tecnologías de la Información y el Conocimiento” en los
temas siguientes:
Computación adaptativa y neurociencia computacional.
Debido a los sistemas de clasificación empleados se desarrolla una tarea de
neurociencia computacional y computación adaptativa.

MODELOS DE PREDICCIÓN METEOROLÓGICA BASADOS EN MÉTODOS DE CLASIFICACIÓN ORIENTADOS A LA
MEJORA DE LA EFICIENCIA ENERGÉTICA EN LOS PROCESOS DE GENERACIÓN.
TESIS DOCTORAL JOSÉ GUSTAVO HERNÁNDEZ TRAVIESO
120
Organización, comportamiento humano y sostenibilidad.
Al colaborar a la mejora de la eficiencia energética colabora con la sostenibilidad
del medio ambiente, encontrándose encuadrada en este tema.
Inteligencia artificial.
Debido a los sistemas de clasificación empleados.
Procesado de señal.
Los datos son clasificados y tratados como señales.
MODELOS DE PREDICCIÓN METEOROLÓGICA BASADOS EN MÉTODOS DE CLASIFICACIÓN ORIENTADOS A LA
MEJORA DE LA EFICIENCIA ENERGÉTICA EN LOS PROCESOS DE GENERACIÓN.
TESIS DOCTORAL JOSÉ GUSTAVO HERNÁNDEZ TRAVIESO
121
Bibliografía
[Allen et al., 2017] Allen, D.J., Tomlin, A.S., Bale, C.S.E., Skea, A., Vosper, S., Gallani, M.L.
“A boundary layer scaling technique for estimating near-surface wind energy using
numerical weather prediction and wind map data.” Applied Energy 2017, 208,
pp. 1246-1257
[Andrade y Bessa, 2017] Andrade, J.R., Bessa, R.J. “Improving Renewable Energy
Forecasting With a Grid of Numerical Weather Predictions.” IEEE Transactions on
Sustainable Energy 2017, 8, no. 4, pp. 1571-1580
[Aral y Guan, 2016] Aral, M.M.; Guan, J. “Global Sea Surface Temperature and Sea Level
Rise Estimation with Optimal Historical Time Lag Data.” Water 2016, 8, 519.
[Arora y Dash, 2016] Arora, K.; Dash, P. “Towards dependence of tropical cyclone
intensity on sea surface temperature and its response in a warming world.”
Climate 2016, 4, 30.
[Artis, 2012] Jean Paul Artis (2012) EE.UU. Patente Nº. US 8,095,315 B2. Washington,
DC: U.S. Patent and Trademark Office.
[Bao et al., 2014] Bao, Y.; Xiong, T.; Hu, Z. “PSO-MISMO Modeling Strategy for MultiStep-
Ahead Time Series Prediction.” Trans. IEEE Cybern. 2014, 44, 655–668.
[Baptista et al., 2016] Baptista, D., Abreu, S., Travieso-González, C., Morgado-Dias, F.
“Hardware implementation of an artificial neural network model to predict the
energy production of a photovoltaic system.” Microprocessors and Microsystems,
49, pp. 77-86
[Bhaskar y Singh, 2012] Bhaskar, K.; Singh, S.N., "AWNN-Assisted Wind Power
Forecasting Using Feed-Forward Neural Network," IEEE Transactions on
Sustainable Energy, vol.3, no.2, pp. 306, 315, April 2012.
[Chen et al., 2014] Niya Chen; Zheng Qian; Nabney, I.T.; Xiaofeng Meng, "Wind Power
Forecasts Using Gaussian Processes and Numerical Weather Prediction," IEEE
Transactions on Power Systems, vol.29, no.2, pp. 656, 665, March 2014.
MODELOS DE PREDICCIÓN METEOROLÓGICA BASADOS EN MÉTODOS DE CLASIFICACIÓN ORIENTADOS A LA
MEJORA DE LA EFICIENCIA ENERGÉTICA EN LOS PROCESOS DE GENERACIÓN.
TESIS DOCTORAL JOSÉ GUSTAVO HERNÁNDEZ TRAVIESO
122
[Chen y Xu, 2011] Xuexi Chen; Ameng Xu, "Temperature and humidity of air in mine
roadways prediction based on BP neural network," 2011 International Conference
on Multimedia Technology (ICMT), pp. 1273, 1276, 26-28 July 2011.
[Cramer et al., 2017] Cramer, S., Kampouridis, M., Freitas, A.A., Alexandridis, A.A. “An
extensive evaluation of seven machine learning methods for rainfall prediction in
weather derivatives.” Expert Systems with Applications 2017, 85, pp. 169-181.
[Demirtas et al., 2012] Demirtas, M.; Yesilbudak, M.; Sagiroglu, S.; Colak, I., "Prediction
of solar radiation using meteorological data," 2012 International Conference on
Renewable Energy Research and Applications (ICRERA), pp. 1, 4, 11-14 November
2012.
[Donida et al., 2018] Donida Labati, R.; Genovese, A.; Piuri, V.; Scotti, F.; Sforza, G. “A
Decision Support System for Wind Power Production.” IEEE Transactions on
System, Man, and Cybernetics: Systems 2018, no. 99, pp. 1-15.
[Du et al., 2018] Y. F. Du, L. Jiang, C. Duan, Y. Z. Li and J. S. Smith, "Energy Consumption
Scheduling of HVAC Considering Weather Forecast Error Through the
Distributionally Robust Approach," in IEEE Transactions on Industrial Informatics,
vol. 14, no. 3, pp. 846-857, March 2018.
[Ellouz et al., 2009] Ellouz, I.K.; Ben Jmaa Derbel, H.; Kanoun, O., "Temperature
prediction of Soil-Pipe-Air Heat Exchanger using neural networks," 6th
International Multi-Conference on Systems, Signals and Devices, 2009 (SSD '09),
pp. 1, 6, 23-26 March 2009.
[Eroshenko y Khalyasmaa, 2018] S. A. Eroshenko and A. I. Khalyasmaa, "Assessment of
the learning sample size and pattern impact on the SPS generation short-term
forecasting," 2018 IEEE Conference of Russian Young Researchers in Electrical and
Electronic Engineering (EIConRus), Moscow, 2018, pp. 617-621.
[Filik y Filik, 2017] Ümmühan Başaran Filik, Tansu Filik, “Wind Speed Prediction Using
Artificial Neural Networks Based on Multiple Local Measurements in Eskisehir,”
Energy Procedia, Volume 107, 2017, pp. 264-269.

MODELOS DE PREDICCIÓN METEOROLÓGICA BASADOS EN MÉTODOS DE CLASIFICACIÓN ORIENTADOS A LA
MEJORA DE LA EFICIENCIA ENERGÉTICA EN LOS PROCESOS DE GENERACIÓN.
TESIS DOCTORAL JOSÉ GUSTAVO HERNÁNDEZ TRAVIESO
123
[Gairaa et al., 2015] K. Gairaa, F. Chellali, S. Benkaciali, Y. Messlem and K. Abdallah,
"Daily global solar radiation forecasting over a desert area using NAR neural
networks comparison with conventional methods," 2015 International
Conference on Renewable Energy Research and Applications (ICRERA), Palermo,
2015, pp. 567-571.
[Gofrani et al., 2017] M. Ghofrani, N. Niromand, R. Azimi and M. Ghayekhloo, "A novel
data mining method for high accuracy solar radiation forecasting," 2017 North
American Power Symposium (NAPS), Morgantown, WV, 2017, pp. 1-6.
[Haykin, 1999] Haykin, S. “Neural networks. A comprehensive foundation,”
2nd edition. Prentice Hall International, Inc., Upper Saddle River, USA.
[Hernández et al., 2014a] Hernández-Travieso, J. G.; Travieso, C.M. and Alonso, J. B.,
"Wind speed modelling for the estimation of the wind energy generation,"
3rd IEEE International Work-Conference on Bioinspired Intelligence, Liberia, 2014,
pp. 44-49.
[Hernández et al., 2014b] Hernández-Travieso, J. G.; Travieso, C.M.; Alonso, J. B. and
Dutta, M.K., "Solar radiation modelling for the estimation of the solar energy
generation," 2014 Seventh International Conference on Contemporary Computing
(IC3), Noida, 2014, pp. 536-541.
[Hernández et al., 2015] Hernández-Travieso, J.G.; Travieso, C.M.; Alonso, J.B. and
Dutta, M.K., ”Applying data normalization for the Solar Radiation Modelling,”
Proceedings of the 11th International Conference on Energy, Environment,
Ecosystems and Sustainable Development (EEESD’15), Tenerife, Spain, 10-12
January, 2015,pp. 134-139.
[Houthuys et al., 2017] Houthuys, L., Karevan, Z., Suykens, J.A.K. “Multi-view LS-SVM
regression for black-box temperature prediction in weather forecasting.” In
Proceedings of the 2017 International Joint Conference on Neural Networks
(IJCNN), Anchorage, AK, USA, 14-17 May 2017

MODELOS DE PREDICCIÓN METEOROLÓGICA BASADOS EN MÉTODOS DE CLASIFICACIÓN ORIENTADOS A LA
MEJORA DE LA EFICIENCIA ENERGÉTICA EN LOS PROCESOS DE GENERACIÓN.
TESIS DOCTORAL JOSÉ GUSTAVO HERNÁNDEZ TRAVIESO
124
[Huang et al., 2013] Hao Huang; Lei Chen; Mohammadzaheri, M.; Hu, E.; Minlei Chen,
"Multi-zone temperature prediction in a commercial building using artificial neural
network model," 2013 10th IEEE International Conference on Control and
Automation (ICCA), pp. 1896, 1901, 12-14 June 2013.
[IIC, 2016a] Instituto de Ingeniería del Conocimiento, Información del seminario
“Predicción inmediata y a muy corto plazo de la radiación solar a partir de datos
de satélite y modelos numéricos” realizada por la AEMET y Red Eléctrica de
España, 2016, http://www.iic.uam.es/energias/prediccion-radiacion-solar-corto-
plazo/ Fecha de consulta: 13 de agosto de 2018.
[IIC, 2016b] Instituto de Ingeniería del Conocimiento, Presentación en formato PDF
realizada en el seminario “Predicción inmediata y a muy corto plazo de la radiación
solar a partir de datos de satélite y modelos numéricos”
realizada por la AEMET y Red Eléctrica de España, 2016,
http://www.iic.uam.es/pdf/seminarioNOV2016.pdf
Fecha de consulta: 13 de agosto de 2018.
[ITC, 2018] Instituto Tecnológico de Canarias, Proyecto G.R.A.C.I.O.S.A. (Generación
Renovable con Almacenamiento y Consumos Inteligentes para la Operación de
Redes de distribución con Sistemas de Autoconsumo) desarrollado en la isla de
La Graciosa (Islas Canarias), 2018, http://www.itccanarias.org/web/itc/proyectos-
eerr/proyecto_graciosa.jsp?lang=es Fecha de consulta: 13 de agosto de 2018.
[Jian et al., 2018] Z. Jian, L. Kai, L. Zhanzhan and L. Ruimin, "Study of monthly electricity
sales forecasting based on seasonal adjustment and multi-factor correction
method," 2018 Chinese Control And Decision Conference (CCDC), Shenyang,
China, 2018, pp. 2086-2090.
[Kaiju et al., 2018] L. Kaiju, L. Xuefeng, M. Chaoxu and W. Dan, "Short-term photovoltaic
power prediction based on T-S fuzzy neural network," 2018 33rd Youth Academic
Annual Conference of Chinese Association of Automation (YAC), Nanjing, China,
2018, pp. 620-624.
MODELOS DE PREDICCIÓN METEOROLÓGICA BASADOS EN MÉTODOS DE CLASIFICACIÓN ORIENTADOS A LA
MEJORA DE LA EFICIENCIA ENERGÉTICA EN LOS PROCESOS DE GENERACIÓN.
TESIS DOCTORAL JOSÉ GUSTAVO HERNÁNDEZ TRAVIESO
125
[Khodayar y Wang, 2018] M. Khodayar and J. Wang, "Spatio-temporal Graph Deep
Neural Network for Short-term Wind Speed Forecasting," in IEEE Transactions on
Sustainable Energy (Early Access).
[Khodayar et al., 2018] M. Khodayar, J. Wang and M. Manthouri, "Interval Deep
Generative Neural Network for Wind Speed Forecasting," in IEEE Transactions on
Smart Grid (Early Access).
[Koyasu et al., 2016] T. Koyasu, K. Yukita, K. Ichiyanagi, M. Minowa, M. Yoda and K.
Hirose, "Forecasting variation of solar radiation and movement of cloud by sky
image data," 2016 IEEE International Conference on Renewable Energy Research
and Applications (ICRERA), Birmingham, 2016, pp. 401-406.
[Li J.et al., 2016] J. Li, R. Wang and T. Zhang, "Wind speed prediction using a cooperative
coevolution genetic algorithm based on back propagation neural network," 2016
IEEE Congress on Evolutionary Computation (CEC), Vancouver, BC, 2016,
pp. 4578-4583.
[Li X.F. et al., 2016] Li, X.F.; Qin, L.L.; Ma, G.Q.; Wu, G. “Modeling Greenhouse
Temperature by Means of PLSR and BPNN.” In Proceedings of the 35th Chinese
Control Conference (CCC), Chengdu, China, 27–29 July 2016.
[Lin y Weng, 2018] L. Lin and F. Weng, "Estimation of Hurricane Maximum Wind Speed
Using Temperature Anomaly Derived From Advanced Technology Microwave
Sounder," in IEEE Geoscience and Remote Sensing Letters, vol. 15, no. 5, pp. 639-
643, May 2018.
[Lin et al., 2018] Q. Lin, Q. Wang, G. Zhang, Y. Shi, H. Liu and L. Deng, "Maximum daily
load forecasting based on support vector regression considering accumulated
temperature effect," 2018 Chinese Control And Decision Conference (CCDC),
Shenyang, 2018, pp. 5199-5203.
[Luo et al., 2018] X. Luo et al., "Short-term Wind Speed Forecasting via Stacked Extreme
Learning Machine With Generalized Correntropy," in IEEE Transactions on
Industrial Informatics (Early Access).
MODELOS DE PREDICCIÓN METEOROLÓGICA BASADOS EN MÉTODOS DE CLASIFICACIÓN ORIENTADOS A LA
MEJORA DE LA EFICIENCIA ENERGÉTICA EN LOS PROCESOS DE GENERACIÓN.
TESIS DOCTORAL JOSÉ GUSTAVO HERNÁNDEZ TRAVIESO
126
[McKinney et al., 2015] McKinney, R.; Pallipuram, V.K.; Vargas, R.; Taufer, M. “From HPC
Performance to Climate Modeling: Transforming Methods for HPC Predictions into
Models of Extreme Climate Conditions.” In Proceedings of the 2015 IEEE 11th
International Conference on e-Science, Munich, Germany,
31 August–4 September 2015.
[Mecikalski et al., 2014] John Mecikalski, Wayne M. MacKenzie, Jr., John Robert Walker
(2014) EE.UU. Patente Nº. US 8,818,029 B1. Washington, DC: U.S. Patent and
Trademark Office.
[Mengquiao et al, 2017] Mengjiao, Q., Zhihang, L., Zhenhong, D. “Red tide time series
forecasting by combining ARIMA and deep belief network.” Knowledge-Based
System 2017, 125, pp. 39-52.
[Mert et al., 2016] Mert, İ., Karakuş, C. & Üneş, F. “Estimating the energy production of
the wind turbine using artificial neural network.” Neural Comput & Applic (2016)
27: 1231.
[Murata et al., 2018] Murata, A., Ohtake, H., Oozeki, T. “Modeling of uncertainty of solar
irradiance forecasts on numerical weather predictions with the estimation of
multiple confidence intervals.” Renewable Energy 2018, 117, pp. 193-201.
[Naing y Srinivasan, 2010] Lin Phyo Naing; Srinivasan, D., "Estimation of solar power
generating capacity," IEEE 11th International Conference on Probabilistic Methods
Applied to Power Systems (PMAPS), 2010, pp.95,100, 14-17 June 2010.
[Pérez et al., 2016] Pérez-Vega, A.; Travieso, C. M.; Hernández-Travieso, J. G.;
Alonso, J. B.; Dutta, M. K. and Singh, A., "Forecast of temperature using
support vector machines," 2016 International Conference on Computing,
Communication and Automation (ICCCA), Noida, 2016, pp. 388-392.
[Prashanthi et al., 2016] Prashanthi, B.; Meganathan, S.; Krishnan, R.B.; Varahasamy, R.;
Swaminathan, S. “Data Mining as a Tool for Hot Day Prediction during Summer
Monsoon.” In Proceedings of the 2016 International Conference on Circuit, Power
and Computing Technologies (ICCPCT), Nagercoil, India, 18–19 March 2016.
MODELOS DE PREDICCIÓN METEOROLÓGICA BASADOS EN MÉTODOS DE CLASIFICACIÓN ORIENTADOS A LA
MEJORA DE LA EFICIENCIA ENERGÉTICA EN LOS PROCESOS DE GENERACIÓN.
TESIS DOCTORAL JOSÉ GUSTAVO HERNÁNDEZ TRAVIESO
127
[Rastogi et al., 2011] Rastogi, A.; Srivastava, A.; Srivastava, V.K.; Pandey, A.K., "Pattern
analysis approach for prediction using Wavelet Neural Networks," 2011 Seventh
International Conference on Natural Computation (ICNC), pp. 695, 699,
26-28 July 2011.
[Ravela et al., 2014] Srinivas Ravela, William J. Dupree, Timothy R. Langlois, Marilyn M.
Wolfson, Christopher M. Yang (2014) EE.UU. Patente Nº. US 8,625,840 B2.
Washington, DC: U.S. Patent and Trademark Office.
[Refaat et al., 2018] S. S. Refaat, O. H. Abu-Rub and H. Nounou, "ANN based
prognostication of the PV panel output power under various environmental
conditions," 2018 IEEE Texas Power and Energy Conference (TPEC), College
Station, TX, 2018, pp. 1-6.
[Routh et al., 2012] Routh, T.K.; Bin Yousuf, A.H.; Hossain, M.N.; Asasduzzaman, M.M.;
Hossain, M.I.; Husnaeen, U.; Mubarak, M., "Artificial neural network based
temperature prediction and its impact on solar cell," 2012 International
Conference on Informatics, Electronics & Vision (ICIEV), pp. 897, 902,
18-19 May 2012.
[Ruffin y Venayagamoorthy, 2009] Ruffing, S.M.; Venayagamoorthy, G.K., "Short to
Medium Range Time Series Prediction of Solar Irradiance Using an Echo State
Network," 15th International Conference on Intelligent System Applications to
Power Systems, 2009. ISAP '09, pp. 1, 6, 8-12 November 2009.
[Salcedo-Sanz et al., 2014] S. Salcedo-Sanz, C. Casanova-Mateo, J. Muñoz-Marí and
G. Camps-Valls, "Prediction of Daily Global Solar Irradiation Using Temporal
Gaussian Processes," in IEEE Geoscience and Remote Sensing Letters, vol. 11, no.
11, pp. 1936-1940, November 2014.
[Sagar et al., 2017] Sagar, S.K., Rajeevan, M., Bhaskara Rao, S.V., Mitra, A.K. “Prediction
skill of rainstorm events over India in the TIGGE weather prediction models.”
Atmospheric Research 2017, 198, 194-204

MODELOS DE PREDICCIÓN METEOROLÓGICA BASADOS EN MÉTODOS DE CLASIFICACIÓN ORIENTADOS A LA
MEJORA DE LA EFICIENCIA ENERGÉTICA EN LOS PROCESOS DE GENERACIÓN.
TESIS DOCTORAL JOSÉ GUSTAVO HERNÁNDEZ TRAVIESO
128
[Shi et al., 2013] Shi Nan; Zhou Su-quan; Zhu Xian-hui; Su Xun-wen; Zhao Xiao-yan, "Wind
speed forecasting based on grey predictor and genetic neural network models,"
2013 International Conference on Measurement, Information and Control
(ICMIC), vol.02, pp.1479,1482, 16-18 August 2013.
[Shi et al., 2018] X. Shi, W. Lu, Y. Zhao and P. Qin, "Prediction of Indoor Temperature and
Relative Humidity Based on Cloud Database by Using an Improved BP Neural
Network in Chongqing," in IEEE Access, vol. 6, pp. 30559-30566, 2018.
[Shu et al., 2010] Shu Fan; Methaprayoon, K.; Wei-Jen Lee, "Multi-region load
forecasting considering alternative meteorological predictions," 2010 IEEE Power
and Energy Society General Meeting, pp. 1, 7, 25-29 July 2010.
[Snegirev et al., 2017] D. A. Snegirev, S. A. Eroshenko, R. T. Valiev and A. I. Khalyasmaa,
"Algorithmic realization of short-term solar power plant output forecasting,"
2017 IEEE II International Conference on Control in Technical Systems (CTS),
St. Petersburg, 2017, pp. 228-231.
[Soussiel et al., 2007] Olivier Soussiel, Francois Coulmeau (2007) EE.UU. Patente Nº. US
2007/0179703 A1. Washington, DC: U.S. Patent and Trademark Office.
[Szeles et al., 2017] Szeles, J., Kubota, N., Woo, J. “Weather forecast support system
implemented into robot partner for supporting elderly people using fuzzy logic.”
In Proceedings of the 2017 Joint 17th World Congress of International Fuzzy
Systems Association and 9th International Conference on Soft Computing and
Intelligent Systems (IFSA-SCIS), Otsu, Japan, 27-30 June 2017
[Tarade y Katti, 2011] Tarade, R. S.; Katti, P.K., "A comparative analysis for wind speed
prediction," 2011 International Conference on Energy, Automation, and Signal
(ICEAS), pp. 1, 6, 28-30 December 2011.
[Tillotson et al., 2010] Brian J. Tillotson, David A. Whelan (2010) EE.UU. Patente Nº. US
7,728,759 B2. Washington, DC: U.S. Patent and Trademark Office.
[Ulkat y Günai, 2017] Ulkat D. & Günay, M.E. “Prediction of mean monthly wind speed
and optimization of wind power by artificial neural networks using geographical
MODELOS DE PREDICCIÓN METEOROLÓGICA BASADOS EN MÉTODOS DE CLASIFICACIÓN ORIENTADOS A LA
MEJORA DE LA EFICIENCIA ENERGÉTICA EN LOS PROCESOS DE GENERACIÓN.
TESIS DOCTORAL JOSÉ GUSTAVO HERNÁNDEZ TRAVIESO
129
and atmospheric variables: case of Aegean Region of Turkey.” Neural Comput &
Applic (2017).
[ULL, 2018] Universidad de La Laguna, “La ULL consigue mejorar la predicción de energía
fotovoltaica en redes inteligentes”, 2018,
https://www.ull.es/portal/noticias/2018/mejora-prediccion-energia-
fotovoltaica/ Fecha de consulta: 13 de agosto de 2018.
[Valverde et al., 2014] M.C. Valverde, Ernesto Araujo, H. Campos Velho, “Neural network
and fuzzy logic statistical downscaling of atmospheric circulation-type specific
weather pattern for rainfall forecasting,” In Applied Soft Computing, Volume 22,
2014, pp. 681-694.
[Vasquez et al., 2012] Vasquez, J.L.; Travieso, C.M.; Perez, T.S.; Alonso, J.B.; Briceno, J.C.,
"Temperature Prediction Based on Different Meteorological Series," 2012 Third
Global Congress on Intelligent Systems (GCIS), pp. 104, 107, 6-8 November 2012.
[Wada, 2006] Masakazu Wada (2006) EE.UU. Patente Nº. US 7,076,368 B2. Washington,
DC: U.S. Patent and Trademark Office.
[Wang et al., 2011] Jianping Wang; Yunlin Xie; Chenghui Zhu; Xiaobing Xu, "Daily solar
radiation prediction based on Genetic Algorithm Optimization of wavelet neural
network," 2011 International Conference on Electrical and Control Engineering
(ICECE), pp.602,605, 16-18 Sept. 2011.
[Wu Y.K. et al., 2018] Y. K. Wu, P. E. Su, T. Y. Wu, J. S. Hong and Y. H. Mohammad,
"Probabilistic Wind Power Forecasting Using Weather Ensemble Models," in IEEE
Transactions on Industry Applications (Early Access).
[Wu F. et al., 2018] F. Wu, N. Zhou, P. Ju and X. P. Zhang, "Wind-Wave Coupling Model
for Wave Energy Forecast," in IEEE Transactions on Sustainable Energy, Issue 99
(Early Access).
[Wu y Keong, 2011] Wu Ji, Keong Chan Chee, “Prediction of hourly solar radiation using
a novel hybrid model of ARMA and TDNN,” Solar Energy, Volume 85, Issue 5, 2011,
pp. 808-817.
MODELOS DE PREDICCIÓN METEOROLÓGICA BASADOS EN MÉTODOS DE CLASIFICACIÓN ORIENTADOS A LA
MEJORA DE LA EFICIENCIA ENERGÉTICA EN LOS PROCESOS DE GENERACIÓN.
TESIS DOCTORAL JOSÉ GUSTAVO HERNÁNDEZ TRAVIESO
130
[Xiao y Ai, 2018] F. Xiao and Q. Ai, "Data-Driven Multi-Hidden Markov Model-Based
Power Quality Disturbance Prediction that Incorporates Weather Conditions," in
IEEE Transactions on Power Systems (Early Access).
[Xingpei et al., 2009] Li Xingpei; Liu Yibing; Xin Weidong, "Wind speed prediction based
on genetic neural network," 4th IEEE Conference on Industrial Electronics and
Applications, 2009. ICIEA 2009, pp. 2448, 2451, 25-27 May 2009.
[Yang et al., 2013] Xiyun Yang; Feifei Jiang; Huan Liu, "Short-term solar radiation
prediction based on SVM with similar data," 2nd IET Renewable Power Generation
Conference (RPG 2013), 2013, pp.1,4, 9-11 Sept. 2013.
[Yoshida et al., 2016] S. Yoshida, H. Suzuki, T. Kitajima, A. M. Kassim and T. Yasuno,
"Correction method of wind speed prediction system using predicted wind speed
fluctuation," 2016 55th Annual Conference of the Society of Instrument and
Control Engineers of Japan (SICE), Tsukuba, 2016, pp. 1054-1059.
[Young et al., 2012] Philip John Young, Angelo Genghi (2012) EE.UU.
Patente Nº. US 8,100,0049 B2. Washington, DC: U.S. Patent and Trademark Office
[Zhang B. et al., 2018] B. Zhang, L. Tang and M. Roemer, "Probabilistic Planning and Risk
Evaluation Based on Ensemble Weather Forecasting," in IEEE Transactions on
Automation Science and Engineering, vol. 15, no. 2, pp. 556-566, April 2018.
[Zhang T. et al., 2018] T. Zhang, M. P. Wan, B. F. Ng and S. Yang, "Model Predictive
Control for Building Energy Reduction and Temperature Regulation," 2018 IEEE
Green Technologies Conference (GreenTech), Austin, TX, 2018, pp. 100-106.
[Zhao et al., 2010] Pan Zhao; Junrong Xia; Yiping Dai; Jiaxing He, "Wind speed prediction
using support vector regression," the 5th IEEE Conference on Industrial Electronics
and Applications (ICIEA), 2010, pp.882,886, 15-17 June 2010.
[Zheng y Qiao, 2011] Jianwu Zeng; Wei Qiao, "Short-term solar power prediction using
an RBF neural network," 2011 IEEE Power and Energy Society General Meeting,
2011 , pp.1,8, 24-29 July 2011.
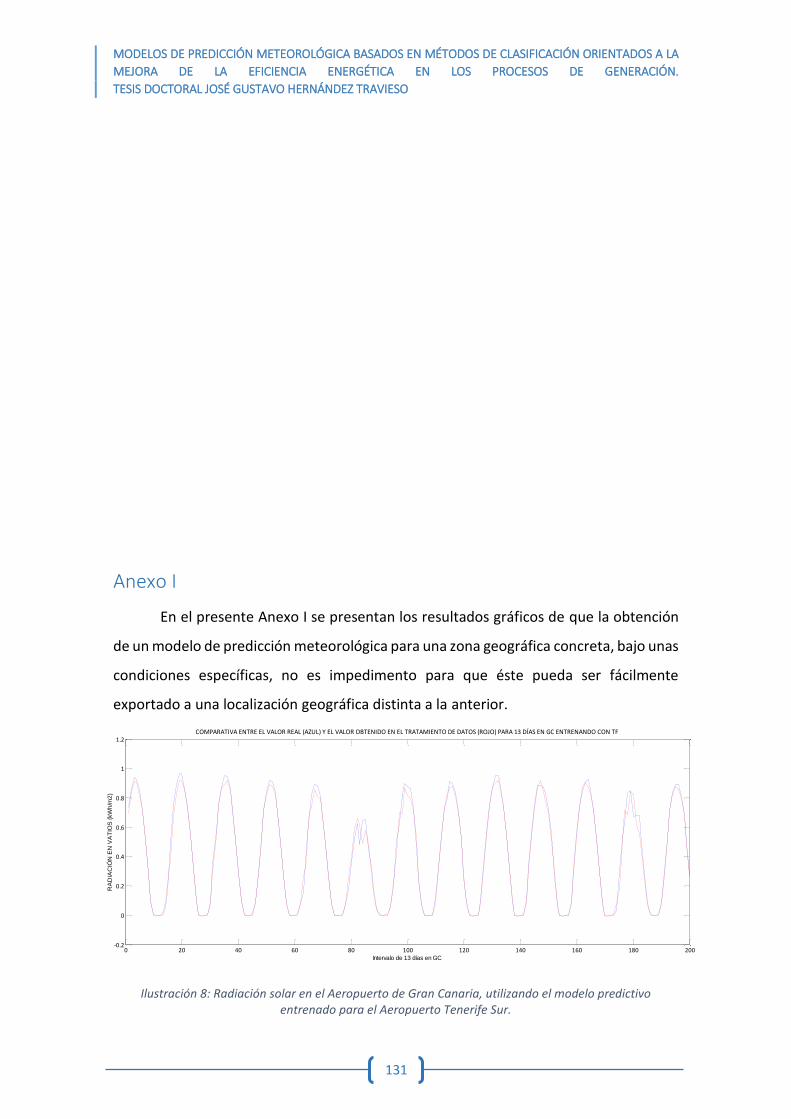
MODELOS DE PREDICCIÓN METEOROLÓGICA BASADOS EN MÉTODOS DE CLASIFICACIÓN ORIENTADOS A LA
MEJORA DE LA EFICIENCIA ENERGÉTICA EN LOS PROCESOS DE GENERACIÓN.
TESIS DOCTORAL JOSÉ GUSTAVO HERNÁNDEZ TRAVIESO
131
Ilustración 8: Radiación solar en el Aeropuerto de Gran Canaria, utilizando el modelo predictivo entrenado para el Aeropuerto Tenerife Sur.
Anexo I
En el presente Anexo I se presentan los resultados gráficos de que la obtención
de un modelo de predicción meteorológica para una zona geográfica concreta, bajo unas
condiciones específicas, no es impedimento para que éste pueda ser fácilmente
exportado a una localización geográfica distinta a la anterior.
0 20 40 60 80 100 120 140 160 180 200-0.2
0
0.2
0.4
0.6
0.8
1
1.2COMPARATIVA ENTRE EL VALOR REAL (AZUL) Y EL VALOR OBTENIDO EN EL TRATAMIENTO DE DATOS (ROJO) PARA 13 DÍAS EN GC ENTRENANDO CON TF
RA
DIA
CIÓ
N E
N V
AT
IOS
(kW
h/m
2)
Intervalo de 13 días en GC
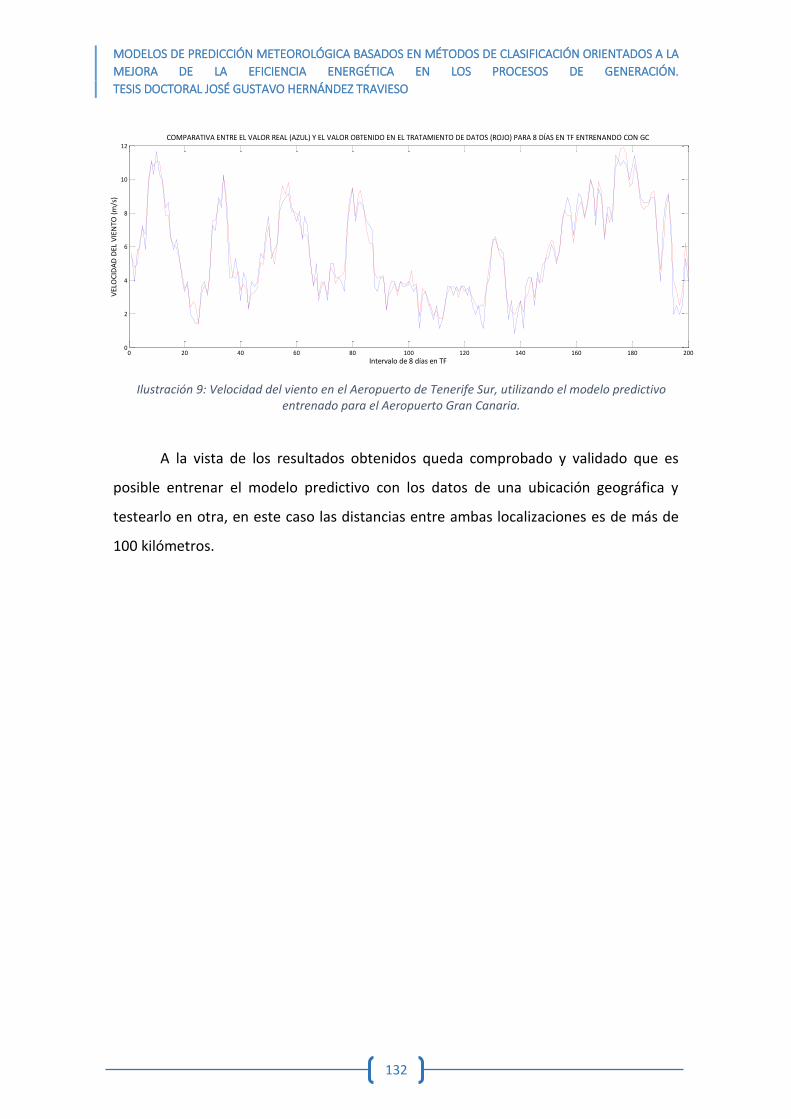
MODELOS DE PREDICCIÓN METEOROLÓGICA BASADOS EN MÉTODOS DE CLASIFICACIÓN ORIENTADOS A LA
MEJORA DE LA EFICIENCIA ENERGÉTICA EN LOS PROCESOS DE GENERACIÓN.
TESIS DOCTORAL JOSÉ GUSTAVO HERNÁNDEZ TRAVIESO
132
0 20 40 60 80 100 120 140 160 180 2000
2
4
6
8
10
12COMPARATIVA ENTRE EL VALOR REAL (AZUL) Y EL VALOR OBTENIDO EN EL TRATAMIENTO DE DATOS (ROJO) PARA 8 DÍAS EN TF ENTRENANDO CON GC
VEL
OC
IDA
D D
EL V
IEN
TO (
m/s
)
Intervalo de 8 días en TF
Ilustración 9: Velocidad del viento en el Aeropuerto de Tenerife Sur, utilizando el modelo predictivo entrenado para el Aeropuerto Gran Canaria.
A la vista de los resultados obtenidos queda comprobado y validado que es
posible entrenar el modelo predictivo con los datos de una ubicación geográfica y
testearlo en otra, en este caso las distancias entre ambas localizaciones es de más de
100 kilómetros.

MODELOS DE PREDICCIÓN METEOROLÓGICA BASADOS EN MÉTODOS DE CLASIFICACIÓN ORIENTADOS A LA
MEJORA DE LA EFICIENCIA ENERGÉTICA EN LOS PROCESOS DE GENERACIÓN.
TESIS DOCTORAL JOSÉ GUSTAVO HERNÁNDEZ TRAVIESO
133
Anexo II
En el presente Anexo II se presentan las publicaciones en Congresos
Internacionales, participaciones en Ferias y Encuentros Tecnológicos, Proyecto Final de
Carrera, Trabajo Fin de Grado y Trabajo Fin de Máster dirigidos, así como los galardones
y noticias de prensa derivadas de esta investigación a lo largo de su historia.
A lo largo de la investigación realizada hasta llegar a este punto, se han realizado
publicaciones en diversos Congresos Internacionales:
CANAGUA 2017: 11ª Feria Internacional Canagua&Energía. Soluciones
Integrales de Agua y Energía para Entornos Aislados
(CANAGUA&ENERGÍA 2017) del 05 al 08 de octubre de 2017,
Las Palmas de Gran Canaria (Gran Canaria, España).
ICCCA 2016: International Conference on Communication and
Automation (ICCA 2016) del 29 al 30 de junio de 2016, Greater Noida
(India).

MODELOS DE PREDICCIÓN METEOROLÓGICA BASADOS EN MÉTODOS DE CLASIFICACIÓN ORIENTADOS A LA
MEJORA DE LA EFICIENCIA ENERGÉTICA EN LOS PROCESOS DE GENERACIÓN.
TESIS DOCTORAL JOSÉ GUSTAVO HERNÁNDEZ TRAVIESO
134
EEESD 2015: 11th International Conference On Energy, Environment,
Ecosystems and Sustainable Development (EEESD ’15) del
10 al 12 de enero de 2015, Arona (Tenerife, España).
IC3 2014: Seventh International Conference on Contemporary Computing
(IC3) del 07 al 09 de agosto de 2014, Noida (India)
IWOBI 2014: International Work Conference On Bio-inspired Intelligence
(IWOBI 2014) del 16 al 18 de julio de 2014, Liberia (Costa Rica).
Participación en Ferias:
Gran Canaria Ecológica. Feria de Ecología y Sostenibilidad, Granja Agrícola
Experimental del Cabildo de Gran Canaria, Arucas (Gran Canaria, España),
12-13 de mayo de 2018.
TRANSFIERE 2016: 5º Foro Europeo para la Ciencia, Tecnología e
Innovación, Palacio de Ferias y Congresos de Málaga, 10-11 de febrero de
2016, Málaga (España) (gracias a la Oficina de Transferencia de
Resultados de Investigación, OTRI, de la Universidad de Las Palmas de
Gran Canaria).
GENERA 2014: 17ª Feria Internacional de Energía y Medio Ambiente,
Institución Ferial de Madrid (IFEMA), 6-8 de mayo de 2014, Madrid
(España) (gracias a la Oficina de Transferencia de Resultados de
Investigación, OTRI, de la Universidad de Las Palmas de Gran Canaria).

MODELOS DE PREDICCIÓN METEOROLÓGICA BASADOS EN MÉTODOS DE CLASIFICACIÓN ORIENTADOS A LA
MEJORA DE LA EFICIENCIA ENERGÉTICA EN LOS PROCESOS DE GENERACIÓN.
TESIS DOCTORAL JOSÉ GUSTAVO HERNÁNDEZ TRAVIESO
135
Encuentro Tecnológico:
#MeLoApunto, organizado por la Sociedad de Promoción Económica de
Gran Canaria, Fundación Canaria Parque Científico Tecnológico de la
Universidad de Las Palmas de Gran Canaria y Palet Express Cajasiete,
Parque Científico Tecnológico de la Universidad de Las Palmas de
Gran Canaria 22 de marzo de 2018.
Los galardones obtenidos por la presente investigación han sido los siguientes:
Premio Accésit de la I Cátedra Telefónica de la Universidad de Las Palmas
de Gran Canaria en su categoría Proyecto de Innovación / Investigación
en el año 2017. Con el Trabajo titulado: Modelo de estimación
meteorológica para la generación de energías renovables.
Premio OPTIMA Finnancial Planners a la Mejor Trayectoria Académica en
Ingeniería de Telecomunicación. XXXV Convocatoria Premios Ingenieros
de Telecomunicación Colegio Oficial de Ingenieros de Telecomunicación
(COIT) y Asociación española de Ingenieros de Telecomunicación (AEIT),
en el año 2015.
Beca de la Fundación Universitaria de Las Palmas dentro del Proyecto
Innova Canarias 2020 en su XXX Edición, bajo mecenazgo de la Fundación
Endesa, para el desarrollo del proyecto titulado Metodología para el
Desarrollo de un Modelo de Predicción Climática a Corto Plazo para la
Optimización de las Centrales Eléctricas basado en las Series Temporales
de las Variables Climáticas. Año 2013.

MODELOS DE PREDICCIÓN METEOROLÓGICA BASADOS EN MÉTODOS DE CLASIFICACIÓN ORIENTADOS A LA
MEJORA DE LA EFICIENCIA ENERGÉTICA EN LOS PROCESOS DE GENERACIÓN.
TESIS DOCTORAL JOSÉ GUSTAVO HERNÁNDEZ TRAVIESO
136
Del mismo modo, a lo largo del tiempo en el que se ha desarrollado esta
investigación, el doctorando ha dirigido los siguientes Proyecto Final de Carrera, Trabajo
Fin de Grado y Trabajo Fin de Máster:
Alumno: D. Robison Adalio Ferrera Moreira.
Título del Proyecto: Extracción de Información de las Webs de Estaciones
Meteorológicas para su Predicción en Tiempo Real.
Tutores: Dr. Carlos M. Travieso González,
José Gustavo Hernández Travieso.
Titulación: Grado en Ingeniería en Tecnologías de la Telecomunicación,
Mención en Sistemas de Telecomunicación.
Universidad: Universidad de Las Palmas de Gran Canaria.
Fecha de lectura: Septiembre de 2016.
Alumno: D. Abrahán Pérez Vega.
Título del Proyecto: Sistemas de Predicción Aplicados sobre las Variables
Meteorológicas.
Tutores: Dr. Carlos M. Travieso González,
José Gustavo Hernández Travieso.
Titulación: Máster Universitario en Ingeniería de Telecomunicación.
Universidad: Universidad de Las Palmas de Gran Canaria.
Fecha de lectura: Febrero de 2015.
Alumno: D. Antonio Luis Herrera Jiménez.
Título del Proyecto: Sistema de Predicción Meteorológico basado en
Redes Neuronales Artificiales.
Tutores: Dr. Carlos M. Travieso González,
José Gustavo Hernández Travieso.
Titulación: Ingeniero de Telecomunicación.
Universidad: Universidad de Las Palmas de Gran Canaria.
Fecha de lectura: Septiembre de 2014.

MODELOS DE PREDICCIÓN METEOROLÓGICA BASADOS EN MÉTODOS DE CLASIFICACIÓN ORIENTADOS A LA
MEJORA DE LA EFICIENCIA ENERGÉTICA EN LOS PROCESOS DE GENERACIÓN.
TESIS DOCTORAL JOSÉ GUSTAVO HERNÁNDEZ TRAVIESO
137
También se ha dado difusión en prensa del proyecto a raíz del Premio obtenido
en la XXXV Convocatoria Premios Ingenieros de Telecomunicación Colegio Oficial de
Ingenieros de Telecomunicación (COIT) y Asociación española de Ingenieros de
Telecomunicación (AEIT):
Entrevista a José Gustavo Hernández Travieso, premio de ‘Ingenieros de
Telecomunicación 2014’. Programa Hoy por Hoy El Drago, Cadena SER,
19 de noviembre de 2015.
http://play.cadenaser.com/audio/081RD010000000311161//
Nota de prensa Universidad de Las Palmas de Gran Canaria,
09 de octubre de 2015.
https://www.ulpgc.es/noticia/estudiante-ulpgc-galardonado-premio-
mejor-trayectoria-academica-xxxv-premios-ingenieros
Nota de prensa Universia News España, 09 de octubre de 2015.
https://es.universianews.net/2015/10/09/un-estudiante-de-master-de-
la-ulpgc-galardonado-con-el-premio-a-la-mejor-trayectoria-academica-
en-los-xxxv-premios-ingenieros-de-telecomunicacion/
Nota de prensa Revista Zona Teleco Canarias nº20, octubre de 2015.
https://issuu.com/acitcanarias/docs/revista_n___20-octubre

MODELOS DE PREDICCIÓN METEOROLÓGICA BASADOS EN MÉTODOS DE CLASIFICACIÓN ORIENTADOS A LA
MEJORA DE LA EFICIENCIA ENERGÉTICA EN LOS PROCESOS DE GENERACIÓN.
TESIS DOCTORAL JOSÉ GUSTAVO HERNÁNDEZ TRAVIESO
138

MODELOS DE PREDICCIÓN METEOROLÓGICA BASADOS EN MÉTODOS DE CLASIFICACIÓN ORIENTADOS A LA
MEJORA DE LA EFICIENCIA ENERGÉTICA EN LOS PROCESOS DE GENERACIÓN.
TESIS DOCTORAL JOSÉ GUSTAVO HERNÁNDEZ TRAVIESO
139

MODELOS DE PREDICCIÓN METEOROLÓGICA BASADOS EN MÉTODOS DE CLASIFICACIÓN ORIENTADOS A LA
MEJORA DE LA EFICIENCIA ENERGÉTICA EN LOS PROCESOS DE GENERACIÓN.
TESIS DOCTORAL JOSÉ GUSTAVO HERNÁNDEZ TRAVIESO
140

MODELOS DE PREDICCIÓN METEOROLÓGICA BASADOS EN MÉTODOS DE CLASIFICACIÓN ORIENTADOS A LA
MEJORA DE LA EFICIENCIA ENERGÉTICA EN LOS PROCESOS DE GENERACIÓN.
TESIS DOCTORAL JOSÉ GUSTAVO HERNÁNDEZ TRAVIESO
141

MODELOS DE PREDICCIÓN METEOROLÓGICA BASADOS EN MÉTODOS DE CLASIFICACIÓN ORIENTADOS A LA
MEJORA DE LA EFICIENCIA ENERGÉTICA EN LOS PROCESOS DE GENERACIÓN.
TESIS DOCTORAL JOSÉ GUSTAVO HERNÁNDEZ TRAVIESO
142

MODELOS DE PREDICCIÓN METEOROLÓGICA BASADOS EN MÉTODOS DE CLASIFICACIÓN ORIENTADOS A LA
MEJORA DE LA EFICIENCIA ENERGÉTICA EN LOS PROCESOS DE GENERACIÓN.
TESIS DOCTORAL JOSÉ GUSTAVO HERNÁNDEZ TRAVIESO
143

MODELOS DE PREDICCIÓN METEOROLÓGICA BASADOS EN MÉTODOS DE CLASIFICACIÓN ORIENTADOS A LA
MEJORA DE LA EFICIENCIA ENERGÉTICA EN LOS PROCESOS DE GENERACIÓN.
TESIS DOCTORAL JOSÉ GUSTAVO HERNÁNDEZ TRAVIESO
144

MODELOS DE PREDICCIÓN METEOROLÓGICA BASADOS EN MÉTODOS DE CLASIFICACIÓN ORIENTADOS A LA
MEJORA DE LA EFICIENCIA ENERGÉTICA EN LOS PROCESOS DE GENERACIÓN.
TESIS DOCTORAL JOSÉ GUSTAVO HERNÁNDEZ TRAVIESO
145

MODELOS DE PREDICCIÓN METEOROLÓGICA BASADOS EN MÉTODOS DE CLASIFICACIÓN ORIENTADOS A LA
MEJORA DE LA EFICIENCIA ENERGÉTICA EN LOS PROCESOS DE GENERACIÓN.
TESIS DOCTORAL JOSÉ GUSTAVO HERNÁNDEZ TRAVIESO
146

MODELOS DE PREDICCIÓN METEOROLÓGICA BASADOS EN MÉTODOS DE CLASIFICACIÓN ORIENTADOS A LA
MEJORA DE LA EFICIENCIA ENERGÉTICA EN LOS PROCESOS DE GENERACIÓN.
TESIS DOCTORAL JOSÉ GUSTAVO HERNÁNDEZ TRAVIESO
147

MODELOS DE PREDICCIÓN METEOROLÓGICA BASADOS EN MÉTODOS DE CLASIFICACIÓN ORIENTADOS A LA
MEJORA DE LA EFICIENCIA ENERGÉTICA EN LOS PROCESOS DE GENERACIÓN.
TESIS DOCTORAL JOSÉ GUSTAVO HERNÁNDEZ TRAVIESO
148