Embed Size (px)
Citation preview

2
Ø The purpose for this analysis was to identify a metric as a tool to understand the progress of glove box removal at the PFP site, specifically RMA/RMC Lines.
Ø Initial analysis revealed re-occurring or systemic situations which stopped work, and or caused a work shift to be missed. Ø Further analysis categorized these situations to provide a specific breakdown for cost and duration impacts to the project.
} Cost & Duration Impacts ◦ RMA/RMC teams, as a whole operation, are
preforming at an efficiency rate of 68%. ◦ This equates to adding an average of 33.5 shifts a
month or 2 ½ weeks to the overall project scope. ◦ Missing shifts at such a level, at cost of $33,771 per
shift, equates to a cost of $1,144,580 to the overall project after each month. ◦ After 7 months the aggregate running total is $8,012,059 ◦ (This figure does not take overtime or its effects into account)
3
4
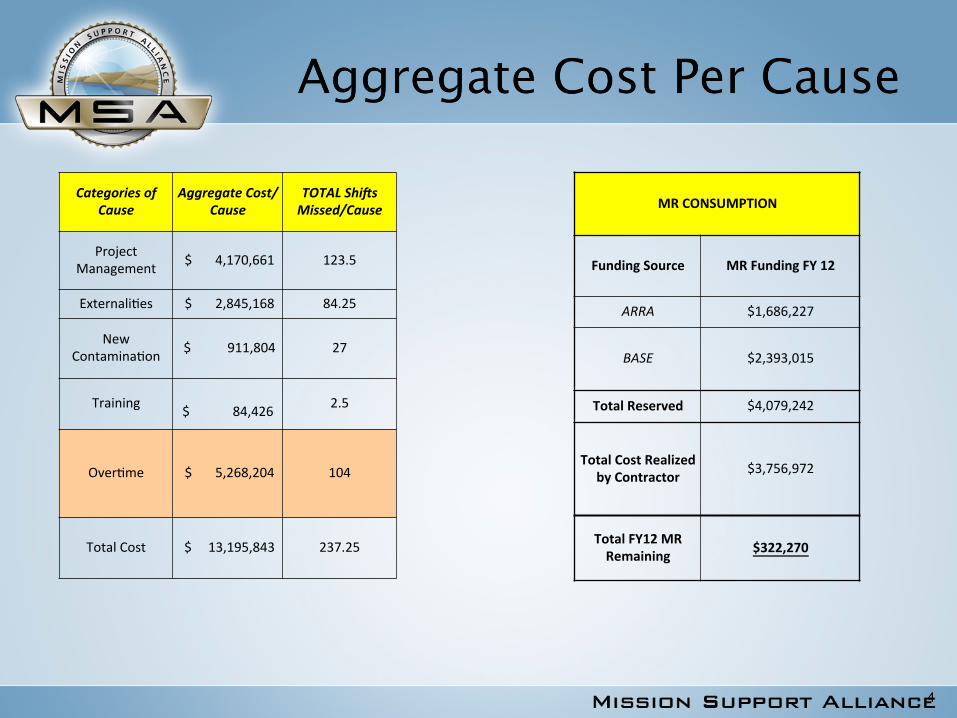
MR CONSUMPTION
Funding Source MR Funding FY 12
ARRA $1,686,227
BASE $2,393,015
Total Reserved $4,079,242
Total Cost Realized by Contractor $3,756,972
Total FY12 MR Remaining $322,270
Categories of Cause
Aggregate Cost/Cause
TOTAL Shi4s Missed/Cause
Project Management $ 4,170,661 123.5
Externali?es $ 2,845,168 84.25
New Contamina?on $ 911,804 27
Training $ 84,426 2.5
Over?me $ 5,268,204 104
Total Cost $ 13,195,843 237.25
5
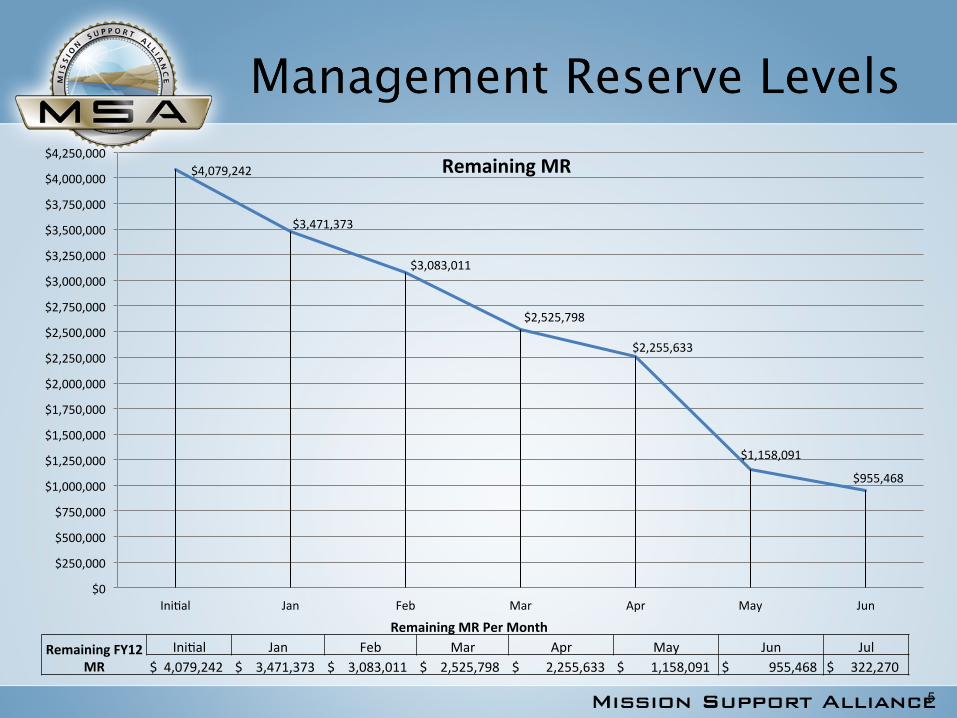
Remaining MR Per Month Remaining FY12
MR Ini?al Jan Feb Mar Apr May Jun Jul
$ 4,079,242 $ 3,471,373 $ 3,083,011 $ 2,525,798 $ 2,255,633 $ 1,158,091 $ 955,468 $ 322,270
$4,079,242
$3,471,373
$3,083,011
$2,525,798
$2,255,633
$1,158,091
$955,468
$0
$250,000
$500,000
$750,000
$1,000,000
$1,250,000
$1,500,000
$1,750,000
$2,000,000
$2,250,000
$2,500,000
$2,750,000
$3,000,000
$3,250,000
$3,500,000
$3,750,000
$4,000,000
$4,250,000
Ini?al Jan Feb Mar Apr May Jun
Remaining MR
6
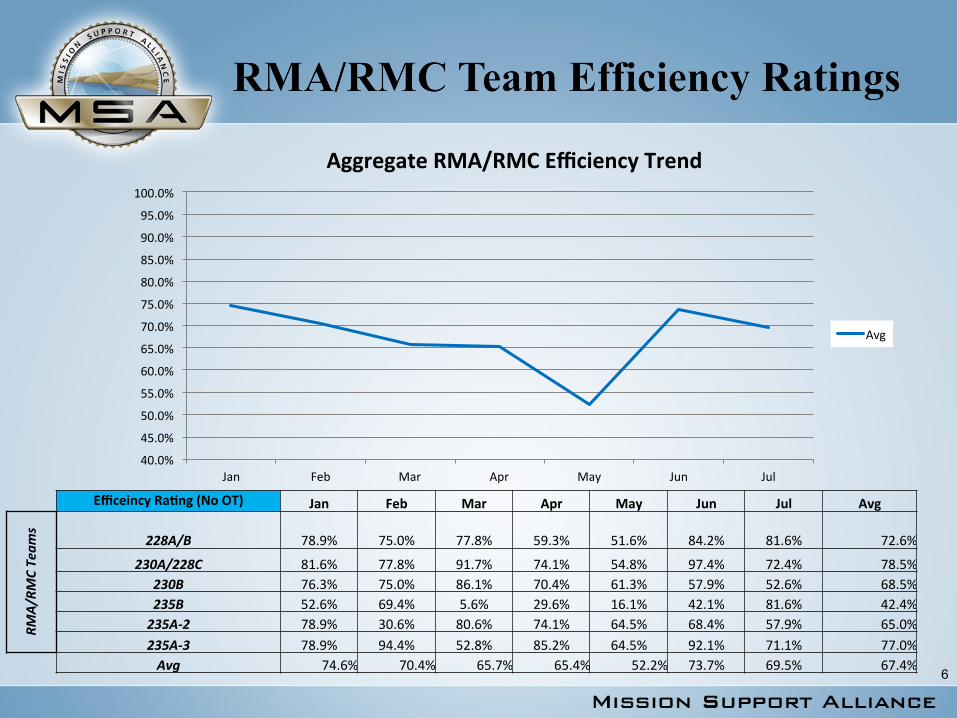
Efficeincy RaMng (No OT) Jan Feb Mar Apr May Jun Jul Avg
RMA/
RMC Team
s
228A/B 78.9% 75.0% 77.8% 59.3% 51.6% 84.2% 81.6% 72.6%
230A/228C 81.6% 77.8% 91.7% 74.1% 54.8% 97.4% 72.4% 78.5% 230B 76.3% 75.0% 86.1% 70.4% 61.3% 57.9% 52.6% 68.5% 235B 52.6% 69.4% 5.6% 29.6% 16.1% 42.1% 81.6% 42.4% 235A-‐2 78.9% 30.6% 80.6% 74.1% 64.5% 68.4% 57.9% 65.0% 235A-‐3 78.9% 94.4% 52.8% 85.2% 64.5% 92.1% 71.1% 77.0%
Avg 74.6% 70.4% 65.7% 65.4% 52.2% 73.7% 69.5% 67.4%
40.0%
45.0%
50.0%
55.0%
60.0%
65.0%
70.0%
75.0%
80.0%
85.0%
90.0%
95.0%
100.0%
Jan Feb Mar Apr May Jun Jul
Aggregate RMA/RMC Efficiency Trend
Avg
7
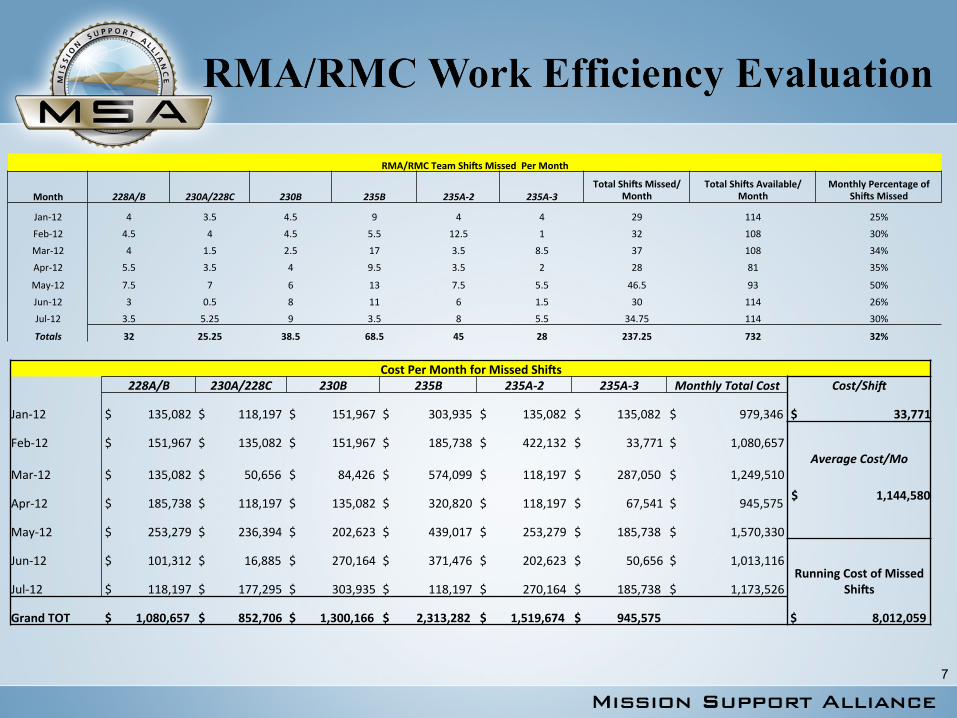
Cost Per Month for Missed ShiUs 228A/B 230A/228C 230B 235B 235A-‐2 235A-‐3 Monthly Total Cost Cost/Shi4
Jan-‐12 $ 135,082 $ 118,197 $ 151,967 $ 303,935 $ 135,082 $ 135,082 $ 979,346 $ 33,771
Feb-‐12 $ 151,967 $ 135,082 $ 151,967 $ 185,738 $ 422,132 $ 33,771 $ 1,080,657
Mar-‐12 $ 135,082 $ 50,656 $ 84,426 $ 574,099 $ 118,197 $ 287,050 $ 1,249,510 Average Cost/Mo
Apr-‐12 $ 185,738 $ 118,197 $ 135,082 $ 320,820 $ 118,197 $ 67,541 $ 945,575 $ 1,144,580
May-‐12 $ 253,279 $ 236,394 $ 202,623 $ 439,017 $ 253,279 $ 185,738 $ 1,570,330
Jun-‐12 $ 101,312 $ 16,885 $ 270,164 $ 371,476 $ 202,623 $ 50,656 $ 1,013,116 Running Cost of Missed
ShiUs Jul-‐12 $ 118,197 $ 177,295 $ 303,935 $ 118,197 $ 270,164 $ 185,738 $ 1,173,526
Grand TOT $ 1,080,657 $ 852,706 $ 1,300,166 $ 2,313,282 $ 1,519,674 $ 945,575 $ 8,012,059
RMA/RMC Team ShiUs Missed Per Month
Month 228A/B 230A/228C 230B 235B 235A-‐2 235A-‐3 Total ShiUs Missed/
Month Total ShiUs Available/
Month Monthly Percentage of
ShiUs Missed
Jan-‐12 4 3.5 4.5 9 4 4 29 114 25%
Feb-‐12 4.5 4 4.5 5.5 12.5 1 32 108 30%
Mar-‐12 4 1.5 2.5 17 3.5 8.5 37 108 34%
Apr-‐12 5.5 3.5 4 9.5 3.5 2 28 81 35%
May-‐12 7.5 7 6 13 7.5 5.5 46.5 93 50%
Jun-‐12 3 0.5 8 11 6 1.5 30 114 26%
Jul-‐12 3.5 5.25 9 3.5 8 5.5 34.75 114 30%
Totals 32 25.25 38.5 68.5 45 28 237.25 732 32%
8
0 2 4 6 8 10 12 14 16 18 20 22 24 26 28 30 32
Jan Feb Mar Apr May Jun Jul
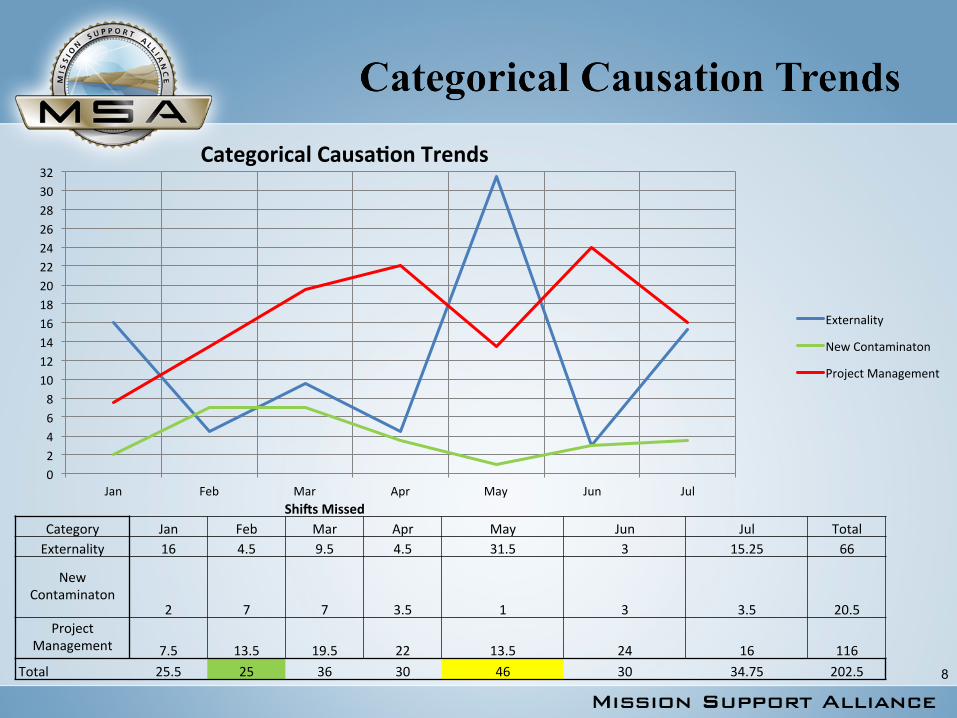
Categorical CausaMon Trends
Externality
New Contaminaton
Project Management
ShiUs Missed Category Jan Feb Mar Apr May Jun Jul Total Externality 16 4.5 9.5 4.5 31.5 3 15.25 66
New Contaminaton
2 7 7 3.5 1 3 3.5 20.5 Project
Management 7.5 13.5 19.5 22 13.5 24 16 116 Total 25.5 25 36 30 46 30 34.75 202.5
9
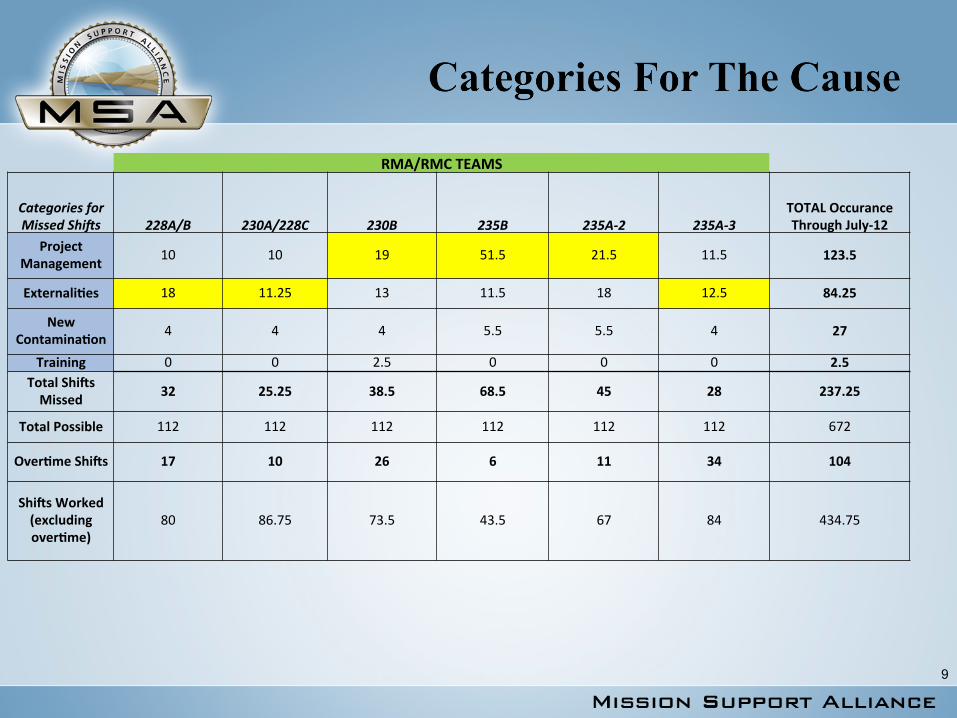
RMA/RMC TEAMS
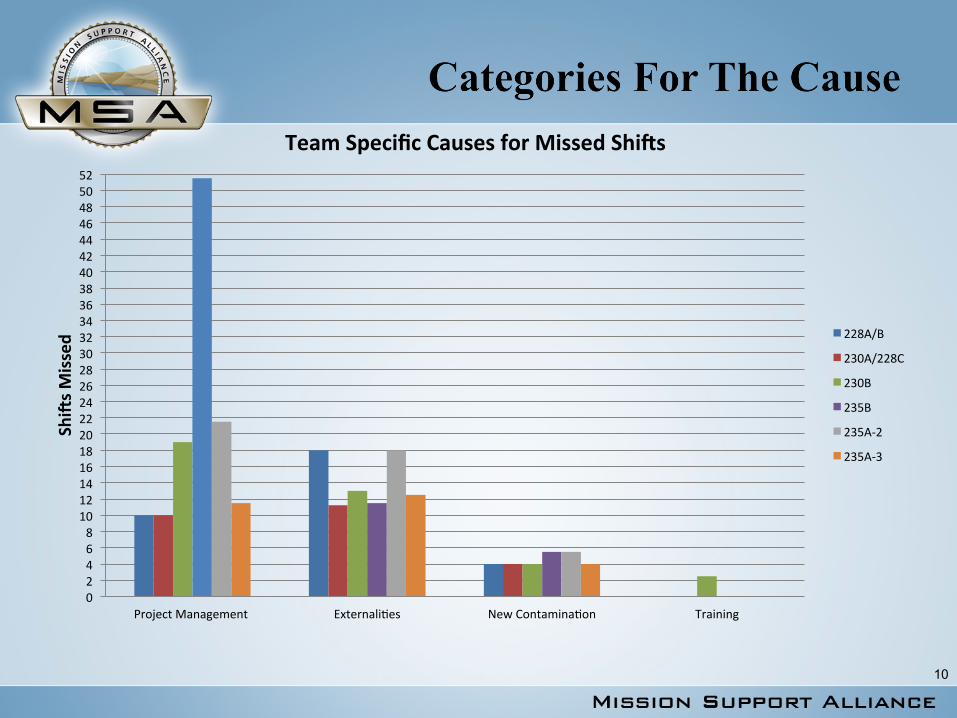
Categories for Missed Shi4s 228A/B 230A/228C 230B 235B 235A-‐2 235A-‐3
TOTAL Occurance Through July-‐12
Project Management 10 10 19 51.5 21.5 11.5 123.5
ExternaliMes 18 11.25 13 11.5 18 12.5 84.25
New ContaminaMon 4 4 4 5.5 5.5 4 27
Training 0 0 2.5 0 0 0 2.5 Total ShiUs Missed 32 25.25 38.5 68.5 45 28 237.25
Total Possible 112 112 112 112 112 112 672
OverMme ShiUs 17 10 26 6 11 34 104
ShiUs Worked (excluding overMme)
80 86.75 73.5 43.5 67 84 434.75
10
0 2 4 6 8 10 12 14 16 18 20 22 24 26 28 30 32 34 36 38 40 42 44 46 48 50 52
Project Management Externali?es New Contamina?on Training
ShiUs M
issed
Team Specific Causes for Missed ShiUs
228A/B
230A/228C
230B
235B
235A-‐2
235A-‐3
} Project Management issues and external factors are causing the bulk of reoccurring issues
} If left unmitigated the project will deplete its management reserve by the end of August FY 12.
11