Embed Size (px)
Citation preview

7/26/2019 xwdcerefec.pdf
http://slidepdf.com/reader/full/xwdcerefecpdf 1/16
ADVANCED PHYSICS LABORATORY
XRF
X-Ray Fluorescence: Energy-Dispersive Technique (EDXRF)
PART I
Introduction and Compulsory Exercises
Author: Natalia Krasnopolskaia, 2009
Last update February, 2011

7/26/2019 xwdcerefec.pdf
http://slidepdf.com/reader/full/xwdcerefecpdf 2/16
2
ContentsObjectives …………………………………………………………………………………..….…..... 3 Glossary ………………………………. …………………………….……………………….……....3
I. Introduction and theoretical background ……………………………………………..……....4
II. Experimental setup ……………………………………………………………………..…….…..61. Safety box and shutter...…………. …………………………………………..….….….7
2. Primary X-ray source ………………………………………………………..……….....8
3. Sample holder .………………………………………………………..……….………..9
4. Detector and processor …………………………….…………………..…….……........9
5. Software ………………………………………….…………………………...……….10
6. Setup procedure for the x-ray spectrometer …..…..…………………………….……..11
III. Compulsory exercises ………………………… ………………………………………….…......12
Exercise 1 (compulsory). Calibration of the multichannel analyzer with radioactive isotopes......12 Exercise 2 (compulsory). Calibration of the multichannel analyzer with a set of pure metals.….14
Turn on procedure for the x-ray tube .……………………………..……..………………………15

7/26/2019 xwdcerefec.pdf
http://slidepdf.com/reader/full/xwdcerefecpdf 3/16
3
Objectives
1. To study the excitation of x-rays in an x-ray tube.
2. To study the production of x-ray fluorescence in a solid sample with primary x-rays, emitted by an
anode of the x-ray tube.
3. To study physical processes in a Si-PIN photodiode used as a detector of the x-ray spectrum.
4. To study the functioning of a multichannel analyzer of the x-ray spectrum and spectra processing.
5.
To identify quantitatively a chemical composition of a solid sample.
All the above is very difficult to cover completely during the time assigned for one experiment in the
labs. Instead, we offer you a number of optional experiments from which you can choose at least one
and the most interesting for you after the discussion with your supervisor. However, the
fundamentals of the x-ray fluorescence phenomenon as well as the basic knowledge of the spectrum
excitation, acquisition and interpretation must be studied by all students taking this experiment. The
two compulsory exercises with all questions answered should be accomplished by the date of the
Progress Check.
GlossaryAttenuation coefficient – a natural logarithm of the ratio of the emergent and incident radiation
intensities I / I 0 divided by either the depth of the radiation penetration (linear attenuation coefficient) orthe surface density (mass absorption coefficient).
Bremsstrahlung – a continuous spectrum produced by a charged particle moving with deceleration.
Continuous spectrum – a spectrum formed by photons with non-quantized energies in a wide range.
Detection limit – a lowest amount of chemical element that can be found with probability of 99%.
Detector resolution – possibility to distinguish two overlapping peaks in the spectrum; depends on the
ratio of the distance between the two peaks and FWHM; usually accepted as a value of FWHM.
Efficiency of a detector – the ratio of the number of photons participated in creation of a useful signal in
the detector to the total number of photons incident on the detector surface.
Energy-dispersive technique – the technique used to simultaneously detect the photons of the line
spectrum in a wide range of energies.
Fluorescence – emission of photons by a substance that has absorbed photons with higher energy.FWHM – f ull width at half maximum of the peak usually measured in electronvolts.
Ionizing radiation – the particles or electromagnetic waves whose energy is sufficient to ionize a neutral
atom or a molecule.
Line spectrum – a spectrum formed by photons with specific quantized energies only.
Matrix effects – The combined effect of all components of the sample other than the analyte on the
measurement of the quantity of the analyte. The two main matrix effects are: (a) the attenuation of
characteristic peak intensity due to inelastic scattering of photons, emitted by atoms of one chemical
element, on atoms and electrons of other components; and (b) the enhancement of characteristic peak
intensity due to additional excitation of atoms of one element by photons, emitted by other components.
Peak intensity – the value proportional to the total number of photons with same energy registered by a
spectrometer and exposed as a bell-shaped curve called the peak . Quantitative analysis – determination of amount of each component (chemical element) of a sample.
Spectral series – series of spectral peaks produced by electron transitions from different energy levels to
one specific energy level; K-series corresponds to all transitions to the lowest possible energy level.
Spectrum – a function of a number of photons versus their energy, or versus their wavelength.
Spectrum background – a component of a spectrum which does not belong to the peak of interest; may
be formed by bremsstrahlung radiation or by the tails of adjacent peaks.
X-ray tube – a kind of a vacuum tube with a filament as a cathode, emitting electrons, and a pure metal
plate as an anode, producing radiation in the x-ray range of electromagnetic spectrum.
7/26/2019 xwdcerefec.pdf
http://slidepdf.com/reader/full/xwdcerefecpdf 4/16
4
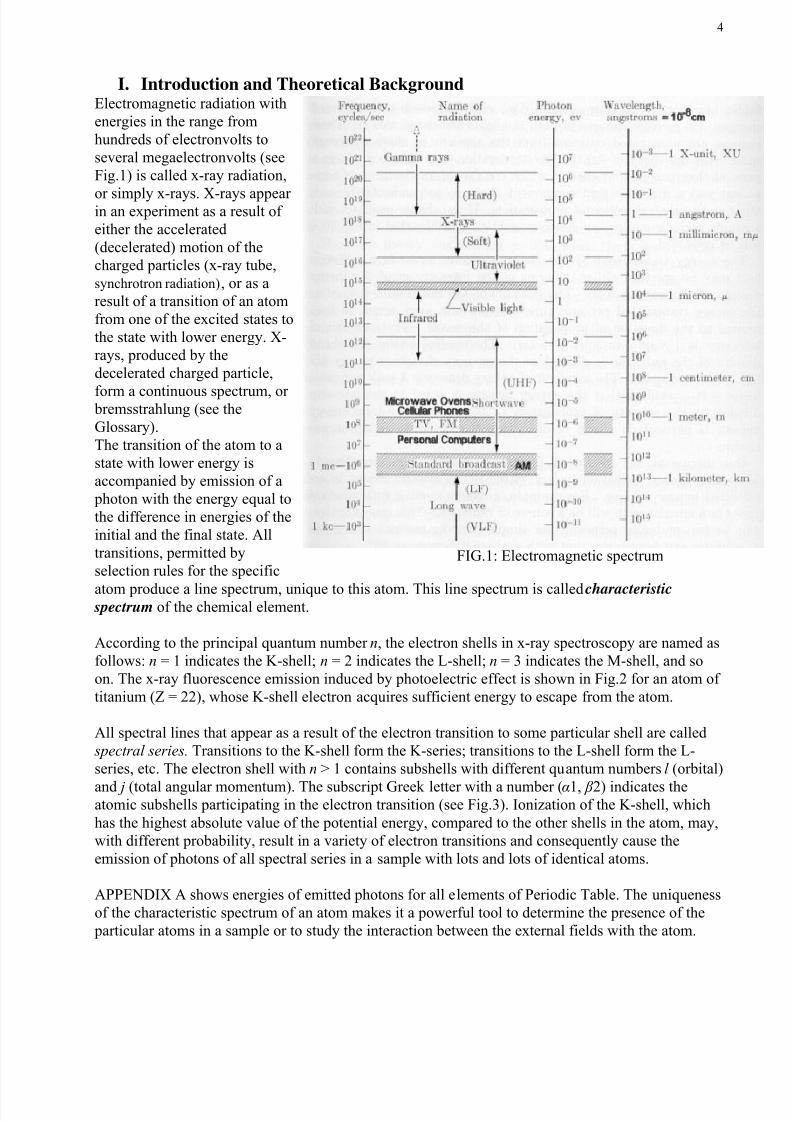
FIG.1: Electromagnetic spectrum
I.
Introduction and Theoretical BackgroundElectromagnetic radiation with
energies in the range from
hundreds of electronvolts to
several megaelectronvolts (see
Fig.1) is called x-ray radiation,
or simply x-rays. X-rays appearin an experiment as a result of
either the accelerated
(decelerated) motion of the
charged particles (x-ray tube,
synchrotron radiation), or as a
result of a transition of an atom
from one of the excited states to
the state with lower energy. X-
rays, produced by the
decelerated charged particle,
form a continuous spectrum, or bremsstrahlung (see the
Glossary).
The transition of the atom to a
state with lower energy is
accompanied by emission of a
photon with the energy equal to
the difference in energies of the
initial and the final state. All
transitions, permitted by
selection rules for the specific
atom produce a line spectrum, unique to this atom. This line spectrum is called characteristic spectrum of the chemical element.
According to the principal quantum number n, the electron shells in x-ray spectroscopy are named as
follows: n = 1 indicates the K-shell; n = 2 indicates the L-shell; n = 3 indicates the M-shell, and so
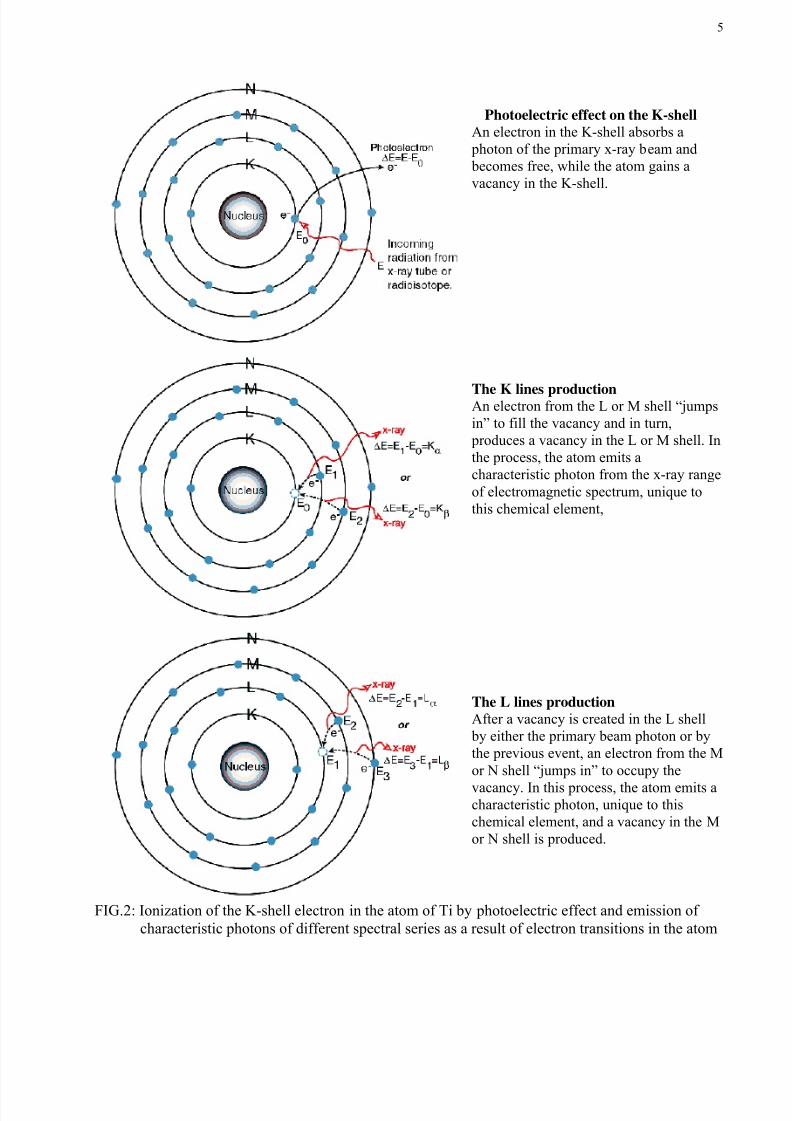
on. The x-ray fluorescence emission induced by photoelectric effect is shown in Fig.2 for an atom of
titanium (Z = 22), whose K-shell electron acquires sufficient energy to escape from the atom.
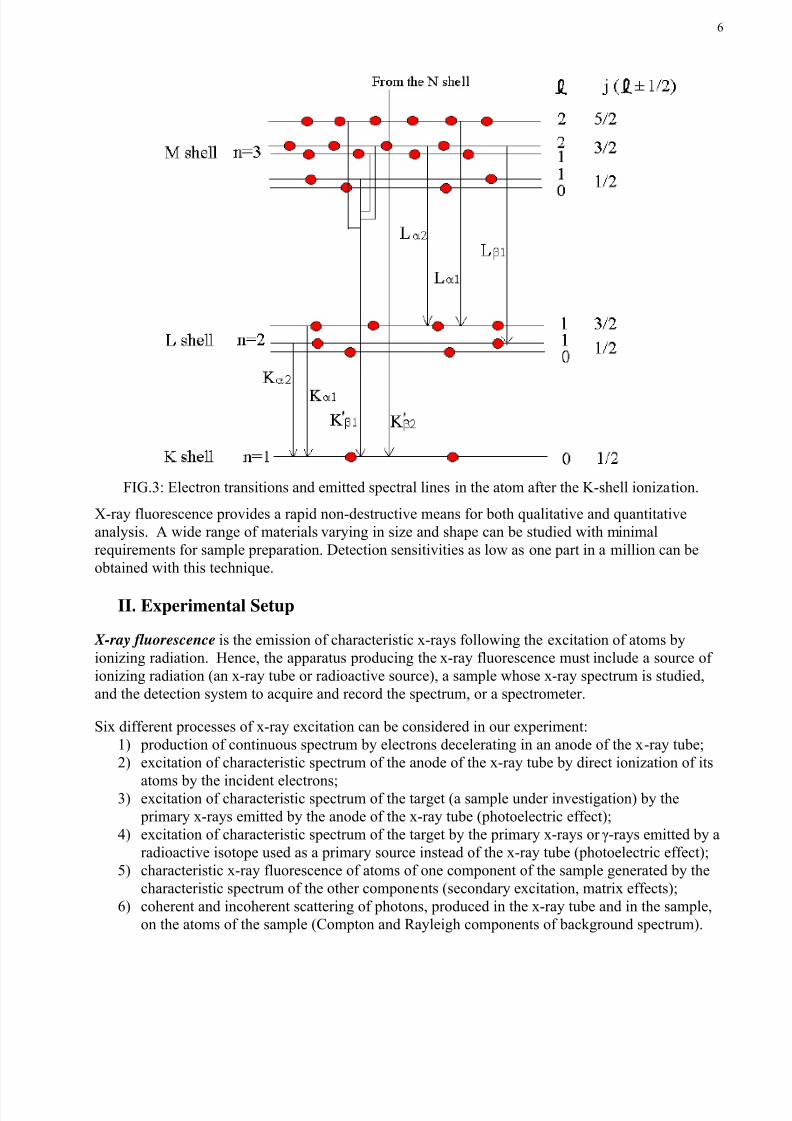
All spectral lines that appear as a result of the electron transition to some particular shell are called
spectral series. Transitions to the K-shell form the K-series; transitions to the L-shell form the L-
series, etc. The electron shell with n > 1 contains subshells with different quantum numbers l (orbital)
and j (total angular momentum). The subscript Greek letter with a number (α1, β 2) indicates theatomic subshells participating in the electron transition (see Fig.3). Ionization of the K-shell, which
has the highest absolute value of the potential energy, compared to the other shells in the atom, may,
with different probability, result in a variety of electron transitions and consequently cause the
emission of photons of all spectral series in a sample with lots and lots of identical atoms.
APPENDIX A shows energies of emitted photons for all elements of Periodic Table. The uniqueness
of the characteristic spectrum of an atom makes it a powerful tool to determine the presence of the
particular atoms in a sample or to study the interaction between the external fields with the atom.
7/26/2019 xwdcerefec.pdf
http://slidepdf.com/reader/full/xwdcerefecpdf 5/16
5
Photoelectric effect on the K-shell
An electron in the K-shell absorbs a
photon of the primary x-ray beam and
becomes free, while the atom gains a
vacancy in the K-shell.
The K lines productionAn electron from the L or M shell “jumps
in” to fill the vacancy and in turn,
produces a vacancy in the L or M shell. In
the process, the atom emits a
characteristic photon from the x-ray range
of electromagnetic spectrum, unique to
this chemical element,
The L lines production
After a vacancy is created in the L shell
by either the primary beam photon or by
the previous event, an electron from the M
or N shell “jumps in” to occupy the
vacancy. In this process, the atom emits acharacteristic photon, unique to this
chemical element, and a vacancy in the M
or N shell is produced.
FIG.2: Ionization of the K-shell electron in the atom of Ti by photoelectric effect and emission of
characteristic photons of different spectral series as a result of electron transitions in the atom
7/26/2019 xwdcerefec.pdf
http://slidepdf.com/reader/full/xwdcerefecpdf 6/16
6
X-ray fluorescence provides a rapid non-destructive means for both qualitative and quantitative
analysis. A wide range of materials varying in size and shape can be studied with minimal
requirements for sample preparation. Detection sensitivities as low as one part in a million can be
obtained with this technique.
II. Experimental Setup
X-ray fluorescence is the emission of characteristic x-rays following the excitation of atoms by
ionizing radiation. Hence, the apparatus producing the x-ray fluorescence must include a source of
ionizing radiation (an x-ray tube or radioactive source), a sample whose x-ray spectrum is studied,
and the detection system to acquire and record the spectrum, or a spectrometer.
Six different processes of x-ray excitation can be considered in our experiment:
1) production of continuous spectrum by electrons decelerating in an anode of the x-ray tube;
2) excitation of characteristic spectrum of the anode of the x-ray tube by direct ionization of its
atoms by the incident electrons;3) excitation of characteristic spectrum of the target (a sample under investigation) by the
primary x-rays emitted by the anode of the x-ray tube (photoelectric effect);
4) excitation of characteristic spectrum of the target by the primary x-rays or γ-rays emitted by a
radioactive isotope used as a primary source instead of the x-ray tube (photoelectric effect);
5) characteristic x-ray fluorescence of atoms of one component of the sample generated by the
characteristic spectrum of the other components (secondary excitation, matrix effects);
6) coherent and incoherent scattering of photons, produced in the x-ray tube and in the sample,
on the atoms of the sample (Compton and Rayleigh components of background spectrum).
FIG.3: Electron transitions and emitted spectral lines in the atom after the K-shell ionization.
7/26/2019 xwdcerefec.pdf
http://slidepdf.com/reader/full/xwdcerefecpdf 7/16
7
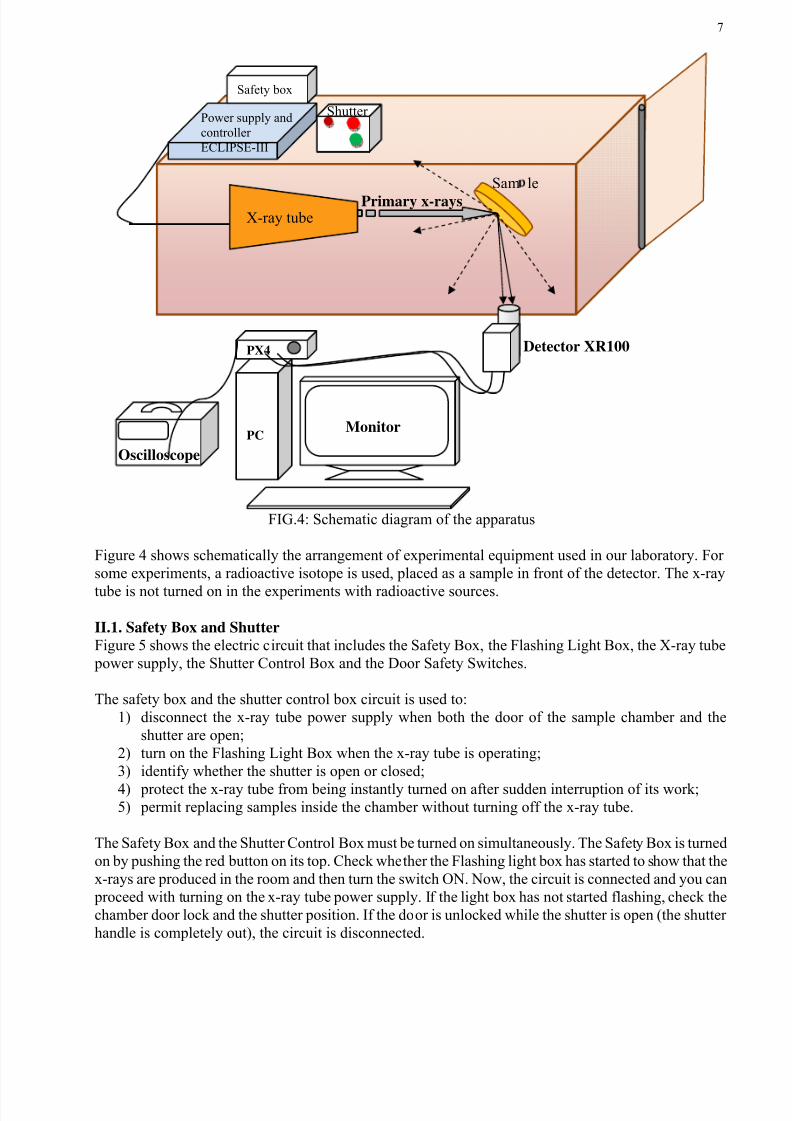
FIG.4: Schematic diagram of the apparatus
Figure 4 shows schematically the arrangement of experimental equipment used in our laboratory. For
some experiments, a radioactive isotope is used, placed as a sample in front of the detector. The x-ray
tube is not turned on in the experiments with radioactive sources.
II.1. Safety Box and Shutter
Figure 5 shows the electric circuit that includes the Safety Box, the Flashing Light Box, the X-ray tube
power supply, the Shutter Control Box and the Door Safety Switches.
The safety box and the shutter control box circuit is used to:
1) disconnect the x-ray tube power supply when both the door of the sample chamber and the
shutter are open;
2) turn on the Flashing Light Box when the x-ray tube is operating;
3) identify whether the shutter is open or closed;
4)
protect the x-ray tube from being instantly turned on after sudden interruption of its work;5) permit replacing samples inside the chamber without turning off the x-ray tube.
The Safety Box and the Shutter Control Box must be turned on simultaneously. The Safety Box is turned
on by pushing the red button on its top. Check whether the Flashing light box has started to show that the
x-rays are produced in the room and then turn the switch ON. Now, the circuit is connected and you can
proceed with turning on the x-ray tube power supply. If the light box has not started flashing, check the
chamber door lock and the shutter position. If the door is unlocked while the shutter is open (the shutter
handle is completely out), the circuit is disconnected.
Sam le
X-ray tube
Power supply and
controller
ECLIPSE-III
Safety box
Oscilloscope
PX4
PCMonitor
Detector XR100
Primary x-rays
Shutter

7/26/2019 xwdcerefec.pdf
http://slidepdf.com/reader/full/xwdcerefecpdf 8/16
8
FIG.5: Safety box and shutter control box circuit.
II.2. Primary X-Ray Source
ECLIPSE-III is a self-contained miniature X-ray tube system, which includes the X-ray tube, the power
supply and the control electronics (FIG.6a). A portable Controller provides both voltage (kV) and current
(µA) display and control. A flashing red LED and a beeper warns the user when x-rays are present.
Some specifications
Anode current: 100 μAMax (3 W max)
Anode (target) voltage: Ground
Cathode voltage: -5 to -30 kV
Current stability: 1% for I >5 μA, 0.5% for I >10 μA
Anode (transmission): Ag
Be window: 250 μm
Cathode type: W filament
Maximum operating temperature not to exceed 40o C (104
o F).
A heated filament of a cathode emits electrons by thermionic emission. The electrons are accelerated
by voltage of tens of kiloelectronvolts applied between the cathode and the plate of the anode. When
energetic electrons are made to slow down by collisions with atoms in the anode of the x-ray tube,
the principal means of energy loss is that of radiation or Bremsstrahlung. The radiation spectrum is
characterized by a continuum (Fig. 6b) with the maximum photon energy determined by the incident
electron energy, E e, so that e E E < , where E is the emitted photon energy. Superimposed on this
continuum will be strong peaks due to fluorescence of the anode material, whose atoms are ionized
by direct impact of speedy electrons.

7/26/2019 xwdcerefec.pdf
http://slidepdf.com/reader/full/xwdcerefecpdf 9/16
9
Since the photon endpoint follows the electron energy, fluorescence can be restricted to a range of
atomic numbers by choosing the accelerating voltage with value in kilovolts that exceeds the
excitation energy of the electron shell, where the vacancy should be produced, in kiloelectronvolts.
For example, the voltage of 25 kV can excite the K-series of atoms of palladium (Z = 46) with the
excitation energy of the K-shell 24.4 keV, but would be useless to produce the K-series of silver (Z =
47) with the excitation energy of the K-shell 25.6 keV.
II.3. Sample Holder
A sample holder is a circular frame with three screws to position the target in the vertical plane
perpendicular to the plane with the x-ray beam from the x-ray tube and the direction from the target
to a detector. All standard samples are either produced in a shape of a thin cylinder or a circular platestuck to a plastic ring. There is a protractor scale under the holder to change the orientation of the
target plane with respect to the incident beam.
II.4. Detector and Processor
The Amptek Inc. X-ray detectors XR-100CR are using Si-
PIN diodes assembled as shown in Fig.7.
Some specifications of XR-100CR
2-stage cooler
13 mm2 / 300 μm
1.0 mil (25 μm) Be
200 - 220 eV (according to the Manufacturer)P/B Ratio: 550/1 (4000/1 with external collimator)
[The Peak to Background (P/B) Ratio is the ratio
of the counts at the 5.9 keV peak to the counts
at about 2 keV].
FIG.6: (a) X-ray tube and high-voltage power supply with the controller box.
b X-ra s ectrum roduced b the x-ra source with 30kV volta e and 100 A current
FIG.7: A unit containing the Si PIN
diode and a Peltier cooler evacuated
and protected with a Beryllium
window
7/26/2019 xwdcerefec.pdf
http://slidepdf.com/reader/full/xwdcerefecpdf 10/16
10
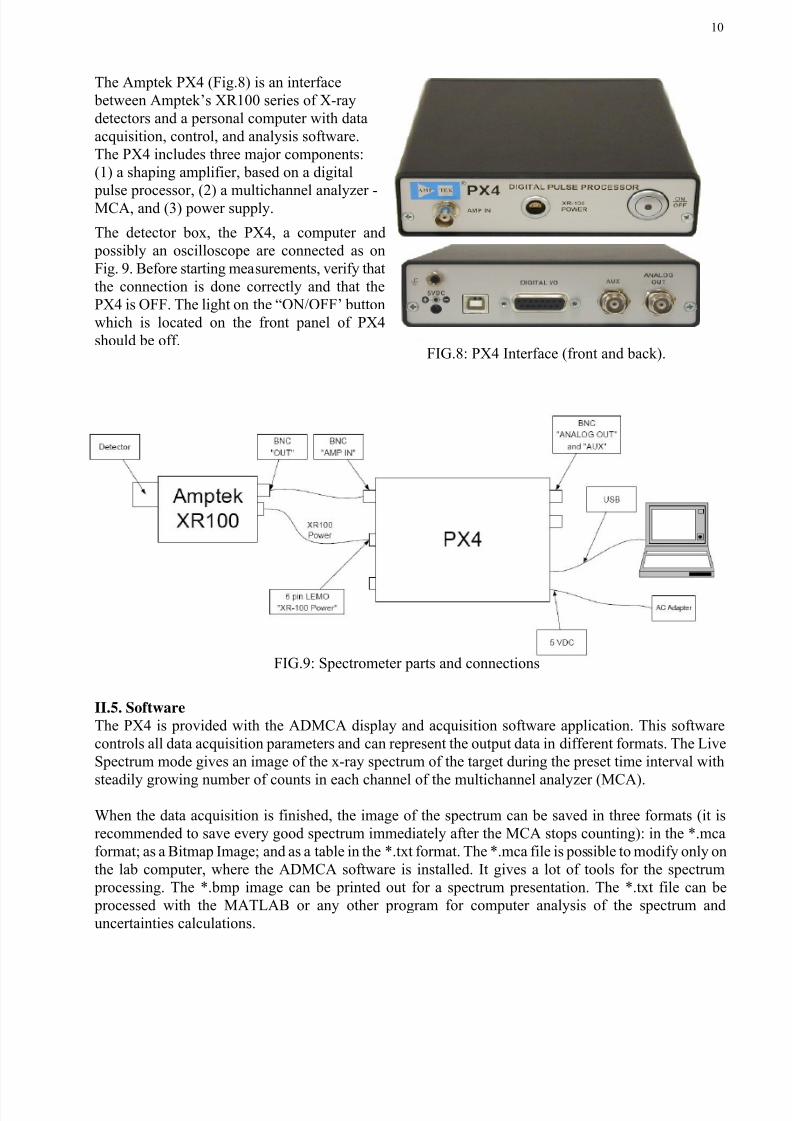
The Amptek PX4 (Fig.8) is an interface
between Amptek’s XR100 series of X-ray
detectors and a personal computer with data
acquisition, control, and analysis software.
The PX4 includes three major components:
(1) a shaping amplifier, based on a digital
pulse processor, (2) a multichannel analyzer -MCA, and (3) power supply.
The detector box, the PX4, a computer and
possibly an oscilloscope are connected as on
Fig. 9. Before starting measurements, verify that
the connection is done correctly and that the
PX4 is OFF. The light on the “ON/OFF’ button
which is located on the front panel of PX4
should be off.
II.5. Software
The PX4 is provided with the ADMCA display and acquisition software application. This software
controls all data acquisition parameters and can represent the output data in different formats. The Live
Spectrum mode gives an image of the x-ray spectrum of the target during the preset time interval with
steadily growing number of counts in each channel of the multichannel analyzer (MCA).
When the data acquisition is finished, the image of the spectrum can be saved in three formats (it is
recommended to save every good spectrum immediately after the MCA stops counting): in the *.mca
format; as a Bitmap Image; and as a table in the *.txt format. The *.mca file is possible to modify only on
the lab computer, where the ADMCA software is installed. It gives a lot of tools for the spectrum
processing. The *.bmp image can be printed out for a spectrum presentation. The *.txt file can be
processed with the MATLAB or any other program for computer analysis of the spectrum and
uncertainties calculations.
FIG.8: PX4 Interface (front and back).
FIG.9: Spectrometer parts and connections

7/26/2019 xwdcerefec.pdf
http://slidepdf.com/reader/full/xwdcerefecpdf 11/16
11
II.6. Setup Procedure for the X-Ray Spectrometer (can be skipped if the default settings are
applicable; verify it with the experiment supervisor)
1. Press the power button labeled “ON/OFF,” which is located on the front panel of the PX4, and
hold it in for less than two seconds. You should hear a single beep. If you hear two beeps, press
the power button again to turn the PX4 off, and be sure to hold the power button for less than two
seconds when turning it back on.
2. Find the ADMCA icon on the left panel of the PC.
3. Launch the PX4 software by opening the ADMCA.exe file.
4. When the “Starting ADMCA” box appears, select PX4 and click “Connect.” The PX4 unit should
now be connected to the software. To verify this, confirm that the correct serial number for the
PX4 is shown in the top right corner of the software. The serial number can be found on the back
panel of the PX4. The USB symbol located at the bottom right corner of the software should be
green.
5. Now that the PX4 is connected, the proper configuration must be selected for the detector. The
ADMCA software includes configurations for most Amptek detectors. These configurations are
identified by the detector material, dimensions, and cooler type.6. To select a configuration select “PX4
Setup” under the “PX4” menu or by
clicking the acquisition setup button on the
toolbar. The dialogue box shown in Fig. 10
will appear. The configurations can be
selected through the dropdown menu
labeled “Read Amptek Detector
Configuration.”
Find the correct detector configuration on p.9
of this Manual in section II.4.
7. Once the correct configuration is selectedfrom the dropdown menu, the indented grey
area above the dropdown menu should read
“Loaded Si 13mm2/300um 2-Stage Cooler
configuration.” Click "Show Current
Configuration" to view the settings. A box
will appear with the settings. Click OK to
exit the box.
8. To apply the selected configuration, click
the “Apply” button. Then select the “OK”
button to exit this dialogue box. It can take
up to 5 minutes for an Amptek detector tostabilize after a configuration has been sent.
9. Now that the PX4 has the loaded the
appropriate configuration for that detector,
some other settings can be done in the
MCA option (Fig.10). You can set the full
number of channels of the MCA and the
time of acquisition. After you have changed
settings in the MCA window, press
“Apply” button.
FIG.10: The dialog box of the PX4

7/26/2019 xwdcerefec.pdf
http://slidepdf.com/reader/full/xwdcerefecpdf 12/16
12
10. Once the detector has stabilized, adjust some of the thresholds which prevent low-end noise and
other unwanted counts from affecting the spectrum. This can be done automatically by the
software. To find the correct gain setting, an acquisition should be started. Place a radioactive
isotope109
Cd in the sample holder in front of the detector. To start an acquisition, press the traffic
light button at the top bar of the screen. The green traffic light actually means same as in the
street, i.e. that you can start. It is red when the data acquisition is in progress.
Follow these steps to adjust the gain:• Make sure that an acquisition has been started. Be sure to REMOVE any sources from in
front of the detector. Open the “PX4 Setup,” as shown previously.
• Click on the “Gain & Pole Zero” tab and then click the “Tune Input Offset” button. The
software will automatically set the input offset for the current Gain setting. Click OK.
• Click the Tune Slow/Fast Thresholds button on the toolbar. This automatically sets both the
slow threshold (LLD) and the fast threshold.
11. It is necessary to readjust the thresholds whenever the gain is changed. This can be done
automatically as explained in the previous step.
A common task is to change the energy range of a system. This is done by adjusting the gain of the
amplifier. A lower gain corresponds to a higher energy range, and a higher gain to a lower energyrange. For example, in Amptek’s digital systems a gain of x100 may correspond to a 15 keV full
scale and a gain of x50 to a 30 keV full scale. To adjust the energy range it is always the gain of the
system that must be changed. It is not enough to change the software calibration only. The software
calibration is only in software. If the software’s calibration is changed without the amplifier’s gain
changing appropriately, the software will be displaying the wrong energy range and peaks will be
incorrectly identified.
Try to change the gain for the same preset time and the same total number of channels to see the
difference. However, if your task is to compare a number of spectra of different samples taken under
same conditions, the same gain must be chosen and set up for all the spectra.
III. Compulsory Exercises
You should verify with your supervisor whether one of the exercises or both should be submitted for
marking.
Exercise 1. Calibration of the multichannel analyzer with radioactive sources
In this exercise, the x-ray tube is not used. Instead, a sample with a radioactive isotope is placed
directly in front of the entrance window of the detector and its radiation is examined with the
spectrometer. The Exercise will make you skilled working with the multichannel analyzer (MCA)
and processing the spectrum with the ADMCA software. Energy for all peaks of the radioactive
isotope (radioisotope) is well known. The goal of the experiment is to obtain the positions of the
peaks in the spectrum of the radioisotope and calibrate the horizontal scale of the multichannelanalyzer (MCA) in energy units (eV).
Once the appropriate gain (full scale energy) is found, the software can be calibrated. The software
must always be calibrated in order to change the channel scale into the energy scale. To accurately
calibrate a spectrum, there must be at least two known peaks in the spectrum. If you have just one
radioisotope, the K α and K β peaks will be used. However, it is preferable to use at least two isotopes
at low and high energy limits of the spectrometer between 5 keV and 30 keV.
To calibrate the scale in the Amptek ADMCA software, see Fig.11 and follow these steps:
7/26/2019 xwdcerefec.pdf
http://slidepdf.com/reader/full/xwdcerefecpdf 13/16
13
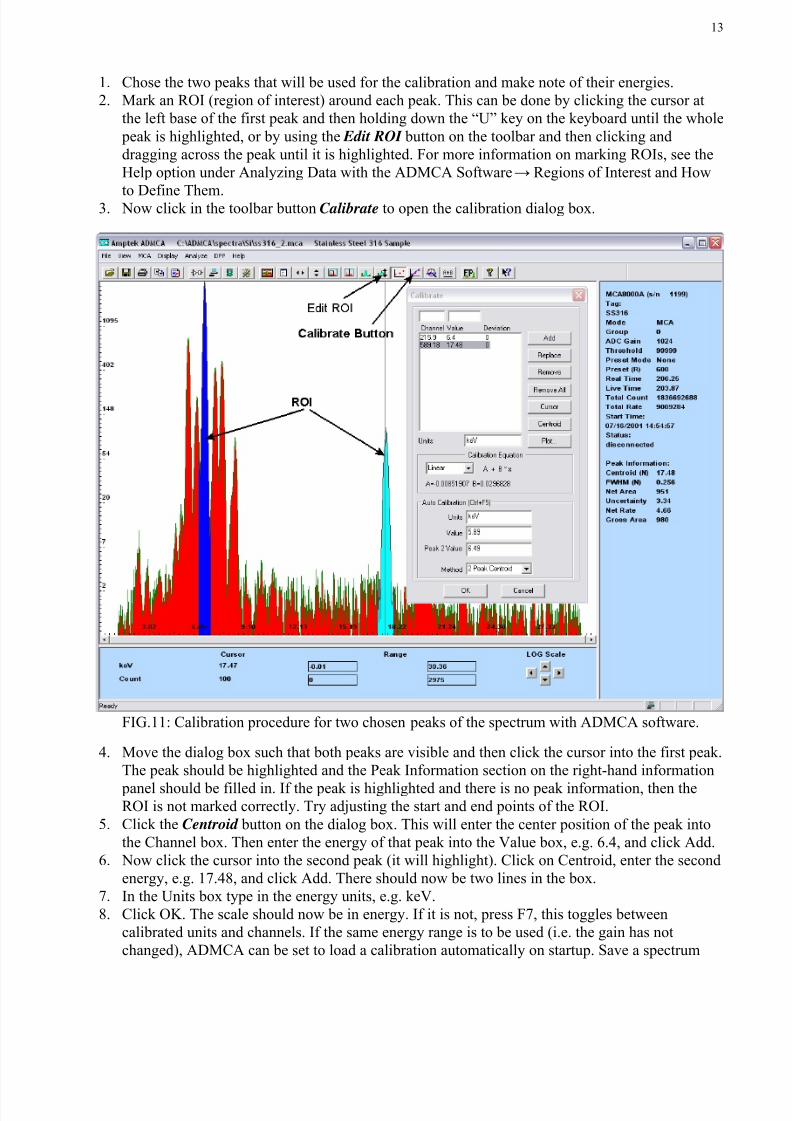
1. Chose the two peaks that will be used for the calibration and make note of their energies.
2. Mark an ROI (region of interest) around each peak. This can be done by clicking the cursor at
the left base of the first peak and then holding down the “U” key on the keyboard until the whole
peak is highlighted, or by using the Edit ROI button on the toolbar and then clicking and
dragging across the peak until it is highlighted. For more information on marking ROIs, see the
Help option under Analyzing Data with the ADMCA Software→ Regions of Interest and How
to Define Them.3. Now click in the toolbar button Calibrate to open the calibration dialog box.
FIG.11: Calibration procedure for two chosen peaks of the spectrum with ADMCA software.
4. Move the dialog box such that both peaks are visible and then click the cursor into the first peak.
The peak should be highlighted and the Peak Information section on the right-hand information
panel should be filled in. If the peak is highlighted and there is no peak information, then theROI is not marked correctly. Try adjusting the start and end points of the ROI.
5. Click the Centroid button on the dialog box. This will enter the center position of the peak into
the Channel box. Then enter the energy of that peak into the Value box, e.g. 6.4, and click Add.
6. Now click the cursor into the second peak (it will highlight). Click on Centroid, enter the second
energy, e.g. 17.48, and click Add. There should now be two lines in the box.
7. In the Units box type in the energy units, e.g. keV.
8. Click OK. The scale should now be in energy. If it is not, press F7, this toggles between
calibrated units and channels. If the same energy range is to be used (i.e. the gain has not
changed), ADMCA can be set to load a calibration automatically on startup. Save a spectrum

7/26/2019 xwdcerefec.pdf
http://slidepdf.com/reader/full/xwdcerefecpdf 14/16
14
that has been calibrated by following the steps above. Click on the View menu and select
Preferences. On the General tab in Spectrum Template enter in the path and file name of the file
that was just saved. Check Load Calibration on Startup and click OK. ADMCA will now
automatically load that calibration every time it opens.
In addition, a calibration can be applied from one file to another. For this procedure see the Help file
(F1) under Analyzing Data with the ADMCA Software -> Calibrating a Spectrum / Applying a
Calibration.
======================================================================
QUESTION 1.
For calibration with109
Cd isotope, explain the difference in the values of the energy of the CdK α
peak as given in APPENDIX A and the actual highest peak energy of 22.16 keV.
======================================================================
Exercise 1I (compulsory). Calibration of the multichannel analyzer with a set of pure metals
This exercise is done with the x-ray tube whose primary x-rays induce x-ray fluorescence in a sample
produced of a pure metal. As it was stated in the previous exercise, the software must always be
calibrated in order to change the channel scale into an energy scale. There is a box with a set of
samples for calibration in the lab room. To accurately calibrate a spectrum in a wide range of
energies, as many known peaks as possible should be used.
Before starting the data acquisition, you must choose the samples for the most effective calibration
procedure. The spectrometer allows registering characteristic peaks in the range between 5 keV and
30 keV. The table in APPENDIX A gives the first peak with the energy close to the lower limit as the
K α peak of vanadium (Z= 23, symbol of element V) with its energy of about 5 keV. To choose the
sample with the peak close to the upper limit of the MCA, you should check x-ray excitation energies
in the table of APPENDIX B. The 30-keV primary x-rays can ionize the energy levels with energies
under 30 keV and consequently induce x-ray fluorescence that follows the electron transition to this
level. Hence, the best samples to calibrate the upper range of the MCA are cadmium (Z = 48,
excitation energy of the Cd K-level is 26.8 keV) or tin (Z = 50, energy of excitation of the Sn K-
level is 29.3 keV). The energy of Sn K α is 25.3 keV, which is lower than possible energy limit.
======================================================================
QUESTION 2.
Explain the difference in the values of excitation energy of the K-level (K electron shell) and the K α
peak and write the explanation into the notebook.
======================================================================
Each sample, selected for calibration, will be represented by at least two high peaks for the K-series and
L-series (see APPENDIX A). To improve the quality of calibration, it is recommended to select three tofour more chemical elements with their characteristic peaks evenly distributed between extreme
characteristic peaks of the two primarily selected elements.
Examine the sample you will take for the first data acquisition: its surface must be smooth, clean and
plane. Place the sample into the sample holder, tighten the screws with care and give the plane of the
sample orientation of 45o of the angle of incidence of the primary x-rays from the x-ray tube. This
position also matches the 45o of the exit angle for the fluorescence beam from the sample to the detector.
Now, close the door of the sample chamber and lock it.

7/26/2019 xwdcerefec.pdf
http://slidepdf.com/reader/full/xwdcerefecpdf 15/16
15
Turn-On Procedure for the X-Ray Tube
To turn on the high voltage power supply for the x-ray tube and to set up voltage and current, you will
use the switch ON/OFF on the back panel of the ECLIPSE-III Controller, the ENABLE switch, the
PRESET button, the voltage tuning knob and the current tuning knob on the front panel of the controller
(Fig.6a).
• Start with turning on the Safety Box as explained in section II.1 on page 7. The next steps are:
•
Turn on the Shutter Control Box and push the shutter’s handle completely in to close the shutter.• Turn on the switch at the back of the ECLIPSE-III controller.
• Press and hold the PRESET button on the front panel of the controller.
• With PRESET button pressed set both the kV and A to “10” on both meters.
• Let go off the PRESET button. (Warning: The kV setting must be greater than 4 kV).
• Press the ENABLE switch to “|”. The ECLIPSE-III is now producing x-rays. The RED HV LED
on the Controller is now flashing and the Beeper sounds. For your safety and for the safety of
others, the Beeper should be left ON at all times. If the Beeper does not sound, press IN the red
AUDIO CONTROL button at the back of the Controller.
The voltage and current monitors now show the actual x-ray tube condition. In order to extend
the life of the tube, always turn high voltage off by pressing the ENABLE switch to “0” when the
tube is not in use. Also avoid operating the system at full output power (30 kV and 100 μA).• Slowly increase the voltage and current values following the example below:
- Slowly turn the knob for kV to “15” and then slowly turn the knob for A to “30”. Wait 10
seconds.
- Increase kV to “25” and then increase A to “50”. You can stop with V = 25 kV or proceed with
increasing voltage across the tube if the spectrum of interest contains energies higher than 25
keV. If you have decided to proceed with voltage increase, wait 10 seconds.
- Increase kV to “30 and then increase A to “100” – these settings should never be exceeded!
• Open the door of the sample chamber and mount a sample on the sample holder.
• Close the door
•
Open the shutter by pulling the shutter handle completely out. Now, the machine is ready for dataacquisition.
When the Controller detects a fault, the output voltage is cut off and the fault YELLOW HV LED turns
on. In this case, stop the experiment, turn the V and A knobs fully counterclockwise and report the fault
to the lab technician or your supervisor.
======================================================================
QUESTION 3.
Using the table of APPENDIX B, determine the last element that can be identified with its
characteristic x-ray spectrum if the x-ray tube voltage is set up to 25 kV.
======================================================================
After the spectrum of the first sample is taken and processed by the software, close the shutter by pulling
the shutter’s handle completely in. Open the door of the sample chamber, change the sample, lock the
chamber door and open the shutter. The apparatus is ready for the next spectrum acquisition.
For each sample, find the position of the K α and K β or Lα and Lβ peaks, as in the Exercise I. Using any
software, apply the linear fit to the entire number of peaks from the Exercises I and II, find the slope with
its error and print out the calibration line for your further experiments. Take into account that the
calibration is done for specific gain, time of acquisition and the total number of channels of the MCA. As
soon as you decide to change any of these settings, you will have to calibrate the analyzer for the new
conditions.

7/26/2019 xwdcerefec.pdf
http://slidepdf.com/reader/full/xwdcerefecpdf 16/16
16
=======================================================================
QUESTION 4.
Basing on the obtained calibration, explain why you are using the average value for the energy of K α1
and K α2 peaks, the average value for a number of K β peaks and so on, instead of using the precise
value of energy of each characteristic line according to Fig. 3 of Introduction (page 6).
If you have taken all spectra you planned, slowly and carefully decrease voltage and current in thereverse order compared to the turn-on procedure by turning the knobs for kV and A of the controller
completely counterclockwise. Close the shutter.