Embed Size (px)
Citation preview

IDENTIFICACION DE
PROTEINAS POR
ESPECTROMETRIA DE
MASAS

MAPEO PEPTIDICO
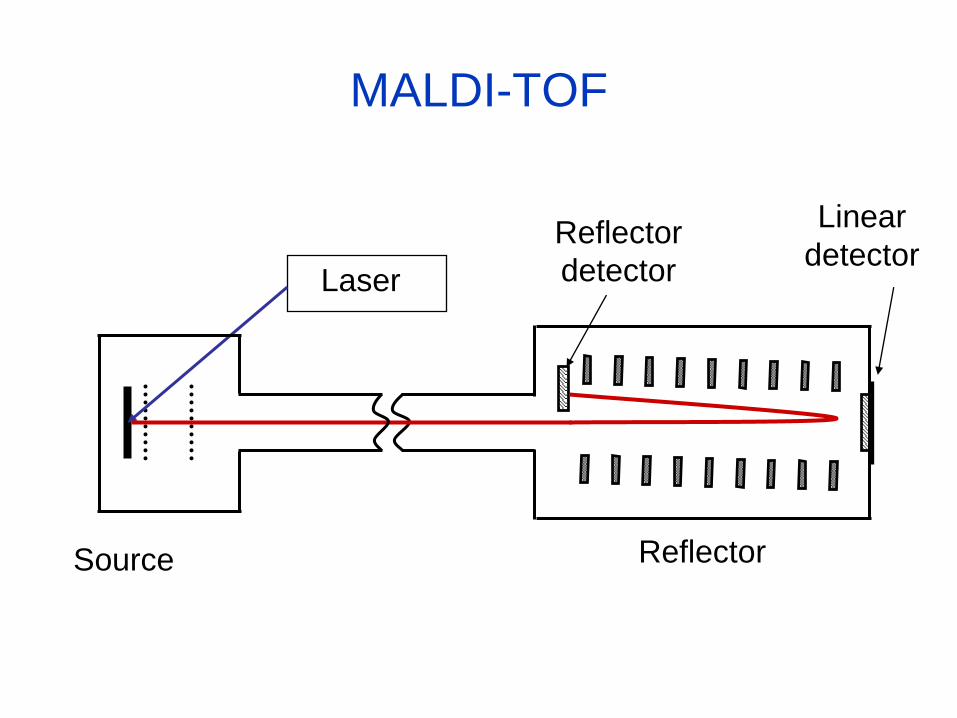
Laser
ReflectorSource
Linear
detectorReflector
detector
MALDI-TOF

0
2000
4000
6000
8000
10000
12000
14000
1000 1500 2000 2500 3000
Inte
nsi
dad
m/z
MALDI-TOF PEPTIDE MAP
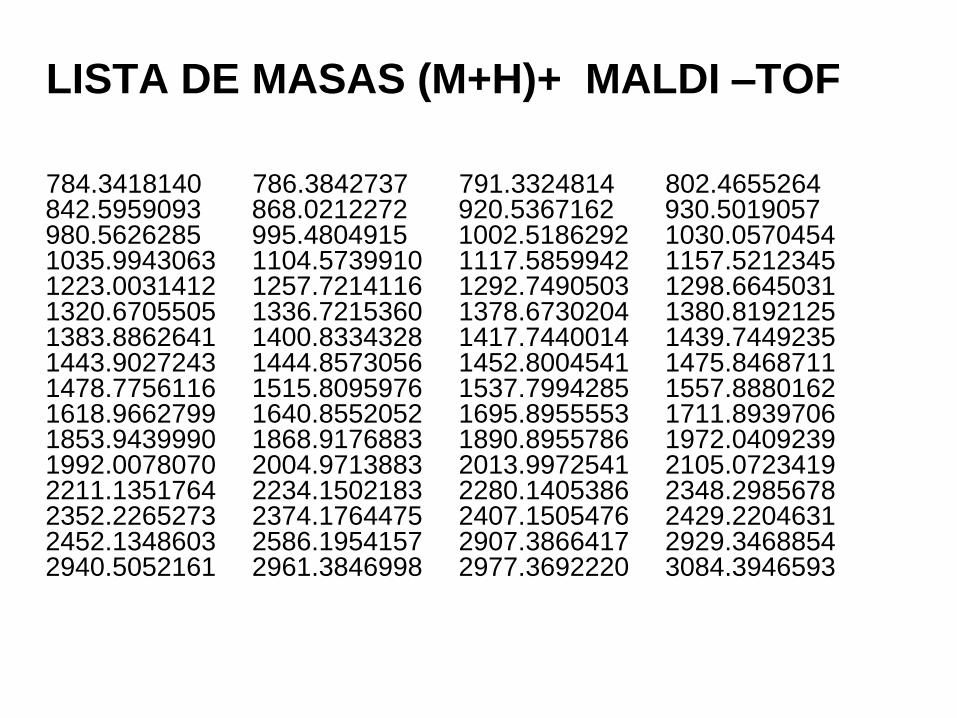
LISTA DE MASAS (M+H)+ MALDI –TOF
784.3418140 786.3842737 791.3324814 802.4655264 842.5959093 868.0212272 920.5367162 930.5019057 980.5626285 995.4804915 1002.5186292 1030.0570454 1035.9943063 1104.5739910 1117.5859942 1157.5212345 1223.0031412 1257.7214116 1292.7490503 1298.6645031 1320.6705505 1336.7215360 1378.6730204 1380.8192125 1383.8862641 1400.8334328 1417.7440014 1439.7449235 1443.9027243 1444.8573056 1452.8004541 1475.8468711 1478.7756116 1515.8095976 1537.7994285 1557.8880162 1618.9662799 1640.8552052 1695.8955553 1711.8939706 1853.9439990 1868.9176883 1890.8955786 1972.0409239 1992.0078070 2004.9713883 2013.9972541 2105.0723419 2211.1351764 2234.1502183 2280.1405386 2348.2985678 2352.2265273 2374.1764475 2407.1505476 2429.2204631 2452.1348603 2586.1954157 2907.3866417 2929.3468854 2940.5052161 2961.3846998 2977.3692220 3084.3946593
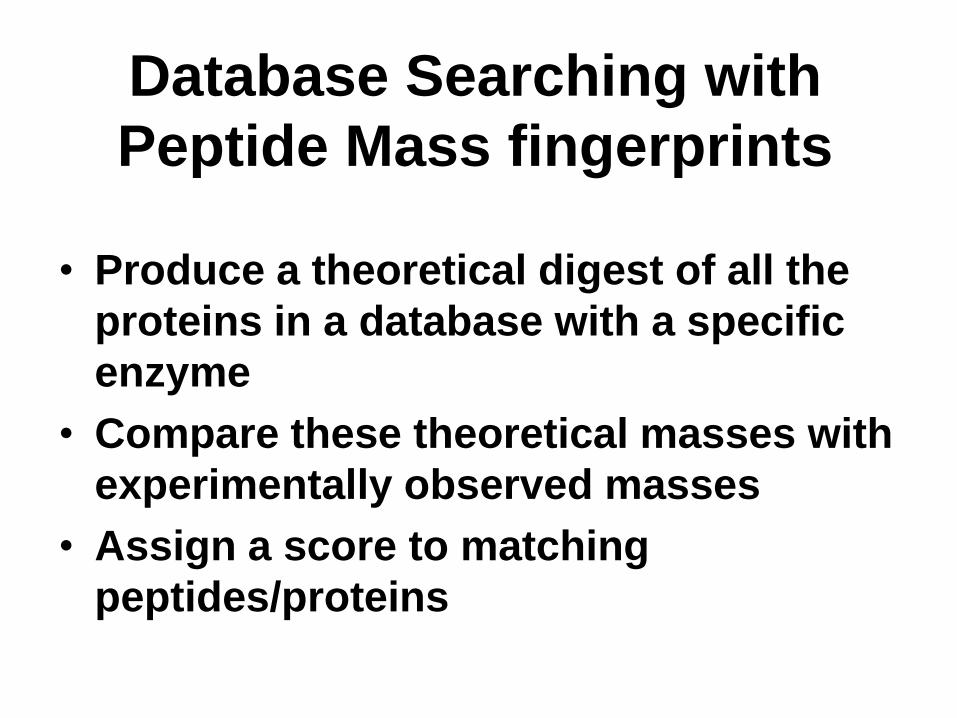
Database Searching with
Peptide Mass fingerprints
• Produce a theoretical digest of all the
proteins in a database with a specific
enzyme
• Compare these theoretical masses with
experimentally observed masses
• Assign a score to matching
peptides/proteins
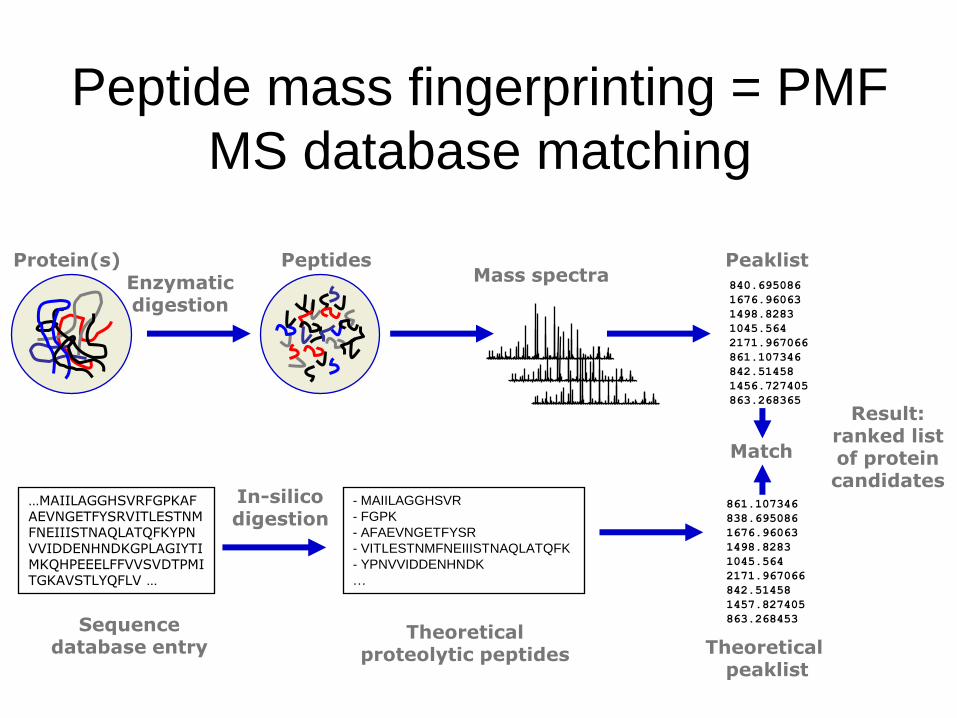
Peptide mass fingerprinting = PMF
MS database matching
Enzymaticdigestion
In-silicodigestion
Protein(s) Peptides840.695086
1676.96063
1498.8283
1045.564
2171.967066
861.107346
842.51458
1456.727405
863.268365
Mass spectraPeaklist
…MAIILAGGHSVRFGPKAFAEVNGETFYSRVITLESTNMFNEIIISTNAQLATQFKYPNVVIDDENHNDKGPLAGIYTIMKQHPEEELFFVVSVDTPMITGKAVSTLYQFLV …
- MAIILAGGHSVR
- FGPK
- AFAEVNGETFYSR
- VITLESTNMFNEIIISTNAQLATQFK
- YPNVVIDDENHNDK
…
Sequence database entry
861.107346
838.695086
1676.96063
1498.8283
1045.564
2171.967066
842.51458
1457.827405
863.268453
Theoretical peaklist
Theoretical proteolytic peptides
Match
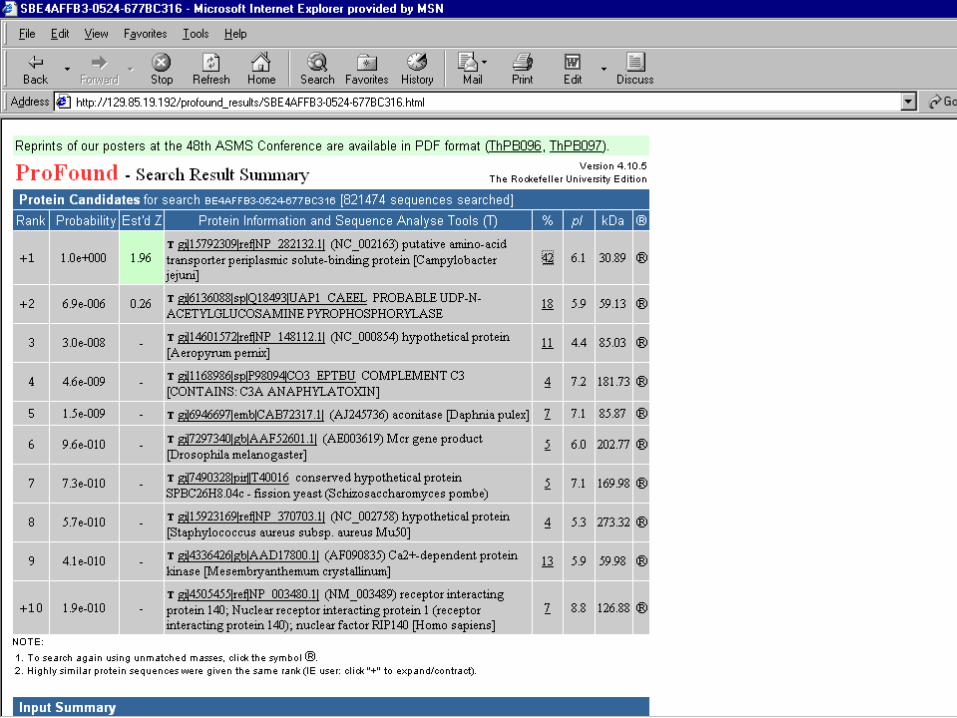
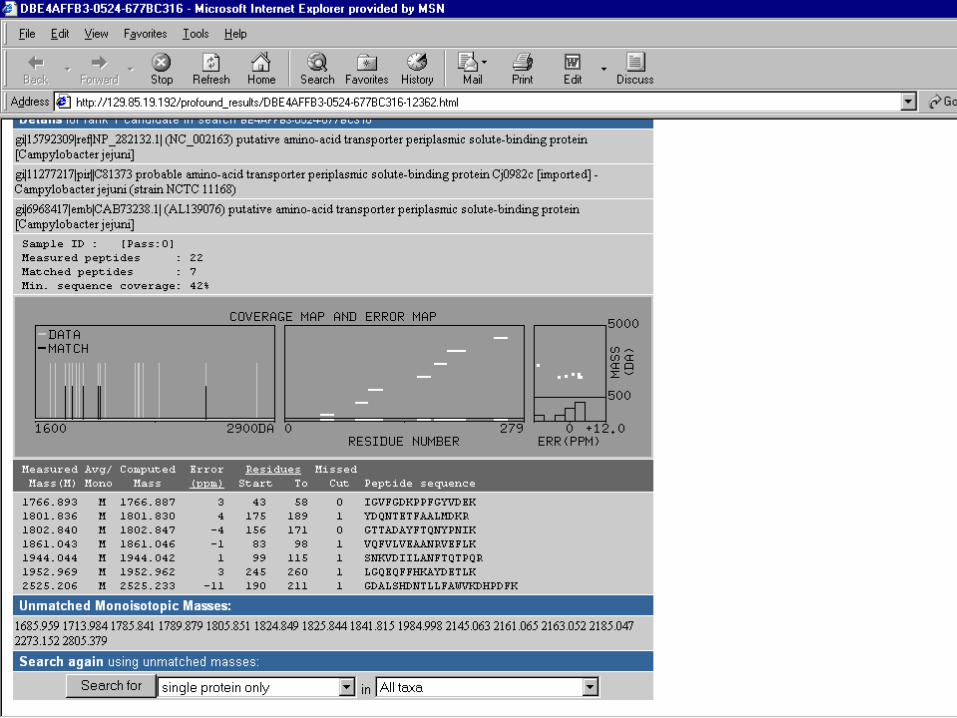
Result: ranked list of protein candidates

578.4650
759.4258
823.5573
842.4996
847.4735
958.4569
1045.5183
1073.5519
1179.5375
1234.6153
1277.6628
1307.6242
1319.6409
1393.7345
1435.6503
1458.6973
1475.6994
1607.8008
1638.8254
1702.7632
1708.8902
1881.9862
1891.9032
1947.9970
1993.9588
2036.9506
2065.9937
2191.1330
2211.0996
2249.0684
2284.1556
2403.2098
2705.1716
2717.1385
2754.3835
2807.3473
3340.7427
3810.9065
Experimental obtained Peak List
578.4650
759.4258
823.5573
842.4996
847.4735
958.4569
1045.5183
1073.5519
1179.5375
1234.6153
1277.6628
1307.6242
1319.6409
1393.7345
1435.6503
1458.6973
1475.6994
1607.8008
1638.8254
1702.7632
1708.8902
1881.9862
1891.9032
1947.9970
1993.9588
2036.9506
2065.9937
2191.1330
2211.0996
2249.0684
2284.1556
2403.2098
2705.1716
2717.1385
2754.3835
2807.3473
3340.7427
3810.9065
578.465
759.425
823.557
842.499
847.473
958.456
1045.518
1073.551
1179.537
1234.615
1277.662
1307.624
1319.640
1393.734
1435.650
1458.697
1475.699
1607.800
1638.825
1702.763
1708.890
1881.982
1891.903
1947.997
1993.958
2036.950
2065.993
2191.133
2211.099
2249.068
2284.155
2403.209
2705.171
2717.135
2754.383
2807.347
3340.742
3810.906
578.4650
759.4258
823.5573
842.4996
847.4735
958.4569
1045.5183
1073.5519
1179.5375
1234.6153
1277.6628
1307.6242
1319.6409
1393.7345
1435.6503
1458.6973
1475.6994
1607.8008
1638.8254
1702.7632
1708.8902
1881.9862
1891.9032
1947.9970
1993.9588
2036.9506
2065.9937
2191.1330
2211.0996
2249.0684
2284.1556
2403.2098
2705.1716
2717.1385
2754.3835
2807.3473
3340.7427
3810.9065
739.4523
1039.6412
1045.6026
1130.6069
1153.6036
1173.6547
1216.6140
1277.7128
1331.7125
1377.7807
1427.7627
1467.8732
1475.8187
1501.7571
1519.7985
1532.7814
1583.8208
1623.8369
1629.8832
1639.9686
1645.8650
1699.9806
1719.0006
1752.8911
1775.8374
1790.9179
1850.9461
1924.9963
1959.0290
1982.0410
1993.9696
2063.0936
2126.0578
2225.1160
2230.1678
2284.1491
2298.1760
2469.1638
Theoretical obtained Peak Lists (database)
Comparison

• ESPECTROMETRIA DE MASAS QUE SEA ADECUADA PARA PEPTIDOS>>>>
METODOS DE IONIZACION SUAVES>>> MALDI o ESI.
EN APARATOS COMERCIALES A PRINCIPIO DE LOS AÑOS 90
• BASES DE DATOS PUESTAS AL DIA CON EL MAYOR NUMERO POSIBLE DE ENTRADAS: 20,000 en1989; 5.6x10⁶ en Diciembre 2007
• PROGRAMAS DE COMPARACION; LOS PRIMEROS APARECIERON EN 1993
QUÉ ES NECESARIO PARA
REALIZAR UN MAPEO PEPTÍDICO
(PMF, Peptide Mass Fingerprinting)
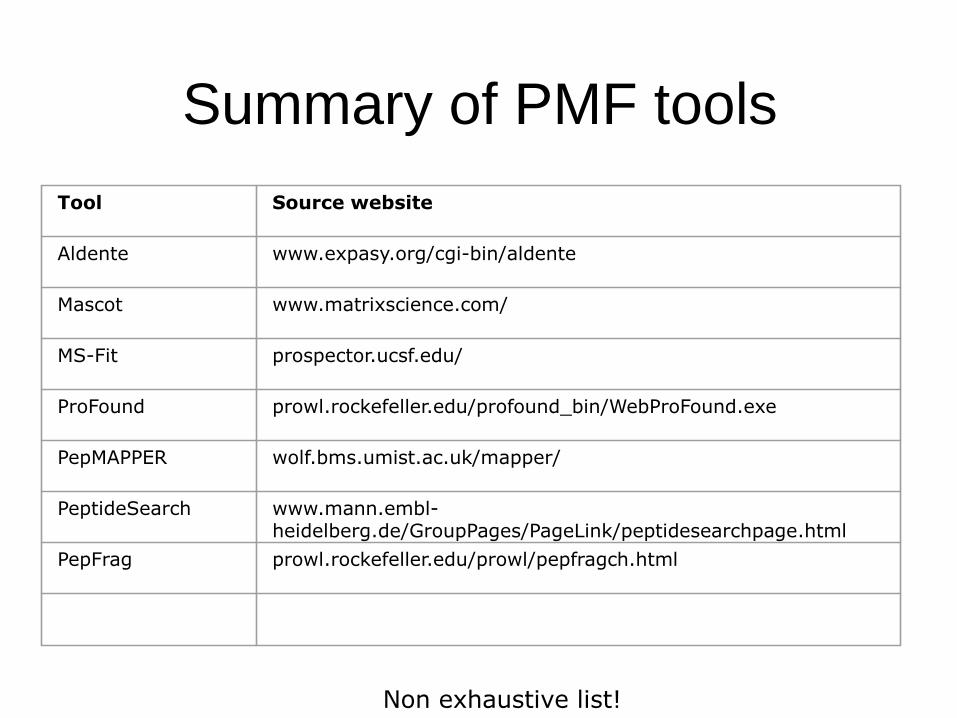
Summary of PMF tools
Tool Source website
Aldente www.expasy.org/cgi-bin/aldente
Mascot www.matrixscience.com/
MS-Fit prospector.ucsf.edu/
ProFound prowl.rockefeller.edu/profound_bin/WebProFound.exe
PepMAPPER wolf.bms.umist.ac.uk/mapper/
PeptideSearch www.mann.embl-heidelberg.de/GroupPages/PageLink/peptidesearchpage.html
PepFrag prowl.rockefeller.edu/prowl/pepfragch.html
Non exhaustive list!

http://www.expasy.org/tools/
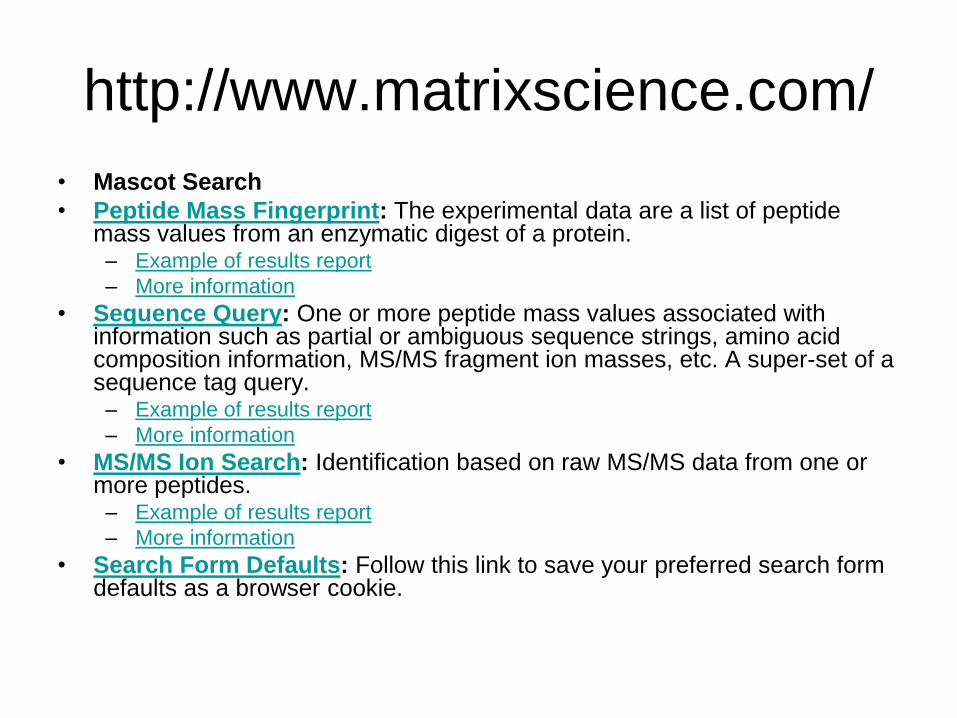
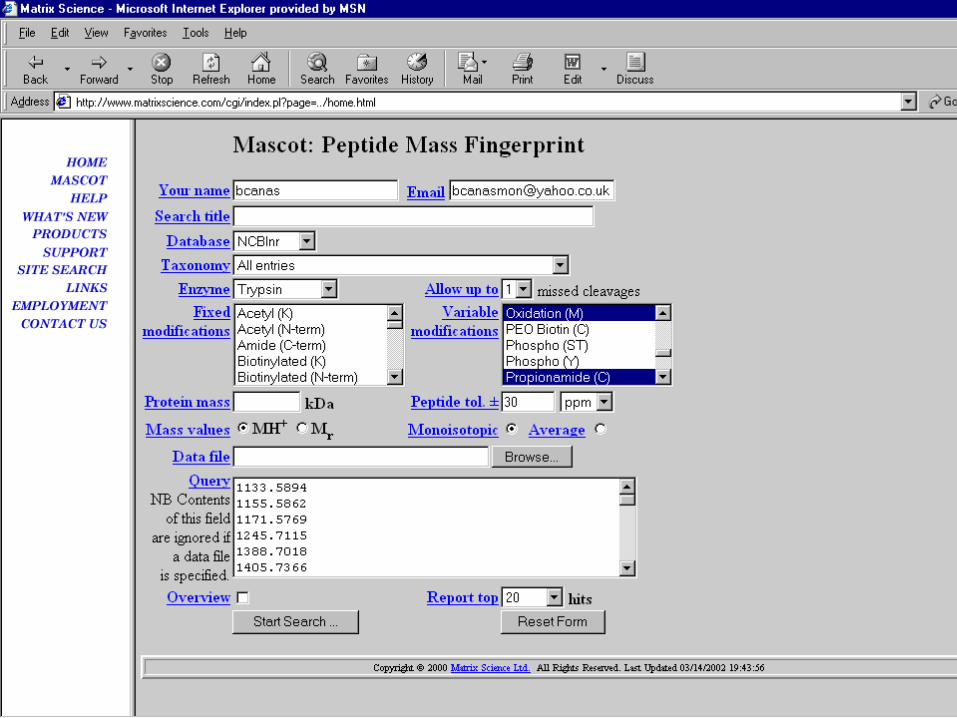
http://www.matrixscience.com/
• Mascot Search
• Peptide Mass Fingerprint: The experimental data are a list of peptide mass values from an enzymatic digest of a protein. – Example of results report
– More information
• Sequence Query: One or more peptide mass values associated with information such as partial or ambiguous sequence strings, amino acid composition information, MS/MS fragment ion masses, etc. A super-set of a sequence tag query. – Example of results report
– More information
• MS/MS Ion Search: Identification based on raw MS/MS data from one or more peptides. – Example of results report
– More information
• Search Form Defaults: Follow this link to save your preferred search form defaults as a browser cookie.
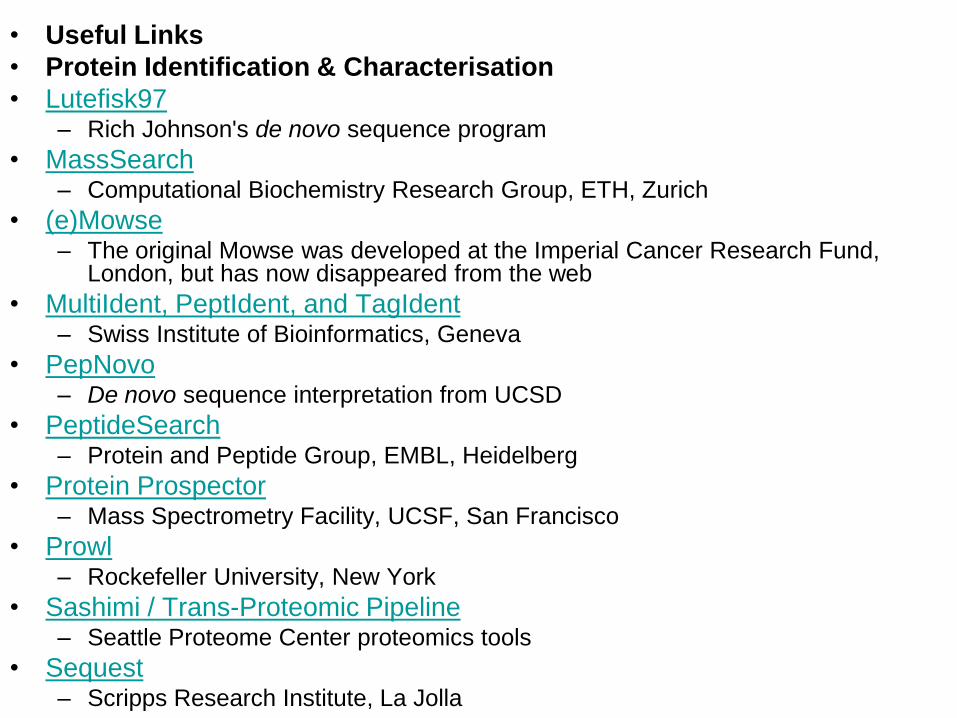
• Useful Links
• Protein Identification & Characterisation
• Lutefisk97– Rich Johnson's de novo sequence program
• MassSearch– Computational Biochemistry Research Group, ETH, Zurich
• (e)Mowse– The original Mowse was developed at the Imperial Cancer Research Fund,
London, but has now disappeared from the web
• MultiIdent, PeptIdent, and TagIdent– Swiss Institute of Bioinformatics, Geneva
• PepNovo– De novo sequence interpretation from UCSD
• PeptideSearch– Protein and Peptide Group, EMBL, Heidelberg
• Protein Prospector– Mass Spectrometry Facility, UCSF, San Francisco
• Prowl– Rockefeller University, New York
• Sashimi / Trans-Proteomic Pipeline– Seattle Proteome Center proteomics tools
• Sequest– Scripps Research Institute, La Jolla

Peptide Mass Fingerprinting
• Choice of Enzyme
• Missed Cleavages
• Search Masses
• Constraining the Protein Molecular Weight
• Which masses to include in a search
• Autolysis products
• Modifications
A mass spectrum of the peptide mixture resulting from the
digestion of a protein by a proteolytic enzyme

Choice of Enzyme
• Enzymes of low specificity are next
to useless as they produce a
complex mixture of similar masses
• For MALDI, Peptides of masses less
than 500 Da should be avoided
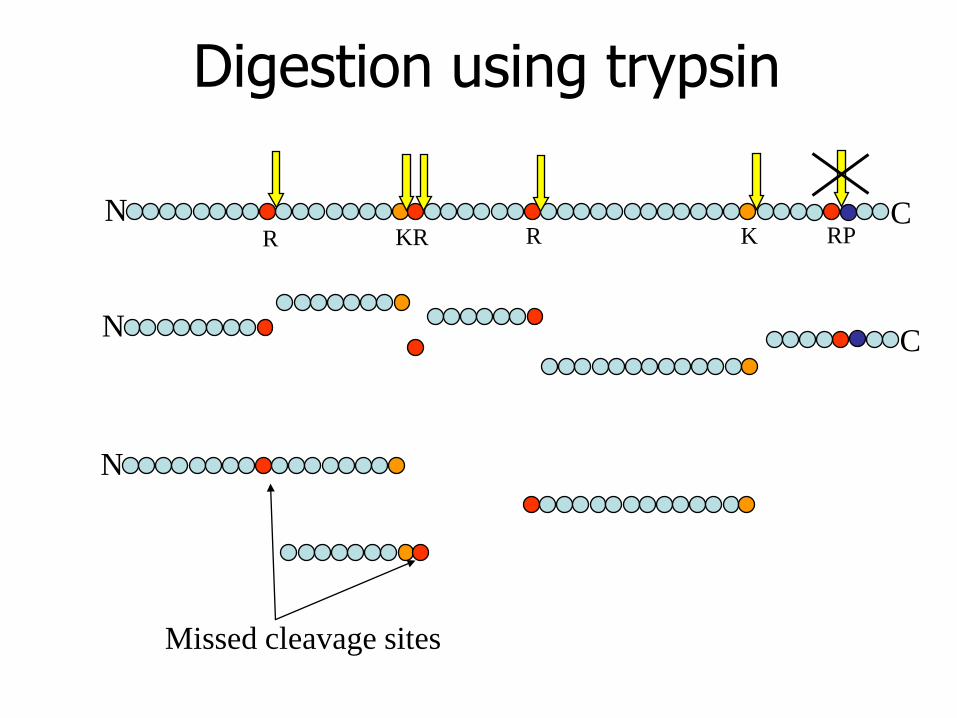
Digestion using trypsin
N CR R RPKR K
NC
N
Missed cleavage sites
Missed Cleavages
• Digests are usually not perfect
• Cleavage sites may be missed by an
enzyme
• These partially cleaved peptides are
known as partials
• Reduce the discrimination of a
search

Search Masses
• Select masses which are large enough to provide discrimination
• Larger masses are more likely to be partials
• With Trypsin, a mass range of 1000 to 3000 Da is good
• Mass tolerance is important in obtaining good discrimination

Removal of contaminants
Common contaminants•Keratin•Tryptic autodigest projects (842.5,
2211.1)
•Matrix-clusters
1 Da
m/z 871.0 876.0 In
tensity
3.50
0
873.50 871.94
C:\Documents and Settings\Administrator\Desktop\matrix-sample.massml (13:05 01/15/02) Description: FLEXControl generated XMASS data (c) 2000 Bruker Daltonics
Overlapping matrix (871.94) and peptide (873.50) peaks.
m/z 500 4000
Inte
nsity
60
0
973.4
3
1179.5
K
era
tin1
Kera
tin1
Kera
tin1
Kera
tin9
Kera
tin9
Kera
tin1
Kera
tin1
Kera
tin1 K
era
tin9
Kera
tin9
Kera
tin1
Kera
tin1
Kera
tin9
Kera
tin1
C:\Documents and Settings\Administrator\Desktop\keratinrigtspectra.massml (10:52 01/15/02) Description: Yeast
m/z1000 5000
Inte
nsity
25
0
1638.7
1475.6
842.4
2
2704.8
2210.8
1851.7
1993.7
1267.6
2500.9
1307.5
2202.9
1765.5 3
338.3
3324.3
3146.2
2932.1
1179.5
2716.7
2383.6
2185.9
<3355.2
>
1707.6
2234.9
2224.8
2398.7
1794.6
1657.6
1759.7
1280.6
2283.9
2149.8
2444.9
1715.6
1837.7
830.3
7 1818.7
2342.7
1320.4
2509.8
1234.5
2183.81384.6
1251.6
1434.6
2565.9
2790.1
2822.0
2748.1
2644.0
1323.5
2583.9
2589.9
1503.6
1523.6
2807.0
1036.4
870.4
4
2901.2
3819.6
3662.3
1045.5
2872.0
1082.5
3050.9
875.3
6
3677.4
\\Bmb-filsrv\PRpublic\IngerMZ\PH0508\p54731ic, plug 3.massml (11:21 03/15/05)
Description: PH0508, Ag-plug 3
Outlier
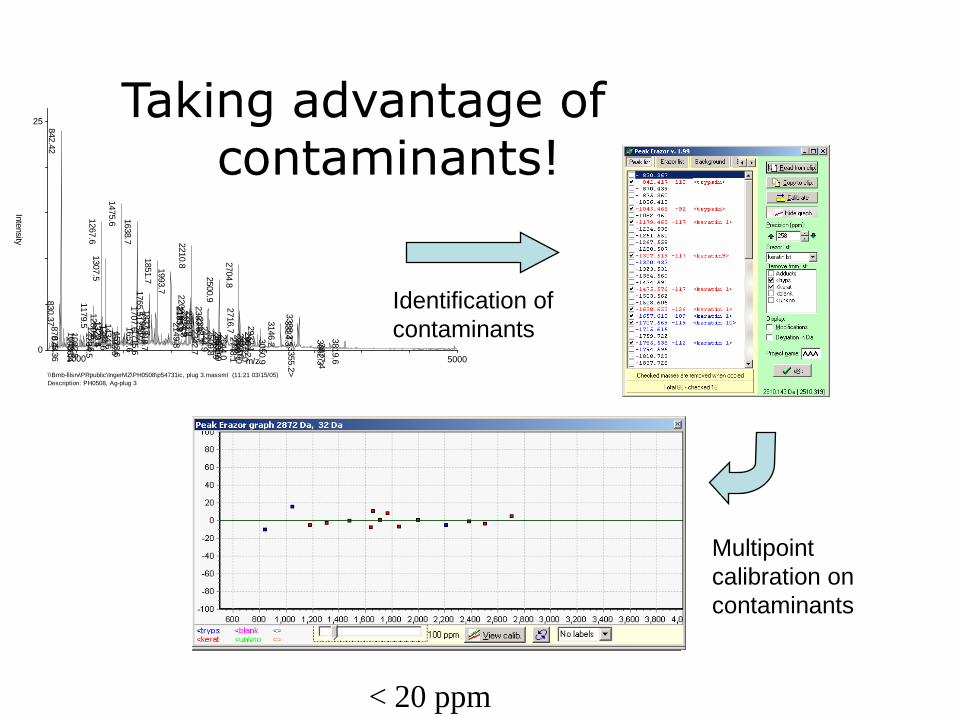
Taking advantage of contaminants!
Identification of
contaminants
Multipoint
calibration on
contaminants
< 20 ppm

Constraining Protein Mass
• To increase discrimination, the
mass of the intact protein can be
used in a search
• This is dangerous since this may
be just a fragment of an entire
protein
Which Masses to Include ?
• Enzymatic cleavage not perfect
• Sequence coverage may be poor
• Noise
The optimum dataset for a peptide mass fingerprint is all
the correct peptides and none of the wrong ones ! By correct,
we mean that the textbook cleavage rules were followed. In
practice, this rarely (if ever) happens.
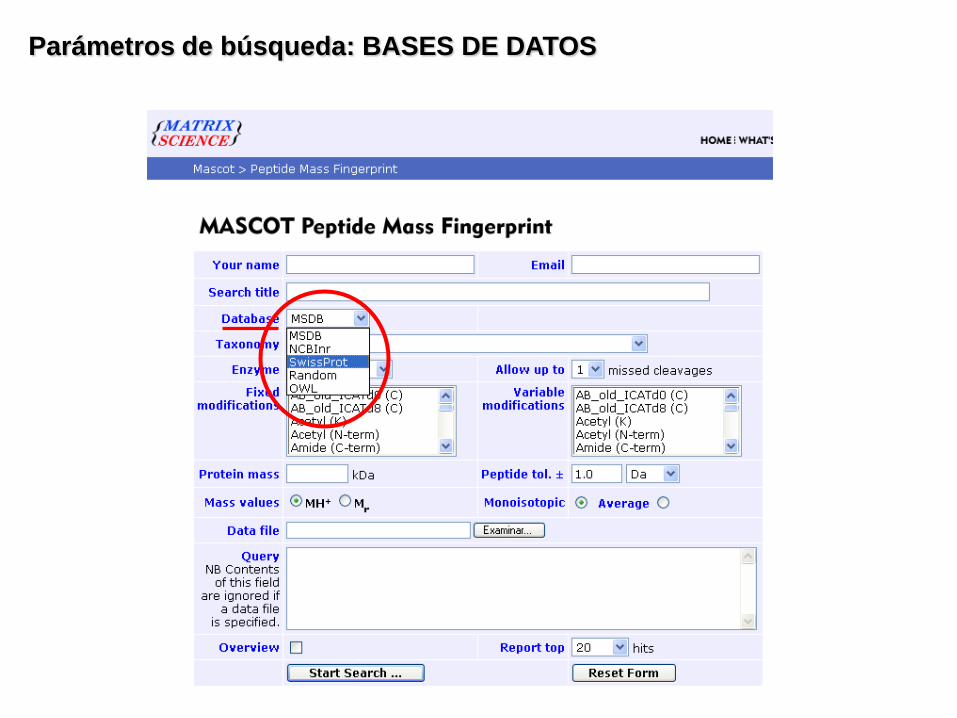
Parámetros de búsqueda: BASES DE DATOS

Parámetros de búsqueda: TAXONOMÍA

Parámetros de búsqueda: ENZIMA
Name CleaveDon't cleave
N or C term
Trypsin KR P CTERM
Arg-C R P CTERM
Asp-N BD NTERM
Asp-N_ambic DE NTERM
Chymotrypsin FYWL P CTERM
CNBr M CTERM
Formic_acid D CTERM
Lys-C K P CTERM
Lys-C/P K CTERM
PepsinA FL CTERM
Tryp-CNBr KRM P CTERM
TrypChymo FYWLKR P CTERM
Trypsin/P KR CTERM
V8-DE BDEZ P CTERM
V8-E EZ P CTERM
CNBr+TrypsinM CTERM
KR P CTERM

Parámetros de búsqueda: MISSED CLEAVAGES
Es conveniente no especificar más de 2 cortes parciales ya que el aumento
supone incrementar el número de péptidos a los que se enfrentarán los datos
experimentales con lo cual:
Aumenta el tiempo de búsqueda
Aumenta el número de asignaciones aleatorias
Disminuye la discriminación y la puntuación final
¡!

Parámetros de búsqueda: MODIFICACIONES

FIJAS
VARIABLES
• Modificación que puede o no estar presente
• Modificación aplicada universalmente
• No produce aumento en el número de péptidos
Ej. Carbamidomethyl (C) + 57 Da
C 103 Da 160 Da
• Se buscan todas las posibles combinaciones para encontrar la mejor asignación
Parámetros de búsqueda: MODIFICACIONES
Ej. Oxidation (M) + 16 Da AIMCTHDMEYWMK AIMCTHDMEYWMK
AIMCTHDMEYWMK AIMCTHDMEYWMK
AIMCTHDMEYWMK AIMCTHDMEYWMK
AIMCTHDMEYWMK AIMCTHDMEYWMK
¡! • Cada modif. variable puede generar varios péptidos adicionales para ser testados:
Aumenta el tiempo de búsqueda
Aumenta el número de asignaciones aleatorias
Disminuye la discriminación y la puntuación final

Parámetros de búsqueda: TOLERANCIA DE LOS PÉPTIDOS
Es el margen de error permitido
para las masas experimentales de los péptidos
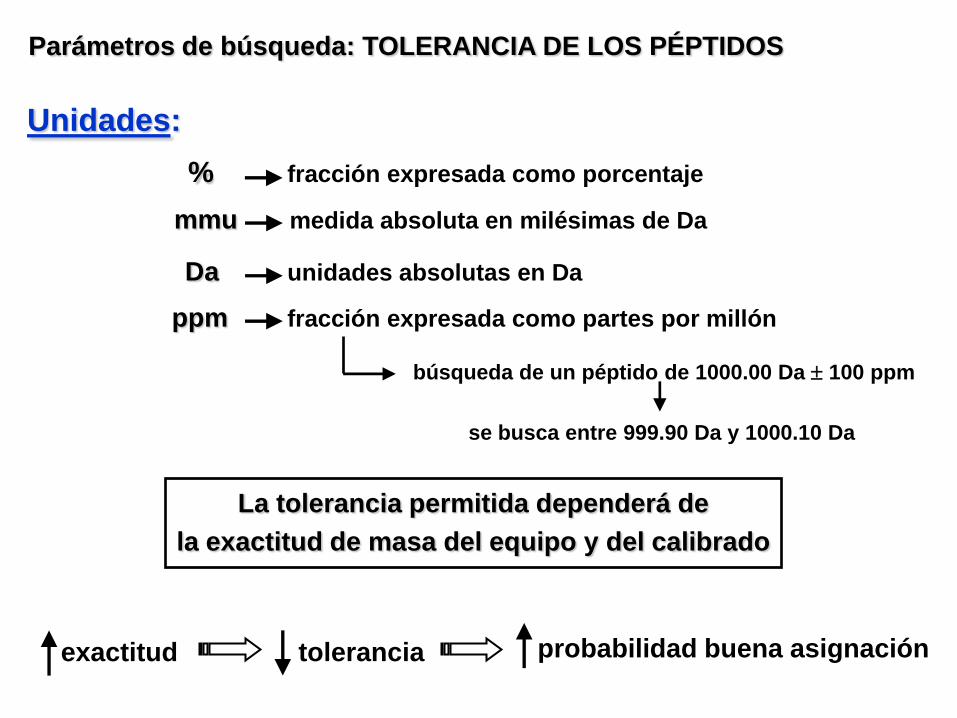
Parámetros de búsqueda: TOLERANCIA DE LOS PÉPTIDOS
Unidades:
mmu medida absoluta en milésimas de Da
Da unidades absolutas en Da
ppm fracción expresada como partes por millón
% fracción expresada como porcentaje
búsqueda de un péptido de 1000.00 Da 100 ppm
se busca entre 999.90 Da y 1000.10 Da
La tolerancia permitida dependerá de
la exactitud de masa del equipo y del calibrado
exactitud tolerancia probabilidad buena asignación
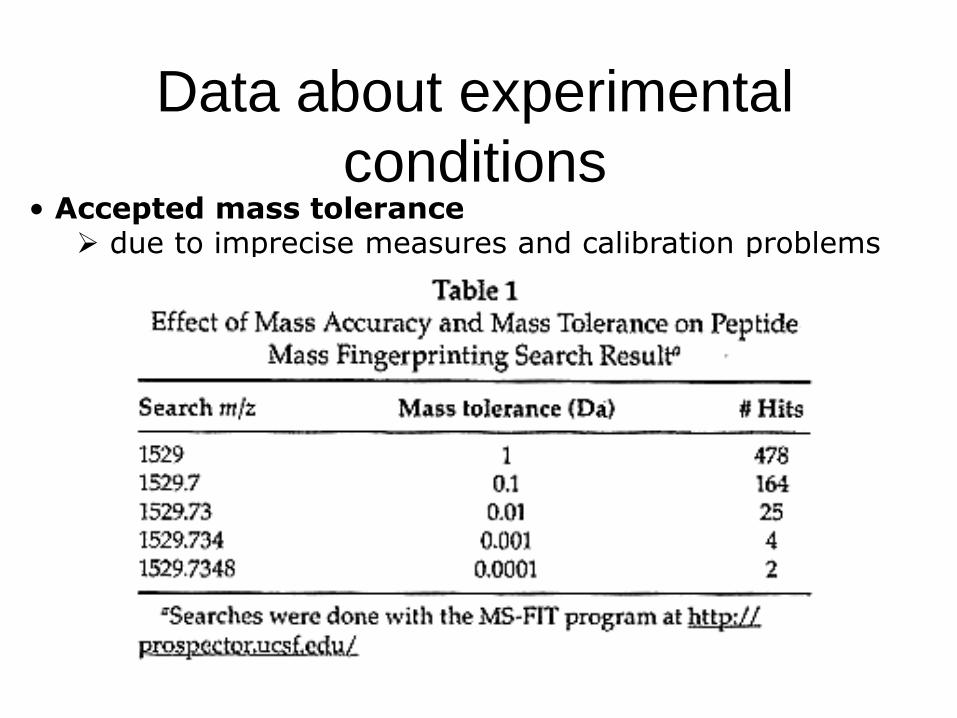
Data about experimental
conditions• Accepted mass tolerance due to imprecise measures and calibration problems


m/z500 4000
Inte
nsity
18
0
1891.9
<3810.9><3340.7>
2037.02191.1
1319.6
1882.0
1475.7
1708.9
2066.0
1307.6
2211.1
1994.0
1393.7
1702.8 1948.0
1435.71179.5
2284.2
1607.8
1458.7
1277.7
1638.8 2403.22705.2
842.50
1234.61073.6
2717.12249.1
1045.5958.46
2754.4
823.56
847.47759.43
2807.3
578.47
1 MSEQLRQTFA NAKKENRNAL VTFMTAGYPT VKDTVPILKG FQDGGVDIIE
51 LGMPFSDPIA DGPTIQLSNT VALQNGVTLP QTLEMVSQAR NEGVTVPIIL
101 MGYYNPILNY GEERFIQDAA KAGANGFIIV DLPPEEALKV RNYINDNGLS
151 LIPLVAPSTT DERLELLSHI ADSFVYVVSR MGTTGVQSSV ASDLDELISR
201 VRKYTKDTPL AVGFGVSTRE HFQSVGSVAD GVVIGSKIVT LCGDAPEGKR
251 YDVAKEYVQG ILNGAKHKVL SKDEFFAFQK ESLKSANVKK EILDEFDENH
301 KHPIRFGDFG GQYVPEALHA CLRELEKGFD EAVADPTFWE DFKSLYSYIG
351 RPSSLHKAER LTEHCQGAQI WLKREDLNHT GSHKINNALA QVLLAKRLGK
401 KNVIAETGAG QHGVATATAC AKFGLTCTVF MGAEDVRRQA LNVFRMRILG
451 AKVIAVTNGT KTLRDATSEA FRFWVTNLKT TYYVVGSAIG PHPYPTLVRT
501 FQSVIGKETK EQFAAMNNGK LPDAVVACVG GGSNSTGMFS PFEHDTSVKL
551 LGVEAGGDGV DTKFHSATLT AGRPGVFHGV KTYVLQDSDG QVHDTHSVSA
601 GLDYPGVGPE LAYWKSTGRA QFIAATDAQA LLGFKLLSQL EGIIPALESS
651 HAVYGACELA KTMKPDQHLV INISGRGDKD VQSVAEVLPK LGPKIGWDLR
701 FEEDPSA
Tryptic auto digest
Contaminants
Result

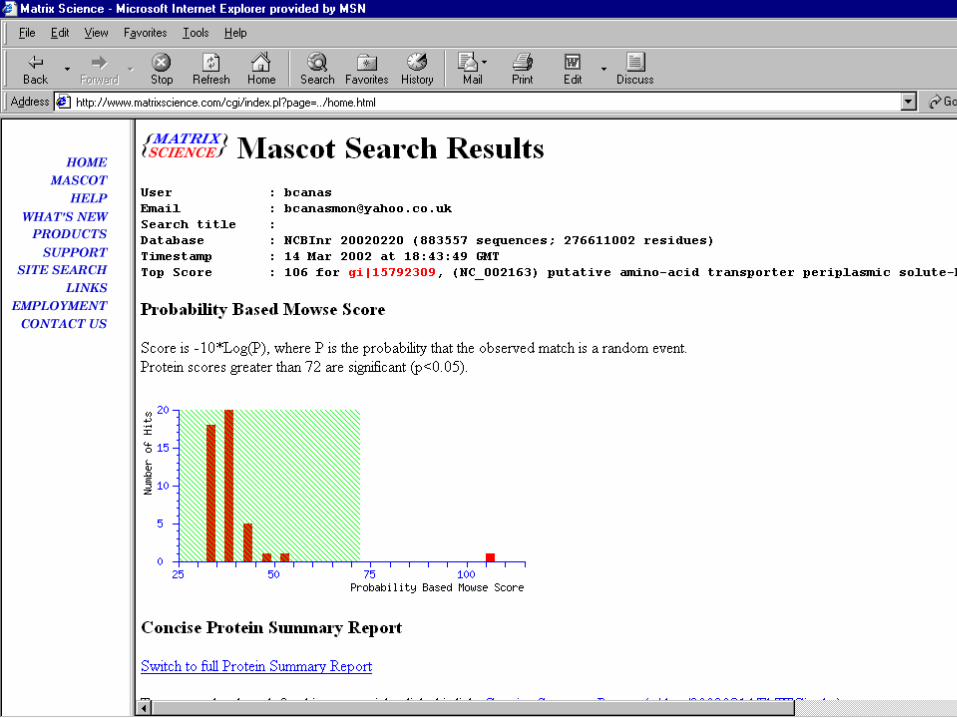
Interpretación de los Resultados
He identificado una proteína pero...
¿Es realmente correcta la identificación?
Análisis cuidadoso de los resultados
Coincidencia del resultado empleando distintos motores de búsqueda
Coincidencia del resultado haciendo la digestión con distintas proteasas
Las masas asignadas a la proteína, ¿son las más abundantes del espectro?
Del total de masas experimentales, ¿cuántas “encajan” con la proteína?
¿Cuánto se aleja nuestro resultado de la zona de incertidumbre?

Ventajas y Limitaciones del PMF
VENTAJAS
LIMITACIONES
Análisis rápido y con bajo coste
Alta sensibilidad
Aplicable a un elevado número de muestras
La proteína debe estar en la DB o presentar un alto grado de homología
con proteínas presentes para poder ser identificada
No aplicable para proteínas menores de 10 kDa o proteínas con alto
número de modificaciones
Difícil identificación de mezclas de proteínas