Embed Size (px)
Citation preview
Earnings Results 3Q16November, 2016
Disclaimer
This presentation may contain certain forward-looking projections and trends that neither
represent realized financial results nor historical information.
These forward-looking projections and trends are subject to risk and uncertainty, and
future results may differ materially from the projections. Many of these risks and
uncertainties are related to factors that are beyond CCR’s ability to control or to estimate,
such as market conditions, currency swings, the behavior of other market participants, the
2
such as market conditions, currency swings, the behavior of other market participants, the
actions of regulatory agencies, the ability of the company to continue to obtain financing,
changes in the political and social context in which CCR operates or economic trends or
conditions, including changes in the rate of inflation and changes in consumer confidence
on a global, national or regional scale.
Readers are advised not to fully trust these projections and trends. CCR is not obliged to
publish any revision of these projections and trends that should reflect new events or
circumstances after the realization of this presentation.
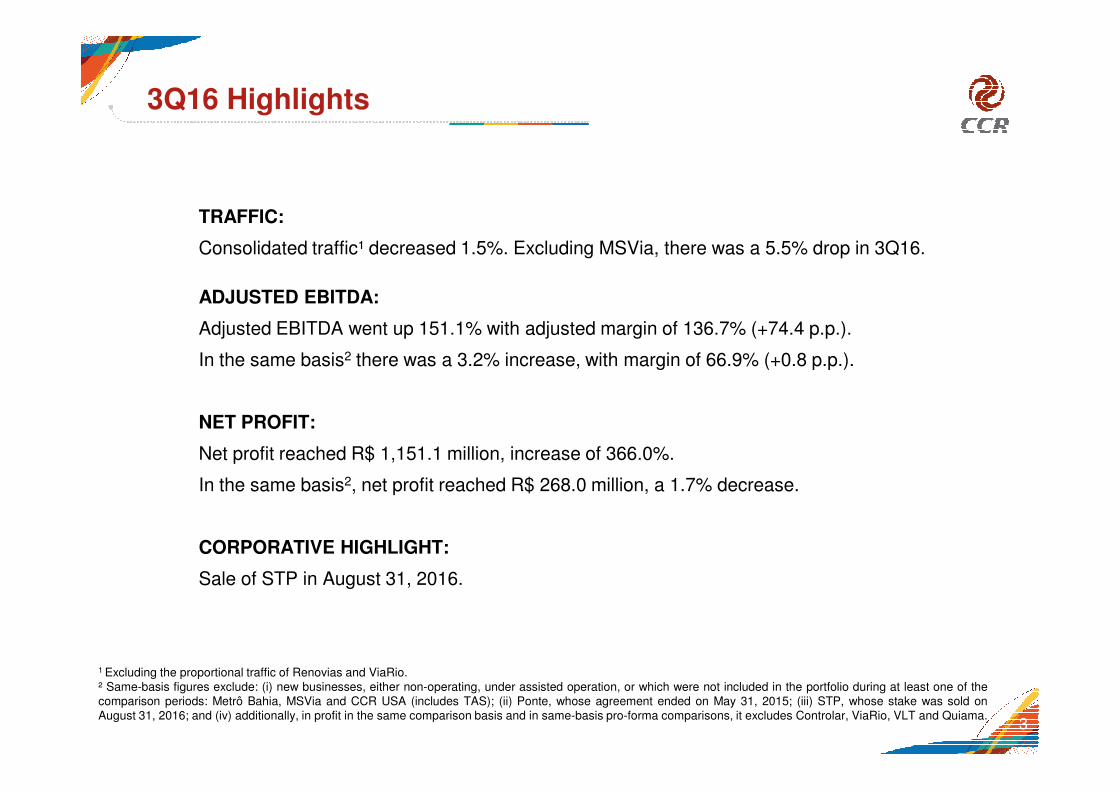
TRAFFIC:
Consolidated traffic¹ decreased 1.5%. Excluding MSVia, there was a 5.5% drop in 3Q16.
ADJUSTED EBITDA:
Adjusted EBITDA went up 151.1% with adjusted margin of 136.7% (+74.4 p.p.).
In the same basis2 there was a 3.2% increase, with margin of 66.9% (+0.8 p.p.).
3Q16 Highlights
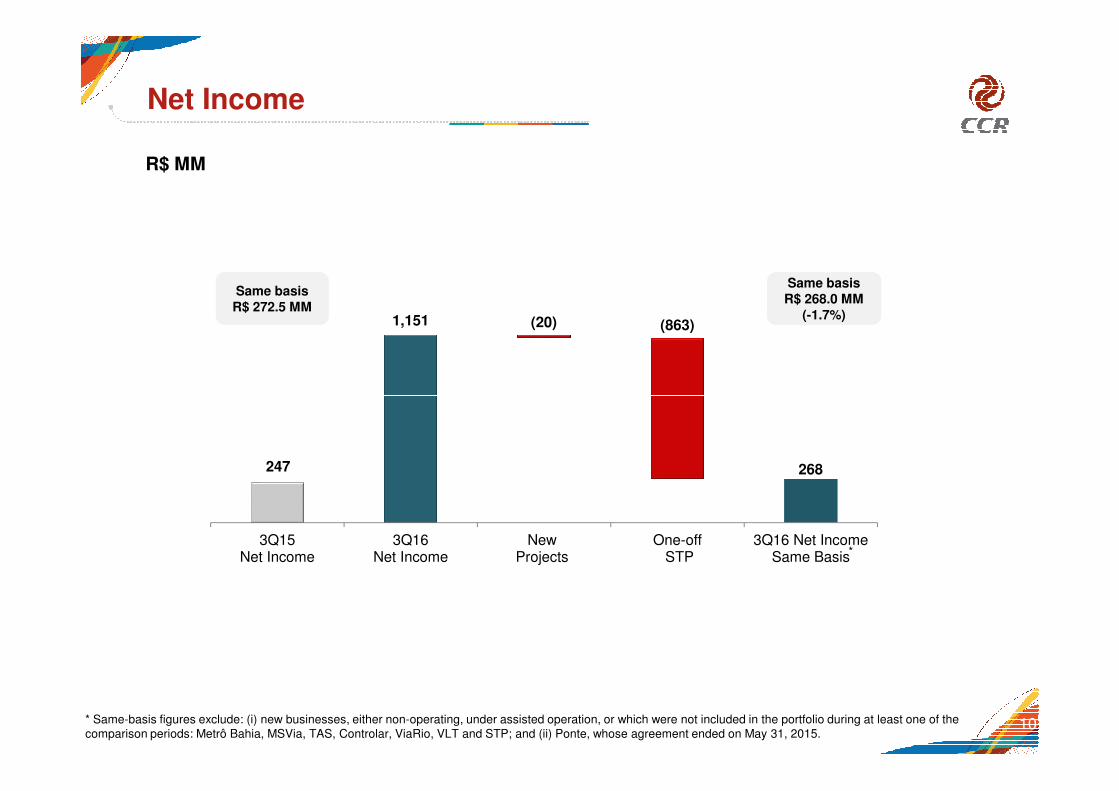
NET PROFIT:
Net profit reached R$ 1,151.1 million, increase of 366.0%.
In the same basis2, net profit reached R$ 268.0 million, a 1.7% decrease.
CORPORATIVE HIGHLIGHT:
Sale of STP in August 31, 2016.
3
1 Excluding the proportional traffic of Renovias and ViaRio.² Same-basis figures exclude: (i) new businesses, either non-operating, under assisted operation, or which were not included in the portfolio during at least one of thecomparison periods: Metrô Bahia, MSVia and CCR USA (includes TAS); (ii) Ponte, whose agreement ended on May 31, 2015; (iii) STP, whose stake was sold onAugust 31, 2016; and (iv) additionally, in profit in the same comparison basis and in same-basis pro-forma comparisons, it excludes Controlar, ViaRio, VLT and Quiama.
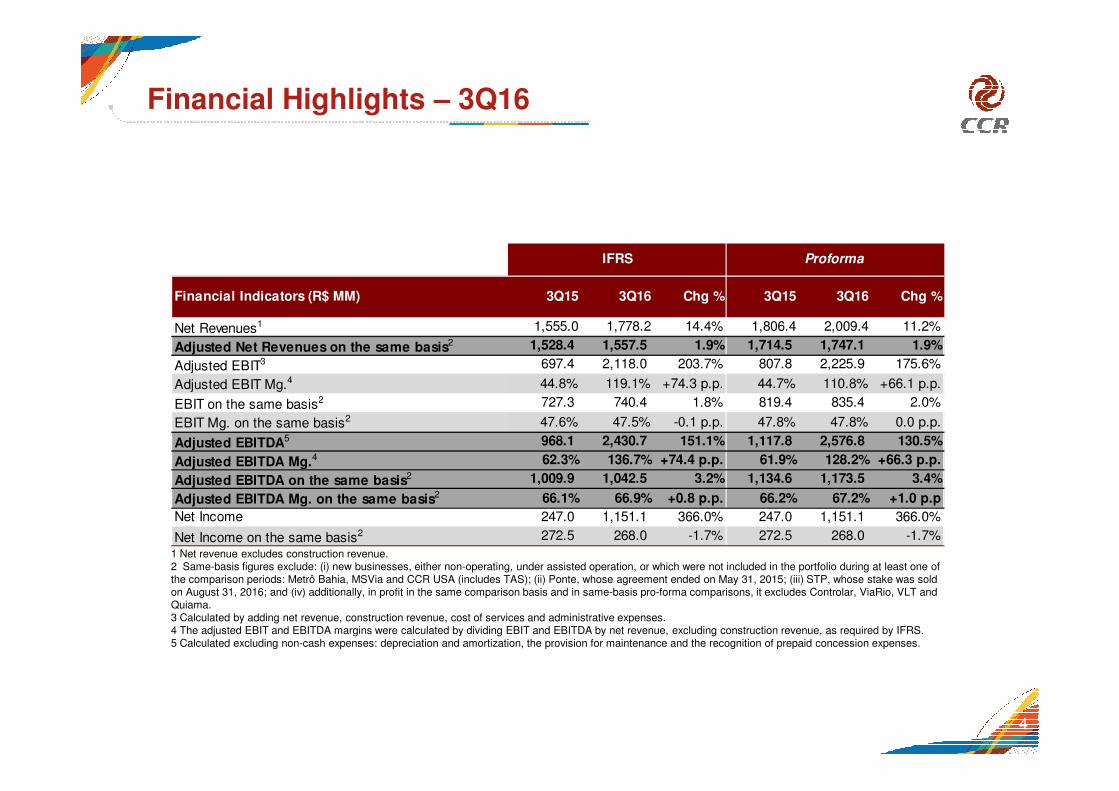
Financial Highlights – 3Q16
Net Revenues1 1,555.0 1,778.2 14.4% 1,806.4 2,009.4 11.2%
Adjusted Net Revenues on the same basis2 1,528.4 1,557.5 1.9% 1,714.5 1,747.1 1.9%
Adjusted EBIT3 697.4 2,118.0 203.7% 807.8 2,225.9 175.6%
Adjusted EBIT Mg.4 44.8% 119.1% +74.3 p.p. 44.7% 110.8% +66.1 p.p.2 727.3 740.4 1.8% 819.4 835.4 2.0%
Proforma
Financial Indicators (R$ MM) 3Q15 3Q16 Chg %
IFRS
3Q15 3Q16 Chg %
1 Net revenue excludes construction revenue.2 Same-basis figures exclude: (i) new businesses, either non-operating, under assisted operation, or which were not included in the portfolio during at least one of the comparison periods: Metrô Bahia, MSVia and CCR USA (includes TAS); (ii) Ponte, whose agreement ended on May 31, 2015; (iii) STP, whose stake was sold on August 31, 2016; and (iv) additionally, in profit in the same comparison basis and in same-basis pro-forma comparisons, it excludes Controlar, ViaRio, VLT and Quiama. 3 Calculated by adding net revenue, construction revenue, cost of services and administrative expenses.4 The adjusted EBIT and EBITDA margins were calculated by dividing EBIT and EBITDA by net revenue, excluding construction revenue, as required by IFRS.5 Calculated excluding non-cash expenses: depreciation and amortization, the provision for maintenance and the recognition of prepaid concession expenses.
4
EBIT on the same basis2 727.3 740.4 1.8% 819.4 835.4 2.0%
EBIT Mg. on the same basis2 47.6% 47.5% -0.1 p.p. 47.8% 47.8% 0.0 p.p.
Adjusted EBITDA5 968.1 2,430.7 151.1% 1,117.8 2,576.8 130.5%
Adjusted EBITDA Mg.4 62.3% 136.7% +74.4 p.p. 61.9% 128.2% +66.3 p.p.
Adjusted EBITDA on the same basis2 1,009.9 1,042.5 3.2% 1,134.6 1,173.5 3.4%
Adjusted EBITDA Mg. on the same basis2 66.1% 66.9% +0.8 p.p. 66.2% 67.2% +1.0 p.p
Net Income 247.0 1,151.1 366.0% 247.0 1,151.1 366.0%
Net Income on the same basis2 272.5 268.0 -1.7% 272.5 268.0 -1.7%
248,936 256,560
275,606 271,966
254,023 250,633
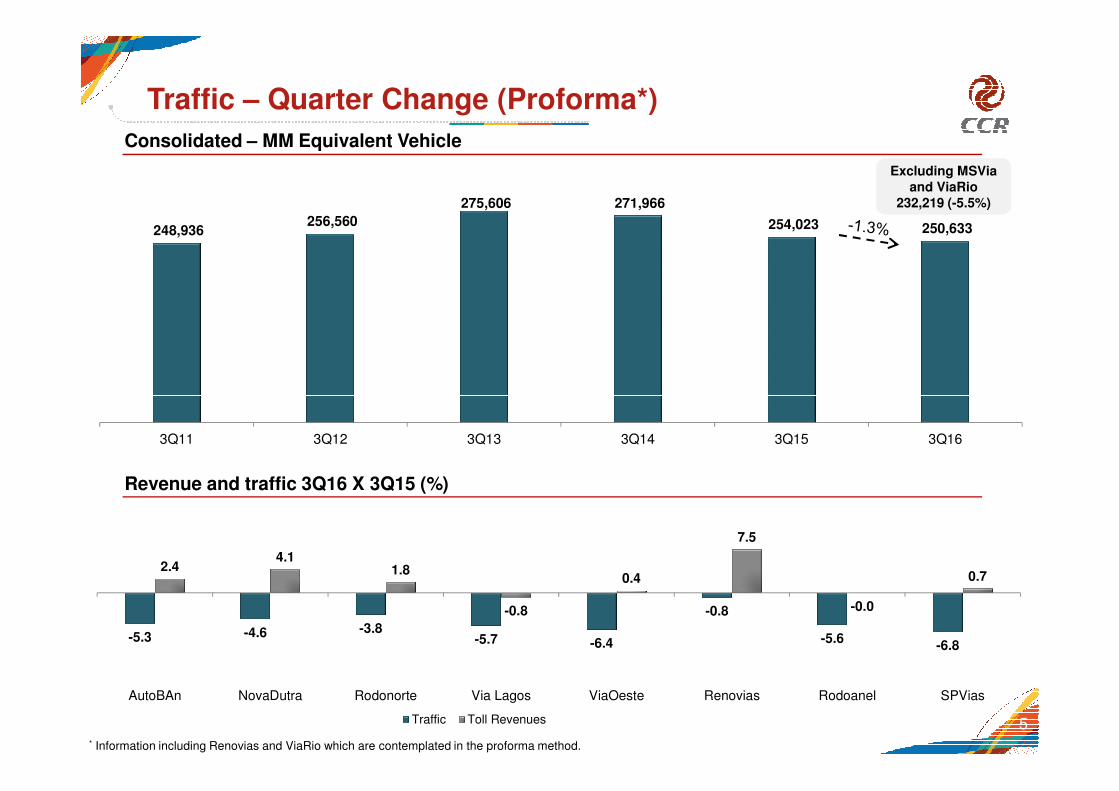
Traffic – Quarter Change (Proforma*)
Consolidated – MM Equivalent Vehicle
Excluding MSViaand ViaRio
232,219 (-5.5%)
3Q11 3Q12 3Q13 3Q14 3Q15 3Q16
5
Revenue and traffic 3Q16 X 3Q15 (%)
* Information including Renovias and ViaRio which are contemplated in the proforma method.
-5.3 -4.6 -3.8 -5.7 -6.4
-0.8
-5.6 -6.8
2.4 4.1
1.8
-0.8
0.4
7.5
-0.0
0.7
AutoBAn NovaDutra Rodonorte Via Lagos ViaOeste Renovias Rodoanel SPVias
Traffic Toll Revenues
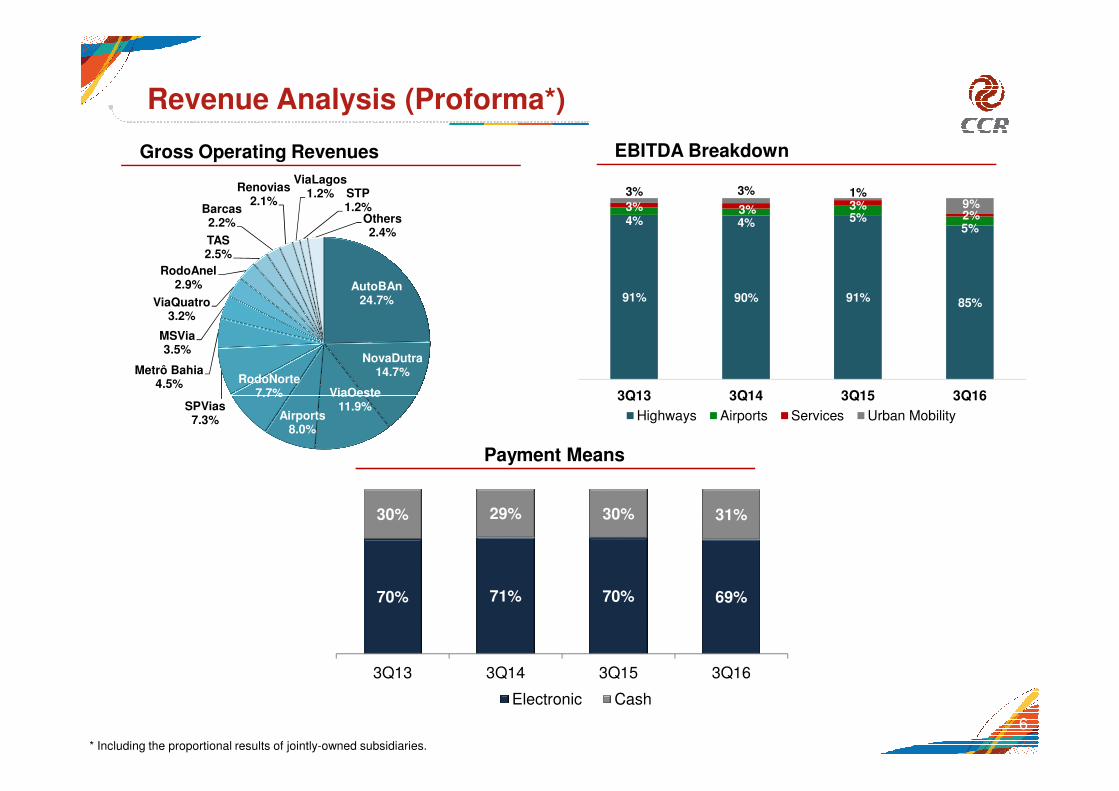
Revenue Analysis (Proforma*)
Gross Operating Revenues EBITDA Breakdown
AutoBAn24.7%
NovaDutra14.7%
ViaOesteRodoNorte
7.7%
Metrô Bahia4.5%
MSVia3.5%
ViaQuatro3.2%
RodoAnel2.9%
TAS2.5%
Barcas2.2%
Renovias2.1%
ViaLagos1.2% STP
1.2%Others2.4%
91% 90% 91% 85%
4% 4% 5%5%
3% 3% 3%2%
3% 3% 1%9%
3Q13 3Q14 3Q15 3Q16
6
Payment Means
* Including the proportional results of jointly-owned subsidiaries.
70% 71% 70% 69%
30% 29% 30% 31%
3Q13 3Q14 3Q15 3Q16
Electronic Cash
ViaOeste11.9%
7.7%
Airports8.0%
SPVias7.3%
3Q13 3Q14 3Q15 3Q16
Highways Airports Services Urban Mobility
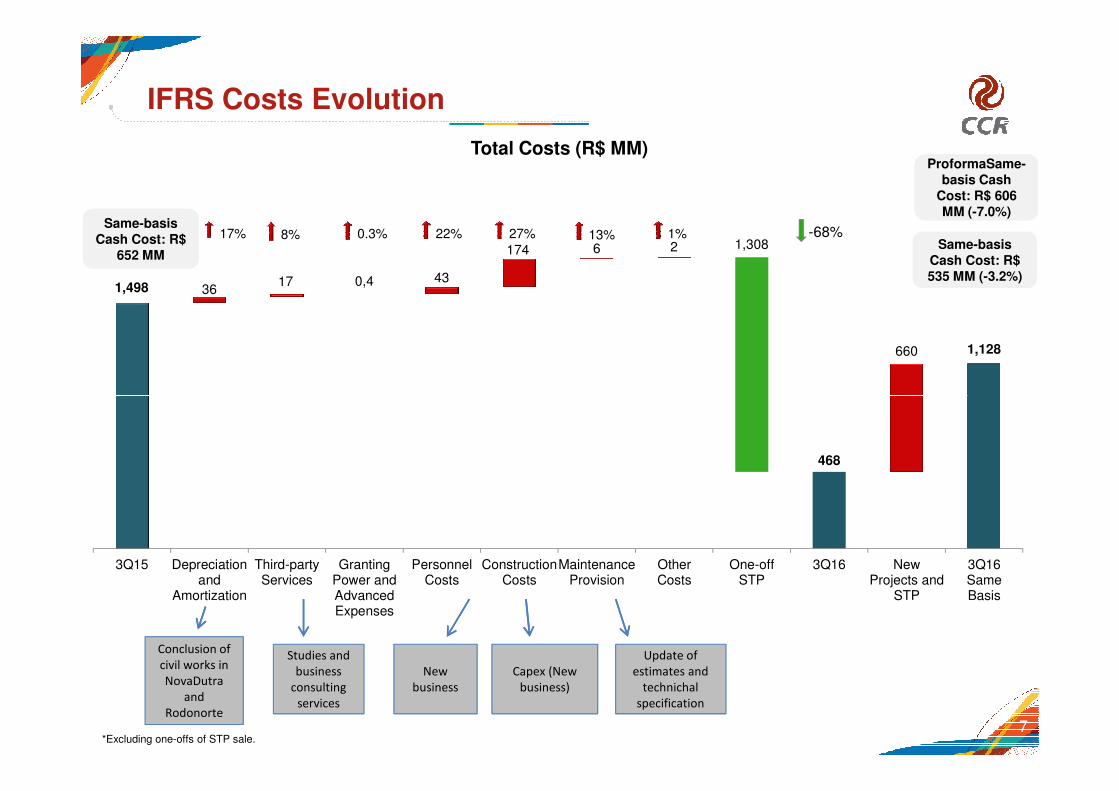
IFRS Costs Evolution
Total Costs (R$ MM)
Same-basis Cash Cost: R$ 535 MM (-3.2%)
8% 22% 27%17% 0.3%Same-basis
Cash Cost: R$ 652 MM
ProformaSame-basis Cash
Cost: R$ 606 MM (-7.0%)
13% 1% -68%
1,498
1,128
3617 0,4 43
174 6 2 1,308
660
7
Conclusion of
civil works in
NovaDutra
and
Rodonorte
Studies and
business
consulting
services
New
business
Capex (New
business)
Update of
estimates and
technichal
specification
*Excluding one-offs of STP sale.
468
3Q15 Depreciationand
Amortization
Third-partyServices
GrantingPower andAdvancedExpenses
PersonnelCosts
ConstructionCosts
MaintenanceProvision
OtherCosts
One-offSTP
3Q16 NewProjects and
STP
3Q16SameBasis
1,118
2,577
1,174
(96) (1,308)
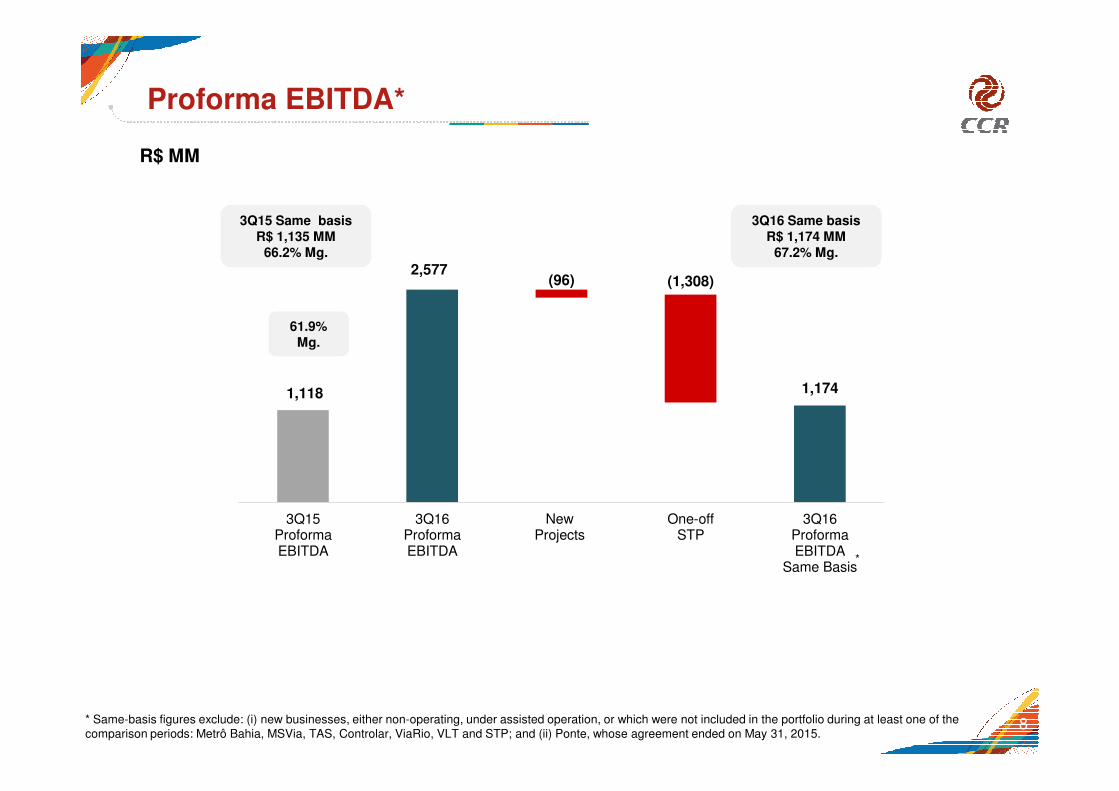
Proforma EBITDA*
61.9%Mg.
3Q15 Same basisR$ 1,135 MM
66.2% Mg.
3Q16 Same basisR$ 1,174 MM
67.2% Mg.
R$ MM
1,118 1,174
3Q15ProformaEBITDA
3Q16ProformaEBITDA
NewProjects
One-offSTP
3Q16ProformaEBITDA
Same Basis
8* Same-basis figures exclude: (i) new businesses, either non-operating, under assisted operation, or which were not included in the portfolio during at least one of the comparison periods: Metrô Bahia, MSVia, TAS, Controlar, ViaRio, VLT and STP; and (ii) Ponte, whose agreement ended on May 31, 2015.
*
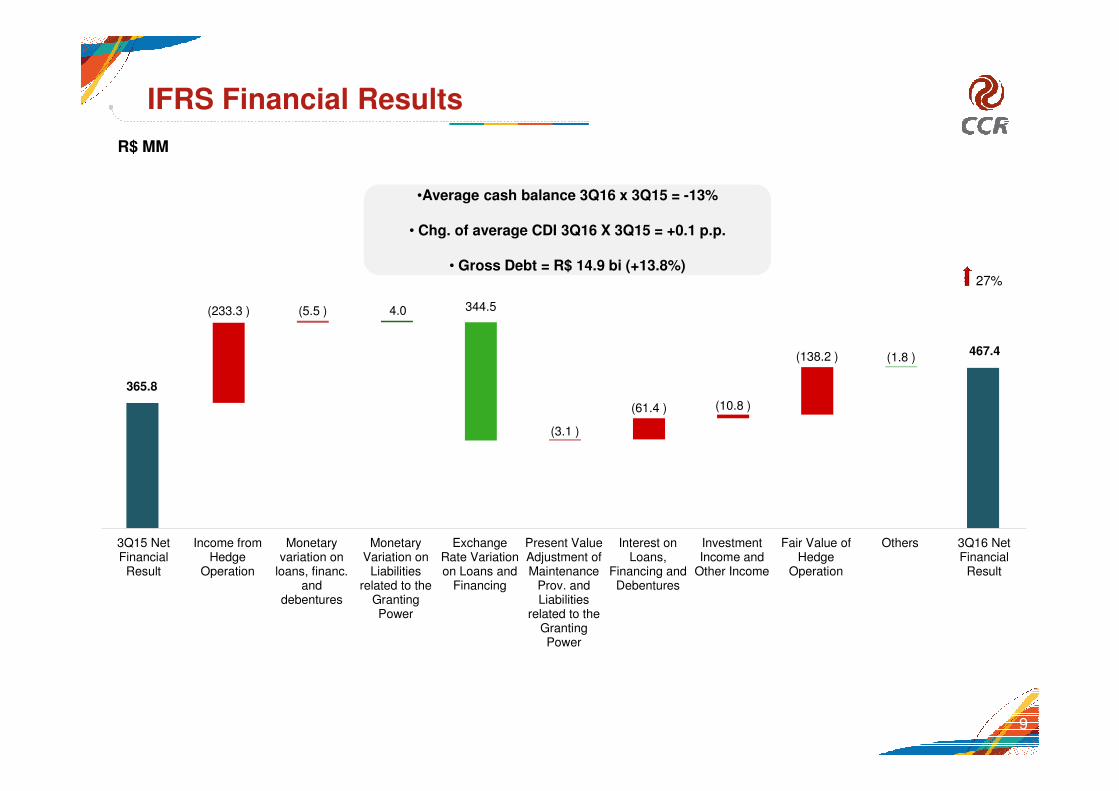
IFRS Financial Results
•Average cash balance 3Q16 x 3Q15 = -13%
• Chg. of average CDI 3Q16 X 3Q15 = +0.1 p.p.
• Gross Debt = R$ 14.9 bi (+13.8%)27%
R$ MM
365.8
467.4
(233.3 ) (5.5 ) 4.0 344.5
(138.2 ) (1.8 )
9
(3.1 )
(61.4 ) (10.8 )
3Q15 NetFinancial
Result
Income fromHedge
Operation
Monetaryvariation on
loans, financ.and
debentures
MonetaryVariation on
Liabilitiesrelated to the
GrantingPower
ExchangeRate Variationon Loans and
Financing
Present ValueAdjustment ofMaintenance
Prov. andLiabilities
related to theGrantingPower
Interest onLoans,
Financing andDebentures
InvestmentIncome and
Other Income
Fair Value ofHedge
Operation
Others 3Q16 NetFinancial
Result
Net Income
R$ MM
Same basisR$ 272.5 MM
Same basisR$ 268.0 MM
(-1.7%)1,151 (20) (863)
10
*
* Same-basis figures exclude: (i) new businesses, either non-operating, under assisted operation, or which were not included in the portfolio during at least one of the comparison periods: Metrô Bahia, MSVia, TAS, Controlar, ViaRio, VLT and STP; and (ii) Ponte, whose agreement ended on May 31, 2015.
247 268
3Q15Net Income
3Q16Net Income
NewProjects
One-off STP
3Q16 Net IncomeSame Basis
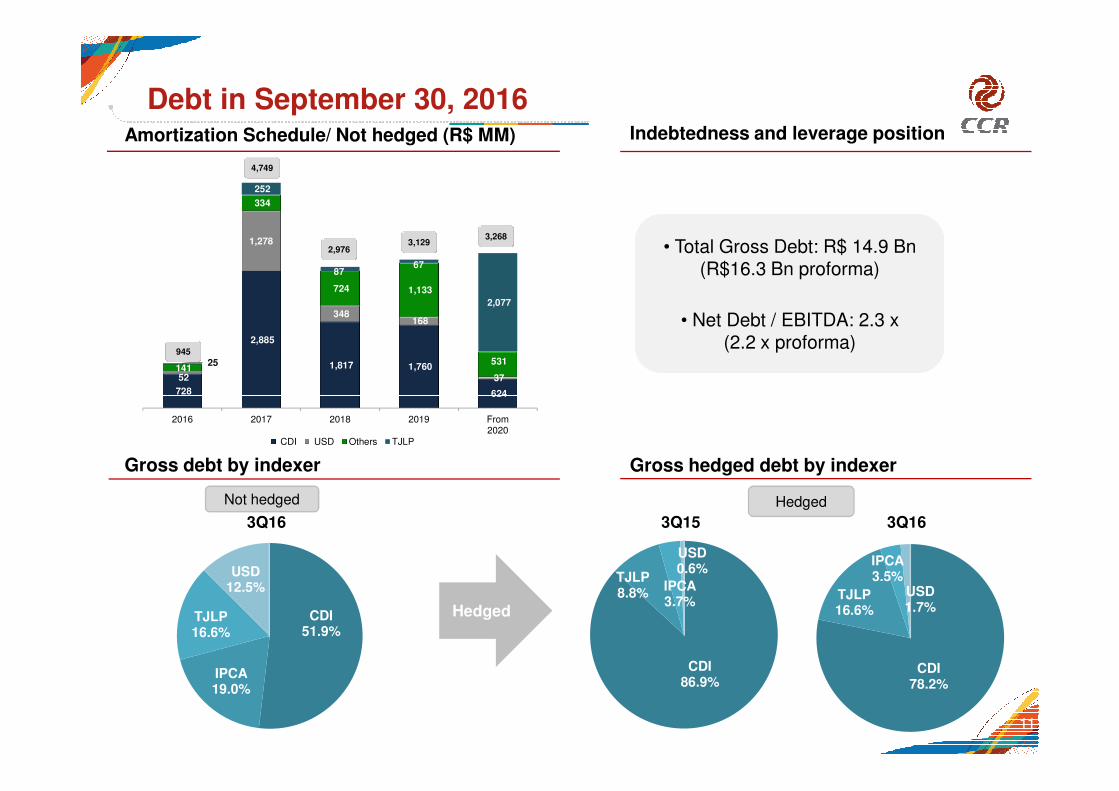
Debt in September 30, 2016Amortization Schedule/ Not hedged (R$ MM) Indebtedness and leverage position
• Total Gross Debt: R$ 14.9 Bn(R$16.3 Bn proforma)
• Net Debt / EBITDA: 2.3 x(2.2 x proforma)
728
2,885
1,817 1,760
624
52
1,278
348 168
37 141
334
724 1,133
531 25
252
87 67
2,077
3,2683,129
2,976
4,749
945
Gross hedged debt by indexer
11
Gross debt by indexer
Not hedged Hedged
HedgedCDI51.9%
IPCA19.0%
TJLP16.6%
USD12.5%
CDI86.9%
TJLP8.8%
IPCA3.7%
USD0.6%
CDI78.2%
TJLP16.6%
IPCA3.5%
USD1.7%
3Q16 3Q163Q15
728 624
2016 2017 2018 2019 From2020
CDI USD Others TJLP
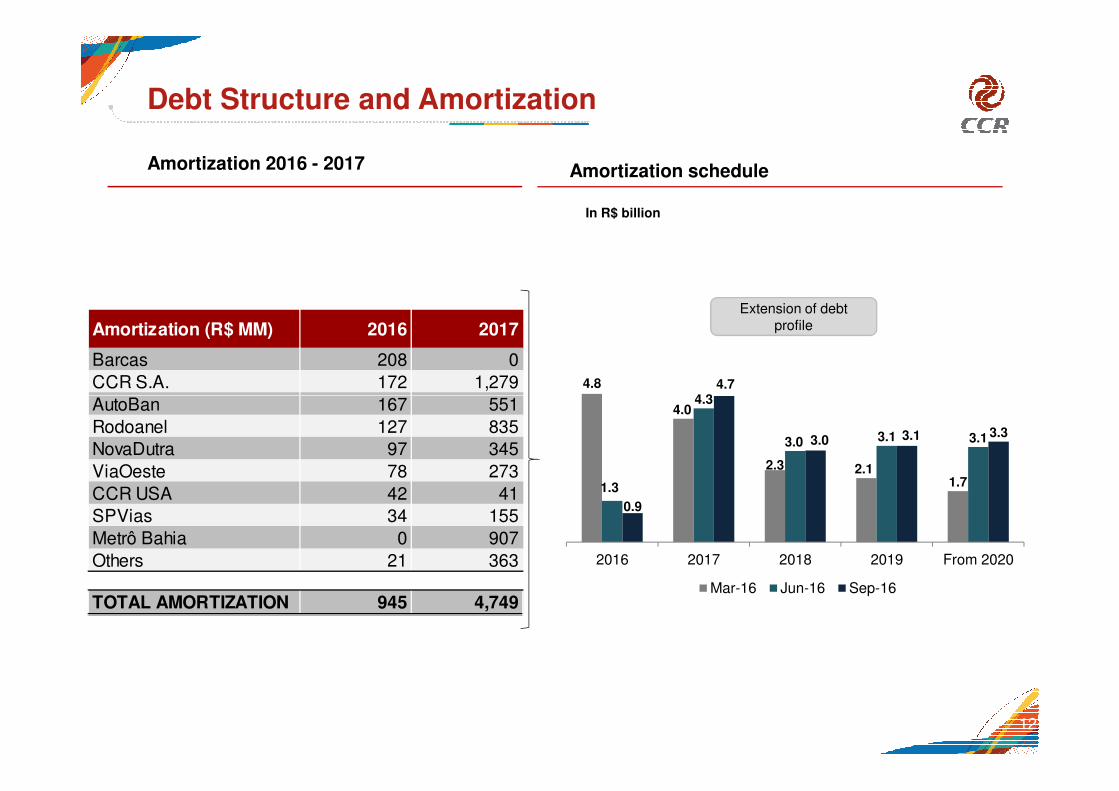
Debt Structure and Amortization
Amortization 2016 - 2017 Amortization schedule
In R$ billion
Extension of debt profileAmortization (R$ MM) 2016 2017
Barcas 208 0
CCR S.A. 172 1,279
AutoBan 167 551
4.84.3
4.7
12
AutoBan 167 551
Rodoanel 127 835
NovaDutra 97 345
ViaOeste 78 273
CCR USA 42 41
SPVias 34 155
Metrô Bahia 0 907
Others 21 363
TOTAL AMORTIZATION 945 4,749
4.0
2.3 2.11.71.3
4.3
3.0 3.1 3.1
0.9
3.0 3.1 3.3
2016 2017 2018 2019 From 2020
Mar-16 Jun-16 Sep-16
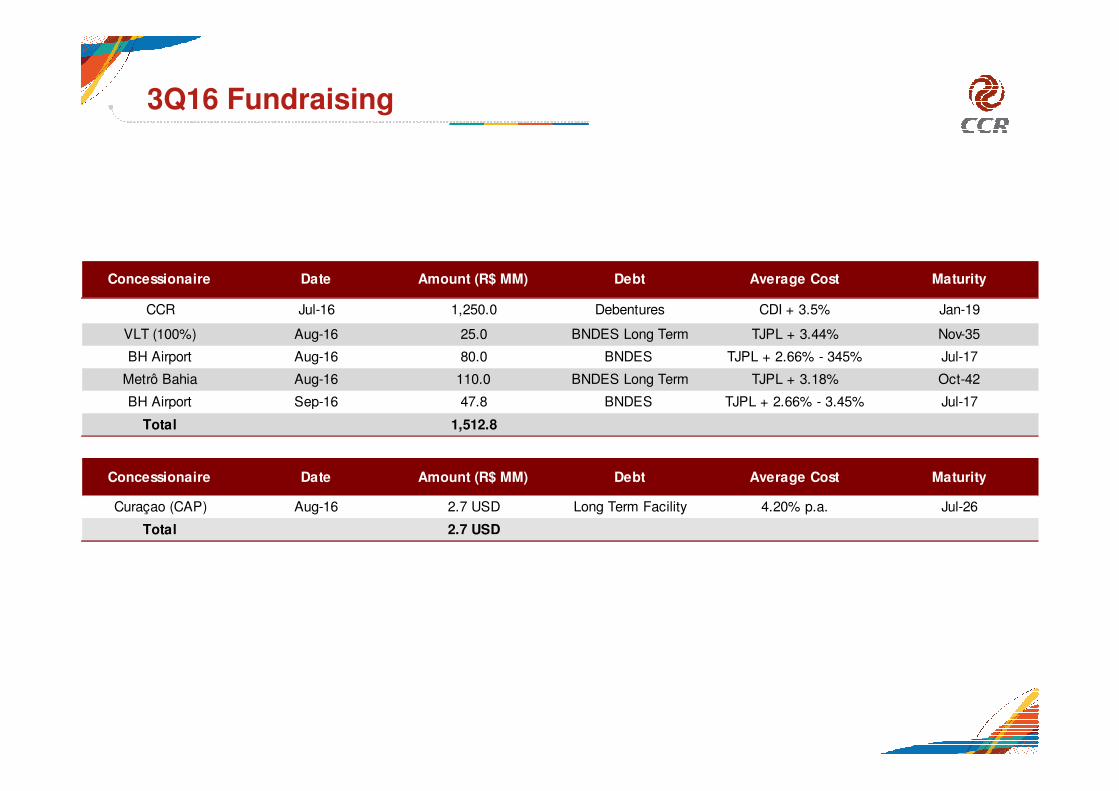
3Q16 Fundraising
Concessionaire Date Amount (R$ MM) Debt Average Cost Maturity
CCR Jul-16 1,250.0 Debentures CDI + 3.5% Jan-19
VLT (100%) Aug-16 25.0 BNDES Long Term TJPL + 3.44% Nov-35
BH Airport Aug-16 80.0 BNDES TJPL + 2.66% - 345% Jul-17
Metrô Bahia Aug-16 110.0 BNDES Long Term TJPL + 3.18% Oct-42
BH Airport Sep-16 47.8 BNDES TJPL + 2.66% - 3.45% Jul-17BH Airport Sep-16 47.8 BNDES TJPL + 2.66% - 3.45% Jul-17
Total 1,512.8
Concessionaire Date Amount (R$ MM) Debt Average Cost Maturity
Curaçao (CAP) Aug-16 2.7 USD Long Term Facility 4.20% p.a. Jul-26
Total 2.7 USD
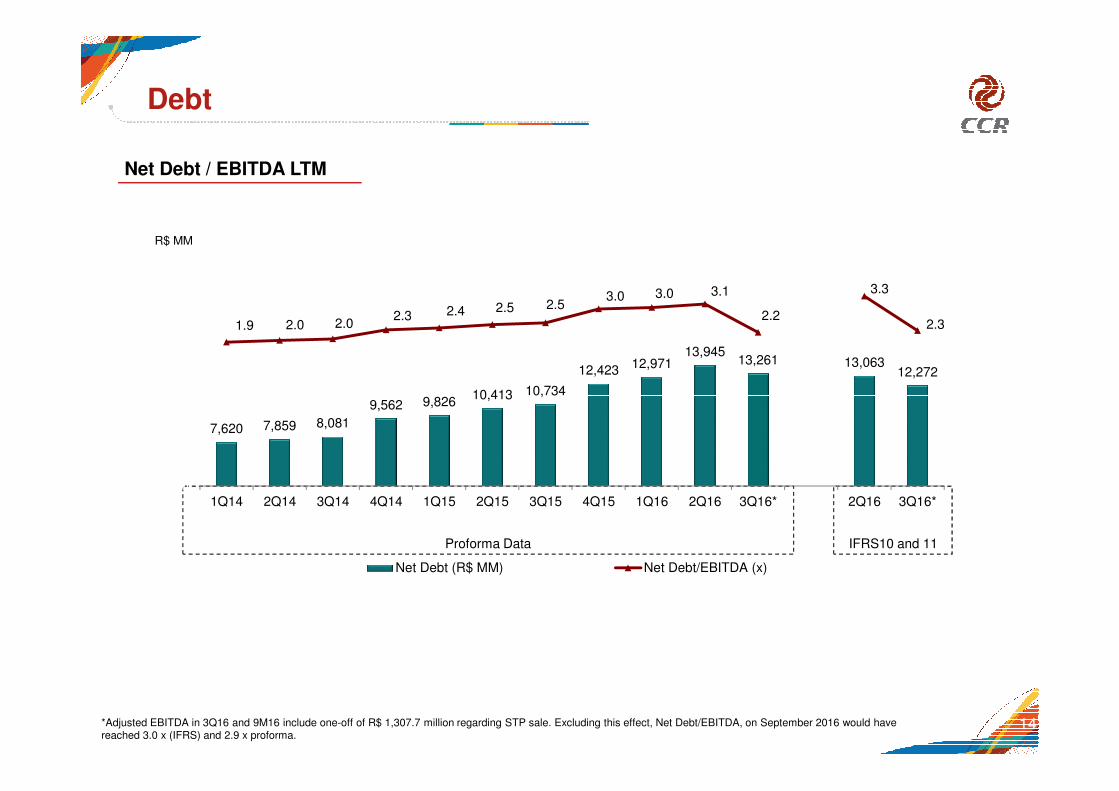
Debt
Net Debt / EBITDA LTM
R$ MM
9,82610,413 10,734
12,423 12,97113,945
13,261 13,06312,272
1.9 2.0 2.02.3 2.4 2.5 2.5
3.0 3.0 3.1
2.2
3.3
2.3
0.5
1.5
2.5
3.5
12,000
14,000
16,000
18,000
20,000
14
IFRS10 and 11Proforma Data
7,620 7,859 8,081
9,562 9,82610,413 10,734
-2.5
-1.5
-0.5
4,000
6,000
8,000
10,000
1Q14 2Q14 3Q14 4Q14 1Q15 2Q15 3Q15 4Q15 1Q16 2Q16 3Q16* 2Q16 3Q16*
Net Debt (R$ MM) Net Debt/EBITDA (x)
*Adjusted EBITDA in 3Q16 and 9M16 include one-off of R$ 1,307.7 million regarding STP sale. Excluding this effect, Net Debt/EBITDA, on September 2016 would have reached 3.0 x (IFRS) and 2.9 x proforma.
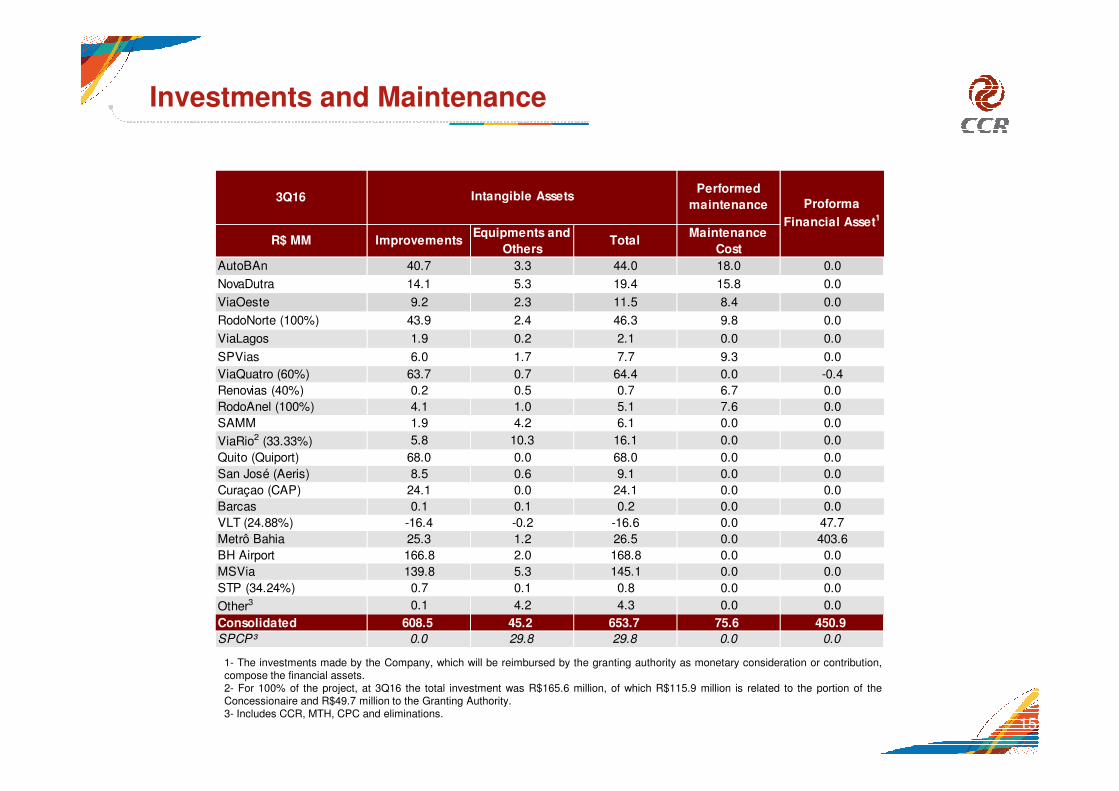
Investments and Maintenance
3Q16
AutoBAn 40.7 3.3 44.0 18.0 0.0
NovaDutra 14.1 5.3 19.4 15.8 0.0
ViaOeste 9.2 2.3 11.5 8.4 0.0
RodoNorte (100%) 43.9 2.4 46.3 9.8 0.0
ViaLagos 1.9 0.2 2.1 0.0 0.0
SPVias 6.0 1.7 7.7 9.3 0.0
ViaQuatro (60%) 63.7 0.7 64.4 0.0 -0.4
Renovias (40%) 0.2 0.5 0.7 6.7 0.0
R$ MM
Proforma
Financial Asset1
ImprovementsEquipments and
OthersTotal
Maintenance
Cost
Intangible AssetsPerformed
maintenance
15
1- The investments made by the Company, which will be reimbursed by the granting authority as monetary consideration or contribution,compose the financial assets.2- For 100% of the project, at 3Q16 the total investment was R$165.6 million, of which R$115.9 million is related to the portion of theConcessionaire and R$49.7 million to the Granting Authority.3- Includes CCR, MTH, CPC and eliminations.
Renovias (40%) 0.2 0.5 0.7 6.7 0.0
RodoAnel (100%) 4.1 1.0 5.1 7.6 0.0
SAMM 1.9 4.2 6.1 0.0 0.0
ViaRio2 (33.33%) 5.8 10.3 16.1 0.0 0.0
Quito (Quiport) 68.0 0.0 68.0 0.0 0.0
San José (Aeris) 8.5 0.6 9.1 0.0 0.0
Curaçao (CAP) 24.1 0.0 24.1 0.0 0.0
Barcas 0.1 0.1 0.2 0.0 0.0
VLT (24.88%) -16.4 -0.2 -16.6 0.0 47.7
Metrô Bahia 25.3 1.2 26.5 0.0 403.6
BH Airport 166.8 2.0 168.8 0.0 0.0
MSVia 139.8 5.3 145.1 0.0 0.0
STP (34.24%) 0.7 0.1 0.8 0.0 0.0
Other3 0.1 4.2 4.3 0.0 0.0
Consolidated 608.5 45.2 653.7 75.6 450.9
SPCP³ 0.0 29.8 29.8 0.0 0.0